Analyzing The Statistics Function For Determination Of Oil Flow Rate Equation in New Productive Zone
DOI:
https://doi.org/10.24273/jgeet.2017.2.1.34Keywords:
Oil Rate, Statistical Analysis, Coefficient Determination, Productivity Index, WatercutAbstract
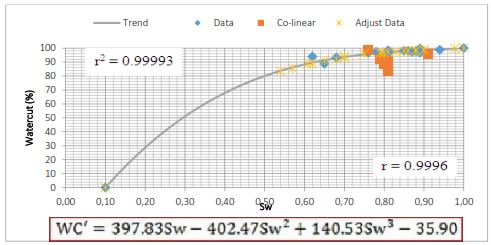
Oil rate will be decline at production time in a well. So, we have to produce in another layer who assume have a potential. Before we produce another layer who assumed have a potential, we need to predict oil rate to known how much oil gain. In this field research oil rate prediction in new productive zone was determine following by analogical data and near well references. In this method there is a difference determine of oil rate for each people. Cause of that, in this research using analysis statistical for oil rate predicting in new productive zone based on linear function for Productivity Index (PI) and polynomial function for watercut. Determining equation of linear and polynomial functions for oil rate prediction measuring by production and logging data for each well who assumed productive zone in area X field RMT. Based of statistically analysis for linear function known that coefficient determination (r2) = 0.9964 and polynomial function known that coefficient determination (r2) = 0.9993. This result indicated that we can use both of the functions for oil rate prediction in new productive zone in area X field RMT. After that, based on both of functions calculate oil rate prediction each wells in area X field RMT. So, known differences in oil rate prediction between oil rate data in area X field Y known is 28.13 BOPD or 0.78%.
Downloads
References
Ariadji, Tutuka. Radjes, M.T., 2012. Kuantifikasi Ketidakpastian Pengembangan Lapangan Secara Terintegrasi Surface dan Subsurface dengan Menggunakan Desain Eksperimenta. IATMI.
Jothikumat, E. al., 2004. AP ® Statistics.
Kelkar, 2002. Applied Geostatistics for Reservoir Characterization.pdf.
Morrison, F.A., 2015. Obtaining Uncertainty Measures on Parameters of a Polynomial Least Squares Fit with Excel ’ s LINEST 1–7.
Stroud K.A and J. Dexter, 2003. advanced-engineering-mathematics-4th.
Schmuller, Joseph. 2013. Statistical Analysis with Excel Third Edition. Hoboken, New jersey
Stanley, L.T. 1973. Practical Statistic for Petroleum engineers. Petroleum Publishing Company. Tulsa
Tang, hong. 2007. Using production Data To mitigate reservoir Connectivity uncertainty. Lousiana State university. International Petroleum Technology.
Downloads
Published
Issue
Section
License
Copyright @2019. This is an open-access article distributed under the terms of the Creative Commons Attribution-ShareAlike 4.0 International License which permits unrestricted use, distribution, and reproduction in any medium. Copyrights of all materials published in JGEET are freely available without charge to users or / institution. Users are allowed to read, download, copy, distribute, search, or link to full-text articles in this journal without asking by giving appropriate credit, provide a link to the license, and indicate if changes were made. All of the remix, transform, or build upon the material must distribute the contributions under the same license as the original.