Influence of Nitrogen Admixture on Plasma Characteristics in a dc Argon Glow Discharge and in Afterglow


1
Troitsk Institute for Innovation and Fusion Research, ul. Pushkovykh, vladenie 12, Troitsk, Moscow 108840, Russia
2
Pushkov Institute of Terrestrial Magnetism, Ionosphere and Radio Wave Propagation Russian Academy of Sciences, Kaluzhskoe Hwy 4, Troitsk, Moscow 108840, Russia
3
Department of Physics, St. Petersburg State University, Universitetskaya Emb., St. Petersburg 199034, Russia
*
Author to whom correspondence should be addressed.
Atoms 2019, 7(1), 13; https://doi.org/10.3390/atoms7010013
Submission received: 27 November 2018
/
Revised: 11 January 2019
/
Accepted: 14 January 2019
/
Published: 19 January 2019
(This article belongs to the Special Issue SPIG2018)
Abstract
:The present paper is based on the materials of the Invited Lecture presented at 29th Summer School and International Symposium on the Physics of Ionized Gases (28 August 2018–1 September 2018, Belgrade, Serbia). In the paper, the effect of nitrogen admixture on various characteristics of a dc glow discharge in argon (the volt-ampere characteristic, rate of plasma decay in the afterglow, discharge constriction condition, and formation of a partially constricted discharge) is considered.
1. Introduction
It is well-known that an addition of a molecular gas to a rare gas can significantly change characteristics of a discharge. The degree and tendency of these changes depend on the discharge conditions: the sort of a rare gas, sort and percentage of the admixture, gas pressure, etc. The argon/nitrogen gas mixture is one of the mixtures most commonly used in discharge studies. Over the past decades, many experimental and theoretical works have been carried out in which the effect of nitrogen admixture on the characteristics of an electric discharge in argon has been investigated. Various types of discharges have been studied: microwave [1,2,3], RF (magnetron, inductive, and capacitive) [4,5,6,7,8,9], surface [10], barrier [11,12,13], dc [14,15,16,17,18,19,20,21,22,23,24], and pulse-periodic [25,26,27] discharges. It is shown that nitrogen impurity can significantly change the electrical and spectral characteristics of the discharge, the plasma ion composition, and the population of argon energy levels. In this paper, we restrict ourselves to examining the effect of nitrogen admixture on the characteristics of a dc glow discharge (maintained in a tube) in argon and on the characteristics of afterglow plasma. The presented brief review is mainly based on the results of our works that have been performed in the last decade. The following effects are discussed: influence of N2 admixture on the current–voltage characteristic of a diffuse glow discharge; influence of N2 admixture on the rate of plasma decay in the afterglow; influence of N2 admixture on discharge constriction conditions and on the characteristics of constriction process; formation of partially constricted discharge in Ar:N2 mixtures at intermediate gas pressures.
2. Influence of N2 Admixture on the Current–Voltage Characteristic of a Diffuse Glow Discharge in Ar
In glow discharges in pure rare gases the main ionization process is stepwise ionization from the lower metastable states (except for the case of very low pressures and discharge currents). The effect of molecular admixture on discharge characteristics depends, in particular, on the ratio of the ionization energy of the admixture molecules and the energy of the lower metastable state of rare gas atoms. If the ionization energy of molecules is lower than the energy of atoms, then a small admixture of a molecular gas can lead to a reduction in both the breakdown voltage and the discharge operating voltage. Such a situation occurs in discharges in He and Ne (see, e.g., [28,29,30] and references therein), because the energy of the lower metastable states of He* (19.8 eV) and Ne* (16.6 eV) is higher than the ionization energy of any molecular admixture. The effect of discharge voltage and breakdown voltage reduction is partially due to the low ionization energy of molecules, but is mainly caused by the processes of the Penning ionization (He* + M → He + M+ + e, Ne* + M → Ne + M+ + e). If the percentage of admixture is relatively high, the situation is more complicated. On the one hand, the admixture can appreciably change the electron energy balance in the plasma due to losses of the electron energy going to the excitation of vibrational and lower electronic levels of molecules. This effect leads to an increase in the voltage required to sustain the discharge. On the other hand, as the admixture concentration increases, a new ionization mechanism can occur (related directly to molecules), which may lead to a reduction in the discharge voltage. In general, the resulting change in the discharge characteristics depends on the experimental conditions: the sort of rare gas, the percentage of admixture, the sort of molecular gas and the gas pressure. This section may be divided by subheadings. It should provide a concise and precise description of the experimental results, their interpretation as well as the experimental conclusions that can be drawn.
If the rare gas is argon and the molecular admixture is nitrogen, the Penning ionization mechanism is absent, since the energy of the lower metastable level of Ar atom (11.6 eV) is lower than the ionization energy of nitrogen molecules (15.58 eV). The ionization energy of Ar atoms (15.76 eV) is close to the ionization energy of nitrogen molecules, therefore nitrogen is not an easily ionized additive. Cross sections for the excitation of vibrational levels of N2 molecules by electron impact are rather high in the energy range 2–3.5 eV (i.e., at energies below the energy of the lower argon metastable state), so in Ar:N2 discharge plasma the electron energy losses due to excitation of vibrational levels can be significant. Moreover, in Ar:N2 plasma metastable states of Ar atoms are effectively quenched in collisions with N2 molecules [31]
Ar* + N2 → Ar + N2(C3Пu), rate constant = 2.9 × 10⁻¹¹ cm3 s−1,
Ar* + N2 → Ar + N2(B3Пg), rate constant = 6.0 × 10⁻¹² cm3 s−1.
In addition, it is also well known that, for the same conditions (discharge tube geometry, gas pressure, and discharge current) the electric field in the positive column (or the discharge voltage) required to sustain a dc diffuse glow discharge in pure nitrogen is much higher than that in pure argon [32].
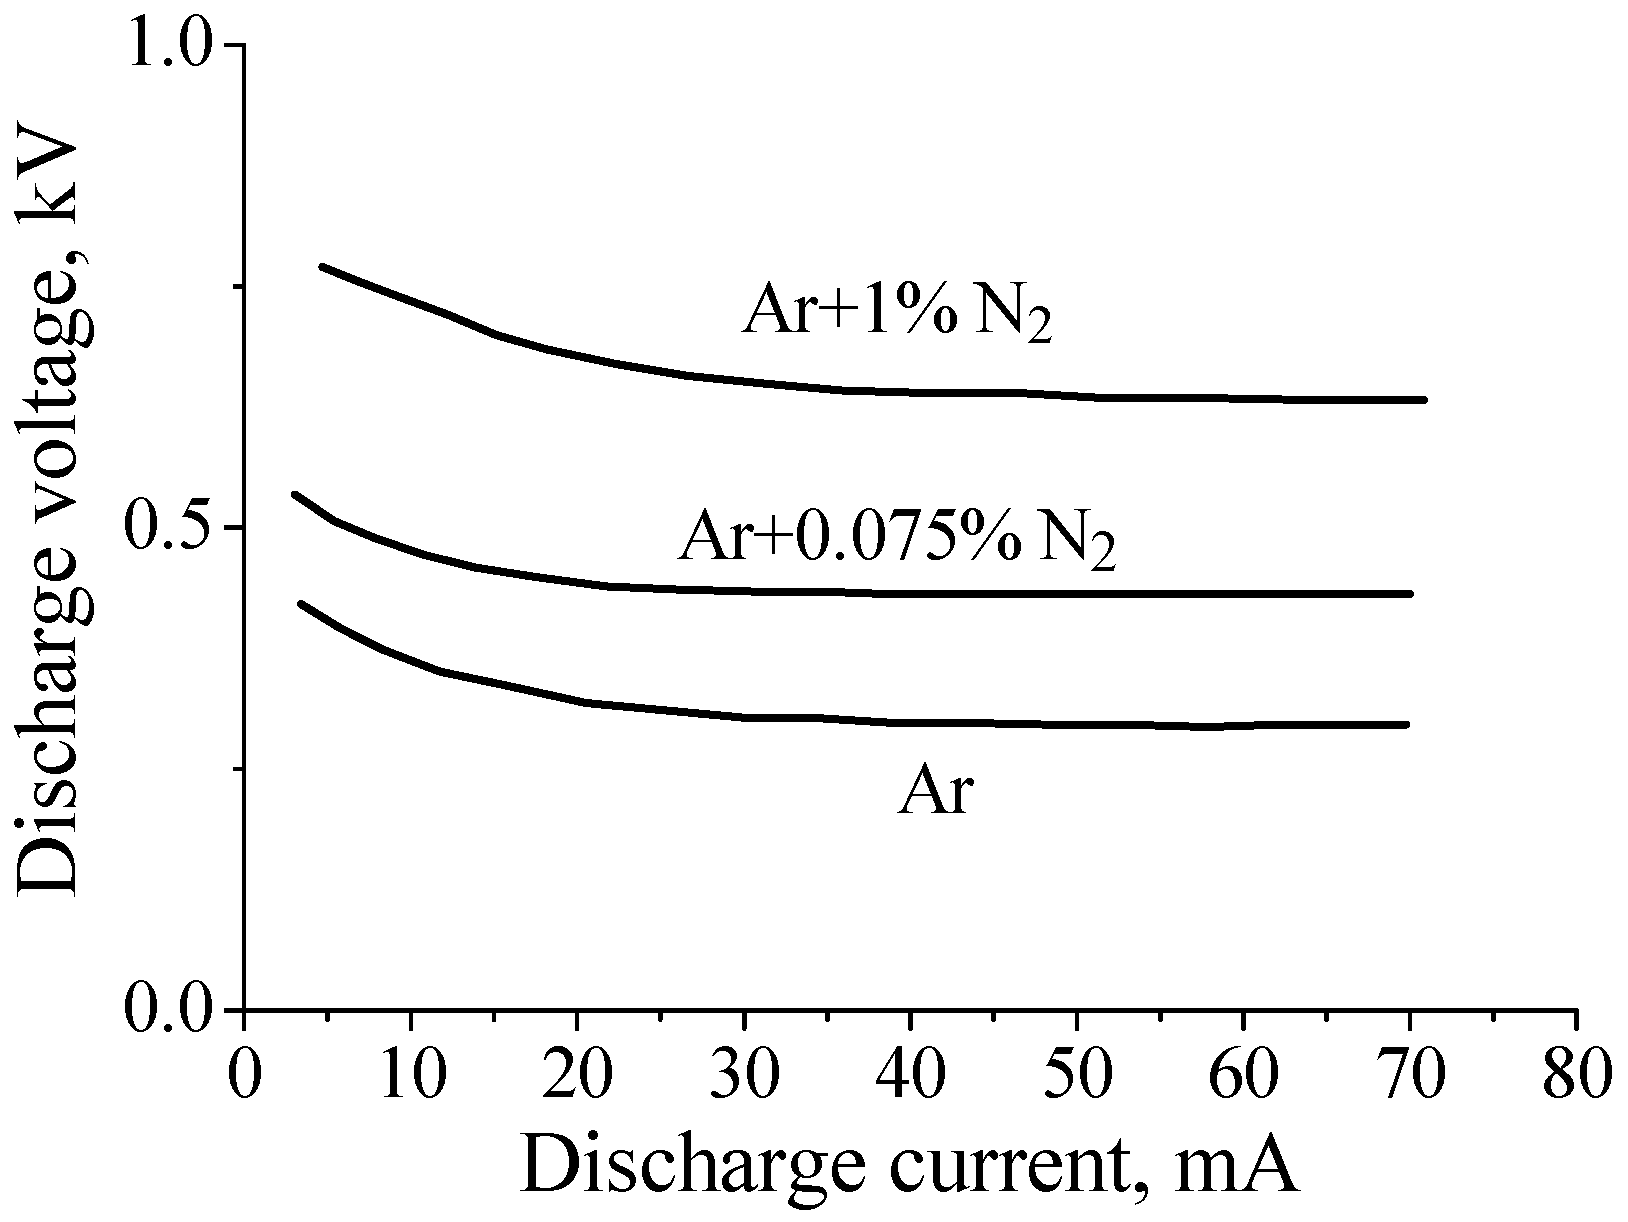
Given the above arguments, one would expect that the addition of nitrogen would lead to an increase in the electric field in the positive column of the dc discharge in argon. Indeed, this is exactly what happens at relatively low gas pressures (P~1–2 Torr for a tube radius of R~1–2 cm; see, for example, [14,33]). This is illustrated in Figure 1, which shows current–voltage characteristic of discharges in pure argon and in Ar + 0.075%N2 and Ar + 1%N2 gas mixtures at gas pressure P = 2 Torr (R = 1.4 cm, interelectrode distance ≈ 75 cm). One can see that the discharge voltage increases with a factor 2 when 1% of nitrogen is added to argon.
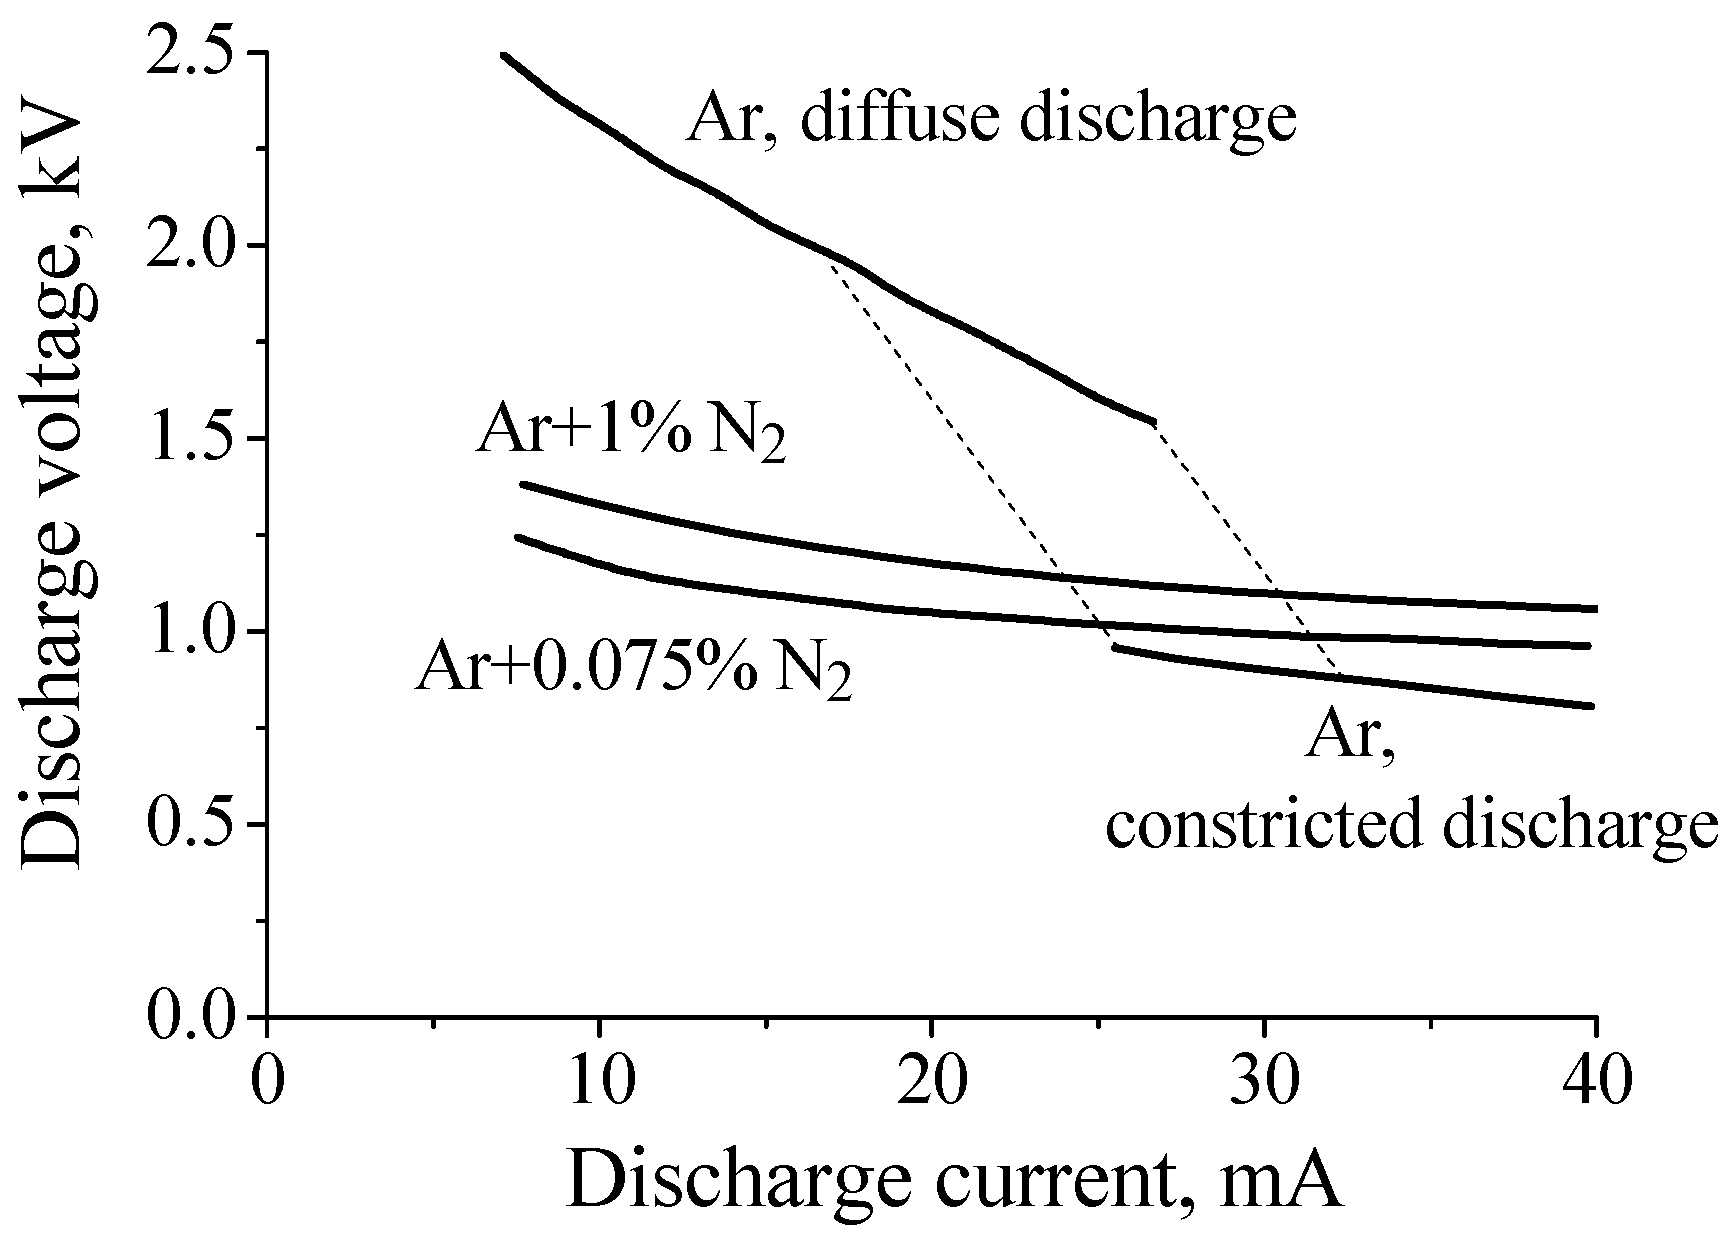
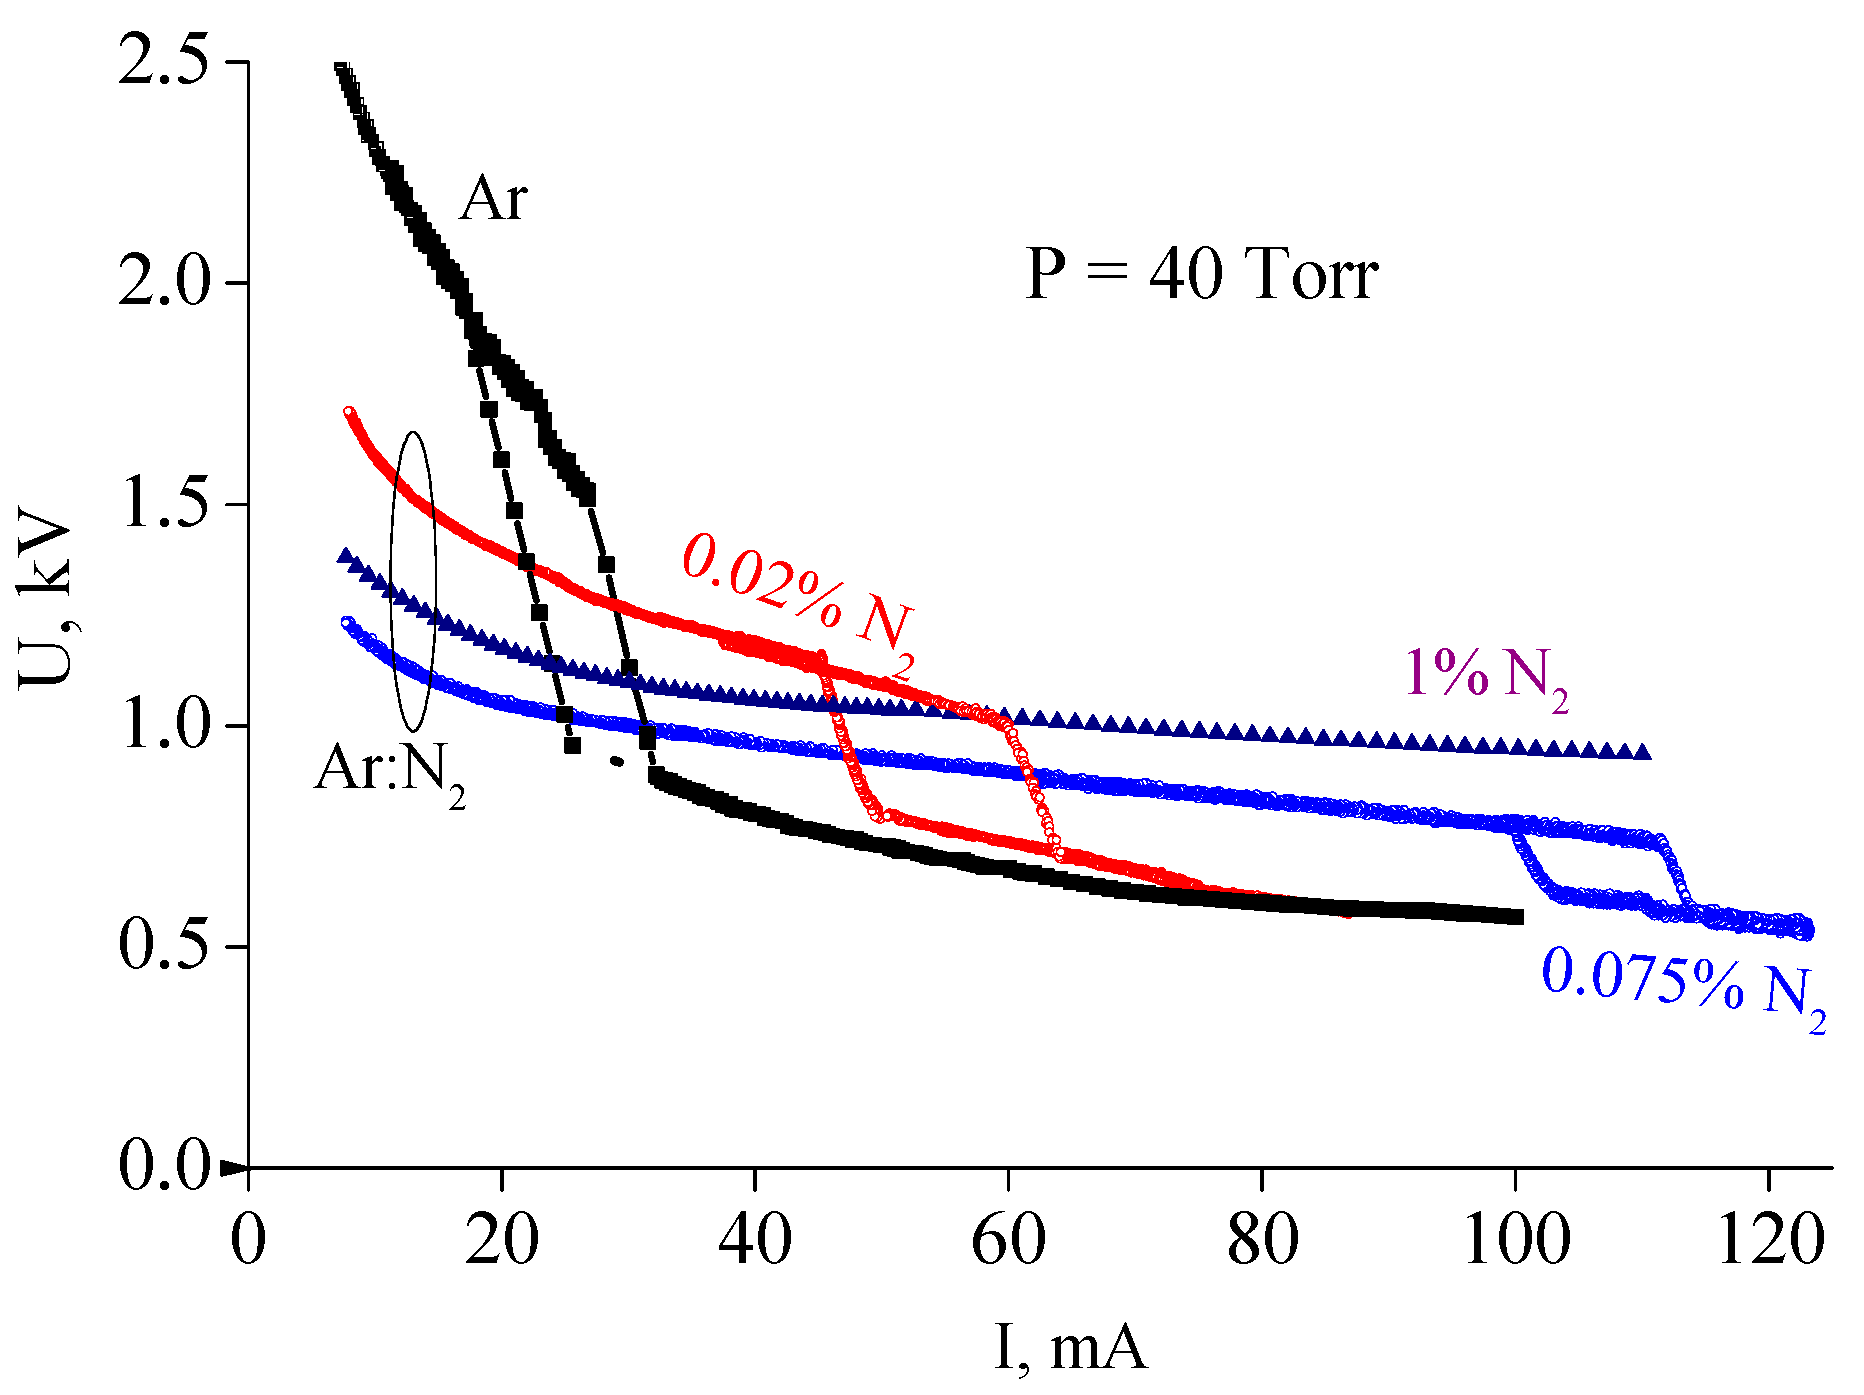
However, at intermediate pressures (tens of Torr), the situation changes dramatically. It was observed that at intermediate pressures a small additive of nitrogen to argon resulted in a noticeable decrease in the discharge voltage of a diffuse dc discharge. This effect was discovered in experiments with partially constricted discharges in Ar:N2 mixtures [15,16,34]. Figure 2 shows current–voltage characteristics measured in pure argon and in Ar + 0.75%N2 and Ar + 1%N2 gas mixtures at gas pressure P = 40 Torr (R = 1.4 cm, interelectrode distance ≈ 75 cm). As can be seen from Figure 2, the discharge voltage of a diffuse discharge decreases by 2–1.5 times (depending on discharge current value) when 0.75% of nitrogen is added to argon. In the case of 1% of nitrogen the effect is slightly less pronounced.
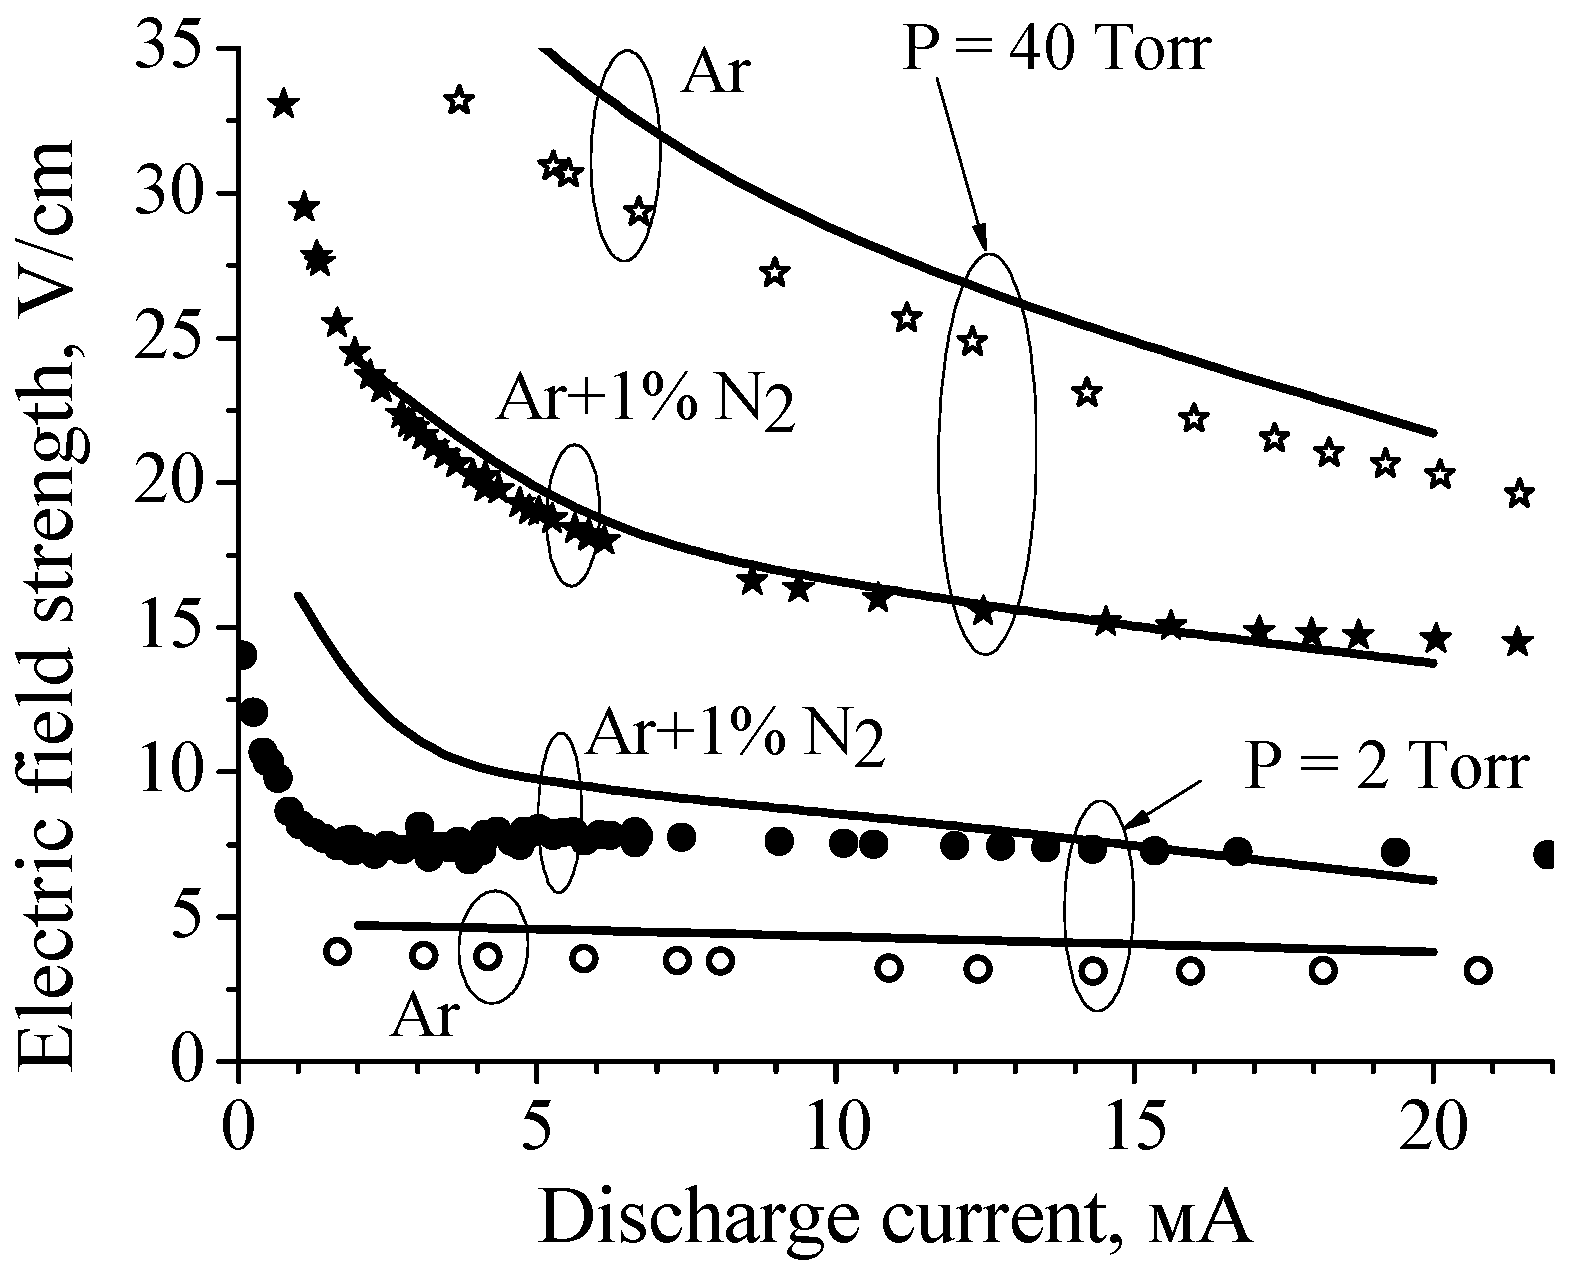
The explanation of the observed effect was given in paper [17], in which characteristics of discharge plasma in pure argon and Ar + 1%N2 mixture were studied both experimentally and theoretically (R = 1.4 cm, interelectrode distance ≈ 75 cm). To reproduce in the calculations the current–voltage characteristics measured at various pressures (2 Torr, 40 Torr and 80 Torr, see Figure 3), a rather complex (complete) zero-dimensional kinetic model was elaborated [17]. The model included kinetics of excited states of Ar atoms (four lower levels and the higher states combined into three lumped levels), the kinetics of electronic levels of N2 (N2(A), N2(B3Πg), N2(B’), N2(a’), N2(a1Πg), N2(w1Δu), and N2(C3Πu)), the vibrational kinetics of nitrogen molecules in the ground state N2(X, v) (45 vibrational levels), the kinetics of electronic states of N atoms (N(4S), N(2D), and N(2P)), and the kinetics of electrons and Ar+, , N+, , , and ions. Electron transport coefficients and rate constants for electron induced processes were calculated by solving the electron Boltzmann equation in parallel with the system of kinetic equations. Besides, the model included the equation for the electric circuit.
The gas temperature on the tube axis was evaluated from the experimental data and used in the model as a parameter. Naturally, the radial temperature profile was not taken into account within 0D model. The temperature value that was used in the calculations corresponded to the gas temperature on the tube axis. It was estimated as follows. First, for given experimental data on the electric field strength, E, and the discharge current, I, the power deposited per unit length of the discharge, Q = IE, was calculated. Then, a one-dimensional (along the tube radius) thermal balance equation with a given heat source was solved numerically and the radial profile of the gas temperature was calculated. It was assumed that the wall temperature was 300 K and the radial profile of the deposited energy was Besselian.
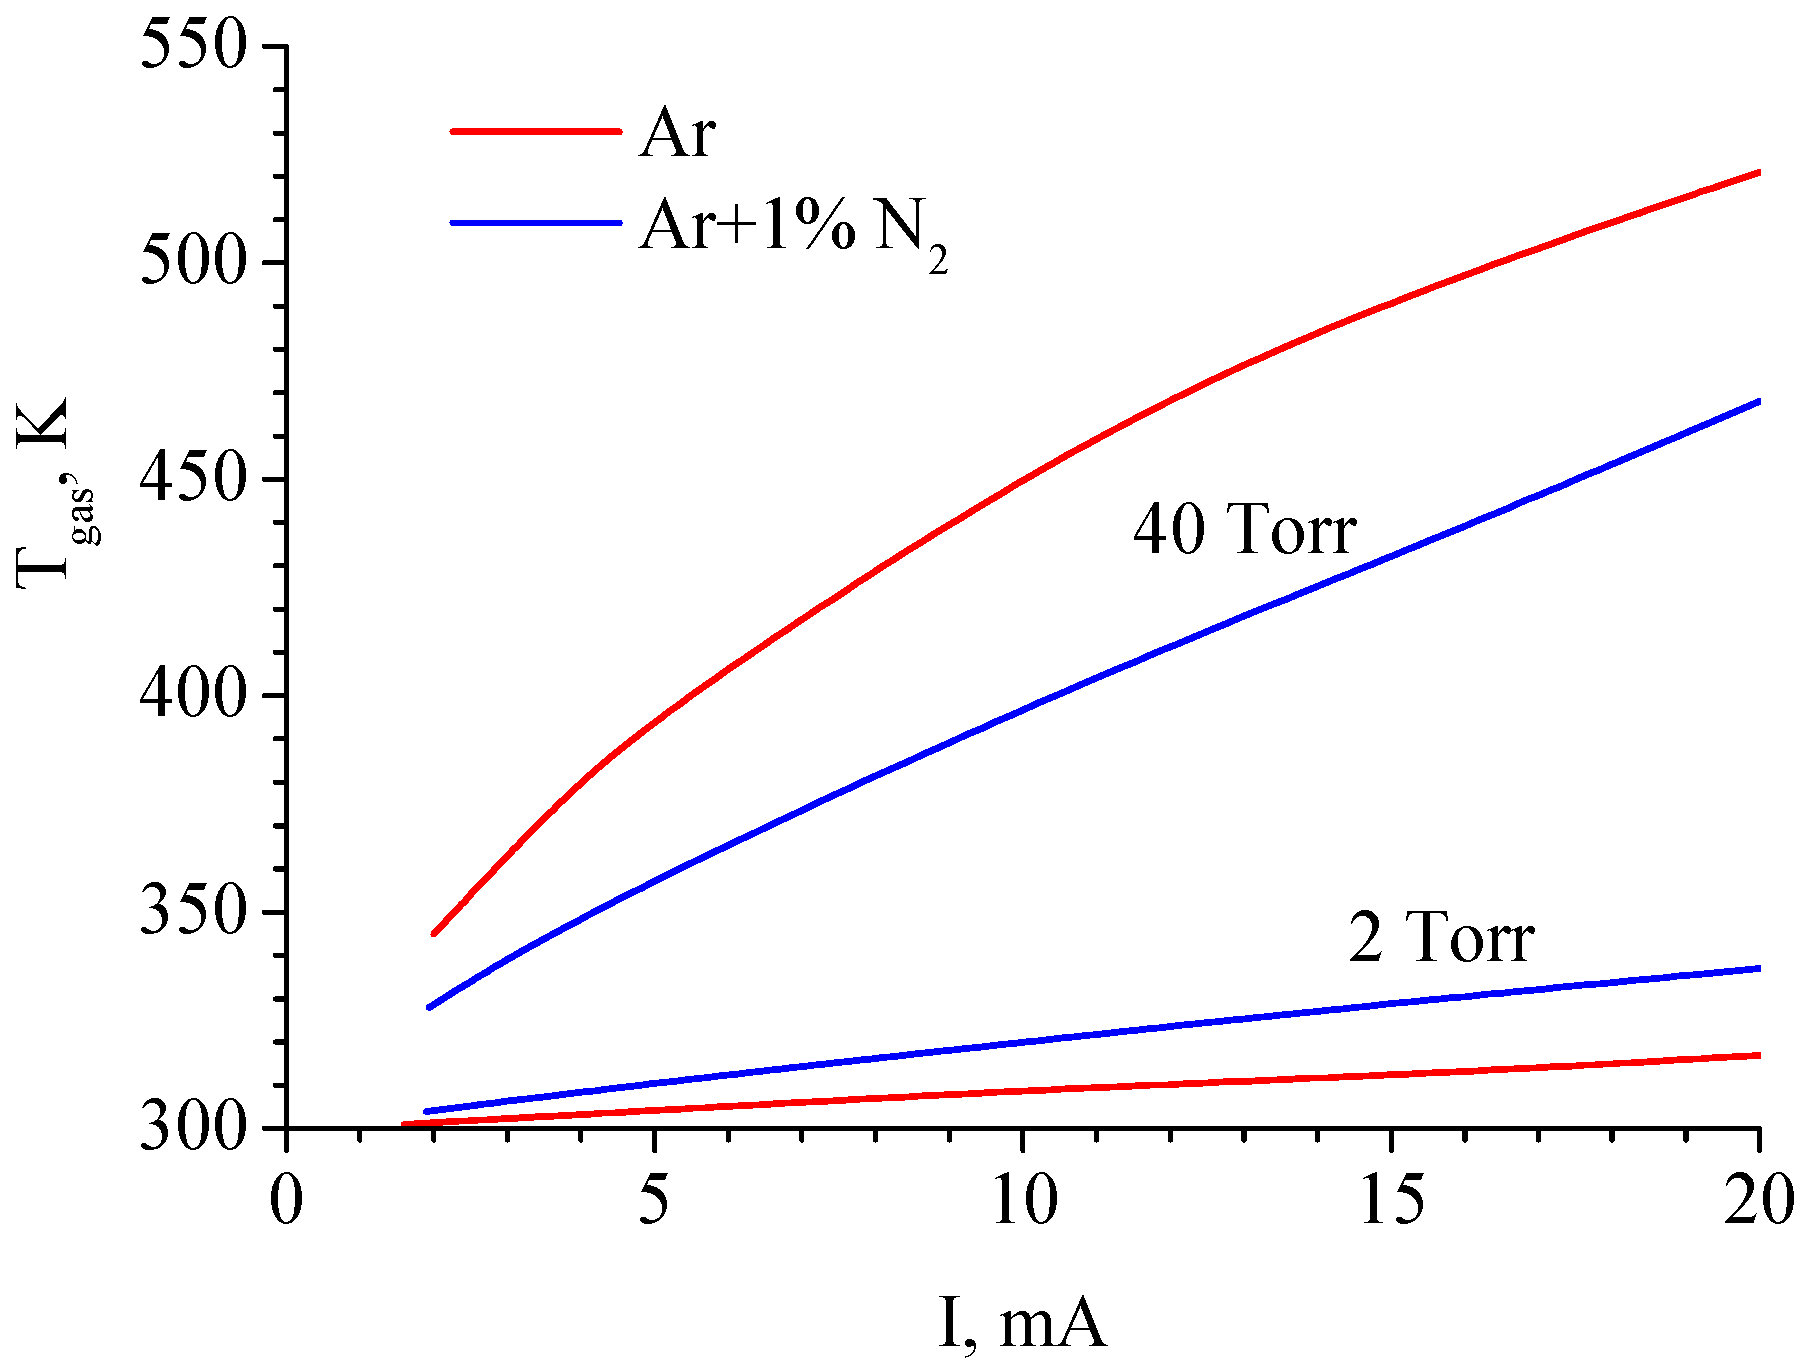
The gas temperature in a glow discharge under the conditions close to the experimental conditions [17] was measured in [35] (Ar, Ar + 1%N2, pressure of 50 Torr, tube diameter of 3.8 cm, and currents of 5–50 mA). In that paper, the gas temperature was also estimated using the procedure described above. It was shown that for the case of gas mixture the calculated values of the gas temperature agreed quite well with the measured ones. For pure Ar discharge the estimated gas temperatures were lower than measured. This was explained by the fact that, under considered conditions, the discharge in argon contracted at approximately 35 mA whereas the discharge in mixture remained diffuse even at 200 mA. In pure Ar, at discharge currents relatively close to 35 mA the radial profile of the deposited energy is noticeably narrower than the Besselian profile and, as a result, the measured temperature profile is narrower than the calculated one (for example, at I = 20 mA, see comments in [35]). Naturally, with decreasing current, the radial profile of the discharge current density becomes wider, and the theoretical estimate of the gas temperature becomes more reliable. In [17], the relatively low discharge currents were considered (≤20 mA), so it can be expected that the performed estimation of the gas temperature was rather correct.
Gas temperatures at the axis of the discharge tube calculated in pure argon and the Ar + 1%N2 mixture for P = 2 Torr and 40 Torr are shown in Figure 4. According to calculations, at P = 40 Torr, the gas temperature in pure Ar discharge is higher than in Ar + 1%N2 mixture discharge, which is consistent with experimental data [35].
The calculated E(I) characteristics were in a reasonable agreement with the experimental data (see Figure 3). As for the reduced electric field (E/N, N is the gas number density), in the case of P = 40 Torr the calculated E/N value varies from 3.9 Td to 3.3 Td (in pure Ar) and from 2.1 Td to 1.6 Td (in Ar + 1%N2 mixture) with discharge current increase from 2 mA to 20 mA. That is, in argon, the reduced electric field is two times higher than in the mixture. At low pressure (2 Torr) the E/N value varies from 7.59 Td to 6.6 Td (in pure Ar) and from 22.5 Td to 10.9 Td (in Ar + 1%N2 mixture) with discharge current increase from 2 mA to 20 mA.
The performed analysis showed that, in pure argon at intermediate pressures (e.g., 40 Torr) the stepwise ionization from the lower excited electronic states of Ar atoms was the dominant ionization process. The excitation of these states was provided by electron impact from the ground state, the energy of the lower state is about 11.6 eV. Due to ion conversion reaction the main ion in plasma was Ar2+. Losses of electrons were mainly provided by recombination with Ar2+ ions and, partially, by ambipolar diffusion.
According to calculations [17], in the Ar + 1%N2 mixture at intermediate pressures, a very effective ionization mechanism was realized. The ionization was mainly provided by processes of associative ionization of excited nitrogen atoms
and (to a lesser extent) by processes of associative ionization of excited nitrogen molecules
N(2P) + N(2D) →N2+ + e,
N(2P) + N(2P) →N2+ + e,
N2(a’1Σu−) + N2(A3Σu+) → N4+ + e.
N2(a’1Σu−) + N2(a’1Σu−) → N4+ + e.
It was also shown that, at intermediate pressures, the degree of vibrational excitation of nitrogen was very high and the processes involving vibrationally excited molecules substantially contributed to the production of N atoms
and N2(a’) molecules
N2(A3Σu) + N2(X, 14 ≤ v ≤ 19) → N2(B3Πg, v ≥ 13) + N2(X) → N + N + N2(X),
N2(X, v ≥ 16) + N2(X, v ≥ 16) → N2(a’) + N2(X, v = 0)
Due to charge transfer and ion conversion processes
the major ion in discharge appeared to be Ar2+, i.e., the same as in pure Ar discharge.
N2+ + Ar ↔ N2 + Ar+,
Ar+ + 2Ar ↔ Ar2+ + Ar,
Note that the energies of N(2D) and N(2P) states are 2.38 eV and 3.57 eV, respectively. Nitrogen atoms are produced in processes (5) with the participation of vibrationally excited molecules N2(X, 14 ≤ v ≤ 19) and electronically excited N2(A) molecules. Lower vibrational levels of N2 molecules (v ≤ 8) are excited by electron impact, the threshold for the excitation of the first vibrational level is about 0.29 eV. The upper vibrational levels are populated due to V–V exchange processes. The lower metastable state N2(A3Σu) is excited by electron impact from the ground electronic state N2(X, v), the energy of the N2(A3Σu) state is about 6.17 eV. One can see that the energies of key species, which provide ionization in Ar + 1%N2 mixture at intermediate pressures, are essentially lower than 11.6 eV. For this reason, the ionization mechanism in Ar + 1%N2 mixture is realized at E/N values noticeably lower than those in pure Ar.
Therefore, at intermediate gas pressures, the addition of N2 to Ar leads to more effective ionization processes, while the major ion in plasma and, thus, the mechanisms of electron losses remain the same. As a result, the electric field in Ar + 1%N2 discharge (and the reduced electric field) is lower than that in the pure argon discharge.
At low gas pressures (e.g., 2 Torr) the losses of electrons and ions in discharges in pure argon and in Ar + 1%N2 mixture are due to ambipolar diffusion, the rate of losses is noticeably higher than that at intermediate pressures (e.g., 40 Torr). For this reason, the reduced electric field E/N in the plasma increases [17], because, in order to preserve ionization balance in the discharge plasma, it is necessary that the ionization rate be sufficiently high. In pure argon discharge, the required rate of ionization is provided, as before, mainly by stepwise ionization processes. In Ar + 1%N2 discharge at low pressures the Processes (3) and (4) cannot provide the required rate of ionization and the ionization processes involving argon atoms (ionization by electron impact from the ground state, stepwise ionization and chemoionization) contribute substantially to electron production [17]. At that, the value of E/N (and, accordingly, the value of E) in Ar + 1%N2 mixture is appreciably higher than that in pure argon. This is related, in particular, to the fact that, in the mixture, excited argon atoms are efficiently quenched by nitrogen molecules (Processes (1) and (2)).
Naturally, the results of the calculations depend on the used values of the rate constants. The choice of the rate constants for the processes included in the model is discussed in detail in paper [17]. Here we briefly discuss the situation with rate constants for the key ionization Processes (3) and (4). The rate constant of Process (3a) is known only approximately. Estimate performed in [36] yield a value of ~10−12 cm3 s−1, which is lower by one order of magnitude than the estimate given in [37]. The rate constant used in the model [17] was taken from [36]. As for the Process (3b), it was shown in [38] that the use of this process in the model of the afterglow nitrogen plasma allows one to adequately describe specific features of the experimentally observed plasma decay dynamics. According to estimates [38], the rate constant of this process is 2 × 10⁻¹¹ cm3 s−1, it is this value that was used in the model [17]. The rate constants of Reactions (4a) and (4b) used in different studies differ by one to two orders of magnitude. In the model [17] rate constants of these processes were chosen in accordance with recommendations made in [39]: 10−11 cm3 s−1 and 5 × 10⁻¹¹ cm3 s−1, respectively.
It is also worth noting that, in contrast to argon, the addition of nitrogen (1%, for example) to neon or helium leads to an increase in the electric field (discharge voltage) in a dc glow discharge even at intermediate gas pressures. The explanation of this effect is as follows [18]. Addition of N2 to Ne also leads to changing the ionization mechanism in dc discharge plasma, ionization processes in Ne + 1%N2 discharge are similar to that in Ar + 1%N2 discharge. On the other hand, in contrast to argon atoms, the ionization energy of Ne atoms is essentially higher than that of N2 molecules, therefore the charge transfer process from N2+ ion to Ne atom is absent Ne + 1%N2 plasma. For this reason, the addition of N2 to Ne leads to the replacement of Ne2+ (major ion in plasma in pure Ne) with N4+ in Ne + 1%N2 mixture. The rate constant for the process of electron recombination with N4+ ion is one order of magnitude higher than that with Ne2+ ion. The increase in the rate of electron losses due to recombination with N4+ ions appears to be more significant factor than the new ionization mechanism, so the electric field needed for the glow discharge maintenance increases with the addition of N2 to Ne. In the case of He, the situation is similar to that in Ne.
3. Effect of Nitrogen Addition to Argon on the Rate of Plasma Decay in the Afterglow
It is shown in [17] that, in a dc glow discharge in Ar + 1%N2 mixture, a very high degree of vibrational excitation of nitrogen molecules is achieved. In the afterglow of such a discharge, the electrons gain energy in superelastic (second kind) collisions with vibrationally excited molecules, so the effective electron temperature (Te = 2/3um, where um is the mean electron energy) in the afterglow plasma can be quite high for some time (about the relaxation time of the vibrational distribution function). In turn, the high electron temperature provides the high rate of plasma decay due to ambipolar diffusion process.
It should be noted that the evolution of the electron energy distribution function (EEDF) in nitrogen afterglow plasma was a subject of a large body of studies within the past 30 years (see [40,41] and references therein). It was ascertained that, in the afterglow plasma, the EEDF form was governed by heating of electrons in superelastic collisions with vibrationally excited molecules. As a consequence, there was a strong coupling between the degree of the vibrational excitation of nitrogen and the electron temperature. The EEDF and the effective electron temperature in pure nitrogen afterglow plasma were studied in a large number of papers (see [40,41] and references therein), though there are a few works, in which similar studies were performed in gas mixtures of a rare gas with nitrogen [3,26,42,43,44].
In particular, in paper [43] the EEDF in the afterglow of a pulsed direct current discharge was measured in an Ar + 1%N2 mixture. The vibrational temperature, Tv, of N2 molecules was also experimentally estimated. The discharge was maintained in a cylindrical glass tube of 3 cm internal diameter at gas pressures of 0.5 Torr and 1 Torr. The pulse duration was 40 µs and the pulse repetition frequency was 1 kHz. The estimated vibrational temperature was about 4000–5000 K, and the electron temperature, calculated by the measured EEDFs, was varied in the range 4000–6000 K (depending on the gas pressure and the discharge current). In [3], the electron temperature in the afterglow of Ar:N2 power-pulsed microwave plasma was measured. Measurements were performed in a quartz tube with an inner radius of 0.3 cm in mixtures with N2 percentage of 1–20% at a total gas pressure of 8–30 Torr. It was shown that in mixtures with a relatively low N2 percentage (for example, 1%) the electron temperature in the afterglow plasma can be as high as 0.8 eV, which indicates that the degree of vibrational excitation of nitrogen is high.
Actually, the vibrational distribution function in the afterglow plasma (as well as in the discharge plasma) is not the Boltzmann function, i.e., is not characterized by only the temperature Tv. Calculations of the vibrational distribution function and the EEDF in the afterglow of a dc glow discharge in Ar + 1%N2 were presented in conference paper [44]. In calculations the kinetic model [17] was used, and the procedure of simulation was as follows. Firstly, time–evolution of plasma parameters was calculated up to approaching steady-state discharge conditions which were characterized by the discharge current value. Then, the applied voltage (the electric field in plasma) was switched off, and the time-variation of plasma parameters in the post-discharge was calculated. The following conditions were considered: discharge tube radius R = 1.5 cm, gas pressure P = 5 Torr, gas temperature Tgas = 350 K, discharge current I = 20 mA.
According to simulations in [44], the reduced electric field in the steady-state discharge is about E/N = 4.7 Td, the electron number density is ne = 2.0 × 1010 cm–3. Vibrational distribution functions in discharge and afterglow plasma are shown in Figure 5. The shape of the distribution function (and the degree of the vibrational excitation) can be characterized by ‘local’ vibrational temperatures, Tvi,i+1, calculated using the populations of two successive vibrational levels, i and i + 1. In the discharge plasma the vibrational temperature Tv0,1 is as high as 10,580 K and in the afterglow, it decreases down to 3300 K during 50 ms (see Table 1). Note also that Tvi,i+1 values (i = 1, 2, 3, 4, see Table 1) are noticeably higher than Tv0,1 values.
The high degree of the vibrational excitation of nitrogen molecules leads to high effective electron temperatures in the afterglow plasma (see Table 1). At t = 10 ms, the electron temperature is as high as Te ≈ 8520 K, and the further decrease in Te value is explained by the decrease in the degree of vibrational excitation of nitrogen molecules, which is illustrated in Figure 5 by growth of N2(X, v = 0) population. At that, even at t = 30 ms the electron temperature is rather high Te ≈ 6590 eV. It is worth noting that the calculated Te values agree with those measured in the afterglow of a pulsed microwave discharge in the Ar + 1%N2 mixture [3].
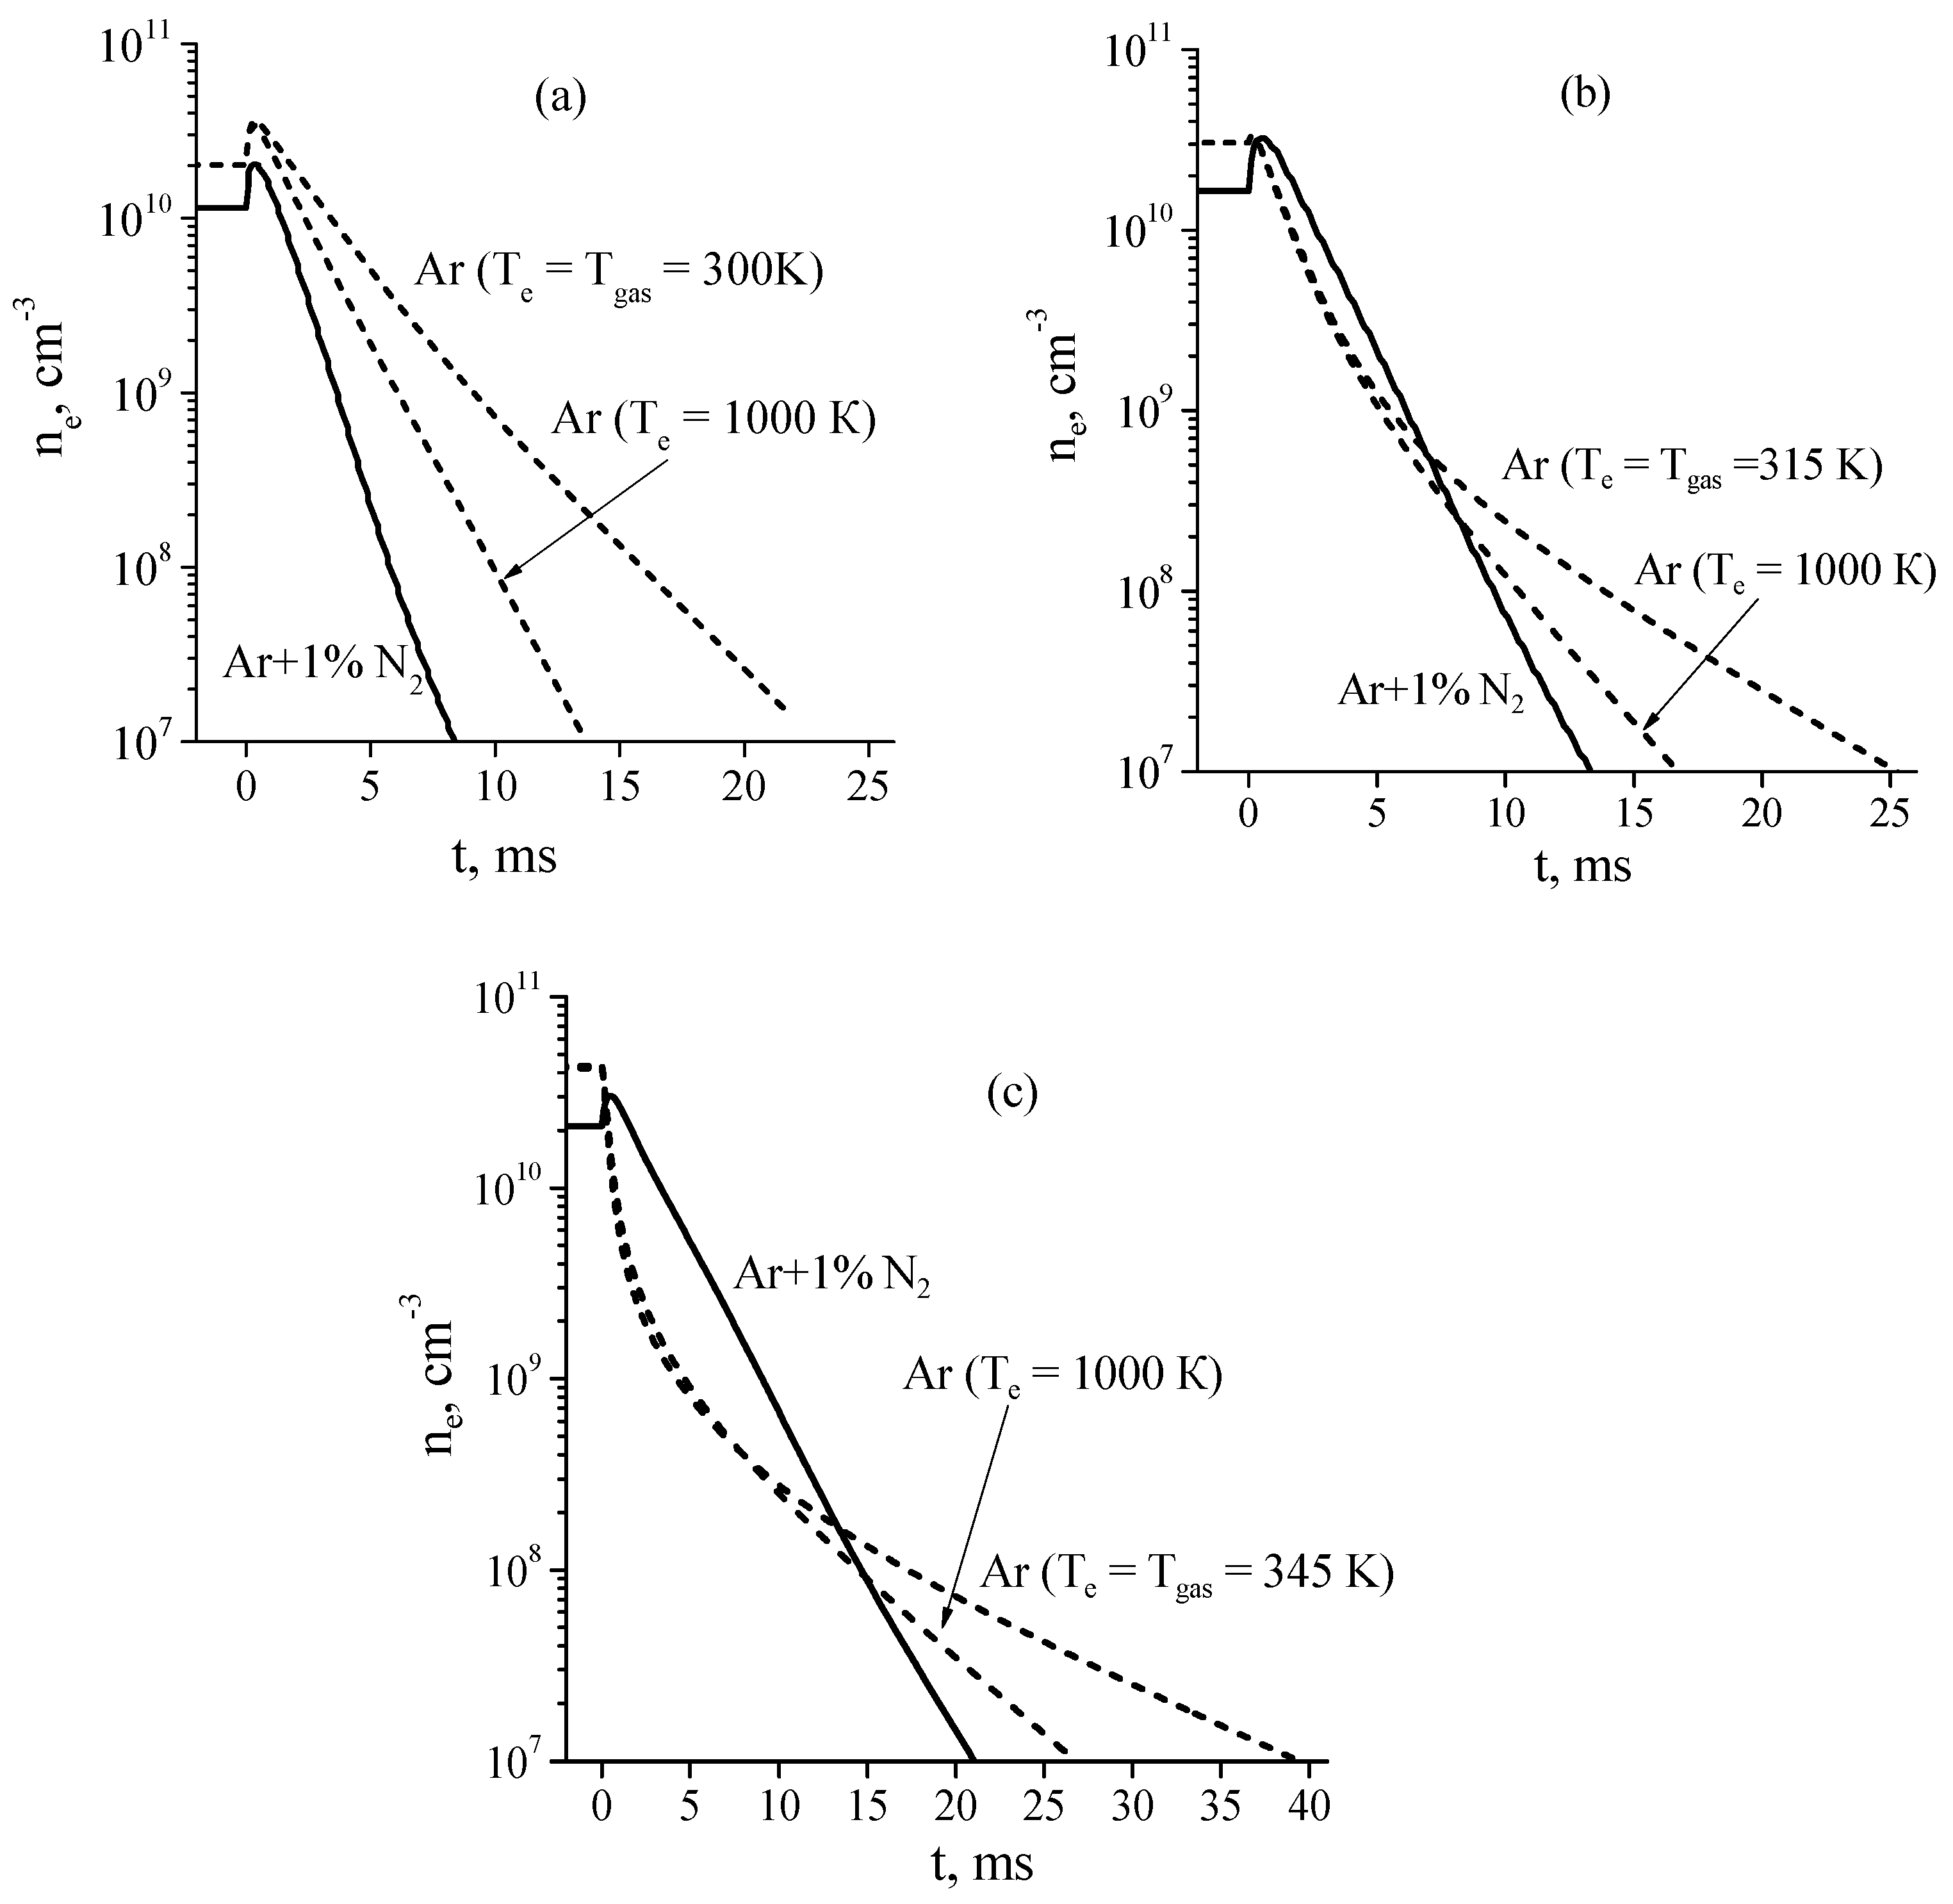
It was mentioned in [44] that, under the considered conditions, the rate of plasma decay due to ambipolar diffusion process was high because of the high electron temperature in the afterglow. However, no comparison with plasma decay rate in pure argon afterglow was performed. Such a comparison was presented in paper [26], in which the time variation of the electron concentration in the afterglow of dc glow discharges in pure Ar and Ar + 1%N2 mixture was numerically studied. As in work [44], the kinetic model [17] was used in simulations. The following conditions were considered: discharge tube radius R = 1.4 cm, gas pressures P = 1, 2, and 5 Torr, discharge currents I = 20 mA and 56 mA. Time variation of the effective electron temperature in Ar + 1%N2 afterglow calculated at fixed discharge current I = 20 mA and various gas pressures is shown in Figure 6. As follows from the calculations, the lower the gas pressure, the faster the electron temperature decreases in the discharge afterglow. In the afterglow of a discharge in pure argon, electrons are heated in superelastic collisions with electronically excited atoms. In addition, fast electrons appear in chemoionization processes Ar* + Ar* = Ar + Ar+ + e (≈7.6 eV). In [26], the electron temperature in the pure argon afterglow was not calculated because of the problem of accounting for the letter process in the Boltzmann equation. On the other hand, it was observed in [3,45] that the electron temperature in the argon afterglow plasma dropped rapidly (during ~100 μs at pressures of 6–30 Torr) to Te~1200 K. Therefore, in calculations [26], the electron energy distribution function in pure argon afterglow was assumed to be Maxwellian with the temperature Te = 1000 K or Te = Tgas (for comparison).
Electron densities in the discharge and their time evolution in the afterglow calculated for pure Ar and Ar + 1%N2 mixture at a discharge current of I = 20 mA are shown in Figure 7a–c. From Figure 7 it follows that in some cases an increase in the electron concentration is observed at the very beginning of the afterglow. According to calculations, in steady state Ar + 1%N2 discharge plasma under considered conditions, production of electrons is mainly due to associative ionization (3) and (4) and chemoionization (Ar* + Ar* → Ar+ + Ar + e) processes and losses of electrons are due to ambipolar diffusion process. After turning off the electric field, the mean electron energy instantaneously (within the model used) decreases. The decrease in the mean electron energy leads to the decrease in the rate of electron losses due to ambipolar diffusion process while the rate of electron production remains near the same, since the rates of the ionization processes mentioned above do not depend on the electron temperature. As a result, this leads to an increase in the electron concentration at the very beginning of the afterglow.
In pure Ar discharge under considered conditions losses of electrons are also due to ambipolar diffusion process. At that, at pressure 1 Torr, production of electrons is partially due to chemoionization processes. As a result, an increase in the electron concentration at the very beginning of the afterglow is observed in simulations. It follows from simulations that, with increasing pressure, the contribution of chemoionization processes to ionization rate decreases and the production of electrons is almost completely provided by stepwise ionization processes. In this case, the decrease in the electron temperature in the afterglow leads to significant decrease in the rate constant of stepwise ionization and, accordingly, the rate of electron production. As a result, the concentration of electrons monotonously decreases in the afterglow.
As Figure 7a shows, at P = 1 Torr, the afterglow plasma of a discharge in the Ar + 1%N2 mixture decays noticeably faster than that of a discharge in pure Ar. In this case, the decay of plasma (both in pure argon and in a gas mixture) is governed by the ambipolar diffusion process, the rate of which in Ar + 1%N2 afterglow plasma is high due to the high electron temperature (see Figure 6).
However, the situation changes significantly with the pressure increase. At P = 5 Torr (Figure 7c), at the beginning of the afterglow (during 1 ms) the electron density in the Ar + 1%N2 mixture decreases much slower than in pure argon, although the rate of ambipolar diffusion in argon is significantly lower. As a result, even at t = 13 ms after the end of the discharge, the electron density in Ar + 1%N2 mixture remains slightly higher than that in pure Ar. In contrast, at t > 15 ms, the electron density in pure argon is significantly higher with respect to that in Ar + 1%N2 mixture. This result is explained by two main effects [26]. The first effect consists in the following: at the beginning of the afterglow in pure argon, the Ar+ ions (dominant ions in the discharge plasma) are quickly (~0.3 ms) converted in molecular ions Ar2+ (see comments in [26]). At the beginning of the afterglow, the rate of plasma decay due to recombination of electrons with molecular ions is higher than that due to the ambipolar diffusion process. The rate of the recombination process decreases with the electron (and ion) concentration decrease, so that, at t > 15 ms, the plasma decay is governed by the ambipolar diffusion only.
The second reason is that, according to calculations, in Ar + 1%N2 afterglow the high rate of plasma decay due to ambipolar diffusion process is balanced (to a large extent) by the high rate of electron production via associative ionization of excited nitrogen atoms and molecules (3) and (4). As a result, the plasma decay rate during 1 ms after the end of the discharge is appreciably lower than in the Ar afterglow plasma.
The above described results of simulations were used in [26] for the qualitative explanation of the experimental data on the influence of a nitrogen admixture on the anomalous memory effect in the breakdown of low-pressure argon in a long discharge tube.
4. Effect of Nitrogen Addition to Argon on Discharge Constriction Conditions
The constriction of a glow discharge is the transformation of discharge from the diffuse form where plasma fills up the whole tube cross-section more or less uniformly, to the constricted one, where the plasma cord is narrower (sometimes much narrower) than the tube diameter [32]. The constriction is a result of the onset of plasma instability against transverse perturbations of the electron density (see, for example, comments in the review [46]). Depending on experimental conditions the instability can be caused by different physical mechanisms. In discharges in noble gases at intermediate pressures (except for helium), the most important is the supernlinear dependence the excitation rates of electronic states and the rate of stepwise ionization on the electron density due to the influence of electron–electron (e–e) collisions on the electron energy spectrum [46].
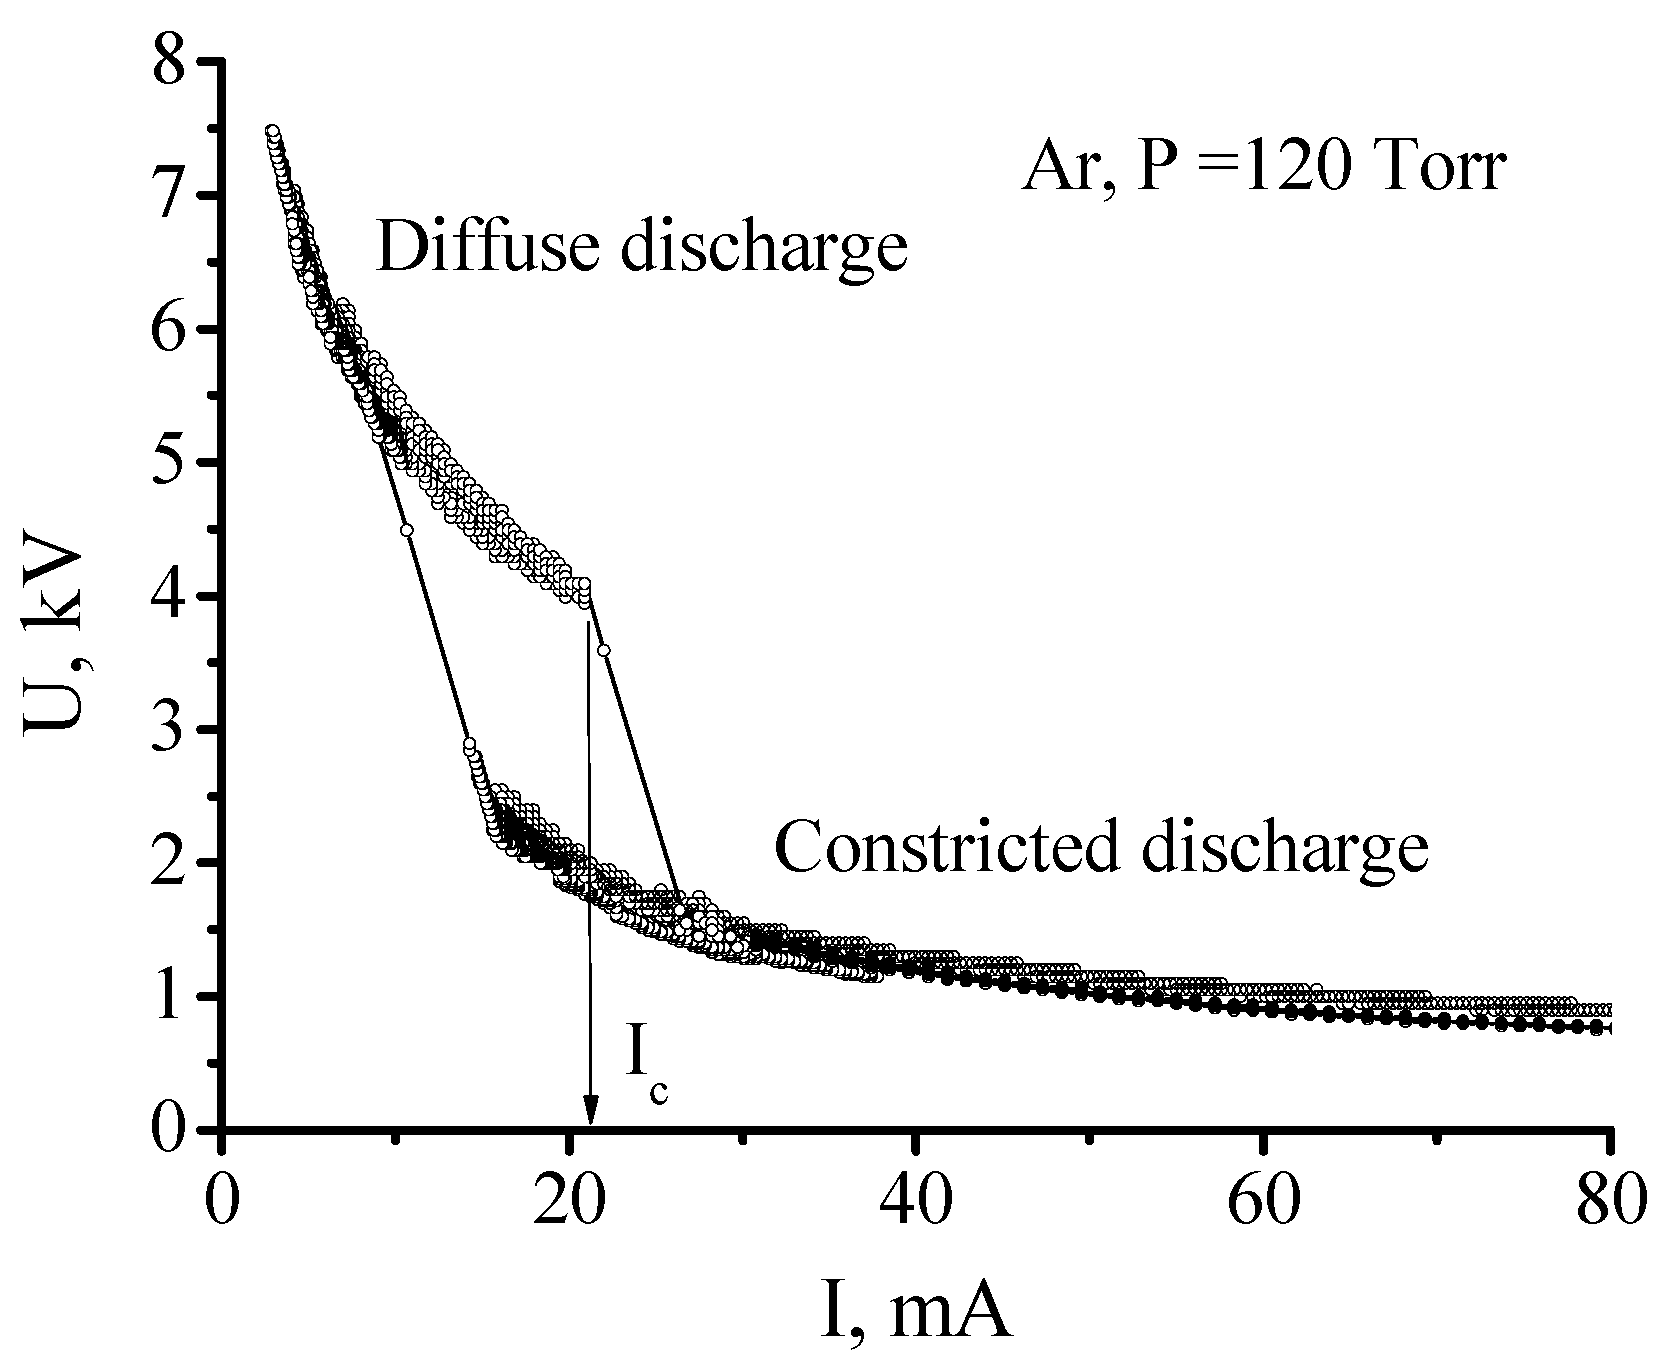
The simplest way to observe the constriction of a dc discharge is to gradually enlarge the discharge current by increasing a power supply voltage. When the current reaches some critical value IC, the discharge positive column sharply constricts to a narrow cord. Simultaneously the sharp bend of the discharge volt-amp characteristic (VAC) occurs (Figure 8). Current values for the transition from the diffuse form to the constricted one and, vice versa, from the constricted form to the diffuse differ, so that hysteresis occurs.
For the given noble gas, the IC value depends strongly on the gas pressure and discharge tube diameter. In the context of this paper, it is important that even a small nitrogen admixture to argon also affects essentially the IC and the whole VAC. This effect is illustrated by Figure 9, where the set of data for pure argon and argon with various nitrogen admixtures is depicted. The discharge tube inner diameter is 2.8 cm, the distance between electrodes is 75 cm. One can see that as low as 0.02 and 0.075 percentage of nitrogen admixtures shifts the critical current from 17 mA to 45 mA and to even 100 mA, respectively. Increasing N2 concentration up to 1 percent makes it impossible to reach constricting for the given electrical scheme. The qualitative explanation of this effect is as follows. As it was mentioned above, it is e–e collisions that provide the conditions necessary for the stepwise discharge constriction. The degree of the influence of e–e collisions on electron energy spectrum depends, in particular, on the ratio of the e–e collision frequency and the frequency of electron energy losses in elastic and inelastic collisions with atoms and molecules. The higher the percentage of nitrogen admixture, the higher the rate (frequency) of electron energy losses due to excitation of vibrational and electronic levels of nitrogen molecules and, consequently, the higher electron concentration (discharge current) is needed to provide the conditions for the discharge constriction.
As Figure 9 shows, N2 addition also diminishes drastically the discharge voltage in the diffuse region. This issue was discussed in Section 2. At the same time, VACs in the constricted region go approximately along the same curve. As is shown in [16], it can be explained by the fact that, due to a very high electron density in a constricted discharge, N2 addition has very little influence on ionization mechanism which in Ar and Ar-N2 cases is mainly stepwise ionization of Ar metastables.
5. Effect of Nitrogen Addition to Argon on the Characteristics of Constriction Process
Visually the process of discharge constriction in pure noble gases usually occurs instantly and simultaneously along the whole tube. More detailed study shows that if the current exceeds IC value only slightly, then the constriction begins near one of the electrodes and then its front propagates toward the other electrode with a finite speed. It seems that this speed can correlate with a group velocity of moving strata whose appearance accompanies the discharge constriction [46]. Experiments with Ar-N2 mixtures showed that a small nitrogen addition affected the constriction front speed.
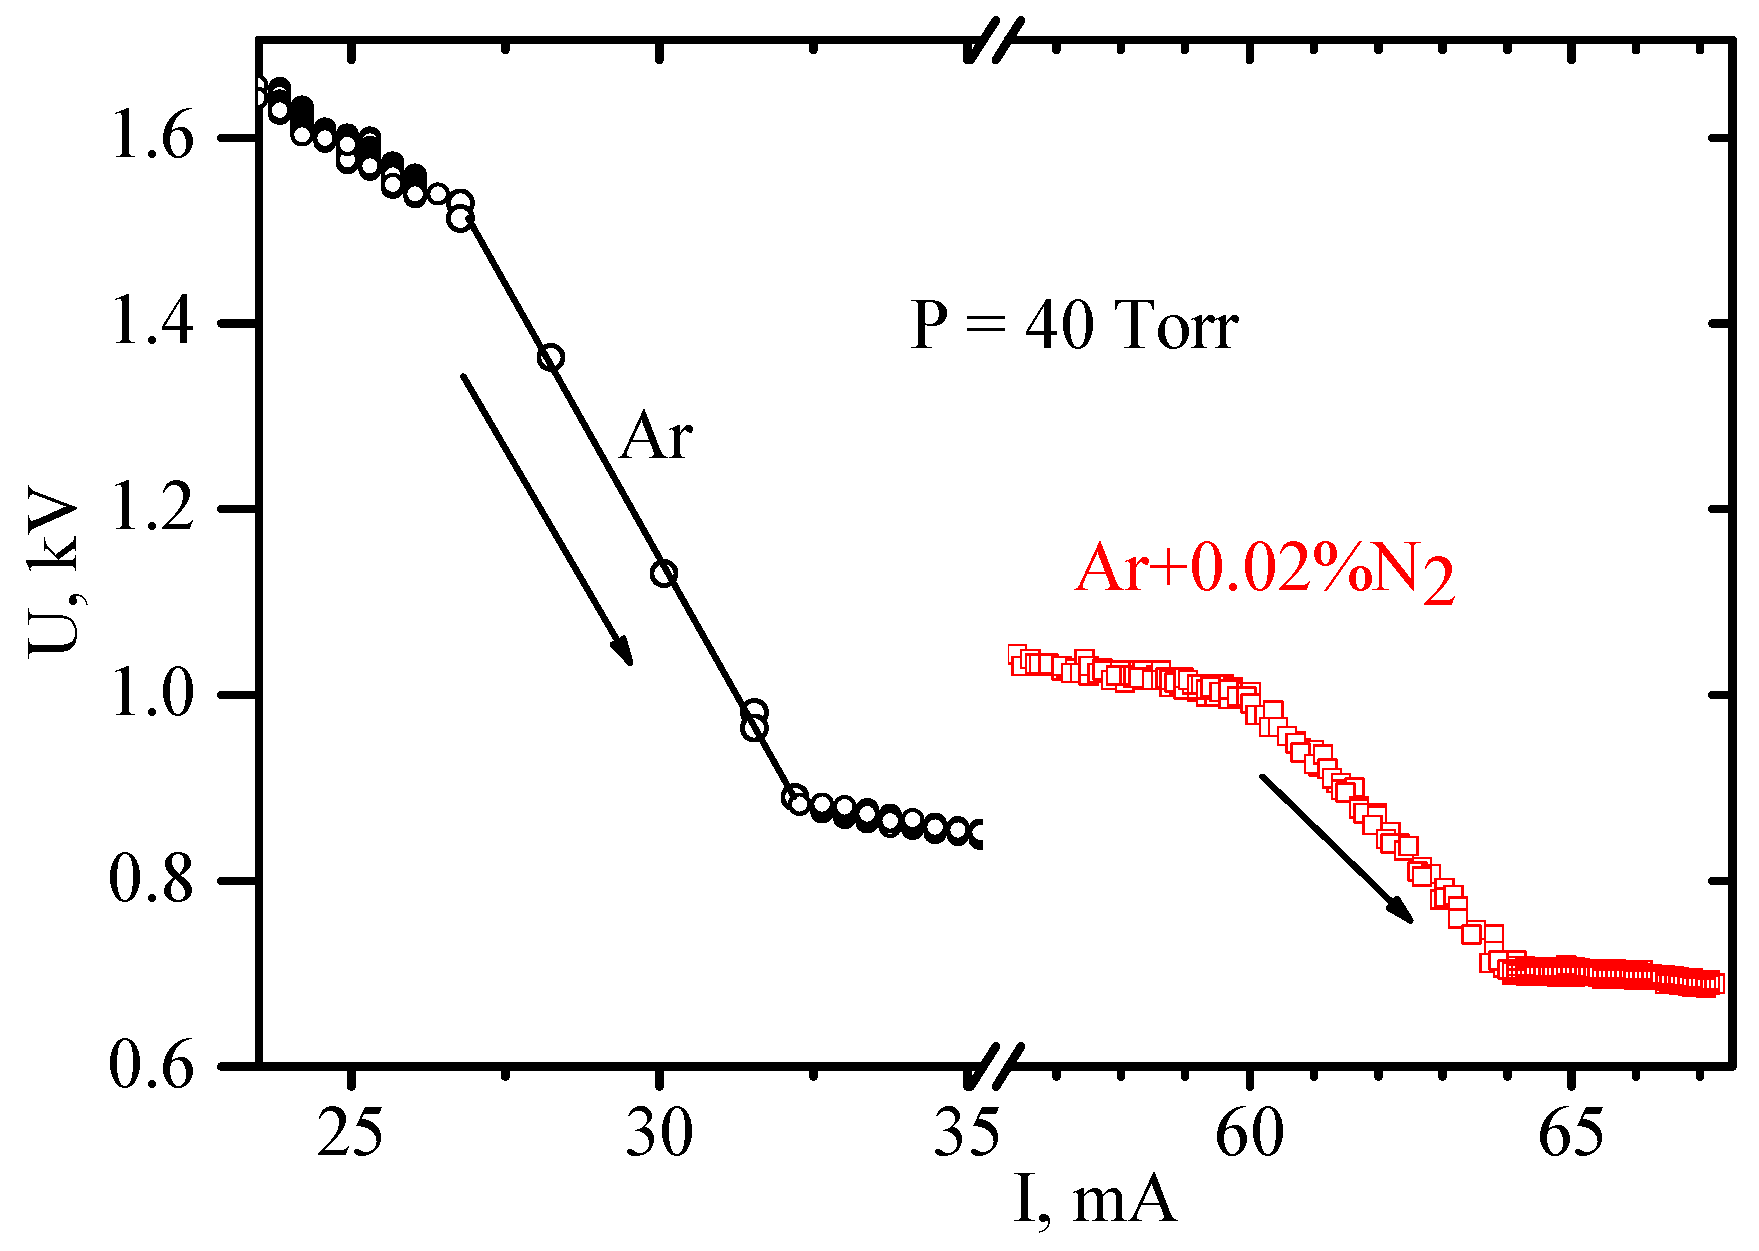
In Figure 10, small portions of VAC in the region of transition from the diffuse to constricted part are shown for pure argon and argon with 0.02 percent nitrogen admixture.
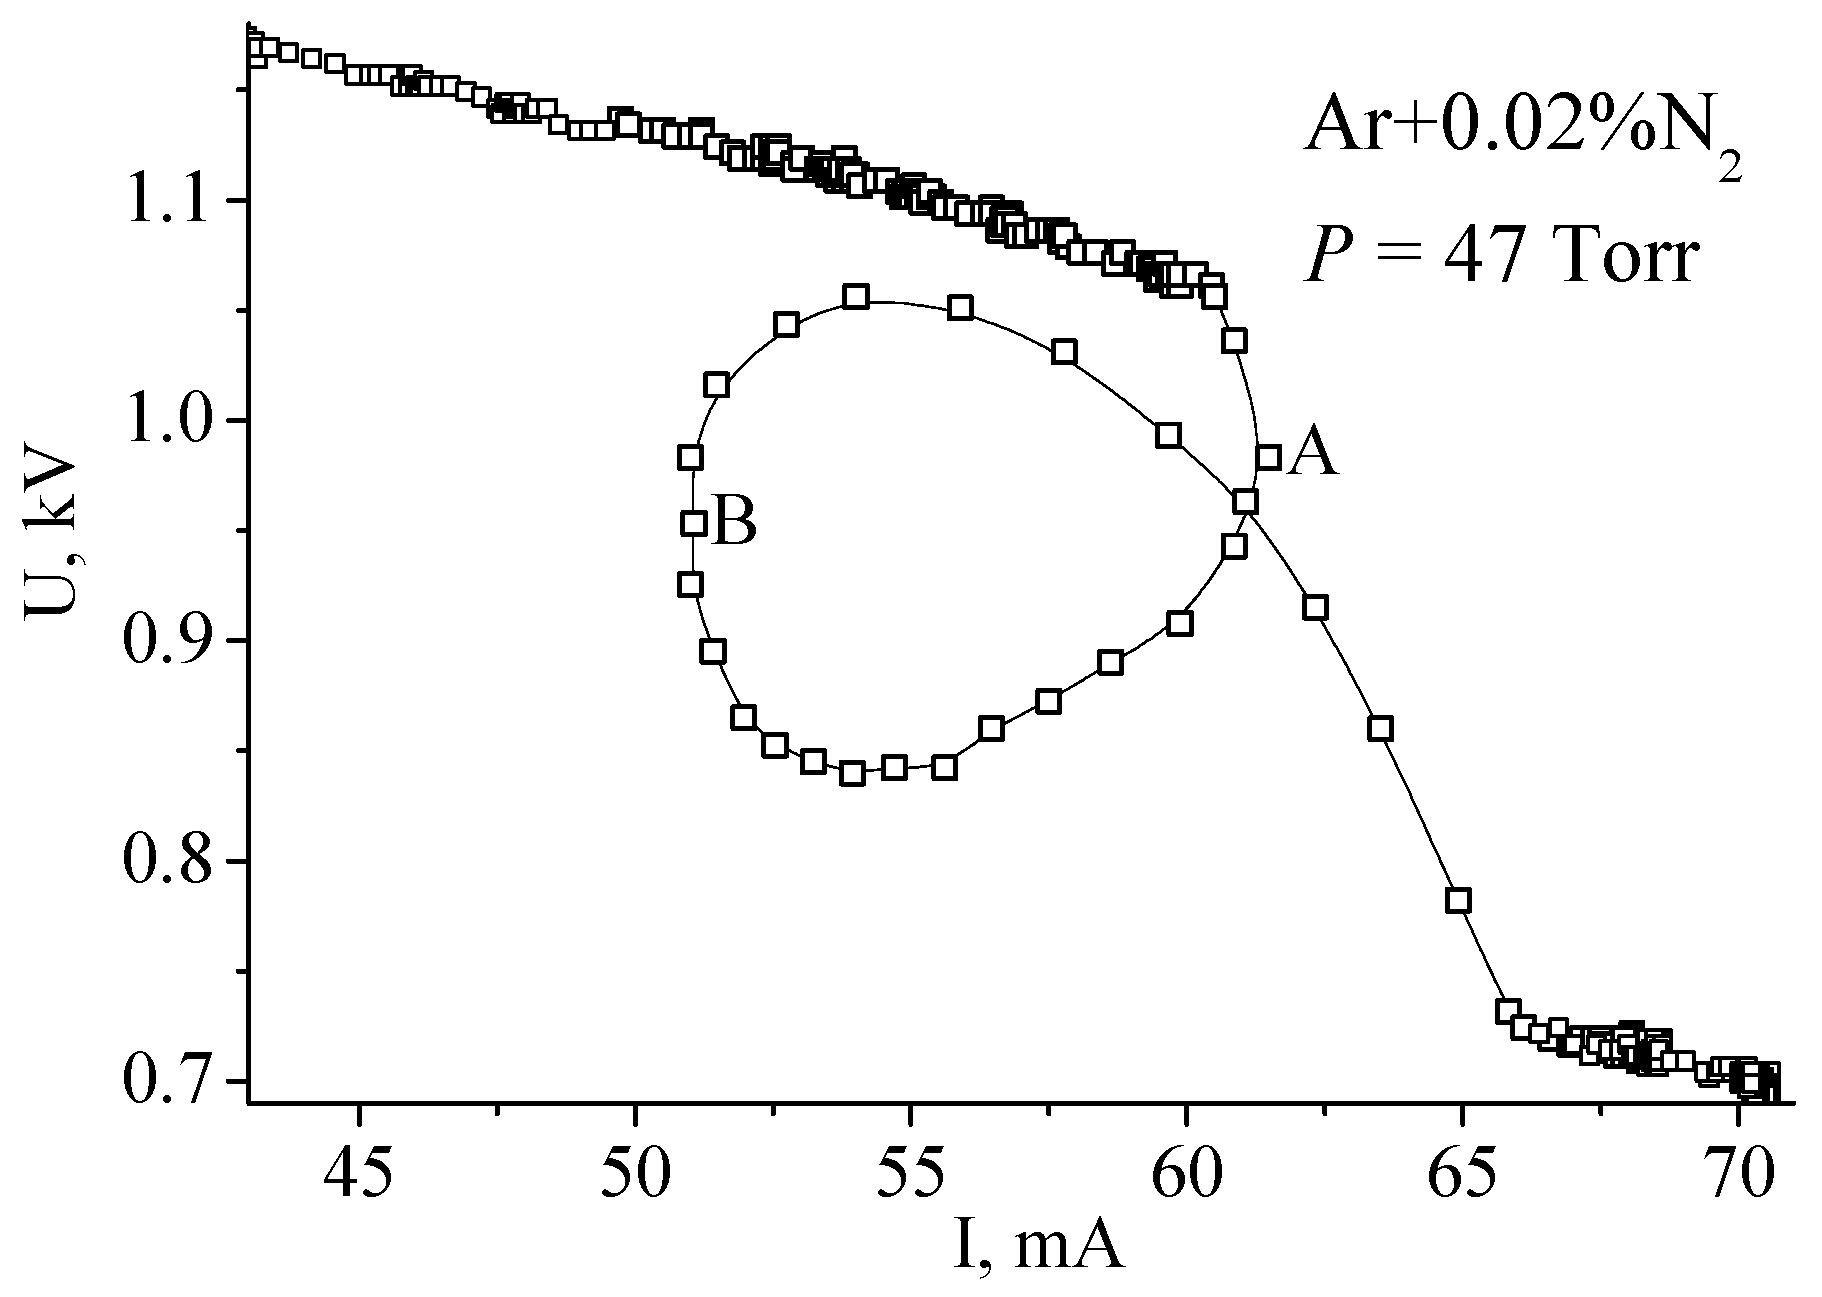
The experimental data were collected in continuous mode with a sample time of 10 ms. It can be seen that, the process of constricting in Ar lasts 50 ms, while in the mixture it lasts 600 ms. In the course of this time, the boundary between diffused and constricted parts moves from one electrode to the other. For argon, this movement is too fast to be noticeable by eye, but in the mixture, it is easily distinguished. In this case, the process is so sluggish that it is possible to interfere with its course by varying the power supply voltage and to obtain rather peculiar VACs. In Figure 11, after the beginning of the contraction the power supply voltage was first decreased (from point A to point B) and then increased (after B).
6. Formation of Partially Constricted Discharge in Ar:N2 Mixtures at Intermediate Gas Pressures
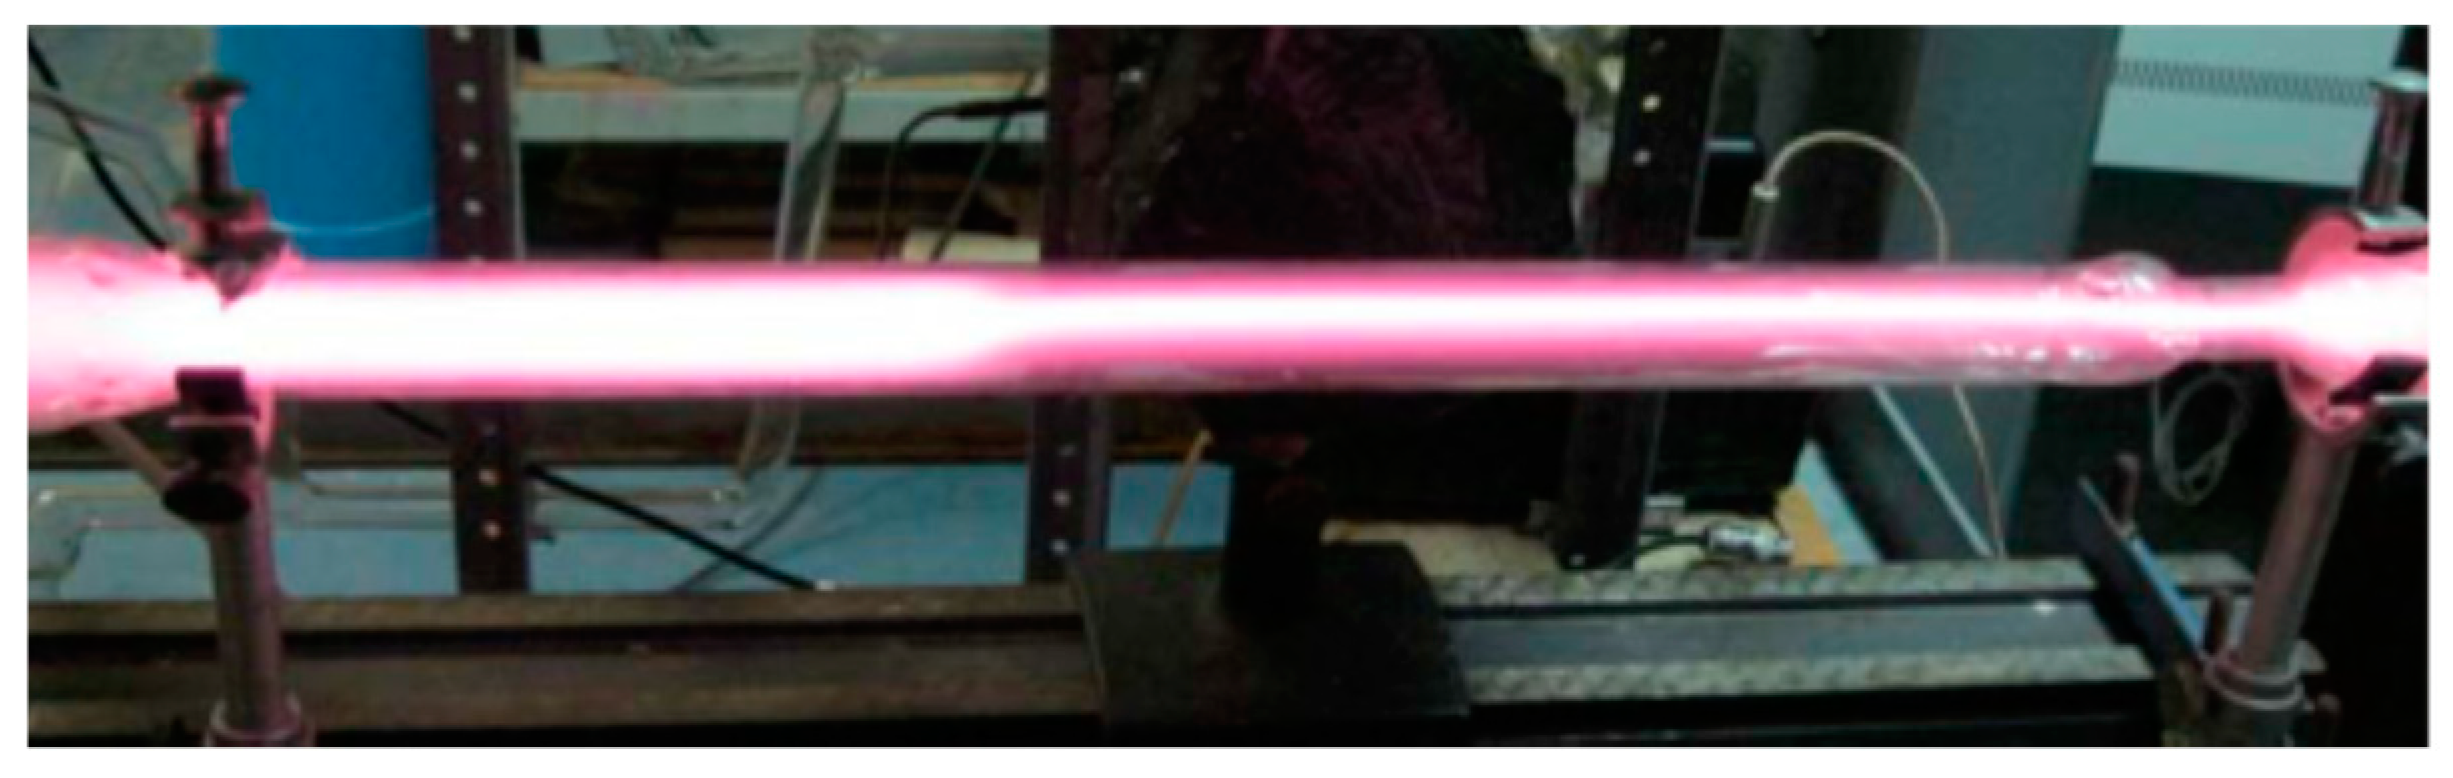
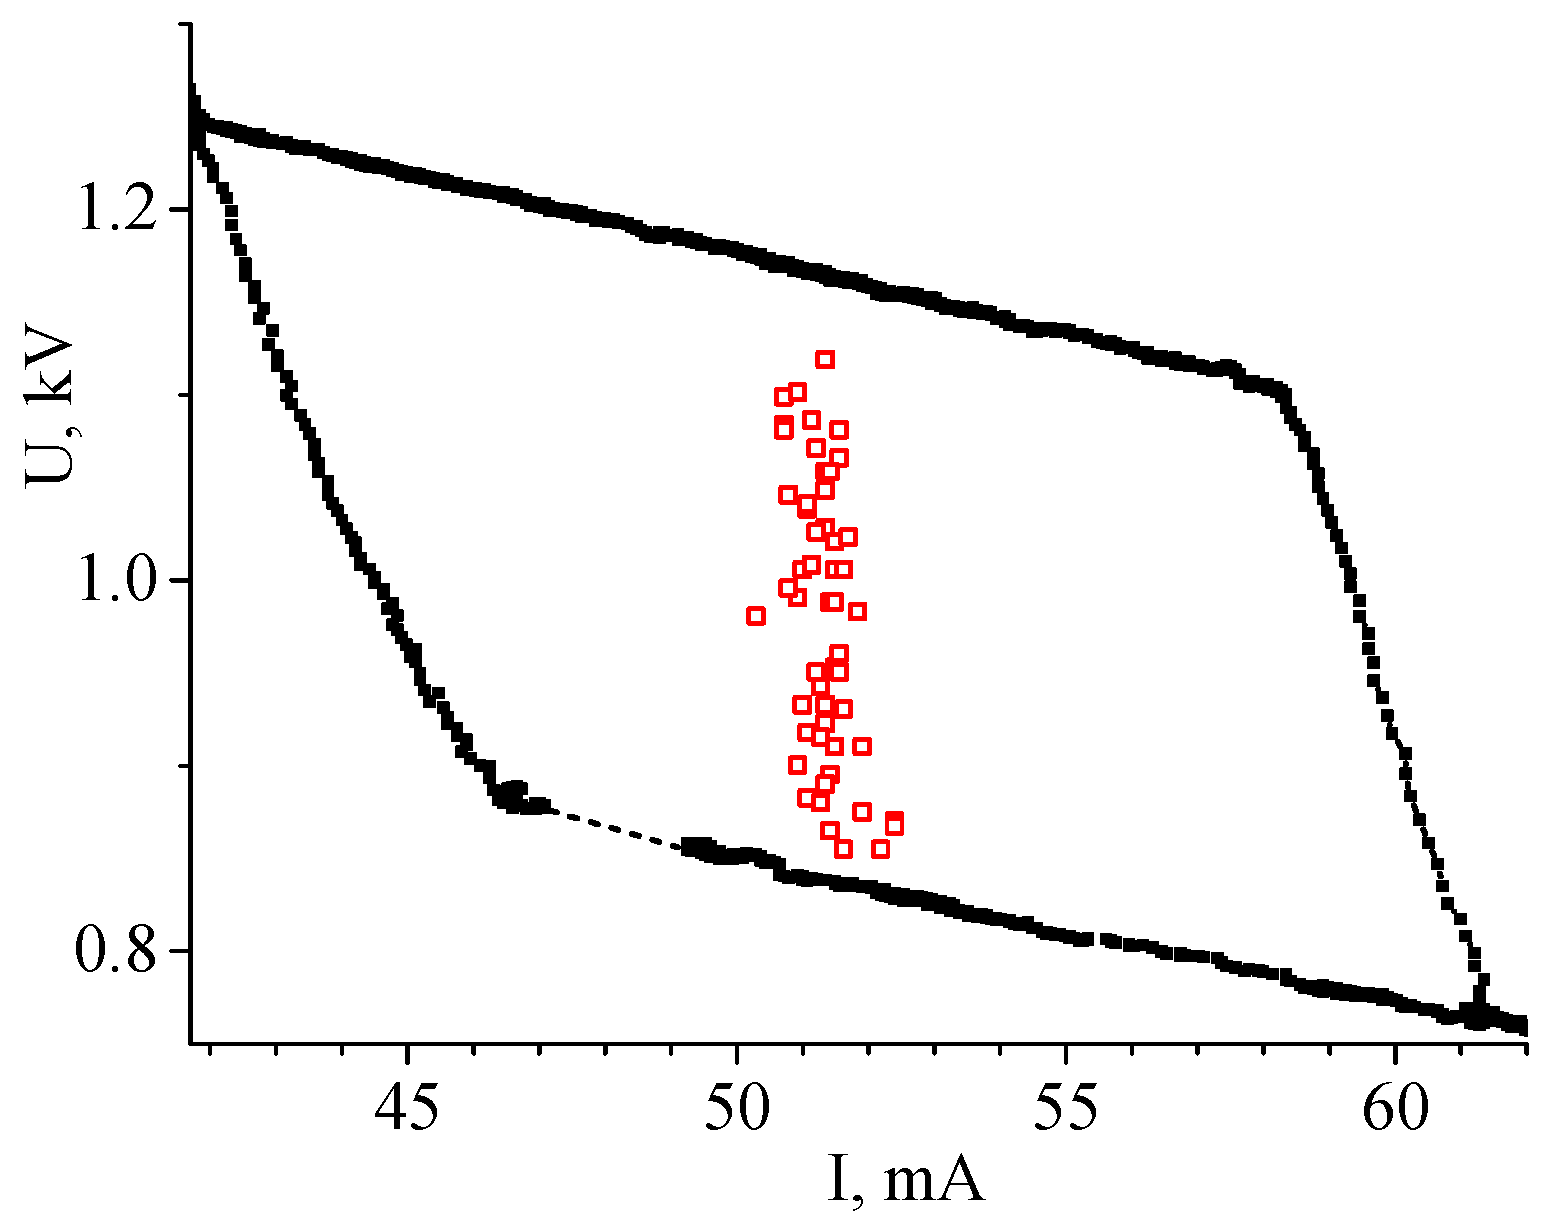
It turned out that, during the slow move of the boundary it was possible by proper variation of power supply voltage to make the movement still slower and finally to bring it to a complete stop at some position between the electrodes, i.e., to get the steady-state partially constricted discharge (PCD) (Figure 12).
The PCD, formed in such a way, was stable and could exist for a long time without any further adjustment of the electric circuit parameters. It was also shown that the point on the U-I plane which corresponded to the formed PCD was placed inside the hysteresis loop.
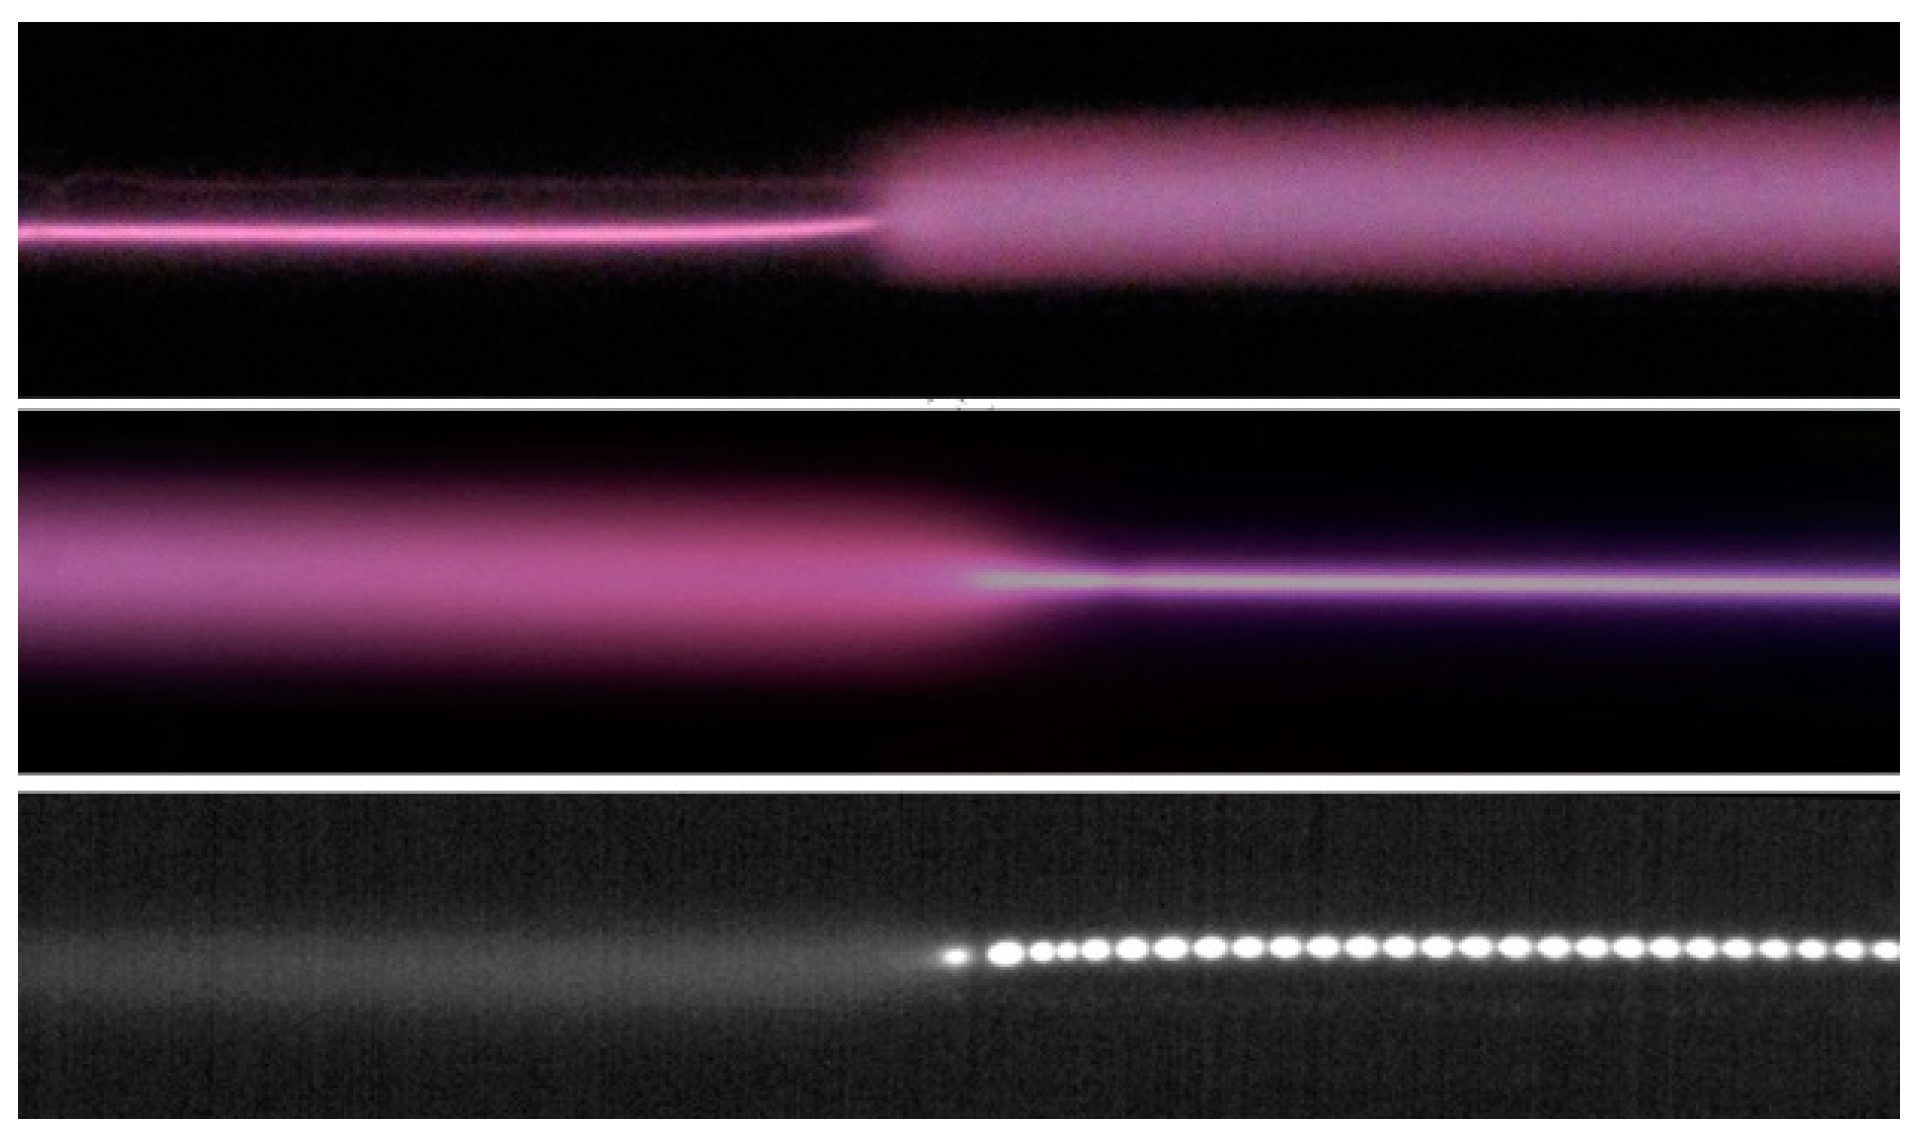
The constricted part of the positive column can touch either the cathode or the anode. For these two cases, the interface between the diffuse and constricted parts was different (Figure 12). In the former case, the boundary between two modes was sharp, while in the latter case, one mode gradually transformed into the other. Striations moving through the constricted part from the anode to the cathode were observed (Figure 13, the lower panel). The typical value of the phase velocity of striations in a constricted discharge is several tens of m/s, the phase velocity decreases with increasing discharge current [16].
The boundary between the constricted and diffuse parts could be obtained in different positions between the electrodes. It influenced the discharge voltage value but the current remained at approximately the same level (Figure 14).
At constant parameters of the electrical circuit, the discharge could remain partially constricted for a few minutes. For the constricted part adjacent to the anode, the boundary was immovable during this period. Then, probably due to small uncontrolled changes in the parameters of the plasma or of the external circuit, the boundary shifted a little. After ~10 s, a new shifting occurred with the same displacement. Furthermore, these jumps repeated with a gradually diminishing period until the discharge became homogeneous (diffuse or constricted).
If the constricted part was adjacent to the cathode, then from the very beginning, the boundary performed irregular oscillations with amplitude of a several centimeters and a period of several seconds. Such a regime could exist for a few minutes. Then, at some moment, the amplitude of oscillations enhanced and they turned into the movement of the boundary toward one of the electrodes.
7. Conclusions
The effect of nitrogen admixture on various characteristics of a dc glow discharge (maintained in a tube) in argon has been reviewed. The following specific effects have been discussed.
At relatively low pressures (several Torr) the addition of nitrogen leads to an increase in the discharge voltage, while at intermediate gas pressures (tens of Torr) it leads to a noticeable decrease in the discharge voltage. A high degree of a vibrational excitation of molecules is achieved in the Ar:N2 discharge, which provides a high electron temperature in the afterglow due to superelastic collisions of electrons with vibrationally excited molecules. This, in turn, leads to an increase in the rate of plasma decay due to ambipolar diffusion process.
At intermediate gas pressures, a stepwise transition of the positive column from the diffuse to the constricted form is observed when the discharge current exceeds a certain critical value. The addition of nitrogen to argon leads to a noticeable increase in the critical current value. According to observations, the constriction starts near one of the electrodes and then the constricted region boundary propagates towards the other electrode. For the Ar:N2 mixture, the transition time is considerably longer than in pure argon. By proper variation of power supply voltage during the transition, in the case of the Ar:N2 mixture, there can be formed a steady-state partially constricted discharge in which the constricted and diffuse forms of the positive column simultaneously exist in the discharge tube.
Author Contributions
All authors have contributed equally to the writing of this review manuscript.
Funding
This research received no external funding.
Conflicts of Interest
The authors declare no conflicts of interest.
References
- Sá, P.A.; Loureiro, J. A time-dependent analysis of the nitrogen afterglow in N2 and N2–Ar microwave discharges. J. Phys. D Appl. Phys. 1997, 30, 2320–2330. [Google Scholar] [CrossRef]
- Henriques, J.; Tatarova, E.; Dias, F.M.; Ferreira, C.M. Spatial structure of a slot-antenna excited microwave N2–Ar plasma source. J. Phys. D Appl. Phys. 2008, 103, 103304. [Google Scholar] [CrossRef]
- Hübner, S.; Carbone, E.; Palomares, J.M.; van der Mullen, J. Afterglow of argon plasmas with H2, O2, N2, and CO2 admixtures observed by Thomson scattering. Plasma Process. Polym. 2014, 11, 482–488. [Google Scholar] [CrossRef]
- Tochikubo, F.; Petrović, Z.L.; Nakano, N.; Makabe, T. Influence of Ar Metastable on the Discharge Structure in Ar and N2 Mixture in RF Discharges at 13.56 MHz. Jpn. J. Appl. Phys. 1994, 33, 4271–4275. [Google Scholar] [CrossRef]
- Fiebrandt, M.; Hillebrand, B.; Spiekermeier, S.; Bibinov, N.; Boke, M.; Awakowicz, P. Measurement of Ar resonance and metastable level number densities in argon containing plasmas. J. Phys. D Appl. Phys. 2017, 50, 355202. [Google Scholar] [CrossRef]
- Britun, N.; Gaillard, M.; Ricard, A.; Kim, Y.M.; Kim, K.S.; Han, J.G. Determination of the vibrational, rotational and electron temperatures in N2 and Ar–N2 rf discharge. J. Phys. D Appl. Phys. 2007, 40, 1022–1029. [Google Scholar] [CrossRef]
- Moravej, M.; Yang, X.; Barankin, M.; Penelon, J.; Babayan, S.E.; Hicks, R.F. Properties of an atmospheric pressure radio-frequency argon and nitrogen plasma. Plasma Sources Sci. Technol. 2006, 15, 204–210. [Google Scholar] [CrossRef]
- Fritsche, B.; Chevolleau, T.; Kourtev, J.; Kolitsch, A.; Möller, W. Plasma diagnostic of an RF magnetron Ar/N2 discharge. Vacuum 2003, 69, 139–145. [Google Scholar] [CrossRef]
- Kim, Y.-C.; Lee, H.-C.; Kim, Y.-S.; Chung, C.-W. Correlation between vibrational temperature of N2 and plasma parameters in inductively coupled Ar/N2 plasmas. Phys. Plasmas 2015, 22, 083512. [Google Scholar] [CrossRef]
- Bravo, J.A.; Rincón, R.; Muñoz, J.; Sánchez, A.; Calzada, M.D. Spectroscopic characterization of argon–nitrogen surface-wave discharges in dielectric tubes at atmospheric pressure. Plasma Chem. Plasma Process. 2015, 35, 993–1014. [Google Scholar] [CrossRef]
- Becker, K.H.; Masoud, N.M.; Martus, K.E.; Schoenbach, K.H. Electron-driven processes in high-pressure plasmas. Eur. Phys. J. D 2005, 35, 279–297. [Google Scholar] [CrossRef]
- Barkhordari, A.; Ganjovi, A.; Mirzaei, I.; Falahat, A.; Rostami Ravari, M.N. A pulsed plasma jet with the various Ar/N2 mixtures. J. Theor. Appl. Phys. 2017, 11, 301–312. [Google Scholar] [CrossRef]
- Masoud, N.; Martus, K.; Becker, K. VUV emission from a cylindrical dielectric barrier discharge in Ar and in Ar/N2 and Ar/air mixtures. J. Phys. D Appl. Phys. 2005, 38, 1674–1683. [Google Scholar] [CrossRef]
- Kimura, T.; Akatsuka, K.; Ohe, K. Experimental and theoretical investigations of DC glow discharges in argon-nitrogen mixtures. J. Phys. D Appl. Phys. 1994, 27, 1664–1671. [Google Scholar] [CrossRef]
- Ionikh, Y.Z.; Meshchanov, A.V.; Petrov, F.B.; Dyatko, N.A.; Napartovich, A.P. Partially constricted glow discharge in an argon–nitrogen mixture. Plasma Phys. Rep. 2008, 34, 867–878. [Google Scholar] [CrossRef]
- Ionikh, Y.Z.; Dyatko, N.A.; Meshchanov, A.V.; Napartovich, A.P.; Petrov, F.B. Partial constriction in a glow discharge in argon with nitrogen admixture. Plasma Sources Sci. Technol. 2012, 21, 055008. [Google Scholar] [CrossRef]
- Dyatko, N.A.; Ionikh, Y.Z.; Meshchanov, A.V.; Napartovich, A.P.; Barzilovich, K.A. Specific features of the current–voltage characteristics of diffuse glow discharges in Ar:N2 mixtures. Plasma Phys. Rep. 2010, 36, 1040–1064. [Google Scholar] [CrossRef]
- Dyatko, N.A.; Ionikh, Y.Z.; Meshchanov, A.V.; Napartovich, A.P. Theoretical and experimental study of the influence of nitrogen admixture on characteristics of dc diffuse glow discharge in rare gases at intermediate pressures. J. Phys. D Appl. Phys. 2013, 46, 355202. [Google Scholar] [CrossRef]
- Dyatko, N.A.; Ionikh, Y.Z.; Meshchanov, A.V.; Napartovich, A.P. Steady-state partially constricted glow discharge. IEEE Trans. Plasma Sci. 2011, 39, 2532–2533. [Google Scholar] [CrossRef]
- Dyatko, N.; Napartovich, A. Ionization mechanisms in Ar:N2 glow discharge at elevated pressures. In Proceedings of the 41st Plasmadynamics and Lasers Conference, Chicago, IL, USA, 28 June–1 July 2010. Paper AIAA 2010-4884. [Google Scholar]
- Isola, L.M.; López, M.; Cruceño, J.M.; Gómez, B.J. Measurement of the Ar(1sy) state densities by two OES methods in Ar–N2 discharges. Plasma Sources Sci. Technol. 2014, 23, 015014. [Google Scholar] [CrossRef]
- Reyes, P.G.; Torres, C.; Martinez, H. Electron temperature and ion density measurements in a glow discharge of an Ar–N2 mixture. Radiat. Eff. Defects Solids 2014, 169, 285–292. [Google Scholar] [CrossRef]
- Zhovtyansky, V.A.; Anisimova, O.V. Kinetis of plasma chemical reactions producing nitrogen atoms in the glow discharge in a nitrogen-argon gas mixturte. J. Phys. 2014, 59, 1155–1163. [Google Scholar]
- Bogaerts, A. Hybrid Monte Carlo-Fluid model for studying the effects of nitrogen addition to argon glow discharges. Spectrochim. Acta Part B 2009, 64, 126–140. [Google Scholar] [CrossRef]
- Jackson, G.P.; King, F.L. Probing excitation/ionization processes in millisecond-pulsed glow discharges in argon through the addition of nitrogen. Spectrochim. Acta Part B 2003, 58, 185–209. [Google Scholar] [CrossRef]
- Dyatko, N.A.; Ionikh, Y.Z.; Meshchanov, A.V.; Napartovich, A.P. Influence of a nitrogen admixture on the anomalous memory effect in the breakdown of low-pressure argon in a long discharge tube. Plasma Phys. Rep. 2018, 44, 334–344. [Google Scholar] [CrossRef]
- Qayyum, A.; Zeb, S.; Naveed, M.A.; Rehman, N.U.; Ghauri, S.A.; Zakaullah, M.J. Optical emission spectroscopy of Ar–N2 mixture plasma. J. Quant. Spectrosc. Radiat. Transf. 2007, 107, 361–371. [Google Scholar] [CrossRef]
- Martens, T.; Bogaerts, A.; Brok, W.J.M.; Dijk, J.V. The dominant role of impurities in the composition of high pressure noble gas plasmas. Appl. Phys. Lett. 2008, 92, 041504. [Google Scholar] [CrossRef] [Green Version]
- Wang, Y.; Wang, D. Influence of impurities on the uniform atmospheric-pressure discharge in helium. Phys. Plasmas 2005, 12, 023503. [Google Scholar] [CrossRef]
- Sasaki, N.; Shoji, M.; Uchida, Y. Capacitively Coupled RF Discharge Breakdown in Gas Mixtures. IEEJ Trans. Fundam. Mater. 2007, 127, 714–718. [Google Scholar] [CrossRef] [Green Version]
- Zhiglinskii, A.G. (Ed.) Handbook of Constants for Elementary Atomic, Ionic, Electronic, and Photonic Processes; PGU: St. Petersburg, Russia, 1994. (In Russian) [Google Scholar]
- Raizer, Y.P. Gas Discharge Physics; Nauka: Moscow, Russia, 1987; Springer: Berlin, Germany, 1991. [Google Scholar]
- Ionikh, Y.Z.; Chernysheva, N.V. Radiation of gas-discharge plasma in mixtures of inert and molecular gases. In Encyclopedia of Low Temperature Plasma; Fortov, V.E., Ed.; Fizmatlit: Moscow, Russia, 2008; Series B; Volume III 2, pp. 427–443. (In Russian) [Google Scholar]
- Dyatko, N.A.; Ionikh, Y.Z.; Meshchanov, A.V.; Napartovich, A.P.; Petrov, F.B. Volt-ampere characteristics of the partially constricted glow discharge in Ar:N2 mixtures. In Proceedings of the XIX European Sectional Conference on Atomic and Molecular Physics of Ionized Gases, Granada, Spain, 15–19 July 2008; Poster 2.36. Available online: http://www.escampig2008.csic.es/PosterSessions/135.pdf (accessed on 19 January 2019).
- Yalin, A.P.; Ionikh, Y.Z.; Miles, R.B. Gas temperature measurements in weakly ionized glow discharges with filtered Rayleigh scattering. Appl. Opt. 2002, 41, 3753–3762. [Google Scholar] [CrossRef]
- Mnatskanyan, A.K.; Naidis, G.V. Processes of production and loss of charged particles in a nitrogen-oxygen plasma. In Plasma Chemistry; Smirnov, B.M., Ed.; Energoatomizdat: Moscow, Russia, 1987; Volume 14, pp. 227–255. (In Russian) [Google Scholar]
- Berdichevskii, M.G.; Marusin, V.V. Nonequilibrium and ionization mechanism of the nitrogen plasma of an electrodeless RF capacitive discharge at medium pressures. Proc. Sib. Branch USSR Acad. Sci. 1979, 8, 72–79. (In Russian) [Google Scholar]
- Popov, N.A. Associative ionization reactions involving excited atoms in nitrogen plasma. Plasma Phys. Rep. 2009, 35, 436–449. [Google Scholar] [CrossRef]
- Guerra, V.; Loureiro, J. Electron and heavy particle kinetics in a low-pressure nitrogen glow discharge. Plasma Sources Sci. Technol. 1997, 6, 361–372. [Google Scholar] [CrossRef]
- Capitelli, M.; Colonna, G.; De Pascale, O.; Gorse, C.; Hassouni, K.; Longo, S. Electron energy distribution functions and second kind collisions. Plasma Sources Sci. Technol. 2009, 18, 014014. [Google Scholar] [CrossRef]
- Dyatko, N.A.; Ionikh, Y.Z.; Kolokolov, N.B.; Meshchanov, A.V.; Napartovich, A.P. Experimental and theoretical studies of the electron temperature in nitrogen afterglow. IEEE Trans. Plasma Sci. 2003, 31, 553–563. [Google Scholar] [CrossRef]
- Dilecce, G.; Benedictis, S.D. Relaxation of the electron energy in the post-discharge of an He-N2 mixture. Plasma Sources Sci. Technol. 1993, 2, 119–122. [Google Scholar] [CrossRef]
- Dyatko, N.A.; Ionikh, Y.Z.; Kolokolov, N.B.; Meshchanov, A.V.; Napartovich, A.P. Jumps and bi-stabilities in electron energy distribution in Ar–N2 post discharge plasma. J. Phys. D Appl. Phys. 2000, 33, 2010–2018. [Google Scholar] [CrossRef]
- Dyatko, N.A.; Napartovich, A.P. Theoretical Study of Plasma Parameters in a dc Glow Discharge and Postdischarge in Argon-nitrogen Mixtures. In Proceedings of the 23rd Europhysics Conference on Atomic and Molecular Physics of Ionized Gases, Bratislava, Slovakia, 12–16 July 2016; EPS ECA (Europhysics Conference Abstracts). European Physical Society: Bratislava, Slovakia, 2016; p. 109. [Google Scholar]
- Hübner, S.; Palomares, J.M.; Carbone, E.A.D.; van der Mullen, J.J.A.M. A power pulsed low-pressure argon microwave plasma investigated by Thomson scattering: Evidence for molecular assisted recombination. J. Phys. D Appl. Phys. 2012, 45, 055203. [Google Scholar] [CrossRef]
- Golubovskii, Y.B.; Nekuchaev, V.; Gorchakov, S.; Uhrlandt, D. Contraction of the positive column of discharges in noble gases. Plasma Sources Sci. Technol. 2011, 20, 053002. [Google Scholar] [CrossRef]
- Dyatko, N.A.; Ionikh, Y.Z.; Kochetov, I.V.; Marinov, D.L.; Meschanov, A.V.; Napartovich, A.P.; Petrov, F.B.; Starostin, S.A. Experimental and theoretical study of the transition between diffuse and contracted forms of the glow discharge in argon. J. Phys. D Appl. Phys. 2008, 41, 055204. [Google Scholar] [CrossRef]
Figure 1.
Current–voltage characteristic of discharges in pure argon and the Ar/N2 mixtures at gas pressure P = 2 Torr [33].
Figure 1.
Current–voltage characteristic of discharges in pure argon and the Ar/N2 mixtures at gas pressure P = 2 Torr [33].

Figure 2.
Current–voltage characteristic of discharges in pure argon and the Ar/N2 mixtures at gas pressure P = 40 Torr [15,34].

Figure 3.
Calculated (curves) and measured (symbols) dependences of the electric field in the positive columns of discharges in pure argon and the Ar + 1%N2 mixture on the discharge current for P = 2 Torr and 40 Torr [17].
Figure 3.
Calculated (curves) and measured (symbols) dependences of the electric field in the positive columns of discharges in pure argon and the Ar + 1%N2 mixture on the discharge current for P = 2 Torr and 40 Torr [17].

Figure 4.
Gas temperature at the axis of the discharge tube calculated in pure argon and the Ar + 1%N2 mixture for P = 2 Torr and 40 Torr [17].
Figure 4.
Gas temperature at the axis of the discharge tube calculated in pure argon and the Ar + 1%N2 mixture for P = 2 Torr and 40 Torr [17].

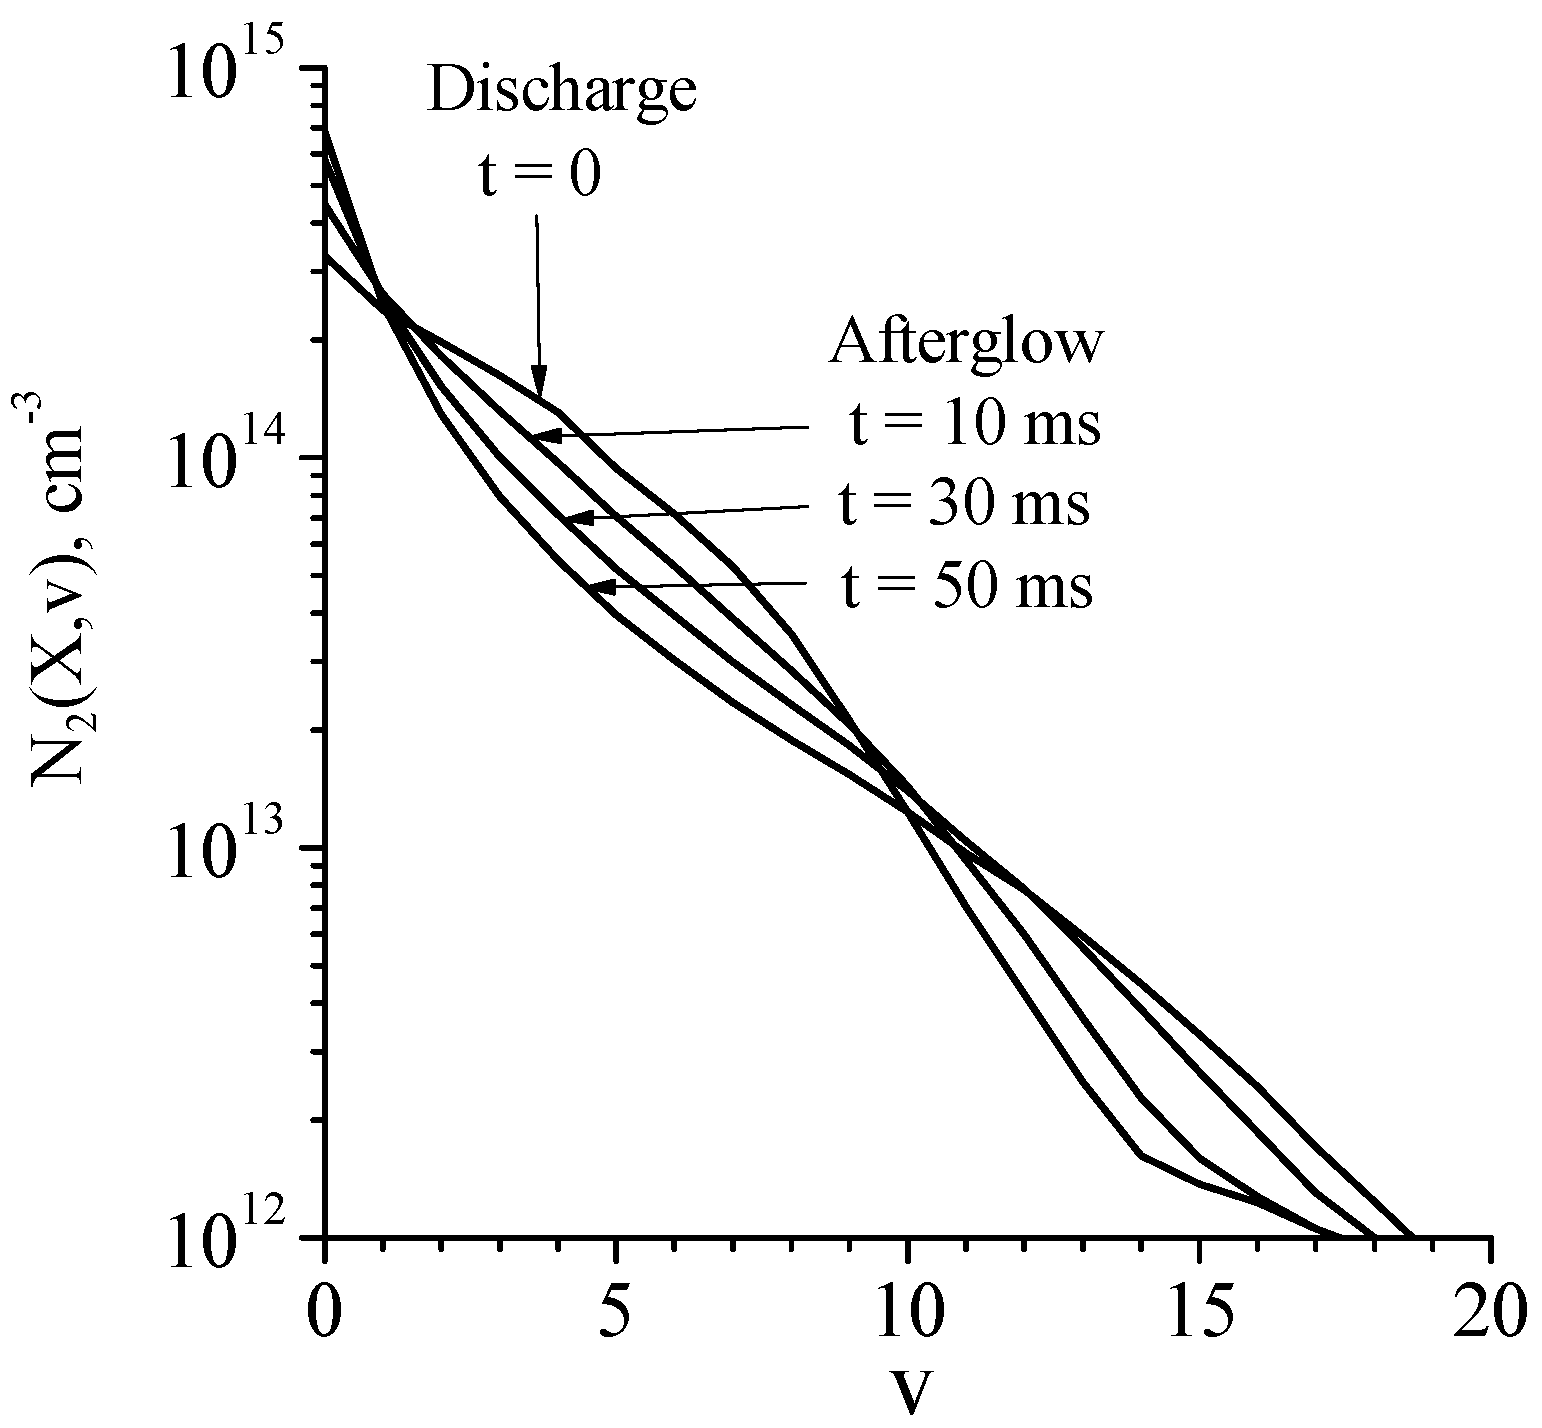
Figure 5.
Ar + 1%N2. Calculated vibrational distribution functions in discharge (t = 0) and afterglow (t > 0) plasma [44]. R = 1.5 cm, P = 5 Torr, Tgas = 350 K, I = 20 mA.
Figure 5.
Ar + 1%N2. Calculated vibrational distribution functions in discharge (t = 0) and afterglow (t > 0) plasma [44]. R = 1.5 cm, P = 5 Torr, Tgas = 350 K, I = 20 mA.

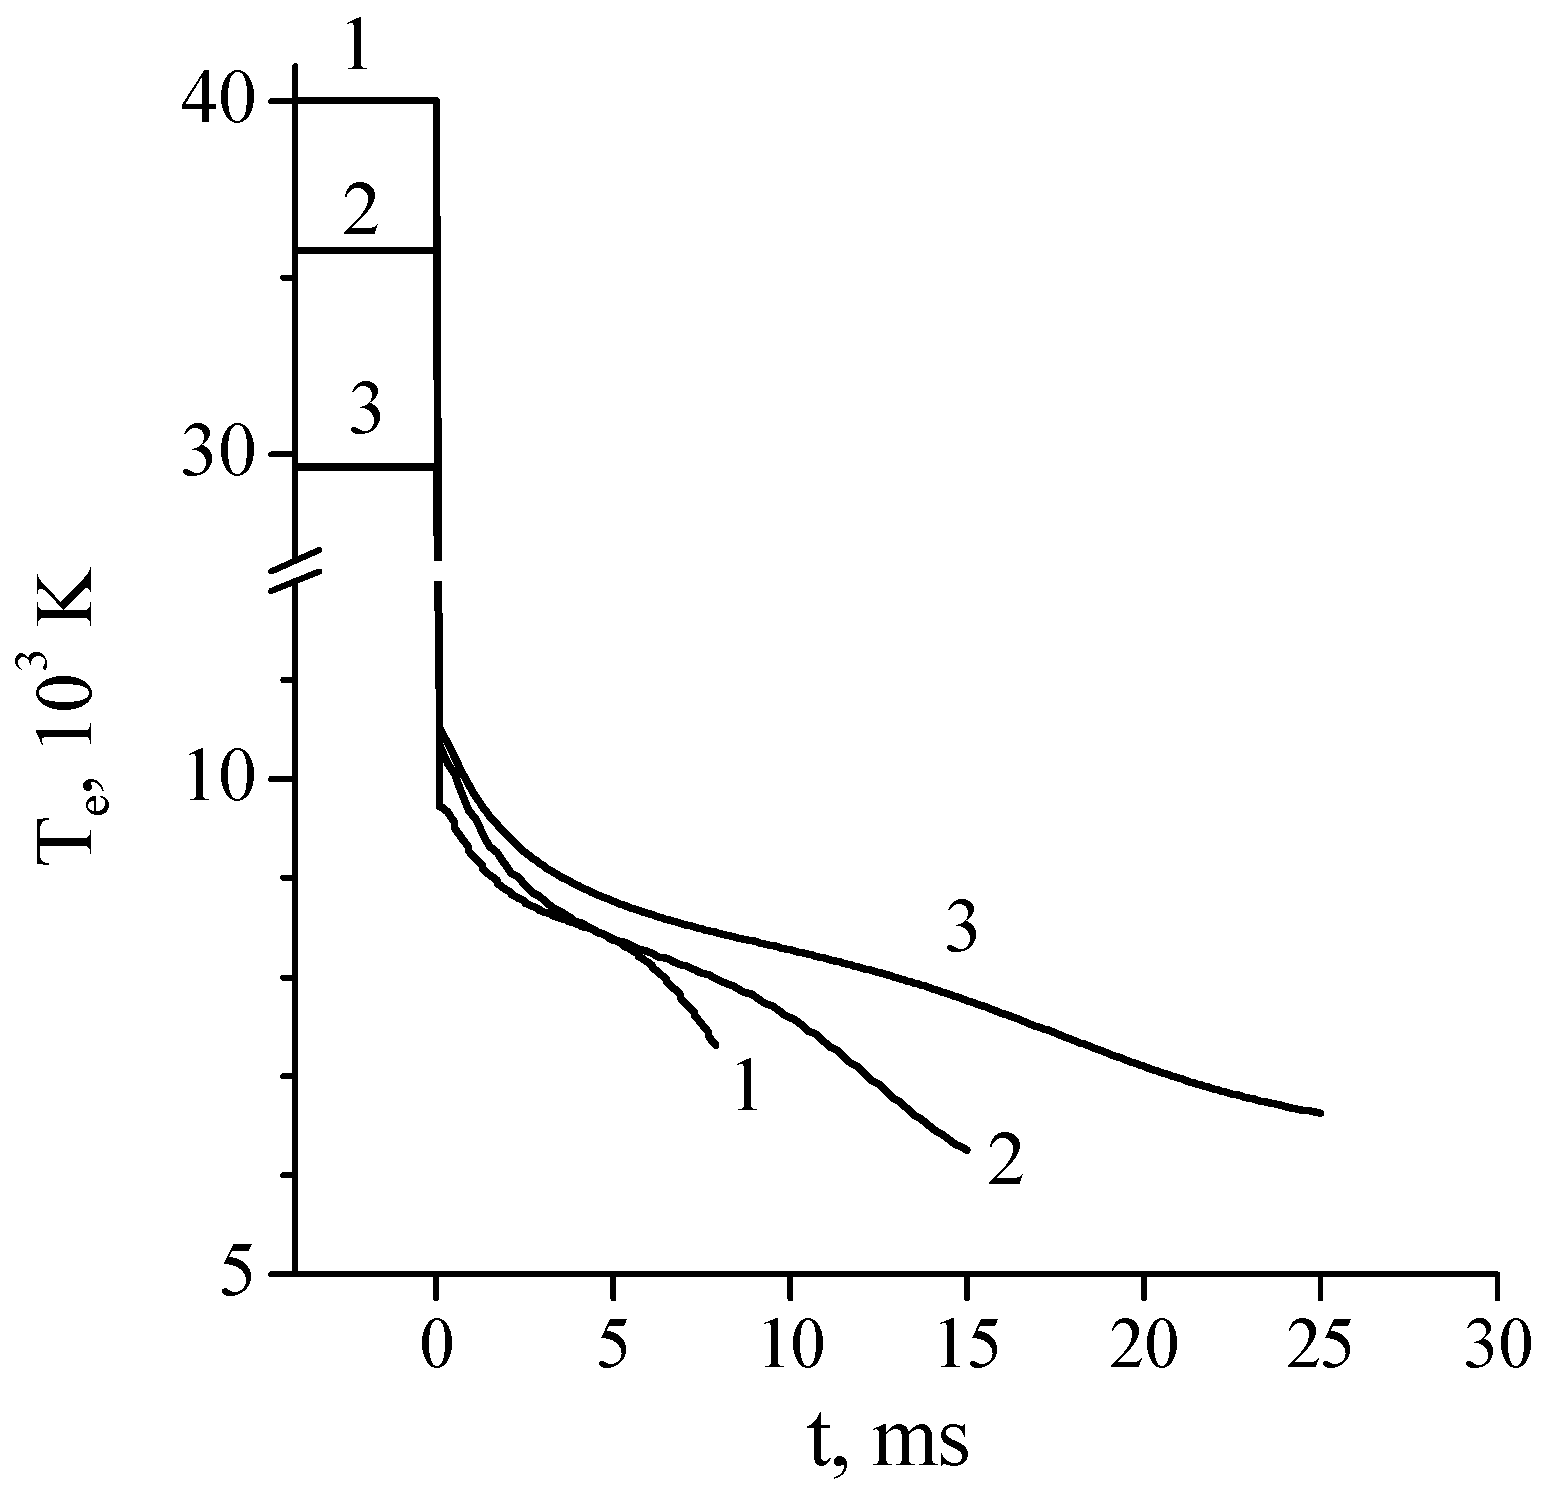
Figure 6.
Calculated effective electron temperature in a dc discharge in the Ar + 1%N2 mixture (t < 0) and its time evolution in the discharge afterglow (t > 0). R = 1.4 cm, I = 20 mA. P = 1 Torr (1), 2 Torr (2), and 5 Torr (3) [26].
Figure 6.
Calculated effective electron temperature in a dc discharge in the Ar + 1%N2 mixture (t < 0) and its time evolution in the discharge afterglow (t > 0). R = 1.4 cm, I = 20 mA. P = 1 Torr (1), 2 Torr (2), and 5 Torr (3) [26].

Figure 7.
Calculated electron densities in the discharge (t ≤ 0) and in the afterglow (t > 0) at a discharge current of I = 20 mA and gas pressures of P = 1 (a), 2 (b), and 5 Torr (c), respectively [26].
Figure 7.
Calculated electron densities in the discharge (t ≤ 0) and in the afterglow (t > 0) at a discharge current of I = 20 mA and gas pressures of P = 1 (a), 2 (b), and 5 Torr (c), respectively [26].

Figure 8.
Volt-amp characteristic of the discharge under constriction [47]. (© IOP Publishing. Reproduced with permission. All rights reserved.)
Figure 8.
Volt-amp characteristic of the discharge under constriction [47]. (© IOP Publishing. Reproduced with permission. All rights reserved.)

Figure 9.
Volt–amp characteristics of a glow discharge in pure argon and in argon with nitrogen admixture. Percentages of admixture are indicated [16]. (© IOP Publishing. Reproduced with permission. All rights reserved.)
Figure 9.
Volt–amp characteristics of a glow discharge in pure argon and in argon with nitrogen admixture. Percentages of admixture are indicated [16]. (© IOP Publishing. Reproduced with permission. All rights reserved.)

Figure 10.
Volt–amp characteristics for Ar and Ar-N2 mixture in a region of constricting [16]. (© IOP Publishing. Reproduced with permission. All rights reserved.)
Figure 10.
Volt–amp characteristics for Ar and Ar-N2 mixture in a region of constricting [16]. (© IOP Publishing. Reproduced with permission. All rights reserved.)

Figure 11.
Volt–amp characteristic recorded at lowering (from point A) and increasing (from B) of power supply voltage [16]. (© IOP Publishing. Reproduced with permission. All rights reserved.)
Figure 11.
Volt–amp characteristic recorded at lowering (from point A) and increasing (from B) of power supply voltage [16]. (© IOP Publishing. Reproduced with permission. All rights reserved.)

Figure 12.
Steady-state partially constricted glow discharge in the Ar + 0.075%N2 mixture, P = 40 Torr [19] (© 2011 IEEE).
Figure 12.
Steady-state partially constricted glow discharge in the Ar + 0.075%N2 mixture, P = 40 Torr [19] (© 2011 IEEE).

Figure 13.
Two upper panels are the photos of the transition region between diffuse and constricted parts of discharge. The lower panel is a 120 μs exposure CMOS camera image. In all cases, the cathode is on the left. Ar + 0.075%, P = 80 Torr [19] (© 2011 IEEE).
Figure 13.
Two upper panels are the photos of the transition region between diffuse and constricted parts of discharge. The lower panel is a 120 μs exposure CMOS camera image. In all cases, the cathode is on the left. Ar + 0.075%, P = 80 Torr [19] (© 2011 IEEE).

Figure 14.
Manifold of PCD points (open squares) for the discharge in the Ar + 0.02%N2 mixture at P = 50 Torr [16]. (© IOP Publishing. Reproduced with permission. All rights reserved.)
Figure 14.
Manifold of PCD points (open squares) for the discharge in the Ar + 0.02%N2 mixture at P = 50 Torr [16]. (© IOP Publishing. Reproduced with permission. All rights reserved.)


Table 1.
Ar + 1%N2. Calculated ‘local’ vibrational temperatures (Tvi,i+1, see comments in the text) and effective electron temperatures (Te), in discharge (t = 0) and afterglow (t > 0) plasma [44]. R = 1.5 cm, P = 5 Torr, Tgas = 350 K, I = 20 mA.
Table 1.
Ar + 1%N2. Calculated ‘local’ vibrational temperatures (Tvi,i+1, see comments in the text) and effective electron temperatures (Te), in discharge (t = 0) and afterglow (t > 0) plasma [44]. R = 1.5 cm, P = 5 Torr, Tgas = 350 K, I = 20 mA.
| Discharge | Afterglow | |||
|---|---|---|---|---|
| t = 0 | 10 ms | 30 ms | 50 ms | |
| Tv0,1, K | 10,580 | 6300 | 4110 | 3300 |
| Tv1,2, K | 17,260 | 9150 | 6350 | 5100 |
| Tv2,3, K | 16,560 | 9990 | 7900 | 6760 |
| Tv3,4, K | 14,980 | 10,530 | 9410 | 8610 |
| Tv4,5, K | 9560 | 10,190 | 10,070 | 9870 |
| Te, K | 28,900 | 8520 | 6590 | 6050 |
© 2019 by the authors. Licensee MDPI, Basel, Switzerland. This article is an open access article distributed under the terms and conditions of the Creative Commons Attribution (CC BY) license (http://creativecommons.org/licenses/by/4.0/).
Share and Cite
MDPI and ACS Style
Dyatko, N.A.; Ionikh, Y.Z.; Napartovich, A.P. Influence of Nitrogen Admixture on Plasma Characteristics in a dc Argon Glow Discharge and in Afterglow. Atoms 2019, 7, 13. https://doi.org/10.3390/atoms7010013
AMA Style
Dyatko NA, Ionikh YZ, Napartovich AP. Influence of Nitrogen Admixture on Plasma Characteristics in a dc Argon Glow Discharge and in Afterglow. Atoms. 2019; 7(1):13. https://doi.org/10.3390/atoms7010013
Chicago/Turabian StyleDyatko, Nikolay A., Yury Z. Ionikh, and Anatoly P. Napartovich. 2019. "Influence of Nitrogen Admixture on Plasma Characteristics in a dc Argon Glow Discharge and in Afterglow" Atoms 7, no. 1: 13. https://doi.org/10.3390/atoms7010013
Note that from the first issue of 2016, this journal uses article numbers instead of page numbers. See further details here.