Article

Quality of Experience in Cyber-Physical Social Systems Based on Reinforcement Learning and Game Theory

by
Eirini Eleni Tsiropoulou
1,
George Kousis
2,
Athina Thanou
2,
Ioanna Lykourentzou
3 and
Symeon Papavassiliou
2,*
1
Department of Electrical and Computer Engineering, University of New Mexico, Albuquerque, NM 87131, USA
2
School of Electrical and Computer Engineering, National Technical University of Athens, 15780 Athina, Greece
3
Department of Information and Computing Sciences, Faculty of Science, Utrecht University, PO Box 80125, 3508 TC Utrecht, The Netherlands
*
Author to whom correspondence should be addressed.
Future Internet 2018, 10(11), 108; https://doi.org/10.3390/fi10110108
Submission received: 28 September 2018 / Revised: 31 October 2018 / Accepted: 5 November 2018 / Published: 7 November 2018
(This article belongs to the Special Issue 10th Anniversary Feature Papers)

Abstract

:
This paper addresses the problem of museum visitors’ Quality of Experience (QoE) optimization by viewing and treating the museum environment as a cyber-physical social system. To achieve this goal, we harness visitors’ internal ability to intelligently sense their environment and make choices that improve their QoE in terms of which the museum touring option is the best for them and how much time to spend on their visit. We model the museum setting as a distributed non-cooperative game where visitors selfishly maximize their own QoE. In this setting, we formulate the problem of Recommendation Selection and Visiting Time Management (RSVTM) and propose a two-stage distributed algorithm based on game theory and reinforcement learning, which learns from visitor behavior to make on-the-fly recommendation selections that maximize visitor QoE. The proposed framework enables autonomic visitor-centric management in a personalized manner and enables visitors themselves to decide on the best visiting strategies. Experimental results evaluating the performance of the proposed RSVTM algorithm under realistic simulation conditions indicate the high operational effectiveness and superior performance when compared to other recommendation approaches. Our results constitute a practical alternative for museums and exhibition spaces meant to enhance visitor QoE in a flexible, efficient, and cost-effective manner.

1. Introduction

1.1. Motivation and Related Work

Museums are dynamic environments for interaction, which attracts people for both learning and entertainment purposes. The goal of a museum is to engage its visitors by improving its word-of-mouth reputation and augmenting their Quality of Experience (QoE). Preliminary studies have focused their research on identifying visitors’ characteristics, which can be further exploited to study visitors’ QoE levels. The seminal work [1] categorized visitors into four main personas (i.e., visiting/visitors’ styles), i.e., ant, butterfly, fish, and grasshopper, depending on their movement patterns in the physical space of a museum. These patterns were further validated through an empirical study and quantitative analysis in Reference [2]. Several research studies have been specifically devoted to the study of museum visitors’ QoE. The way QoE is formed was studied in Reference [3] where the authors examined the impact of visitor expectations and experiences on their perceived QoE. Towards studying this impact, the authors consider the relationship between the cognitive opinions of visitors (i.e., perceived quality and/or disconfirmation) and their affective opinion (i.e., positive emotions). QoE has also been studied in relation to five main directions, i.e., easiness and fun, cultural entertainment, personal identification, historical reminiscences, and escapism, in Reference [4] via a questionnaire-based study with real museum visitors. In Reference [5], the authors have examined the impact of providing story-centric narrations with references to the exhibits on visitors’ QoE and engagement to the museum. This work focuses on leveraging the advantages of mobile-based guided tours, which are either audio/multimedia guides that visitors can rent or borrow when in the museum or applications that visitors can load onto their own smartphones and tablets. Moreover, in Reference [6], the authors aim at establishing the link between tourists’ perceptions on cultural offers and their overall satisfaction while exploiting the impact of visitors’ negative experiences on the museum’s word-of-mouth reputation.
In Reference [7], the authors have developed a visualization tool to monitor visitor navigation within the museum and extract useful information regarding their interests and their visiting style, which can be further exploited to form their QoE-related parameters. Wright in Reference [8] also shows that the QoE of a museum visitor depends on personalized factors like the visitor’s style as well as on museum-related factors, e.g., museum congestion caused by the number of visitors that are present. Recent studies have correlated visitor’s QoE when touring in the museum. In References [9,10], the authors propose a museum touring framework that aims at minimizing the visiting time of a group of visitors, following a mixed integer programming approach. However, this framework is agnostic with respect to visiting styles. A personalized approach to the previous problem is proposed in Reference [11] where the proposed museum touring solution considers both the preferences of visitors and the prestige of exhibits while maximizing the QoE expressed as their total interest towards a set of exhibits. In Reference [12], the authors study the visiting time in a cultural space by considering various factors such as being first-time visitors, traveling with children, using a guidebook, being with a guided-tour, etc. The authors have used data that were collected via a global positioning system (GPS) as well as questionnaires distributed to visitors and concluded that the attractions with no admission charge are visited more than those with an admission charge. However, the visiting time is longer when the visitor pays for the visit. Additionally, in References [13,14], the authors considered a cost optimization formulation to solve the planning problem and to determine the optimal tour for each visitor given a set of visitor preferences and constraints.
From a more quantitative point-of-view, an extensive research effort to quantify QoE was initiated in Reference [15] where the authors studied the effect of smart routing and intelligent recommendations on visitors’ QoE. In Reference [16], a holistic approach to the formulation and optimization of QoE functions was introduced. This identifies the most influential parameters that affect the QoE notion. Based on this, a human-in-the-loop approach was proposed in Reference [17] towards determining a physical, personal, and interest-aware museum touring approach that maximizes visitors’ QoE. In Reference [18], the authors present a self-organizing mechanism for forming museum visitor communities, which exploits visitors’ personal characteristics and social interactions and aims to enhance a visiting experience based on a participatory action research process. A location-aware recommender system is presented in Reference [19] where the authors make personalized recommendations to museum visitors based on classical observations, e.g., geo-localization over time as well as psychological and social aspects of visitors in relation to a museum’s physical parameters. In addition, the proposed recommender system is characterized by its centralized operation where a central entity (i.e., the recommender system) takes decisions regarding the recommendation that should be proposed to the visitors without providing any intelligence or autonomicity to them.
However, all the previously mentioned research efforts have focused on quantifying and optimizing the perceived QoE of visitors mainly via physical context parameters (e.g., museum size, placement of exhibits, etc.). They do not typically consider the impact of recommendation services made available by a museum on visitors’ choices or on their optimal visiting time. Furthermore, they provide centralized approaches in order to formulate and optimize visitors’ QoE. These may not scale well or may not even be feasible at all especially in a large cyber-physical social system because the decision-making process would require too much time for a stable outcome to be reached. In this paper, we address this particular issue in a formal and unified manner. The main goal of this paper is to introduce and design an optimization framework, which captures visitors’ QoE in a quantifiable yet simplistic and manageable manner and determines the optimal recommendation selection for the visitors as well as their optimal visiting time for maximizing their QoE. Specifically, we rely on the iterative design and adoption of (i) a reinforcement learning framework to treat the problem of intelligent recommendation selection, and (ii) a game theoretic approach to determine the optimal visiting time of museum visitors, which is driven by their QoE in the museum. The latter approach was adopted due to the distributed nature of the optimization problem under treatment and the selfish behavior of visitors when maximizing their own perceived QoE, on one hand, and, on the other hand, based on the fact that the decisions of the various visitors are interrelated. Specifically, an increased visiting time of one visitor affects the perceived satisfaction (i.e., QoE) of the rest of the visitors in the museum since it increases the congestion in the museum. Proper consideration of the above problem is a considerable step towards managing and alleviating the overall congestion issue in museums.

1.2. Paper Contributions and Outline

The basic contributions of our proposed approach and framework are summarized below.
  • For the first time in the literature, visitors are modeled as learning automata via a reinforcement learning mechanism, which allows them to select the most appropriate recommendation for their museum tour. The concept of learning automata is adopted from the control theory where the learning automata entities can make autonomous decisions and selections among available choices by sensing their environment and based on their past decisions. Thus, visitors are able to intelligently sense their environment (e.g., actions of other visitors) while keeping track of their own decisions in order to take more educated and advantageous actions in the future. As time evolves, their decisions converge and visitors select the type of recommendation that will improve their perceived QoE.
  • We introduce a holistic approach of QoE-based visiting time management in museums. Each museum visitor aims to maximize his/her perceived QoE in a distributed manner for the selected recommendation. Based on the non-cooperative and distributed nature of managing visiting time, we formulate a maximization problem for each visitor’s QoE function and confront it as a non-cooperative game. To deal with this problem while considering the different types of visitor personas, we follow an approach based on the quasi-concavity of the visitor QoE function in order to conclude at a unique Nash equilibrium point.
  • The perceived satisfaction of museum visitors is reflected and represented in a formal and quantitative way by using appropriately defined QoE functions. They are based on the following attributes: (a) time spent on a museum visit, (b) selected type of recommendation, and (c) fulfillment of visitor QoE prerequisites. The key novelty in this work is that the QoE function consists of the following two parts: (a) the pure QoE function and (b) the congestion control function. The pure QoE function reflects the tradeoff of achievable QoE over the time spent on the visit. The congestion control function is sophisticatedly selected in order to achieve fairness among museum visitors with respect to accessing and spending time in the museum.
  • The proposed framework enables autonomic visitor-centric management and QoE optimization in a personalized manner, which allows self-* properties, e.g., self-optimization, self-adaptation, etc.
  • A two-stage distributed algorithm is proposed to determine the optimal visiting time and recommendation selection for each museum visitor. The output of the visiting time management problem feeds the learning system in a recursive manner in order to build knowledge.
  • Detailed numerical results are provided that demonstrate the performance and operational effectiveness and efficiency of the proposed algorithm along with its flexibility and adaptability under various scenarios. The proposed framework was tested with data provided by users via a questionnaire and additional simulation results were then generated to achieve a more thorough analysis. Lastly, the performance of the proposed framework is evaluated against the related state-of-the-art framework and its superiority in terms of achieved QoE is demonstrated.
The rest of the paper is organized as follows. In Section 2, a high-level description of the joint recommendation selection and visiting time management framework and process is presented, which identifies all the involved elements and their respective roles and relations. In Section 3, some preliminary work as well as the introduced models and assumptions that are used throughout this paper are provided. Section 4 contains all the details of the recommendation selection mechanism. The formulation and solution of the reinforcement-learning framework are described via a game theoretic approach of the corresponding time management problem by optimizing visitor QoE. In Section 5, a distributed and iterative algorithm is presented to realize the reinforcement learning recommendation selection and the distributed visiting time management process while Section 6 contains the performance evaluation of the proposed approach. Lastly, concluding remarks are provided in Section 7.

2. An Overview of the Joint Recommendation Selection & Visiting Time Management Framework

In this section, we provide an overview of the overall framework proposed in this research work while, in the following sections, its individual components will be analyzed in detail. Specifically, we formulate and address the problem of joint Recommendation Selection and Visiting Time Management (RSVTM) in a museum environment. We note that the same problem formulation can more generally be applied to any exhibition area and it is not necessarily limited to specific museum assumptions like the majority of prior literature studies.
In a nutshell, the proposed problem and process formulation are as follows. Before starting their museum tour, arriving visitors select a type of recommendation among the various ones offered, which will drive their visit. The types of recommendations range from a simple map for a self-guided tour to a guided visit in their own language, which offer different levels of QoE. The recommendation selection is based on a reinforcement-learning framework through which the museum visitors act as learning automata. As time evolves and before the visitors make their final selection of the recommendation, they gain knowledge and experience.
Figure 1 presents the examined RSVTM problem as a learning system. Each museum visitor/learning automaton i , i (where denotes the set of visitors) at each operation time slot τ of the reinforcement learning framework/loop has a set of actions a x ( τ ) . Each action represents a different choice x of recommendation selection for his/her museum tour. Towards making their decision, museum visitors consider the museum environment and specifically the output set β ( τ ) = { Q ( τ ) , t ( τ ) } where Q ( τ ) and t ( τ ) are the vectors of the combined QoE and visiting time of all museum visitors that are simultaneously in the museum. The output β ( τ ) = { Q ( τ ) , t ( τ ) } is determined from the visiting time management framework. The solution to the visiting time management problem results in visitors’ optimal visiting time. Based on the chosen actions of the visitors and the corresponding reaction of their environment, we are able to determine the reward probability p x ( τ ) , which is associated with the action a x ( τ ) . The reward probability represents the penetration of the Rxth recommendation in the pool of museum visitors. The action probability vector of a museum visitor/learning automaton i , i is Pr i ( τ ) where each one of its elements Pr i , x ( τ ) expresses the probability of selecting the Rxth recommendation and is determined based on the model of learning automata.
Given the actions of the museum visitors in terms of recommendation selection, each museum visitor i , i aims to determine his/her optimal visiting time t i * to maximize his/her perceived Quality of Experience. Therefore, this goal is formulated as a distributed maximization problem of each museum visitor combined QoE function with respect to his/her visiting time. Considering the distributed nature of the problem and the selfish behavior of the visitors as they optimize their own perceived QoE, a game theoretic approach is adopted to determine the optimal visiting time vector t * = { t 1 * , , t i * , , t N * } for visitors. The Nash equilibrium concept is adopted to analytically solve the non-cooperative visiting time management game. To demonstrate the existence and uniqueness of the Nash equilibrium in the non-cooperative visiting time management game, we prove that the museum visitor combined QoE function Q i is quasi-concave with respect to t i .
The distributed non-cooperative visiting time management game among museum visitors is performed at every time slot (of the external loop of the reinforcement learning framework) to determine their optimal visiting time t i * , i and their corresponding combined QoE values. Therefore, an overall cycle of joint recommendation selection and visiting time management is realized. The above-described overall procedure is performed iteratively in the time before the museum visitors start their tour, which is presented in Figure 1. Its actual running time is quite short (in the range of a few seconds) and is envisioned to run on a mobile application that the museum will offer for free to the museum visitors and can be downloaded to their smartphones. It is noted that the recommendation selection process runs multiple timeslots (i.e., extremely short duration of time) and, per each timeslot, the visiting time management process runs multiple iterations until convergence to the optimal visiting time for each museum visitor.
At this point, it should be clarified that, in the recent literature, there are four main classes of learning approaches proposed to deal with the partial available information toward making decisions. Those categories are identified as: (a) supervised learning, (b) unsupervised learning, (c) semi-supervised learning, and (d) reinforcement learning [20]. The supervised learning approaches need a priori knowledge of the input and the desired output data. The goal of the unsupervised learning approaches is to infer some structure from the collected data while the semi-supervised approaches use both labeled and unlabeled data to train the overall system. However, in our proposed framework, we do not know a priori the desired output data, i.e., each visitor recommendation selection. Moreover, our goal is to enable each visitor to select a recommendation and not to infer a structure for the collected data while there is a lack of labeled data to train the visitors’ recommendation selection decision. Thus, the reinforcement learning approach is the best candidate for our framework since the reinforcement learning-based decisions of visitors are trained by the data produced by the implementation. In our proposed framework, we have selected the reinforcement learning technique of the stochastic learning automata given its low complexity and implementation cost. However, other techniques such as the Q-learning or the exponential learning approach can be adopted.

3. Models and Preliminaries

3.1. System Model

Based on the following information, we assume a single-exhibition, e.g., museum where the optimal visiting time of each museum visitor is studied. Within the museum, we assume that different types of recommendations are provided to the museum visitors. Even though several different recommendations may exist, in this paper, we have assumed three different types of recommendations. Let us denote by = { R A , R B , R C } the set of recommendations available to visitors. Each one provides a different Quality of Experience (QoE) for the visitors while it asks for a different investment time on the part of the visitor. The latter will be discussed in detail in Section 3.2. As mentioned before, we denote by = { 1 , , i , , N } the set of museum visitors that consists of visitors with different visiting styles, i.e., ant, butterfly, fish, and grasshopper. Consequently, we have the corresponding subsets: a ,   b ,   f ,   g and = a b   f   g . Each museum visiting style has different characteristics regarding the time spent for the visit as well as its tolerance to the level of crowd density in the museum [2,3].
Specifically, ant visitors follow a long path in the museum and they are inclined towards extensive walking by spending a lot of time at the museum during their visit. Moreover, the increased crowd density does not discourage them from visiting the museum because they are dedicated to their visit. However, their perceived satisfaction decreases when the crowd density increases. Butterfly visitors are also interested in visiting the whole exhibition. However, the walking path that they follow may be easily redirected if the conditions favor it and suggest such an alteration. For example, if a specific part of the museum has increased crowd density, unlike ant visitors, butterfly visitors will choose to visit it later in order to avoid long queues. Thus, butterfly visitors also invest a lot of time in their museum visit, but they are more tolerant of increased crowd density when compared to ant visitors. Fish visitors are the “laziest” ones since they prefer to stand in the center of an exhibition room and observe many exhibits concurrently. Consequently, fish visitors spend limited time on their visit and their satisfaction is affected dramatically by increased crowd density. Standing in the center of an exhibition room, a larger crowd easily blocks their vision. Lastly, grasshoppers have clear preferences and make plans about the specific exhibits that they will visit. Thus, they spend an average amount of time on their museum visit to observe the details of the few specific exhibits that they have selected to visit and they get annoyed with increased crowd density because it adds a delay to their pre-scheduled and well-organized museum visit.
Museum visitor visiting time is denoted by t i and, due to museum physical characteristics (e.g., size) and visitor physical limitations and personal preferences, it is lower and upper bounded, i.e., t i M i n t i t i M a x . Let us also denote by t i , the visiting time vector of the rest of the museum visitors that are in the museum at the same time as the visitor i , i . Each type of recommendation R x , x = A , B , C and R x offers a different level of QoE to the visitor that selects it. Let us denote by Q x ,   x = A , B , C the QoE values offered by the recommendations R A , R B , and R C , respectively. Without loss of generality, the QoE values offered by each recommendation are sorted as Q A < Q B < Q C with the interpretation that a higher value of QoE reflects an enhanced level of recommendation service, which is discussed in more detail in Section 3.2. A simple but fundamental and effective performance measure that verifies that the visitors’ QoE prerequisites are fulfilled can be defined as the relative visiting time ratio. The relative visiting time ratio r t i of museum visitor i , i can be written as the equation below.
r t i = t i j j i t j ,
where j j i t j is the cumulative time spent by the other visitors that concurrently visit the museum with visitor i. We can infer that, as the cumulative visiting time of the rest of the visitors increases, then either the crowd density increases or the visitors spend more time at exhibits, which implicitly indicates the level of museum congestion. In the latter case, the QoE of the museum visitor i , i deteriorates because either there are too many visitors in the museum or some exhibits are “blocked” by other visitors observing details. Moreover, each museum visitor is characterized by a target relative visiting time ratio, i.e., r t i t arg e t , y , y = a , b , f , g , which is differentiated based on the visiting style as presented in Figure 2. The target relative visiting time ratio represents a desired value for each visitor depending on his/her visiting style. Below this value, the visitor’s perceived satisfaction decreases rapidly since the museum is considered greatly congested while, above this value, the visitor’s perceived satisfaction increases slowly as the impact of the rest of the visitors’ visiting time on the individual visitor is reduced. We consider without loss of generality that r t i t arg e t , b < r t i t arg e t , a < r t i t arg e t , f < r t i t arg e t , g . Specifically, in a nutshell, a butterfly visitor can redirect his/her visiting path in case of increased crowd density in contrast to an ant visitor who sequentially visits all the exhibits. Thus, increased crowd density annoys the butterfly visitors less than the ant visitors, i.e., r t i t arg e t , b < r t i t arg e t , a . A fish visitor observes the exhibits from the center of the exhibition room. Thus, if other visitors linger in front of some exhibits, he/she is blocked from observing them. In contrast, an ant visitor waits patiently and sequentially visits all exhibits. Thus, we have r t i t arg e t , a < r t i t arg e t , f . A grasshopper visitor has few target exhibits that he/she wants to visit in the museum. Thus, if other visitors block those exhibits, his/her QoE dramatically deteriorates. Therefore, grasshopper QoE requirements are stricter when compared to all other types of visitors.

3.2. Recommendation Models and Policies

As mentioned before, we assume that a museum offers different recommendations to the museum visitors that correspond to different levels of perceived QoE as well as different times allocated to a museum visit. We assume that more visitors will ask for an enhanced type of recommendation, which will increase the demand for the specific recommendation and create a longer waiting queue to obtain that service. Therefore, the recommendations can be characterized by a congestion control parameter c x , x = A , B , C , which, among others, represents the potential waiting time for the specific recommendation type. In such a way, the visitor should consider the tradeoff of selecting an enhanced type of recommendation, which may increase his/her perceived satisfaction in a shorter invested visiting time [12]. However, the corresponding usage-based congestion of this recommendation may be further translated to the waiting time.
In this paper, we consider and study for demonstration purposes and without loss of generality, three different indicative types of recommendations, which are generic enough and, in the following, are presented with an increasing level of QoE.
  • Recommendation A ( R A ): The museum provides a map of the museum at its entrance without visitors waiting in long queues for this service. However, visitors may have to spend a lot of time in order to navigate themselves without guidance in the museum. Moreover, visitors perceived QoE, i.e., Q A , is limited because the information received about exhibits is based only on the corresponding text-tags attached to each exhibit, which provides relevant information about it.
  • Recommendation B ( R B ): A facilitator is provided by the museum to navigate the visitors in the museum and provide additional useful information about exhibits. Visitors create groups when they arrive at the museum and a facilitator starts the museum tour with the group at specific timeslots. Therefore, museum visitors on average should wait a longer time than in the previous case in order for the group to be created and the touring to start. However, their perceived QoE, i.e., Q B is increased when compared to QA because they gain more information about exhibits and their visit is shorter and more efficient due to its structured and guided nature.
  • Recommendation C ( R C ): Besides the previously described characteristics of the recommendation R B , the facilitator offers headphones to the museum visitors so that the information is provided in their native languages. Such groups are typically scheduled to start tours in sparse timeslots and, thus, their waiting time increases. However, the perceived QoE of a visitor, i.e., Q C , increases due to the enhanced obtained service.
Based on the above description and without loss of generality, it is expected that Q A < Q B < Q C in our proposed framework. Moreover, it should be noted that additional types of recommendations can be considered without violating the principles and application of the proposed framework. It is also highlighted that this ordering is not binding or restrictive for our framework and a different ordering could have been obtained. Thus, the (three) different recommendations considered in this paper are not restrictive at all neither in nature (what do they actually represent) nor in size (number of recommendation types) and a larger number of recommendations with different characteristics could have been assumed. For fairness purposes and in order to support the concept of the “open museum to everybody”, we assume that all the above-described recommendations have the same cost (price) for museum visitors. Though actual pricing is out of the scope of our current study, the cost of each recommendation could be easily accommodated by our proposed framework if combined within the congestion control parameter c x , x = A , B , C . Therefore, an enhanced recommendation could have an increased cost, i.e., c A < c B < c C . The latter is part of our future work plans.

3.3. Quality of Experience Function and Modeling

The concept of QoE function has been adopted to represent the perceived satisfaction of the visitors from (a) the time spent for the museum visit, (b) the selected type of recommendation, and (c) the fulfillment of their QoE prerequisites. A combined QoE function is adopted by each museum visitor, which consists of two parts: (a) the pure QoE function and (b) the congestion control function. Museum visitor pure QoE function is reflected via the ratio of the achievable QoE to the corresponding time spent for the museum visit. We assume that visitor’s perceived satisfaction increases as he/she achieves high QoE without overspending time for the museum visit. Note that t i M i n t i t i M a x , which is mentioned in Section 3.1. It should also be highlighted that the optimal visiting time for a museum visitor is not always t i M i n because, based on the selected recommendation and museum congestion (expressed via the cumulative visiting time of all visitors that simultaneously explore the museum), his/her perceived QoE can be limited. Thus, each museum visitor expresses his/her flexibility regarding the visiting time (via the bounds t i M i n and t i M a x ) and considers his/her perceived QoE in order to determine the actual optimal visiting time. It should be highlighted that the museum congestion is implicitly expressed via the time the rest of the visitors spend in the museum, i.e., j j i t j concurrently with visitor i , i . This formulation stems from the observation that either a large number of visitors are simultaneously exploring the museum (i.e., increased crowd density) or there are some visitors spending more time observing exhibits, which contributes to museum congestion and also contributes to “blocking” visitors i , i from observing them.
Specifically, the achievable pure QoE function is formulated as a sigmoidal function with respect to the relative visiting time ratio r t i , i.e., Q x · f i y ( r t i ) ,   x = A , B , C ,   y = a , b , f , g where the notation y shows the visiting style of the visitor, i.e., ant (a), butterfly (b), fish (f), and grasshopper (g). The visiting efficiency function f i y ( r t i ) represents visitor’s perceived satisfaction and depends on the museum congestion as well as on the time that he/she invests in the museum visit. For analysis purposes, a common sigmoidal function is adopted, i.e., f i y ( r t i ) = ( 1 e A y r t i ) M y , where A y , M y , y = a , b , f , g are positive parameters controlling the slope of the visiting efficiency function to guarantee the relative positions of the visiting efficiency functions, which is presented in Figure 2.
If the target relative visiting time ratio r t i t arg e t , y is achieved, then the QoE prerequisites of visitor i are fulfilled. To realize this, the r t i t arg e t , y value is mapped at the inflection point of the sigmoidal function Q x · f i y ( r t i ) ,   x = A , B , C ,   y = a , b , f , g . The notion of the latter formulation is that, if the QoE of visitor i is lower than Q x · f i y ( r t i t arg e t , y ) , then his/her perceived satisfaction decreases rapidly, which alerts him/her to the fact that, from his perspective, the museum is congested. In contrast, if the achieved QoE is greater than Q x · f i y ( r t i t arg e t , y ) , then the museum visitor’s satisfaction presents a slight increase due to the fact that his/her QoE expectations have already been fulfilled.
In a nutshell, each visitor’s combined QoE function can be expressed by using the equation below.
Q i ( t i , t i ) = Q x · f i y ( r t i ) t i c x N x k e t i , i ,   x = A , B , C ,   y = a , b , f , g , = a b   f   g
where N x is the number of visitors that have selected the recommendation x and k R + . The congestion control function adopted in the second part of the combined QoE function (2) is a convex function with respect to visitor’s visiting time t i . This formulation has been sophisticatedly selected in order for fairness to be achieved among the museum visitors with respect to accessing and spending time in a museum and in accordance with a selected type of recommendation. It is highlighted that the first part of the combined QoE function (2) expresses visitor’s i perceived satisfaction while considering his/her own strategy (i.e., visiting time) as well as the strategies of the rest of the visitors. The second part of the function acts as a penalty to the visitors towards sophisticatedly adapting their visiting time to avoid harming the perceived QoE of the other visitors. It is highlighted that the physical components of our proposed framework can be identified as the visiting time of each visitor within the museum as well as the congestion of visitors in the museum, i.e., visitors/square feet. The latter is considered within the congestion control parameter cx that is included in the congestion control function, i.e., second part of Equation (2).

3.4. Penetration Model of Recommendation in Visitors’ Pool

Museum visitor’s decision on recommendation selection is affected by the corresponding congestion control parameter c x , x = A , B , C included in the combined QoE function (2) and by the number of visitors N x that select the specific recommendation as well as by the recommendation penetration in the pool of visitors. Μuseum visitors are influenced by and tend to express interest to a recommendation that is selected by an increased population of visitors because they believe that it could be “better” i.e., offer increased perceived QoE than the others. The penetration p x ( τ ) of a recommendation R x , x = A , B , C , R x is expressed through the ratio of the total achieved QoE of all visitors selecting R x recommendation over the total achieved QoE of all the visitors that are in the museum at the examined timeslot τ , as follows.
p x ( τ ) = i = 1 R x N Q x · f i y ( r t i ) i = 1 R x N Q x · f i y ( r t i ) | τ

4. Joint Recommendation Selection and Visiting Time Management Problem

4.1. Framework Design

As mentioned before in this paper, the problem of joint Recommendation Selection and Visiting Time Management (RSVTM) in a museum environment (or, in general, in an exhibition area) is addressed. Museum visitors arrive at the museum and, before starting their museum tour, they select a type of recommendation that will drive their visit based on a reinforcement learning framework. Specifically, the museum visitors act as learning automata, gaining knowledge and experience from their past potential actions. They are able to intelligently sense the environment while keeping a history of their decisions in order to make more advantageous actions in the future. As time evolves, their decisions converge and they select the type of recommendation that will improve their perceived QoE. The necessary information in order to take their decision is their visiting time t = { t 1 , , t i , , t N } and the corresponding combined QoE values Q = { Q 1 , , Q i , , Q N } at the previous time slot τ of the reinforcement learning framework. Furthermore, apart from these parameters, museum visitors consider the penetration i.e., p x ( τ ) , of each recommendation R x , x = A , B , C .
Given the actions a ( τ ) of museum visitors in terms of recommendation selection, a distributed non-cooperative visiting time management game among them is performed every time slot (of the external loop of the reinforcement learning framework) in order to determine their optimal visiting time t i * , i and their corresponding combined QoE values. Therefore, an overall cycle of joint recommendation selection and visiting time management is realized. The overall procedure described above is performed iteratively in time before museum visitors start their touring, as presented in Figure 1, and it is explained in detail in the following Section 4.2 and Section 4.3. Moreover, it is highlighted that the RSVTM framework is executed every time a new museum visitor arrives at the museum while the decisions of the previously arrived visitors remain constant if they have started their museum tour. Lastly, the proposed RSVTM framework is executed before the museum visitors start their touring toward determining both the recommendation selection and the optimal visiting time. The actual running time of the RSVTM framework is quite short (order of few seconds for practical purposes) since it will be presented in the detailed numerical results and performance evaluation in Section 6.

4.2. Recommendation Selection Based on Reinforcement Learning

The action probability vector of museum visitor/learning automaton i , i is Pr i ( τ ) = { Pr i , A ( τ ) , Pr i , B ( τ ) , Pr i , C ( τ ) } where Pr i , x ( τ ) , x = A , B , C expresses the probability of selecting the Rxth, x = A , B , C recommendation. Τhe model of learning automata is expressed below.
Pr i , x ( τ + 1 ) = Pr i , x ( τ ) + b · p x ( τ ) · ( 1 Pr i , x ( τ ) ) ,   x ( τ + 1 ) = x ( τ ) ,
Pr i , x ( τ + 1 ) = Pr i , x ( τ ) b · p x ( τ ) · Pr i , x ( τ ) , x ( τ + 1 ) x ( τ ) ,
where b ,   0 < b < 1 is a step size parameter that controls the convergence time of the learning process [21,22]. The impact of parameter b on the convergence time of the algorithm is numerically studied in Section 6. Equation (4b) represents the probability that visitor i will select a different type of recommendation x ( τ + 1 ) in time slot τ + 1 compared to the one in time slot τ , i.e., x ( τ ) while Equation (4a) reflects the probability of museum visitor i continuing to prefer the same type of recommendation, i.e., x ( τ + 1 ) = x ( τ ) . It is noted that the stochastic learning automata approach need the following information: (a) visitor’s probability of recommendation selection at the previous time slot and (b) the penetration of each recommendation, which is expressed in Equation (3). The latter characterizes each recommendation and considers the total QoE of visitors who selected a specific recommendation over the total QoE of all visitors within the museum at the examined moment. The latter two types of information can be easily available by a mobile application where the overall framework is envisioned to reside.
We assume that the RSVTM framework has no prior knowledge of the reward probability p x ( τ ) , 0 p x ( τ ) 1 , x = A , B , C and the action probability Pr i ( τ ) = { Pr i , A ( τ ) , Pr i , B ( τ ) , Pr i , C ( τ ) } . Therefore, the initial selection of recommendation by the museum visitors could be made with equal probability, i.e., Pr i , x ( τ = 0 ) = 1 3 . Lastly, it is noted that there is a convergence towards the type of recommendation that will mitigate visitors waiting time before starting a museum tour and provide them with increased satisfaction related to their personal visiting time limitations. The description of the recommendation selection reinforcement-learning algorithm is presented in Section 5.

4.3. Visiting Time Management

Given the recommendation selection, each museum visitor i , i aims to determine his/her optimal visiting time t i * in order to maximize his/her perceived Quality of Experience, which is expressed in Equation (2). Therefore, the previously mentioned goal is formulated as a distributed maximization problem of each visitor’s combined QoE function with respect to his/her visiting time, which is shown below.
max t i Q i ( t i , t i ) , s . t .     t i M i n t i t i M a x i ,   x = A , B , C , y = a , b , f , g , = a b   f   g
Considering the distributed nature of the optimization problem (5) and the selfish behavior of the visitors in terms of optimizing their perceived QoE, a game theoretic approach is adopted for determining the optimal visiting time vector t * = { t 1 * , , t i * , , t N * } of the museum visitors. Let us denote by G = { , T i , Q i } the non-cooperative visiting time management game where is the set of players (museum visitors), T i = [ t i M i n , t i M a x ] is the strategy space of the ith museum visitor, and Q i is his/her corresponding combined QoE function. The concept of Nash equilibrium is adopted towards seeking analytically the solution of the non-cooperative visiting time management game. Towards proving the existence and uniqueness of Nash equilibrium in the non-cooperative visiting time management game, we should prove that the museum visitor’s combined QoE function Q i is quasi-concave with respect to t i .
Definition 1:
A function Q i is strictly quasi-concave if for any pair of distinct points t i and t i in the convex domain T i and for 0 < λ < 1 :
Q i ( t i ) > Q i ( t i ) Q i ( λ · t i + ( 1 λ ) · t i ) > Q i ( t i )
Based on Definition 1, any concave function is quasi-concave.
Theorem 1.
Museum visitor’s i , i , = a b   f   g combined QoE function is quasi-concave in the modified strategy space T i corresponding to the relative visiting time ratio interval r t ι ( ln M y A y , r t B ) , where r t B ( ln M y A y , ln 10 4 M y A y ) . Thus, the Nash equilibrium of the non-cooperative visiting time management game G = { , T i , Q i } exists and it is unique in the corresponding strategy space.
Proof of Theorem 1.
Towards proving the quasi-concavity of museum visitor’s combined QoE function, we examine the sign of its second order derivative with respect to t i .
2 Q i t i 2 = g ( r t i ) + h ( r t i ) c x N x e t i ,
where g ( r t i ) = 2 Q x t i 3 ( 1 e A y r t i ) M y 1 [ M y A y e A y r t i r t i + 1 e A y r t i ] and h ( r t i ) = M y A y 2 Q x t i 3 ( 1 e A y r t i ) M y 2 e A y r t i r t i 2 ( M y e A y r t i 1 ) . The sign of the individual terms of Equation (6) is examined. Considering the function g ( r t i ) , the Bolzano theorem is applied, which is an important specialization of the Intermediate Value Theorem [23]. For r t i = ln M y A y , we have: g ( r t i = ln M y A y ) = ln M y 1 M y + 1 < 0 and for r t i = ln 10 4 M y A y , we have: g ( r t i = ln 10000 M y A y ) = ln 10000 M y 10000 1 10000 M y + 1 > 0 , M y ( 1 , 1000 ) . Hence, there exists a r t B ( ln M y A y , ln 10000 M y A y ) such that g ( r t i ) = 0 . Given that g ( r t i ) is continuous with respect to r t i , we conclude that the following is true.
g ( r t i ) < 0 , r t i ( ln M y A y , r t B ) ,
Considering the second term of Equation (6), we determine the formula below.
h ( r t i ) < 0 r t i > ln M y A y ,
The third term of Equation (6) is always negative, i.e., r t i > 0 . Combining Equations (7) and (8), we define the modified strategy space where 2 Q i t i 2 < 0 :
r t i ( ln M y A y , r t B ) ,
where r t B ( ln M y A y , ln 10000 M y A y ) . ☐
By definition, the Nash equilibrium of the non-cooperative visiting time management game has to satisfy,
t i * = B R i ( t ) = a r g m a x t i T i Q i ( t i , t i ) ,
where B R i ( t ) denotes the best response function of each museum visitor i , i , = a b   f   g . Museum visitors adopt the best response dynamics and their strategies, i.e., visiting time converge to the Nash equilibrium, i.e., visiting time vector t * = { t 1 * , , t i * , , t N * } , if the museum visitor’s best response function is standard.
A function is characterized as standard if it satisfies the properties of (a) positivity, (b) monotonicity, and (c) scalability for all t 0 , where t = { t 1 , , t i , , t N } . These properties should be easily verified for BR ( t ) in the non-cooperative visiting time management game since:
  • Positivity: t > 0 , thus BR ( t ) > 0 ;
  • Monotonicity: if t t then via Equation (10) we conclude that BR (   t   ) BR ( t ) ;
  • Scalability: for all μ > 1 , then via Equation (10) we conclude that μ BR ( t ) BR ( μ t ) .
Therefore, it is proven that the global convergence for the non-cooperative visiting time management game’s Nash equilibrium under the proposed best response function, which is given by Equation (10), is guaranteed.

5. RSVTM Algorithm

In this section, a two-step algorithm is proposed for implementing the recommendation selection and determining the optimal visiting time for museum visitors, which is described above. The RSVTM algorithm is envisioned to run on a mobile application that a museum will offer for free to the visitors and the latter can download it to their smartphones. The first part of the algorithm is based on a reinforcement learning framework and it is responsible for determining the type of recommendation that each museum visitor selects before starting his/her museum tour. The second part of the two-step algorithm is responsible for determining the optimal visiting time for each museum visitor in a distributed manner. It is noted that the recommendation selection algorithm runs multiple timeslots τ (i.e., extremely short duration of time) and, per each timeslot τ , the visiting time management algorithm, i.e., the second part of the proposed two-step algorithm, runs multiple iterations until convergence to the optimal visiting time for each museum visitor. The algorithm can be repeated every time a new museum visitor arrives at the museum while considering the choices of the existing museum visitors in the museum constant. Specifically, in a real implementation of the mobile application, the visitor will provide as input the minimum and the maximum personal visiting time, i.e., t i M i n ,   t i M a x . Then the reinforcement-learning framework will be executed to virtually select the recommendation and, afterwards, the visiting time management algorithm will be executed to determine visitors’ optimal visiting time. The latter two-stage framework will be performed iteratively until it converges to a stable recommendation selection and visiting time values for all the visitors. It is also highlighted that the visitors do not communicate with each other, but they only provide the initial information t i M i n ,   t i M a x to the mobile application via LTE or Wi-Fi communication. Based on the following information, we present the RSVTM algorithm at the opening time of the museum where there are no other visitors. However, the same implementation can be applied at any other time instance.
RSVTM Algorithm
Step 1 (Initialization): Each visitor announces his/her visiting time constraints, i.e., t i M i n ,   t i M a x . At the beginning of the first time slot, i.e., τ = 0 , set the initial recommendation selection probability vector Pr i ( τ = 0 ) as Pr i , x ( τ = 0 ) = 1 3 , i N , x = A , B , C . Afterwards, each museum visitor chooses a type of recommendation according to his/her recommendation selection probability vector Pr i ( τ = 0 ) .
Step 2 (Recommendation Selection): At every time slot τ > 0 , each museum visitor chooses a recommendation according to his/her recommendation selection probability vector Pr i ( τ ) provided in relations (4a) and (4b).
Step 3 (Visiting Time Management): Given that all museum visitors have chosen a type of recommendation, then:
Step 3a: Set ite = 0, where ite denotes the iteration of the visiting time management part of the algorithm. The information of the overall visiting time is announced through the application to the museum visitors and each museum visitor determines the term j j i t j by subtracting his/her own visiting time.
Step 3b: Each museum visitor determines his optimal visiting time t i * in accordance with Equation (10).
Step 3c: If | t i ( i t e + 1 ) t i ( i t e ) | ε ( ε : small positive constant), the visiting time values have converged and stop. Otherwise, return to step 3a.
Step 4 (Recommendation Selection): Given the optimal visiting time, the museum can measure the penetration of each type of recommendation, which is the reward probability p x ( τ ) = i = 1 R x N Q x · f i y ( r t i ) i = 1 R x N Q x · f i y ( r t i ) and provides this information to museum visitors.
Step 5 (Recommendation Selection): Each museum visitor updates his/her recommendation selection probability vector via the following rule where 0 < b < 1 is a step size parameter:
Pr i , x ( τ + 1 ) = Pr i , x ( τ ) b · p x ( t ) · Pr i , x ( τ ) , x ( τ + 1 ) x ( τ )
Pr i , x ( τ + 1 ) = Pr i , x ( τ ) + b · p x ( τ ) · ( 1 Pr i , x ( τ ) ) ,   x ( τ + 1 ) = x ( τ )
Step 6 (Recommendation Selection): If one of the recommendation selection probabilities, i.e., Pr i , x ( τ ) , x = A , B , C , converges, i.e., Pr i , x ( τ ) = 0.999 , stop. The visitor i selects the recommendation Rx. Otherwise, return to step 2.
It should be clarified that the RSVTM algorithm can be characterized as a low complexity algorithm due to its distributed nature and the simplicity of the calculations (i.e., closed-form expressions) that performs. In addition, as it will be shown in detail in the section of numerical results (i.e., Section 6), the recommendation selection probabilities converge fast in terms of necessary timeslots τ , i.e., there exists a probability Pr i , j ( t ) , which is larger than a value approaching one (e.g., 0.999). Lastly, it should be highlighted that the details of the RSVTM algorithm are found from the museum visitor and the algorithm runs at the downloaded mobile application. The only information provided by the museum visitor is his/her visiting time constraints, i.e.,   t i M i n ,   t i M a x . The application after running the RSVTM algorithm will tell the museum visitor which type of recommendation to select and his/her optimal visiting time to optimize his/her perceived QoE.

6. Performance Evaluation and Results

6.1. A Human-In-The-Loop Experiment

Toward providing realistic results and properly capturing the real preferences of the museum visitors, we have initially performed a detailed research experimentation with actual visitors as participants. Specifically, a detailed questionnaire was circulated to potential visitors [24] with respect to the main goals of the RSVTM framework. The questionnaire consisted of 10 distinct questions. In the first step, it collected some demographic data related to visitors while the main questions aimed to identify the most representative values of the parameters act as input to the RSVTM algorithm. Based on the collected information from the circulated questionnaire and their statistical analysis, we were able to identify the style of the visitor, the minimum and maximum amount of time that the visitor would be willing to invest in a museum tour, the preference of the visitor on the considered recommendations R A , R B , R C , and the willingness to wait for that type of recommendation, which reflects the associated “cost” of the recommendation. As a result, realistic values regarding the previously mentioned parameters were collected and subsequently were used to feed the RSVTM algorithm. The questionnaire was answered by over 150 museum visitors with a balanced population of males and females originating from more than 10 different countries, e.g., Greece, Cyprus, UK, France, India, Thailand, Ukraine, Spain, USA, etc.
Based on the statistical analysis of the previously mentioned data, the most representative realistic values were determined as input for the RSVTM algorithm. Therefore, the numerical results and the performance evaluation of the RSVTM algorithm presented in the following sections are based on values originating from the previously mentioned experiment. Specifically, the collected data enabled us to determine proportions of visitors according to their styles, their minimum and maximum visiting times, i.e., t i M i n and t i M a x , the QoE values offered by each recommendation, i.e., Q x , x = A , B , C , and the values of the congestion control parameter, i.e., c x , x = A , B , C . Based on the collected data, typical values of the ratio of the four visiting styles within the examined pool of visitors are 28% ant visitors, 24% butterfly visitors, 24% fish visitors, and 24% grasshopper visitors. The visiting time of a visitor ranges from approximately 60 min to 180 min while the visitors’ preferences for the three recommendations is given by the following ratio, i.e., Q A : Q B : Q C = 5 : 7 : 9 . Moreover, the visitors expressed their willingness to wait in order to enjoy a specific recommendation and their answers were translated to the ratio of the congestion control parameters, i.e., c A : c B : c C = 3 : 6 : 10 .

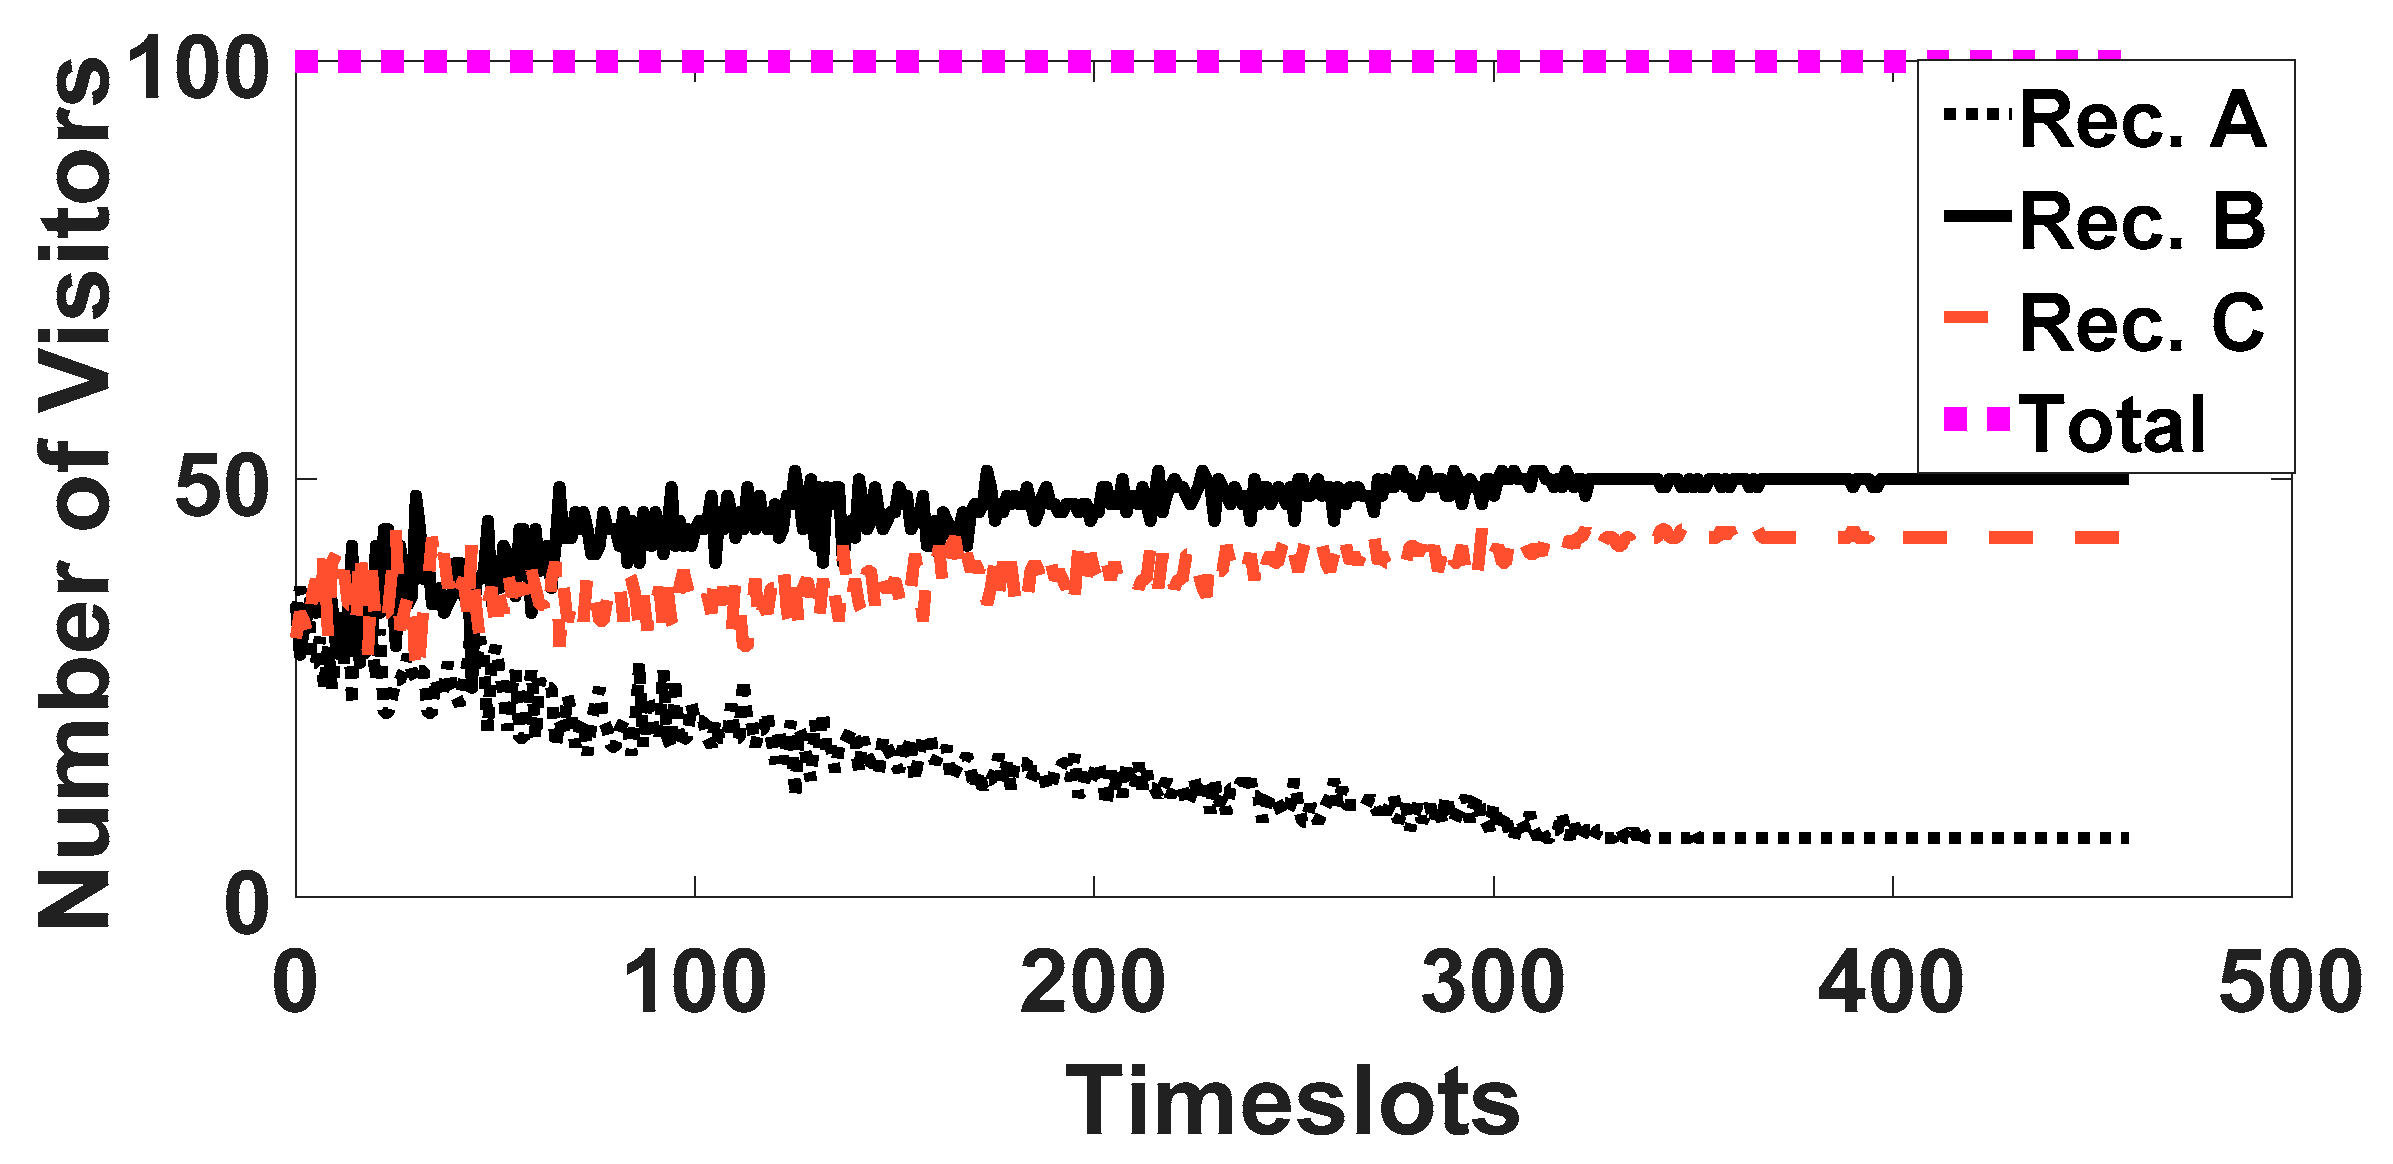
6.2. RSVTM Properties and Operation

In this subsection, our main goal is to study and illustrate the key operational properties and characteristics of the RSVTM framework through a detailed simulation-based analysis. Towards this direction, we initially consider a basic scenario for demonstration purposes where N = 10 visitors are examined with the following distribution of visitors per visiting style, i.e., four ant visitors, two butterfly visitors, two fish visitors, and two grasshopper visitors. For the experiment execution, we assume the following parameter values since they have been extracted from the circulated questionnaire and mapped or normalized where needed to meaningful values for the performance analysis, Q A = 0.5 ,   Q B = 0.7 ,   Q C = 0.9 , c A = 3.2 · 10 3 , c B = 5.8 · 10 3 , c C = 10.2 · 10 3 , b = 0.3 , r t i t arg e t , b = 0.11 , r t i t arg e t , a = 0.12 , r t i t arg e t , f = 0.13 , r t i t arg e t , g = 0.14 and t i M i n = 1 , t i M a x = 2 . The latter values refer to the visiting time constraints and are properly mapped to 60 min and 180 min, respectively. All simulations were performed on MATLAB in an Intel Core i5-7200U @2.50GHz, 8.00GBytes RAM laptop.
Specifically, Figure 3a presents the achieved QoE levels of the visitors via the RSVTM algorithm as a function of their ID considering the recommendation that they have selected, i.e., A, B, C, and their visiting style, i.e., a, b, g, and f. The results reveal that the visitors even under the RSVTM approach tend to select the recommendation that can potentially provide higher QoE, i.e., recommendation C due to the fact that: Q A < Q B < Q C . However, as recommendation C becomes congested due to the visitors’ multiple requests and a fact that would deteriorate as the number of visitors increases, it is observed that the visitors that selected this recommendation finally achieve lower QoE compared to the ones that selected recommendation B, e.g., visitors 4 vs. visitor 5 and visitor 6 vs. visitors 1 and 2. Based on this observation, we confirm that the most efficient choice in terms of recommendation selection is not always the one that can potentially provide the highest perceived QoE (i.e., recommendation C). This is explained by the fact that the potential increased congestion in the enhanced recommendation leads to the increased cost of waiting time and, thus, to lower perceived QoE, which is expressed in Equation (2). The latter outcome is also evident in Figure 3b where all visitors selected recommendation C, which provides greater QoE due to its advanced service. However, since recommendation C involves congestion, the average visitor achieved QoE is lower (horizontal line in Figure 3b) when compared to the RSVTM algorithm (Figure 3a). Please also note that some visitors even achieve negative QoE values in the case of fixed recommendation C since the cost associated with the choice of recommendation C, due to the congestion issue, becomes greater than the pure achieved satisfaction. Specifically, the grasshopper visitors (ID 7 and 8) achieve negative QoE given that they are less resilient when faced with the museum congestion, as discussed in Section 3.1 and presented in Figure 2. This problem is alleviated by the proposed RSVTM approach that manages a dynamic and better distribution of visitors to the various recommendation styles. Enabling visitors to sense their environment, learn from their past actions by behaving as stochastic learning automata, and make autonomous optimal decisions about themselves are the driving factors that allow the RSVTM algorithm to converge to higher QoE values for all visitors when compared to a priori choosing the best available recommendation by ignoring the congestion issue.
Subsequently, a larger and more representative experiment was executed by considering 100 museum visitors (i.e., 25 visitors from each visiting style) with c A = 3.2 · 10 5 , c B = 3.6 · 10 5 , c C = 4 · 10 5 ). Our aim is to better demonstrate the operation and behavior of the RSVTM algorithm in terms of several performance parameters and tradeoffs such as convergence, achieved QoE, visiting time, etc. Specifically, Figure 4 illustrates the convergence of the visitors to their selected recommendation, i.e., A, B, and C as a function of the time slots τ of the recommendation selection part of the RSVTM algorithm. The results reveal that the RSVTM algorithm converges to a stable operation point where all visitors select their recommendation in an autonomous and distributed manner. The RSVTM algorithm converges to the stable point in less than 400 timeslots (and for practical purposes significantly less than 300 slots), which, in real time, is translated to less than 3.7 s. Furthermore, it is observed that the majority of visitors select the recommendation B and C, which are more enhanced when compared to the recommendation A, i.e., map of the museum provided to visitors at the entrance. It is noted that, if additional visitors were present and recommendations B and C were seriously populated, then recommendation A would become more attractive as the system and time evolves.
Figure 5 depicts the number of visitors from each visiting style and the recommendation type they selected. It is shown that visitors’ distribution in the recommendations follows similar trends for each visiting style. Thus, there is no case where visitors of a specific visiting style show preference for specific recommendations. Therefore, the behavior of visitors is homogeneous with respect to the recommendation selection even if they belong to different visiting styles and the choices are primarily influenced by the congestion factor and problem.
With reference to the same setting and experiment, Figure 6 shows the average visitor QoE and the corresponding average visiting time of the four different visiting styles, i.e., ant, butterfly, fish, and grasshopper. The visitors who have greater flexibility and tolerance with respect to the museum congestion, i.e., smaller values of target relative visiting time, r t i t arg e t , b < r t i t arg e t , a < r t i t arg e t , f < r t i t arg e t , g are able to achieve greater QoE levels by spending less time to their museum visit. Therefore, combining our findings and observations from both Figure 2 and Figure 6, we conclude that butterfly-style visitors are the most tolerant of congestion. Therefore, they achieve the highest QoE while spending the shortest visiting time on their museum tour. Ant, fish, and grasshopper visitors follow with decreasing QoE levels and corresponding increasing visiting times due to the fact that r t i t arg e t , b <   r t i t arg e t , a <   r t i t arg e t , f <   r t i t arg e t , g .
Below, we study the convergence properties of the recommendation selection part of the RSVTM algorithm. Specifically, Figure 7a presents the running time (left vertical axis) of the RSVTM algorithm versus the learning rate b as well as the number of visitors deviating (right vertical axis) from their corresponding selection made with respect to the ground truth values achieved for b = 0.2. Similarly, Figure 7b presents the corresponding achieved average QoE (left vertical axis) and average visiting time (right vertical axis) as a function of the learning rate b. Please note that, as ground truth values for this experiment, we considered the ones achieved for b = 0.2 since, for small values of the learning rate b, visitors are able to better learn their available choices and make better decisions about themselves. The latter is evident from both Figure 7a,b where, in the first one, we notice that the number of visitors deviating from their corresponding choices for ground truth increases as the learning rate b increases while, as shown in Figure 7b, the average QoE decreases and the corresponding average visiting time increases. It is worthwhile pointing out that an increase in the visiting time implicitly contributes to an increase in the museum congestion. On the other hand, as the learning rate b increases, visitors select their preferred recommendation more quickly without exploiting their available options in detail. Thus, the RSVTM algorithm converges faster at the final recommendation selections for visitors (please notice the lower running times in Figure 7a with increasing values of parameter b). Based on the above discussion, we conclude that there exists a tradeoff between the learning rate of visitors and the accuracy of the optimal values for the achieved visitor QoE, visitor recommendation selection, and visitor visiting time.

6.3. Comparative Study

In the following section, a comparative study is conducted in order to demonstrate and evaluate the superior performance of the proposed RSVTM framework against other possible alternatives ranging from static targeted ones to completely random selections. Specifically, five comparative scenarios are examined with respect to the recommendation selection of visitors, which is described below.
(a)
RSVTM framework: each visitor acts as a stochastic learning automaton that learns through past actions and makes the most beneficial recommendation selection via the RSVTM algorithm,
(b)
Random Scenario: each visitor randomly selects a recommendation,
(c)
Fixed A (all visitors select Recommendation A),
(d)
Fixed B (all visitors select Recommendation B),
(e)
Fixed C (all visitors select Recommendation C).
Aiming at providing indicative scalability results of the RSVTM framework while, at the same time, evaluating the performance of all the proposed approaches with varying visitor numbers. We consider increasing the number of visitors within the museum. We performed a detailed Monte Carlo analysis for the different sets of visitors by running 1000 runs of each comparative scenario. Figure 8a,b present visitors average QoE and total achieved QoE, respectively, as a function of the number of visitors in the museum. The results reveal that the fixed choice of the recommendation by visitors, i.e., Fixed A, Fixed B, and Fixed C scenarios, concludes to lower average and total QoE values when compared to the RSVTM framework due to the increased congestion at each recommendation when considered in isolation. The random choice of recommendation concludes an almost uniform distribution of visitors for the recommendations. Thus, the corresponding congestion phenomenon is limited or eliminated. Nevertheless, the random scenario achieves comparable results with respect to the QoE values with a fixed C scenario where, at the latter one, all the visitors selected the best available recommendation C in expectation of enjoying the highest possible satisfaction. In contrast to all the other four examined scenarios, the RSVTM framework demonstrates superior results regarding both the average and the total QoE values since it enables visitors to dynamically sense the congestion of each recommendation and make the most beneficial recommendation choice that will maximize their perceived QoE. In our framework, to maintain generality and flexibility, we did not a priori correlate visiting styles with recommendation types, but we let visitors select the recommendation type as the system evolves and based on the current conditions. Such an approach, besides its general applicability under different recommendation types and environments, typically leads to a more balanced distribution of the visitors among the recommendation types especially in cases of different visitor distributions and mix of visitor styles. This way, we avoid cases where all visitors would select a specific type of recommendation, which would negatively affect the museum operation. Furthermore, as expected, the average QoE decreases as the number of visitors increases for all the comparative scenarios due to the increased museum congestion, which presents higher costs in order to enjoy a recommendation and forces visitors to invest higher visiting times for their museum tour.
Lastly, Figure 9 presents the visiting time of the visitors as a function of the number of visitors in the museum. It is noted that average visiting time reported is constant (60 min) before a certain number of visitors (68 visitors in the graph), which corresponds to the minimum visiting value, as assumed in this experiment. This indicates that this specific minimum value corresponds to the optimal value for every visitor in the scenario under consideration until a certain number of visitors is reached in the museum. After a certain point, the average visiting time of a visitor increases as the congestion increases (more visitors are assumed) and each visitor attempts to improve his or her relative position with respect to the rest of the visitors (i.e., his or her relative time ratio) in order to guarantee his or her satisfaction and improve his or her QoE. The visiting time is quite similar for all the comparative scenarios since it is the outcome of the visiting time management and optimization approach presented in Section 4.3 (properly applied to all scenarios). However, the investment of each visitor, i.e., the visiting time, has a different level of return, i.e., perceived QoE, which is observed in Figure 8a,b. Thus, in the RSVTM framework, even if the visitors invest in similar visiting time when compared to all the other comparative scenarios, concludes to greater QoE values due to the efficient selection of recommendation and more appropriate distribution of visitors to the available recommendation types.

7. Conclusions

In this paper, the problem of optimizing the recommendation selection and the visiting time management in museums is studied under a QoE-driven game theoretic approach. Our work follows the principle that a museum is viewed as a Cyber Physical Social System where visitors act and make decisions in an environment that involves constraints. Each visitor evolves in a physical or virtual space with others where his/her behavior influences and is influenced by the others.
Specifically, in our work, each museum visitor is considered a stochastic learning automaton who senses the museum environment (e.g., congestion, available recommendations, etc.), gains knowledge from his/her past actions, and makes the most beneficial recommendation selection by following the learning rules. Given the corresponding recommendation selections, each visitor aims at maximizing his/her perceived QoE in a distributed manner. The problem of visitor QoE maximization is formulated as a non-cooperative game among visitors and the existence and uniqueness of a Nash equilibrium is shown. A distributed iterative and low-complexity algorithm—RSVTM—is introduced and solves the joint recommendation selection and visiting time management. The RSVTM algorithm determines the recommendation selection for each visitor as well as the Nash equilibrium point of the visiting time management non-cooperative game. An extensive evaluation of the proposed RSVTM framework was conducted based on realistic parameters and data collected through a human in the loop experiment and a detailed questionnaire was circulated to museum visitors. The corresponding detailed numerical results demonstrated the operational effectiveness and efficiency of the proposed approach while comparative results in terms of achieved QoE confirmed the superiority of the RSVTM framework against other alternative recommendation approaches.
Part of our current and future work focuses on studying the behavior of museum visitors in terms of recommendation selection and on improving their perceived QoE under the risk averse and risk seeking aspect of their decision-making process. Current models do not properly address the fact that individuals in real life do not necessarily behave as neutral expected utility maximizers, but they tend to exhibit such behavior especially under uncertainty. Therefore, integrating risk preferences in the involved utility function depicting such deviations in decision-making is of high research and practical importance. Moreover, under this perspective, the concept of announcing different pricing policies per recommendation will be examined as an incentive mechanism to deal with museum congestion. Furthermore, the routing of visitors within the museum as well as the overall planning of the visiting traffic and touring will be studied. Additionally, innovative intrinsic and extrinsic motivation mechanisms will be devised and paired with the previously mentioned incentive mechanism to improve the word-of-mouth reputation of a museum, increase the revisit and engagement of visitors, and facilitate the smooth operation of a museum while increasing its profits. Additionally, stochasticity in visitors’ decision-making processes regarding their optimal visiting time can be considered, which introduces a stochastic time management game where its outcome may lead to variations in individuals’ decisions. Lastly, the proposed model can be extended and adapted in Unmanned Aerial Vehicle (UAV)- assisted networks dealing with capturing mobile users’ QoE levels from being served by the UAV or the macro base station [25,26].

Author Contributions

All authors contributed extensively to the work presented in this paper. E.E.T. had the original idea on which we have based our current work and had the overall coordination in the writing of the article. S.P. was responsible for the overall orchestration of the performance evaluation work. I.L. contributed to the quantitative and qualitative evaluation of the QoE parameters. G.K. developed the code of the overall framework and executed the evaluation experiment. A.T. contributed to the design of the visiting time management framework and to the discussions and analysis of the comparative evaluation results. All authors contributed to the writing of the article.

Acknowledgments

The research of Eirini Eleni Tsiropoulou was partially supported by the UNM Research Allocation Committee award and the UNM Women in STEM Faculty Development Fund. The research of Ioanna Lykourentzou was partially supported by the project CrossCult: Empowering Reuse of Digital Cultural Heritage in Context-Aware Crosscuts of European History, funded by the European Union’s Horizon 2020 research and innovation program, Grant# 693150. The ICCS Research Award under Grant Number 65020601 supported the research of Symeon Papavassiliou.

Conflicts of Interest

The authors declare no conflict of interest.

References

  1. Veron, E.; Levasseur, M. Ethnographie de l’Exposition; Centre Georges Pompidou, Bibliothèque Publique d’Information: Paris, France, 1989. [Google Scholar]
  2. Zancanaro, M.; Kuflik, T.; Boger, Z.; Goren-Bar, D.; Goldwasser, D. Analyzing Museum Visitors’ Behavior Patterns. In User Modeling 2007; Conati, C., McCoy, K., Paliouras, G., Eds.; Lecture Notes in Computer Science; Springer: Berlin/Heidelberg, Germany, 2007; Volume 4511, pp. 238–246. [Google Scholar]
  3. De Rojas, C.; Camarero, C. Visitors’ experience, mood and satisfaction in a heritage context: Evidence from an interpretation center. Tour. Manag. 2008, 29, 525–537. [Google Scholar] [CrossRef]
  4. Sheng, C.W.; Chen, M.C. A study of experience expectations of museum visitors. Tour. Manag. 2012, 33, 53–60. [Google Scholar] [CrossRef]
  5. Roussou, M.; Katifori, A. Flow, staging, wayfinding, personalization: Evaluating user experience with mobile museum narratives. Multimodal Technol. Interact. 2018, 2, 32. [Google Scholar] [CrossRef]
  6. Zeng, B. Cultural Centre, Destination Cultural Offer and Visitor Satisfaction. Sustainability 2017, 9, 1984. [Google Scholar] [CrossRef]
  7. Chittaro, L.; Ieronutti, L. A visual tool for tracing users’ behavior in Virtual Environments. In Proceedings of the Working Conference on Advanced Visual Interfaces, Gallipoli, Italy, 25–28 May 2004; pp. 40–47. [Google Scholar]
  8. Wright, P. The quality of visitors’ experiences in art museums. New Museol. 1989, 119–148. [Google Scholar]
  9. Vincent, F.Y.; Lin, S.W.; Chou, S.Y. The museum visitor routing problem. Appl. Math. Comput. 2010, 216, 719–729. [Google Scholar] [CrossRef]
  10. Chou, S.Y.; Lin, S.W. Museum visitor routing problem with the balancing of concurrent visitors. In Complex Systems Concurrent Engineering; Springer: London, UK, 2007; pp. 345–353. [Google Scholar]
  11. Mathias, M.; Zhou, F.; Torres-Moreno, J.M.; Josselin, D.; Poli, M.S.; Carneiro Linhares, A. Personalized sightseeing tours: A model for visits in art museums. Int. J. Geogr. Inf. Sci. 2017, 31, 591–616. [Google Scholar] [CrossRef]
  12. Martinez-Garcia, E.; Raya-Vilchez, J.; Galí, N. Factors Affecting Time Spent Visiting Heritage City Areas. Sustainability 2018, 10, 1824. [Google Scholar] [CrossRef]
  13. Le Berre, D.; Marquis, P.; Roussel, S. Planning Personalised Museum Visits. In Proceedings of the Twenty-Third International Conference on Automated Planning and Scheduling (ICAPS’13), Rome, Italy, 10–14 June 2013; pp. 1–9. [Google Scholar]
  14. Mathias, M.; Moussa, A.; Zhou, F.; Torres-Moreno, J.M.; Poli, M.S.; Josselin, D.; Rigat, F. Optimisation using natural language processing: Personalized tour recommendation for museums. In Proceedings of the 2014 Federated Conference on Computer Science and Information Systems (FedCSIS), Warsaw, Poland, 7–10 September 2014; pp. 439–446. [Google Scholar]
  15. Lykourentzou, I.; Claude, X.; Naudet, Y.; Tobias, E.; Antoniou, A.; Lepouras, G.; Vassilakis, C. Improving museum visitors’ Quality of Experience through intelligent recommendations: A visiting style-based approach. In Proceedings of the 9th International Conference on Intelligent Environments, Athens, Greece, 16–17 July 2015; pp. 507–518. [Google Scholar]
  16. Tsiropoulou, E.E.; Thanou, A.; Papavassiliou, S. Modelling museum visitors’ Quality of Experience. In Proceedings of the 11th International Workshop on Semantic and Social Media Adaptation and Personalization (SMAP), Thessaloniki, Greece, 20–21 October 2016; pp. 77–82. [Google Scholar]
  17. Tsiropoulou, E.E.; Thanou, A.; Papavassiliou, S. Quality of Experience-based museum touring: A human in the loop approach. In Social Network Analysis and Mining; Springer: New York, NY, USA, 2017. [Google Scholar]
  18. Tsiropoulou, E.E.; Thanou, A.; Papavassiliou, S. Self-organizing museum visitor communities: A participatory action research based approach. In Proceedings of the 12th International Workshop on Semantic and Social Media Adaptation and Personalization (SMAP), Bratislava, Slovakia, 9–10 July 2017; pp. 101–105. [Google Scholar]
  19. Osche, P.E.; Castagnos, S.; Napoli, A.; Naudet, Y. Walk the line: Toward an efficient user model for recommendations in museums. In Proceedings of the 11th International Workshop on Semantic and Social Media Adaptation and Personalization (SMAP), Thessaloniki, Greece, 20–21 October 2016; pp. 83–88. [Google Scholar]
  20. Chen, M.; Challita, U.; Saad, W.; Yin CDebbah, M. Machine learning for wireless networks with artificial intelligence: A tutorial on neural networks. arXiv, 2017; arXiv:1710.02913. [Google Scholar]
  21. Apostolopoulos, P.A.; Tsiropoulou, E.E.; Papavassiliou, S. Demand Response Management in Smart Grid Networks: A Two-Stage Game-Theoretic Learning-Based Approach. Mob. Netw. Appl. 2018, 1–14. [Google Scholar] [CrossRef]
  22. Xu, Y.; Wang, J.; Wu, Q. Distributed learning of equilibria with incomplete, dynamic, and uncertain information in wireless communication networks. In Game Theory Framework Applied to Wireless Communication Networks; IGI Global: Hershey, PA, USA, 2016; pp. 63–86. [Google Scholar]
  23. Apostol, T.M. Calculus. One-Variable Calculus with an Introduction to Linear Algebra; John Wiley and Sons Ltd.: Hoboken, NJ, USA, 1966; Volume 1. [Google Scholar]
  24. Questionnaire 2018. Available online: https://goo.gl/forms/zf4WDFADPuZ9iF1x2 (accessed on 6 November 2018).
  25. Sanjab, A.; Saad, W.; Başar, T. Prospect theory for enhanced cyber-physical security of drone delivery systems: A network interdiction game. arXiv, 2017; arXiv:1702.04240. [Google Scholar]
  26. Mozaffari, M.; Saad, W.; Bennis MDebbah, M. Unmanned aerial vehicle with underlaid device-to-device communications: Performance and tradeoffs. IEEE Trans. Wirel. Commun. 2016, 15, 3949–3963. [Google Scholar] [CrossRef]
Figure 1. Joint Recommendation Selection and Visiting Time Management (RSVTM) framework as a learning system.
Futureinternet 10 00108 g001
Figure 2. Visiting efficiency function for different visiting styles of the museum visitors.
Futureinternet 10 00108 g002
Figure 3. Visitors’ QoE as a function of their ID (a) under the RSVTM algorithm and (b) assuming that all visitors select the best recommendation (Recommendation C) in terms of potentially achieved QoE.
Futureinternet 10 00108 g003
Figure 4. Convergence of RSVTM algorithm to the recommendation selections as a function of the timeslots.
Futureinternet 10 00108 g004
Figure 5. Distribution of the visitors for the recommendations for all the visiting styles.
Futureinternet 10 00108 g005
Figure 6. Average QoE and average visiting time for all the visiting styles.
Futureinternet 10 00108 g006
Figure 7. (a) RSVTM Running time and number of visitors’ deviation (with respect to b = 0.2) vs. learning rate b. (b) Average QoE and average visiting time vs. learning rate b.
Futureinternet 10 00108 g007
Figure 8. QoE as a function of the number of visitors for all the comparative scenarios. (a) Average QoE. (b) Total QoE.
Futureinternet 10 00108 g008
Figure 9. Average visiting time as a function of the number of visitors for all the comparative scenarios.
Futureinternet 10 00108 g009

