Article

Prospects of Forage Production in Northern Regions under Climate and Land-Use Changes: A Case-Study of a Dairy Farm in Newfoundland, Canada

1
Lethbridge Research and Development Centre, Agriculture and Agri-Food Canada, Lethbridge, AB T1J 4B1, Canada
2
USDA-ARS-Pasture Systems and Watershed Management Research Unit, USDA-ARS, Building 3702, Curtin Road, University Park, State College, PA 16802, USA
3
Pacific Agri-Food Research Centre, Agriculture and Agri-Food Canada, Agassiz, BC V0M 1A0, Canada
4
St. John’s Research and Development Centre, Agriculture and Agri-Food Canada, 308 Brookfield Road, Bldg. 25, St. John’s, NL A1E 0B2, Canada
*
Author to whom correspondence should be addressed.
Agronomy 2019, 9(1), 31; https://doi.org/10.3390/agronomy9010031
Submission received: 21 December 2018 / Revised: 4 January 2019 / Accepted: 10 January 2019 / Published: 12 January 2019
(This article belongs to the Section Farming Sustainability)

Abstract

:
Forage production in northern latitudes is challenging and uncertain in the future. In this case-study, the integrated farm system model (IFSM) was used to assess the impact of climate change and cropland expansion scenarios on forage production in a dairy farm in Newfoundland, Canada. Climatic projections indicated increases in temperature in the recent past (1990–2016) and under any future climate (2020–2079), thus enhancing agronomic performance. Temperature increases ranged from 2.8 °C to 5.4 °C in winter and from 3.2 °C to 6.4 °C in spring. Small precipitation increases (<10%) create narrower time windows to perform farm operations in the already stringent condition of excess moisture in the region. Results of land use scenarios including expansions of 20, 30, and 40% in cropland area, out of which 5% was dedicated to corn silage and the remainder to grass-legume mixtures, indicated increased yield and total production. Improvements in grass-legume yield ranged from 8% to 52%. The full range of production increases ranged from 11% to 105%. Increments in corn silage yield ranged from 28% to 69%. Total farm corn silage production increases ranged from 29% to 77%. An attainable cropland expansion of 20% would enable the farm to become self-sufficient in forage production under any climate scenario.

1. Introduction

Climate change poses a threat to increased food production in some regions, but it may have a positive impact on agricultural production in northern regions due to increases in temperature [1,2]. Expansion of agricultural land and enhancing productivity of existing arable land are expected to take place in northern regions such as Canada due to temperature effects [2,3,4,5,6]. However, future projections are usually available only for regions with relatively better physiographic and agronomic conditions (e.g., the provinces of Quebec and Alberta), while other regions with more stringent conditions (e.g., unfavorable climate and limited arable land) lack specific assessments.
The island of Newfoundland is an example of such a region. On the Atlantic coast of Canada, the island is at the extreme northern limit for corn adaptation, as the minimum requirements for corn heat unit (CHU) accumulation (to reach maturity) are barely met so field corn may be started under a plastic mulch [7]. Due to the short growing season and harsh conditions [8], Newfoundland′s climate is challenging for agricultural production [9]. The availability of good arable land is also limited because the soils are generally acidic, stony, and poorly drained [9]. In the 1990s, only 1% of Newfoundland’s land mass was considered suitable for agriculture [10].
Despite these challenges, there are positive prospects for agricultural production in Newfoundland. There is evidence of a warming trend in the 1990′s as compared to the previous period between 1945 and 1980, with greater heat unit accumulation that suggests significant long-term benefits for agriculture in the province [7]. A recent analysis based on growing degree days estimated from future-climate datasets in the boreal region, where Newfoundland is located, indicated that by 2099 agricultural feasibility will increase from the current 32% to 76% of the boreal region area, with the leading edge of the feasible growing degree-days (GDD) shifting northwards up to 1200 km [2]. There have also been recent initiatives to expand the agricultural land base in the province [2] with 64,000 hectares of Crown land being turned into land for farming [11]. Combined, these climatic and land use changes represent an opportunity for Newfoundland to increase its agricultural production in the future.
While these prospects are promising, a specific assessment of increases in agricultural production due to climate change and cropland expansion at farm scale is lacking for the province. Evaluation of the impact of these changes on forage production would be particularly important for the livestock industry in Newfoundland, especially for the dairy industry, which is approximately 85% self-sufficient in forage production [12] and depends solely on imports of all feed grains and other supplements [9].
Impacts of climate and land use change at farm scale can be assessed using agricultural system models that simulate effects of various management practices, crops, soils, water, and climate on both production and environment [13]. Whole-farm modelling of cattle operations has proven to be a very useful tool for assessing cropping, animal, and soil systems, including the impact of grazing systems [14] and climate change [4,5,6,15] on farm production, and the impact of management on greenhouse gas (GHG) emissions [16,17,18,19,20].
The objective of this work was to simulate a representative dairy farm in the more populous region of Newfoundland as a case-study to assess the increase in forage production due to climate change and cropland expansion using the integrated farm system model (IFSM). Such quantitative assessment on a representative farm, although not necessarily representative of the entire province, would provide practical insights about the expected trends in forage production in the future given the reduced number of dairy farms in that province (i.e., 31 farms in 2016; [21]). Insights gained from this case-study assessment are therefore invaluable for promoting the long-term sustainability of the dairy industry in Newfoundland.

2. Materials and Methods

2.1. Physiography and Farm Characteristics

The dairy farm modelled in this study was selected because it is typical of modern operations in Newfoundland and it is located near the more populated eastern region of the island near St. John’s (47.56° N, 52.71° W). Also, its self-sufficiency in forage production (~83%) is similar to the provincial average (~85%) and the forage deficit is met by local purchases. The region has high snowfall and is very humid with a warm summer climate (Dfb), according to the updated Köppen-Geiger climate classification [22]. The long-term (1981–2010) annual mean, maximum, and minimum daily air temperatures are 5, 9, and 1 °C, respectively, while the long-term annual precipitation for the same period is 1534 mm with approximately 78% deposited as snow (St. John’s Airport station; [23]). The long-term GDD above 5 °C averages 1287 [23]. A long-term seasonal CHU rating (i.e., heat accumulation between planting and corn physiological maturity) is not available, but it has been estimated at 1933 across three sites in St. John’s in two years (i.e., 2000 and 2001) between typical planting (28 May) and harvesting (20 September) dates [7], which is equivalent to a relative corn maturity of 64 days [24]. This estimate is similar to the long-term (1990–2016) average CHU of 1987 calculated from the dataset used in our study. The soils in the farm area belong to the Pouch Cove soil series (Canadian taxonomy), which is a Gleyed Humo-Ferric Podzol soil originating from till parent material and having a silt clay loam texture, poor drainage, and a slope of 5% in the northern direction [25,26]. Tiles are used to improve the soil drainage in the entire cropped areas (corn, small grains, and grass-legume).
The dairy herd includes 230 Holstein cows distributed among (i) a high dietary energy intake group of 90 lactating multiparous and primiparous cows, (ii) a low dietary energy intake group of 102 lactating multiparous and primiparous cows, and (iii) a non-lactating group of 38 cows. This herd size is above the average dairy farm size in Newfoundland(i.e., 165 cows; [27]). The farm uses a year-round calving strategy and maintains 80 calves, 80 young heifers, and 120 bred heifers (430 kg body weight at breeding). The diet fed to the lactating cows (average of high and low dietary energy intake) is comprised of 60% forage silage (grass, grass-legume, corn, and cereal-pea) and 40% dry grains (mostly imported corn grain) and supplements. The feedstuffs are blended and fed as a total mixed ration. The productivity of the herd (based on all lactating and non-lactating cows) is 31.6 kg of fat and protein corrected milk (FPCM) cow−1 day−1. Cows are milked twice a day in a double 10-slot Herringbone parlor. The lactating animals are housed in a free stall barn, dry cows and heifers are housed in a loose-housing barn, and calves are located in a third barn. Excreta are removed from housing facilities with a scraper system and stored as slurry in an uncovered lagoon with a six-month storage capacity. The lagoon is agitated prior to pumping out for manure application to cropland.
The dairy operation comprises 221.5 ha of cultivated land distributed among 117 ha of seeded grass (timothy/tall fescue), 21 ha of a grass-legume mix (i.e., timothy-white-red clover) seeded at a 5:1 grass:legume ratio by seed weight, 45 ha of corn (Zea mays L.) silage, and 38.5 ha of peas-oats silage. Transparent plastic mulch is used in corn to prevent frost and warm up the soil [28]. Manure is broadcast at 55 m3 ha−1 once a year (spring) on grass and grass-legume stands and twice a year on corn fields (55 m3 ha−1 per application) in spring and fall applications. Using average nutrient content from dairy lagoon effluent [29], this application rate is equivalent to 40.2 kg N ha−1 and 8.8 kg P ha−1 per application. In addition, crops received annual application of synthetic fertilizer. First cut pure grass received 280 kg ha−1 of 30-5-15 and 2nd and 3rd cuts received 300 kg ha−1 of 23-7-23 (grass-legume received 62% of those rates in the respective cuts); corn silage and peas-oats silage received 153 and 325 kg ha−1 of 36-0-0 (spring), respectively. Pure grass and legume-grass received 56 kg P ha−1 fertilizer (Table 1).
Grass and grass-legume fields are harvested in three cuts typically around 29 May, 20 July, and 20 September, and are disc harrowed every five years before reseeding around 1 March. Corn fields are chisel-plowed and power harrowed before planting and planted around 20 May in 75-cm rows with a corn planter at a density of 93,000 plants ha−1. The corn is harvested around 12 October using a self-propelled corn harvester with a kernel processor. The peas-oats crop is seeded around 20 May on soil prepared by disc-harrowing. The crop is harvested as silage after about 48 days (early July) with a self-propelled harvester. A second crop is planted and fertilized after the first harvest when conditions allow (on average, every five years). Applications of N and P are shown in Table 1.
Long-term forage yield and quality parameters obtained from the farmer are presented in Table 2. Grass and grass-legume forage silage is stored in four horizontal bunker silage storage areas (average size 8.5 × 48.8 × 2.7 m). Dry hay is stored as square bales. Peas-oats silage is layered over the grass silage, which helps to reduce seepage. Corn silage is stored in a single bunker (14.3 × 50.3 × 2.7 m) packed by driving a tractor over top. Monthly forage quality analyses were performed by a commercial laboratory.

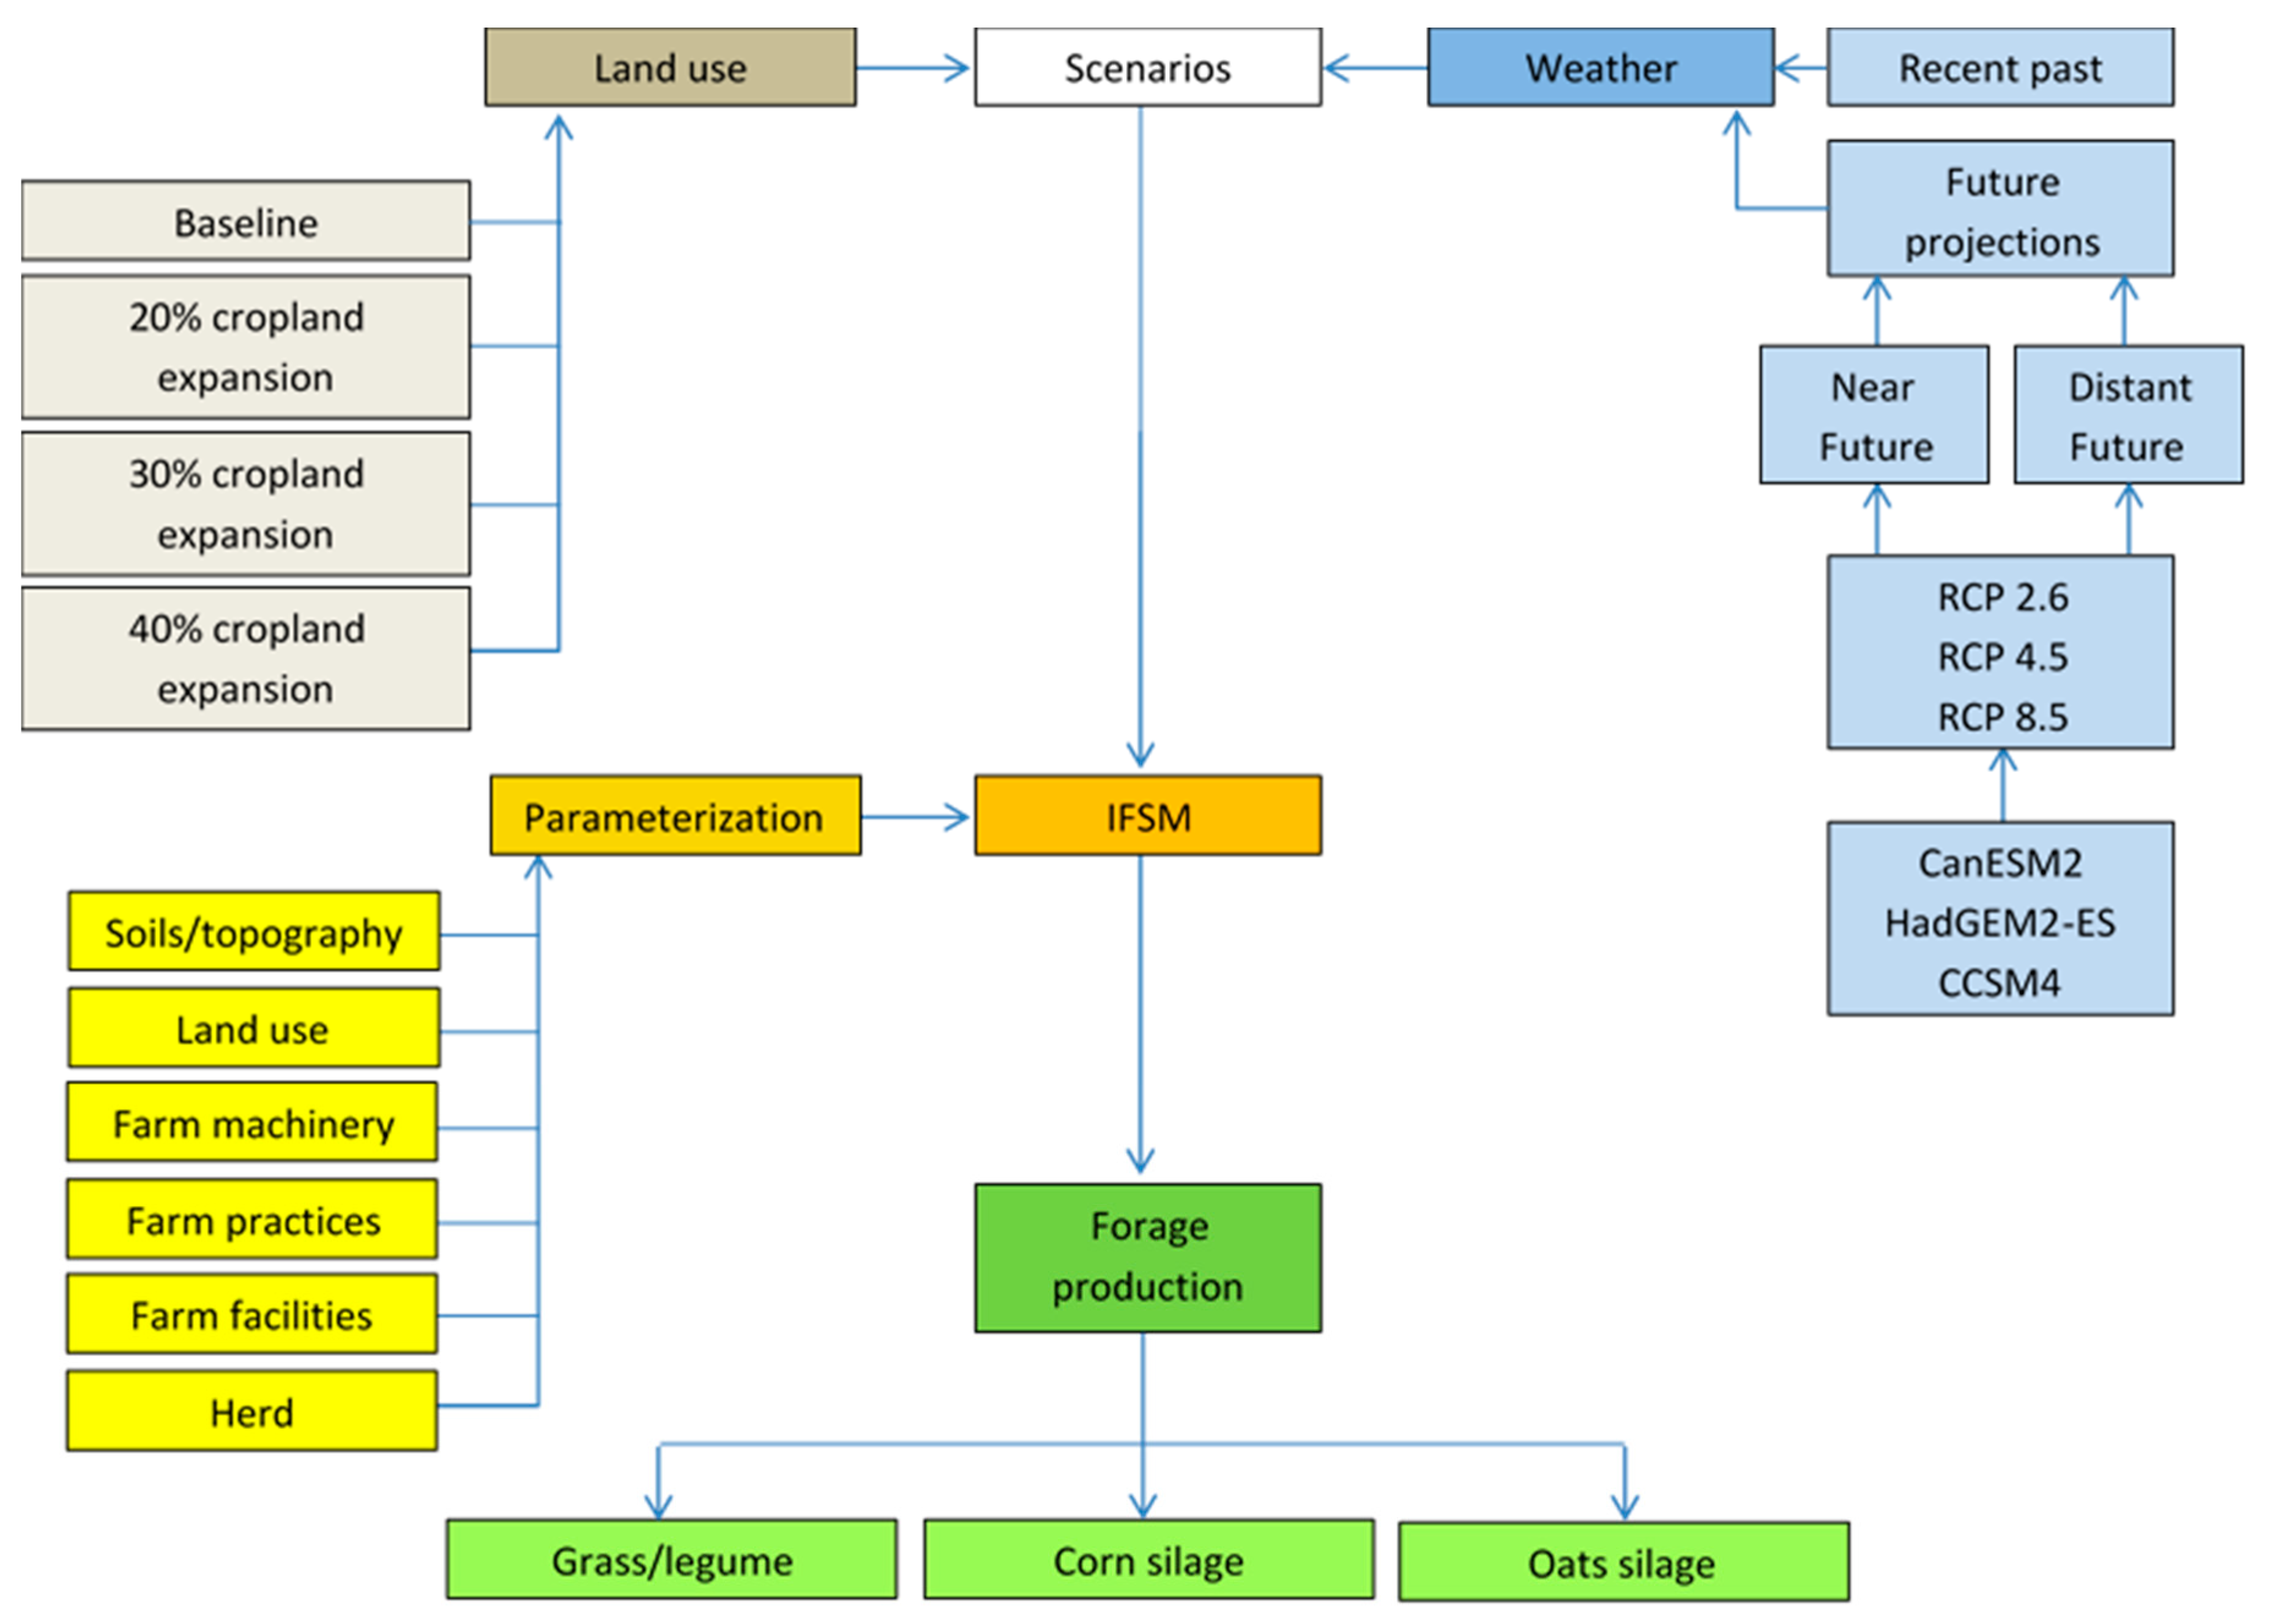
2.2. Integrated Farm System Model

The IFSM (version 4.2; [30]) is a process-based, whole-farm model comprising nine major aspects of the farm: crop and soil, grazing, machinery, tillage and planting, crop harvest, crop storage, herd and feeding, manure storage and handling, and economics. While these components are integrated in the model (e.g., crop harvest depends on machinery and manure production depends on feeding and herd components), this study focuses on crop production; thus, some components of the models (e.g., nutrient dynamics and economics) are not discussed. The IFSM has been shown to adequately simulate crop yields of grasses, corn, and small grains under actual climate conditions in northern regions of North America, including eastern Canada [31], but has not been assessed under very cool maritime conditions, such as those found in Newfoundland. The model runs in a daily time-step using daily data for solar radiation (MJ m−2), mean temperature (°C), maximum temperature (°C), minimum temperature (°C), precipitation (mm), and average wind speed (m s−1).
The IFSM crop component features five sub-models for simulating crop growth of alfalfa monocultures, perennial forage, corn, small grains, and soybean [32]. In the present study, only the perennial grass, corn, and small grain (oats) sub-models were used. Note that grazing is not practiced on dairy farms in Newfoundland. The soil tractability for field operations is estimated by the model; tillage, planting, and crop-harvest operations are allowed within user-defined periods when the soil and weather conditions are suitable for fieldwork. The model also predicts available soil moisture and available soil N for the growth and development of each crop.
IFSM simulates feed storage losses from a number of different storage types [32]. Feed allocation and animal performance are related to the nutritive value of homegrown and imported feeds. The model formulates least-cost diets using linear programming for up to six animal groups (for this study: lactating cows (all groups) and young stock (heifers)), making use of homegrown feeds and purchased supplements if homegrown feeds are not sufficient to support the herd. Purchased supplements include hay, alfalfa/grass silage, grain silage, and grain concentrates.
The water balance components (i.e., precipitation, runoff, evapotranspiration, moisture migration, and drainage) are simulated through each time step to predict the moisture status in multiple layers of the soil profile, which is used for modelling crop growth and predicting nutrient losses [32].

2.3. Past and Future Climate Data

Simulations for the study farm were carried out for three periods: reference (1990–2016), near future (2020–2049), and distant future (2050–2079) [4]. The reference period used actual weather data (St. John’s Airport; [33]) for all required variables, except solar radiation. Occasional data gaps were infilled using nearby stations (St. Johns West Climate (station ID 48871), and St. John’s West CDA CS (station ID 27115)). Solar radiation was measured only until 1998; thus, a modelled time series was produced for this variable using the Hargreaves and Samani model [34,35]. This model was chosen because it performed well in Canada [35] and was easily parameterized using maximum and minimum daily temperature and an empirical coefficient (KRS) to adjust the temperature-corrected extraterrestrial solar radiation. This coefficient was estimated and validated from solar radiation measurements collected from 1964 to 1998.
Climate data for the near and distant future periods were acquired for each of three Representative Concentration Pathways (i.e., RCP 2.6, RCP 4.5, and RCP 8.5; [36]), which are a scenario sets containing emission, concentration, and land-use trajectories [37]. Daily temperatures (maximum and minimum) and precipitation data were acquired from the Pacific Climate Impacts Consortium (PCIC) database for three general circulation model (GCM) projections from the Coupled Model Intercomparison Project Phase 5 (CMIP5; [38]). The data were previously downscaled based on historical daily gridded climate data for Canada [39,40]. The three GCM used were CanESM2 [41], HadGEM2 [42], and CCMS4 [43]. The first two GCMs were used in previous IFSM studies in Canada [4,5,6], while the latter was used in several regions across the United States [44].
While recent reports question RCP 2.6 as a realistically achievable target [45,46], it has been included in the present analysis to represent the most optimistic (i.e., reduced CO2 emissions) future change in climate. Wind speed conditions were assumed to be unaffected by changes in climate (i.e., no trend when compared to the historical period) [4] and were estimated by fitting a Weibull distribution [47] to monthly historical data (12 distributions in total) and projecting future values. The procedure used to estimate solar radiation for the reference period was also used for future projections after removing the future trend in increasing temperature.
The direct effect of elevated CO2 on crops (i.e., the fertilization effect) is accounted for in IFSM by modelling plant C fixation (i.e., growth) as a function of atmospheric CO2 concentration [4]. Thus, atmospheric CO2 concentrations were adjusted for the three time periods modelled: 390 μmol mol−1 for the reference period, 428 and 441 μmol mol−1 for near and distant future periods under RCP 2.6, 436 and 507 μmol mol−1 for near and distant future periods under RCP 4.5, and 451 and 607 μmol mol−1 for near and distant future periods under RCP 8.5, respectively [36].

2.4. Scenario Assessments

The impact of expanded forage crop area and climate change on grass-legume and corn silage production was assessed as future scenarios. Based on consultation with the farmer, total cropland expansions of 20% (i.e., 15% expansion of grass-legume and 5% of corn silage), 30% (i.e., 25% expansion of grass-legume and 5% of corn silage), and 40% (i.e., 35% expansion of grass-legume and 5% of corn silage) were simulated under the different RCP and periods considered in the analysis (Figure 1). The limited corn expansion in all scenarios is because only marginal land is available for cropland expansion on the farm, which was considered by the farmer suitable only for grass cropping. The analysis considered crop yields entering storage, therefore after accounting for harvest losses.
A total of 76 farm simulations (three GCM (CanESM2, HadGEM2-ES, CCSM4) × three RCP (2.6, 4.5, 8.5) × two periods (near and distant future) × four land used scenarios (baseline, 30, 20, and 40% cropland expansions) + four land use scenarios under current climate) were run to encompass all the current and projected cropland and climate scenarios. For each RCP, an ensemble approach using three downscaled GCM was used to represent the effect of climate variability (Section 2.3). The 90% confidence interval calculated from the three climate models is reported as a measure of uncertainty of climate data (i.e., temperature and precipitation), while the standard deviation of the IFSM results using the three GCM listed above represent uncertainty of the farm’s agronomic performance as influenced by variation in climate.
The GDD (Equation (1); [48]) and CHU approaches (Equations (2) through (4); [49]) were used to assess agronomic potential of grass-legume and corn silage, respectively, for the reference and future periods.
G D D = d a i l y   a v e r a g e   t e m p e r a t u r e   ( ° C ) b a s e   t e m p e r a t u r e   ( ° C )
C H U   =   ( X + Y ) / 2
where
X = 1.8 · ( T m i n 4.4 )   i f   T m i n 4.4   ° C   or   X = 0   i f   T m i n < 4.4   ° C
Y = 3.3 · ( T m a x 10 ) 0.083 · ( T m a x 10 ) 2   i f   T m a x 10   ° C or   Y = 0   i f   T m a x < 10   ° C
Seasonal GDD for grass-legume was calculated with a base temperature of 0 °C [50,51,52]. The seasonal GDD defined the growing season for grass-legume and was calculated as the sum of daily GDD between 1 March (Julian day 60) and 20 September (Julian day 263), which are typical in this region. Seasonal CHU was calculated as the sum of daily CHU between 20 May (Julian day 140) and 12 October (Julian day 285). Seasonal (or effective) GDD [23] and CHU [7] were used because they account for accumulation during the active growth period. Trend analyses using the Mann–Kendall test [53] were performed for temperature, GDD, and CHU in R using the Kendall package [54]. Trends were considered statistically significant at a significance level of 5%.

2.5. Caveats and Assumptions

A series of assumptions were made in the present modelling exercise. Firstly, milk yield per cow was assumed to remain constant in the future. This assumption was made because milk production in this region is hard to project due to many aspects involved in the supply management system [55]. Another important assumption was that planting and harvest dates did not change. It is recognized that these dates may vary with a warming climate [56,57], but the future effect of rainfall on field tractability cannot be predicted. Hence, this change was not incorporated in the present simulations. As well, future crop genetic improvement or potential new management were not considered.

3. Results

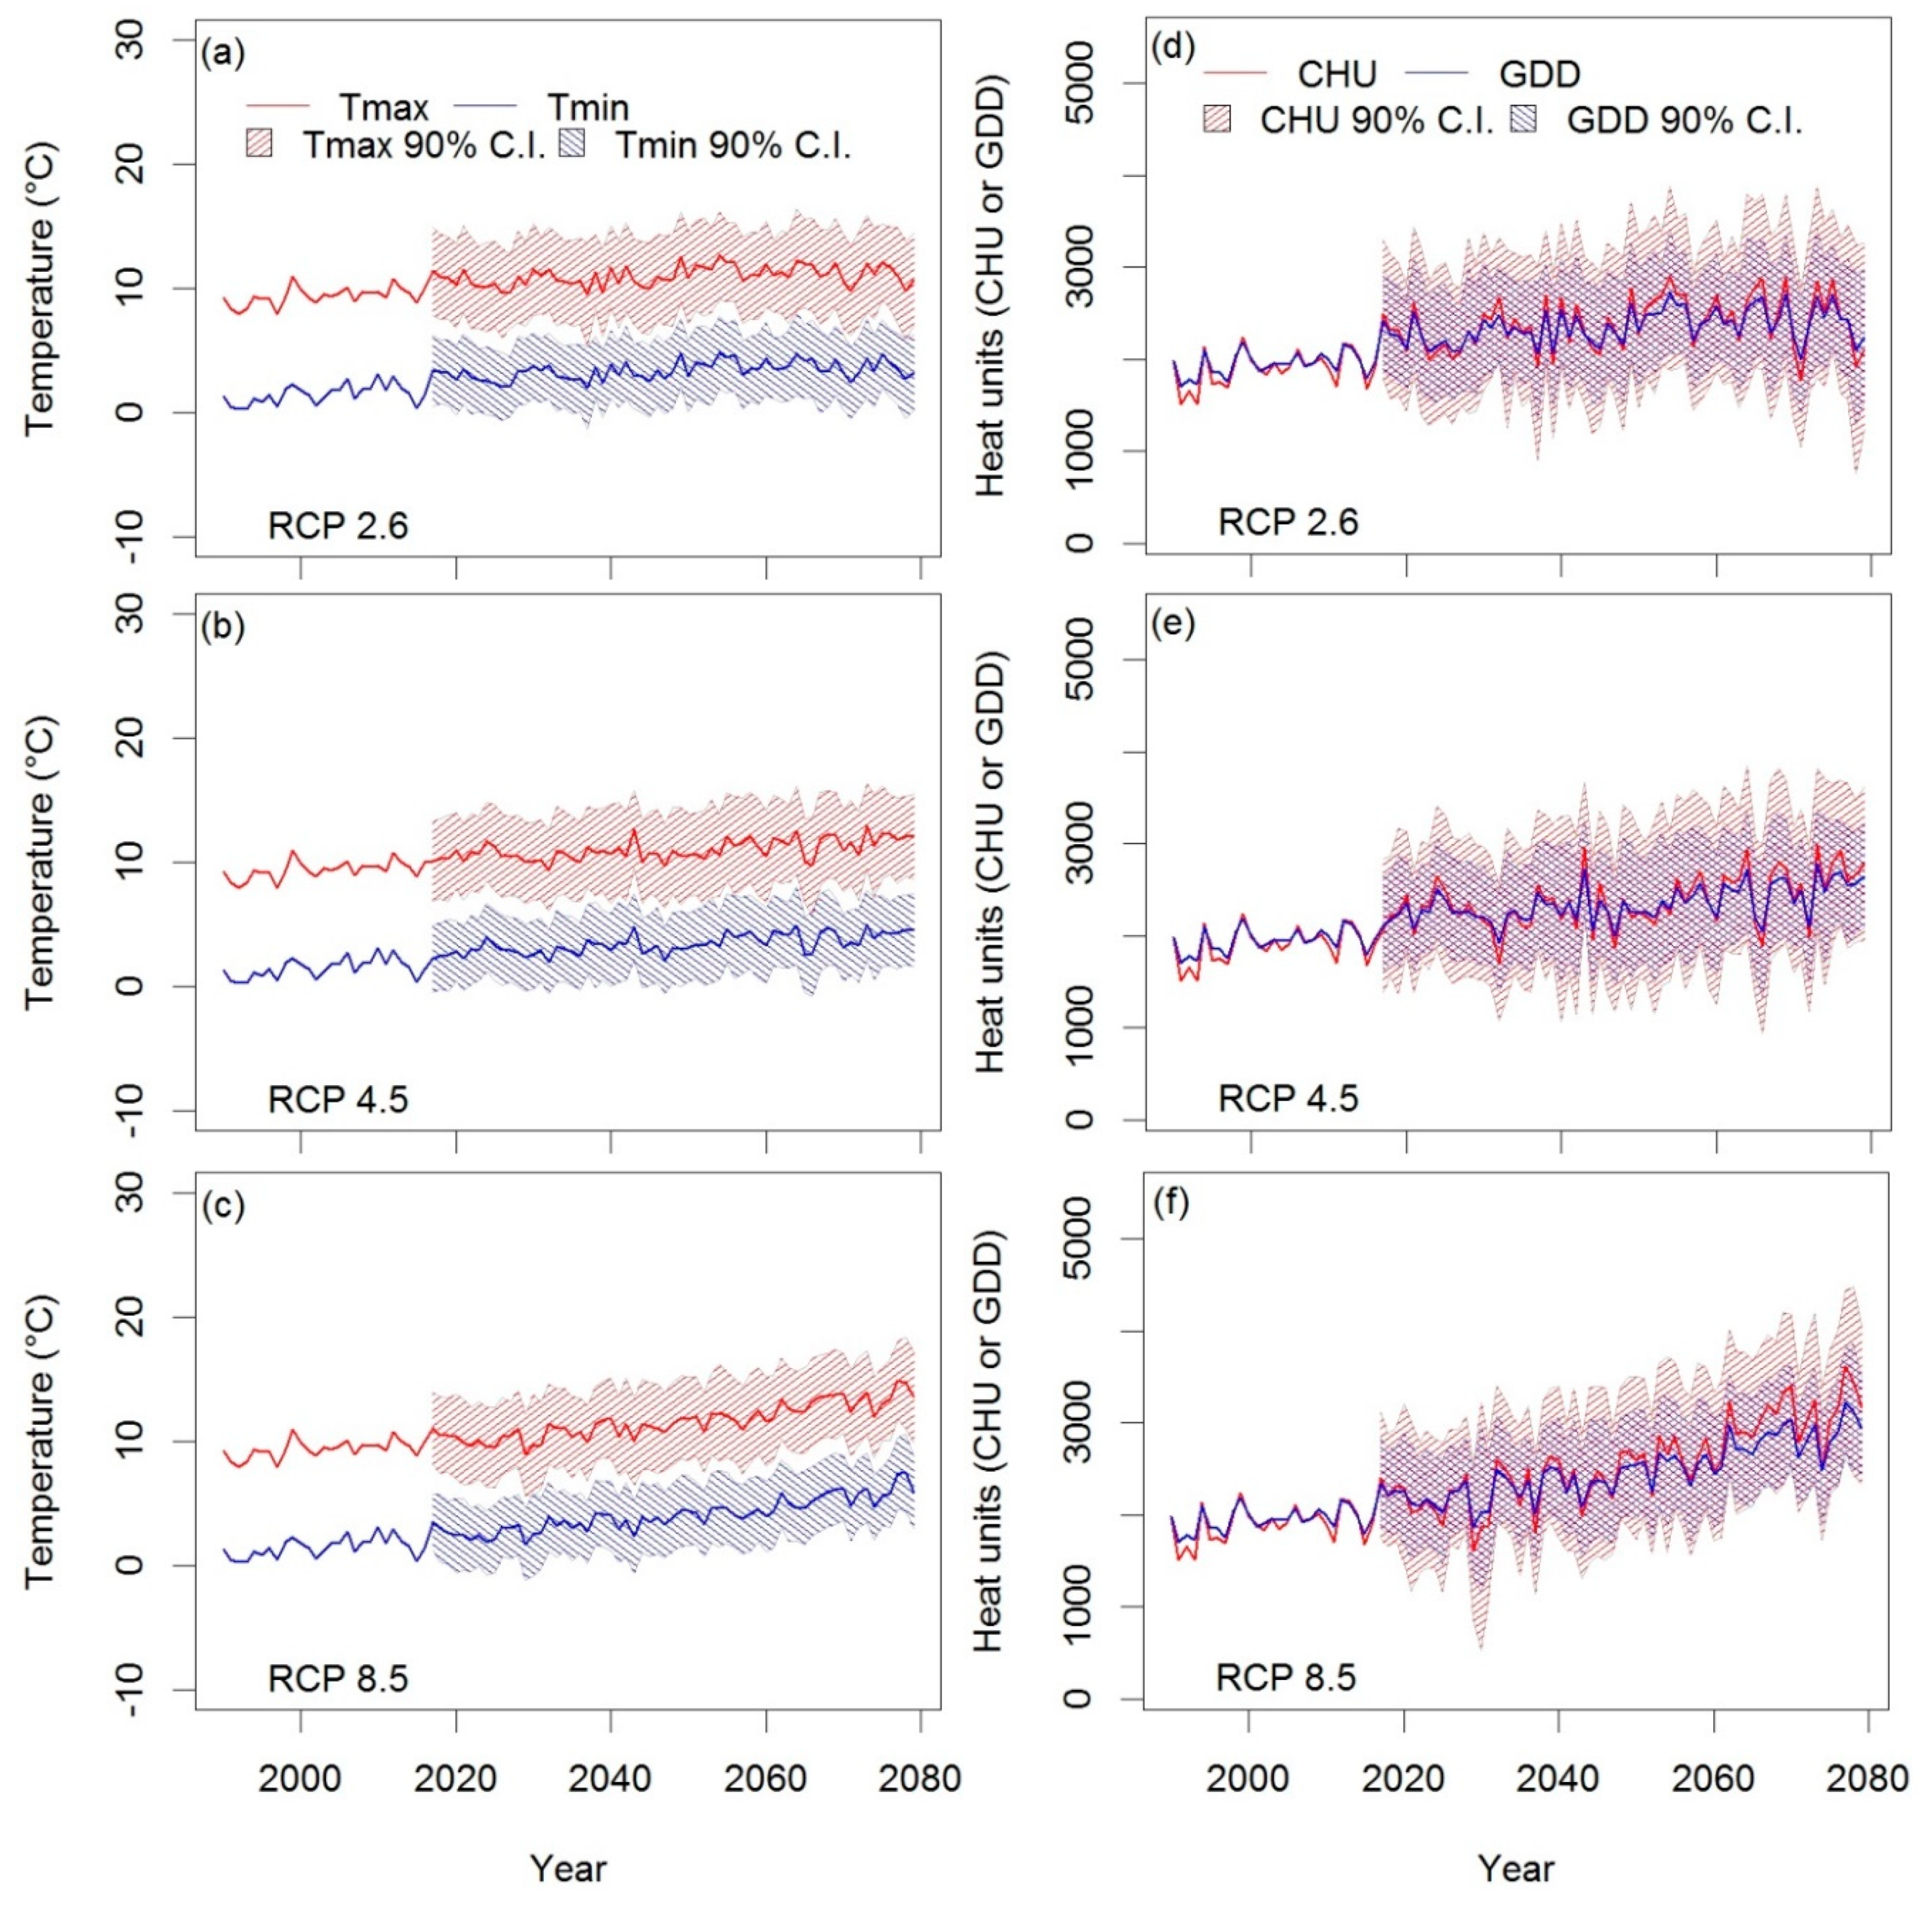
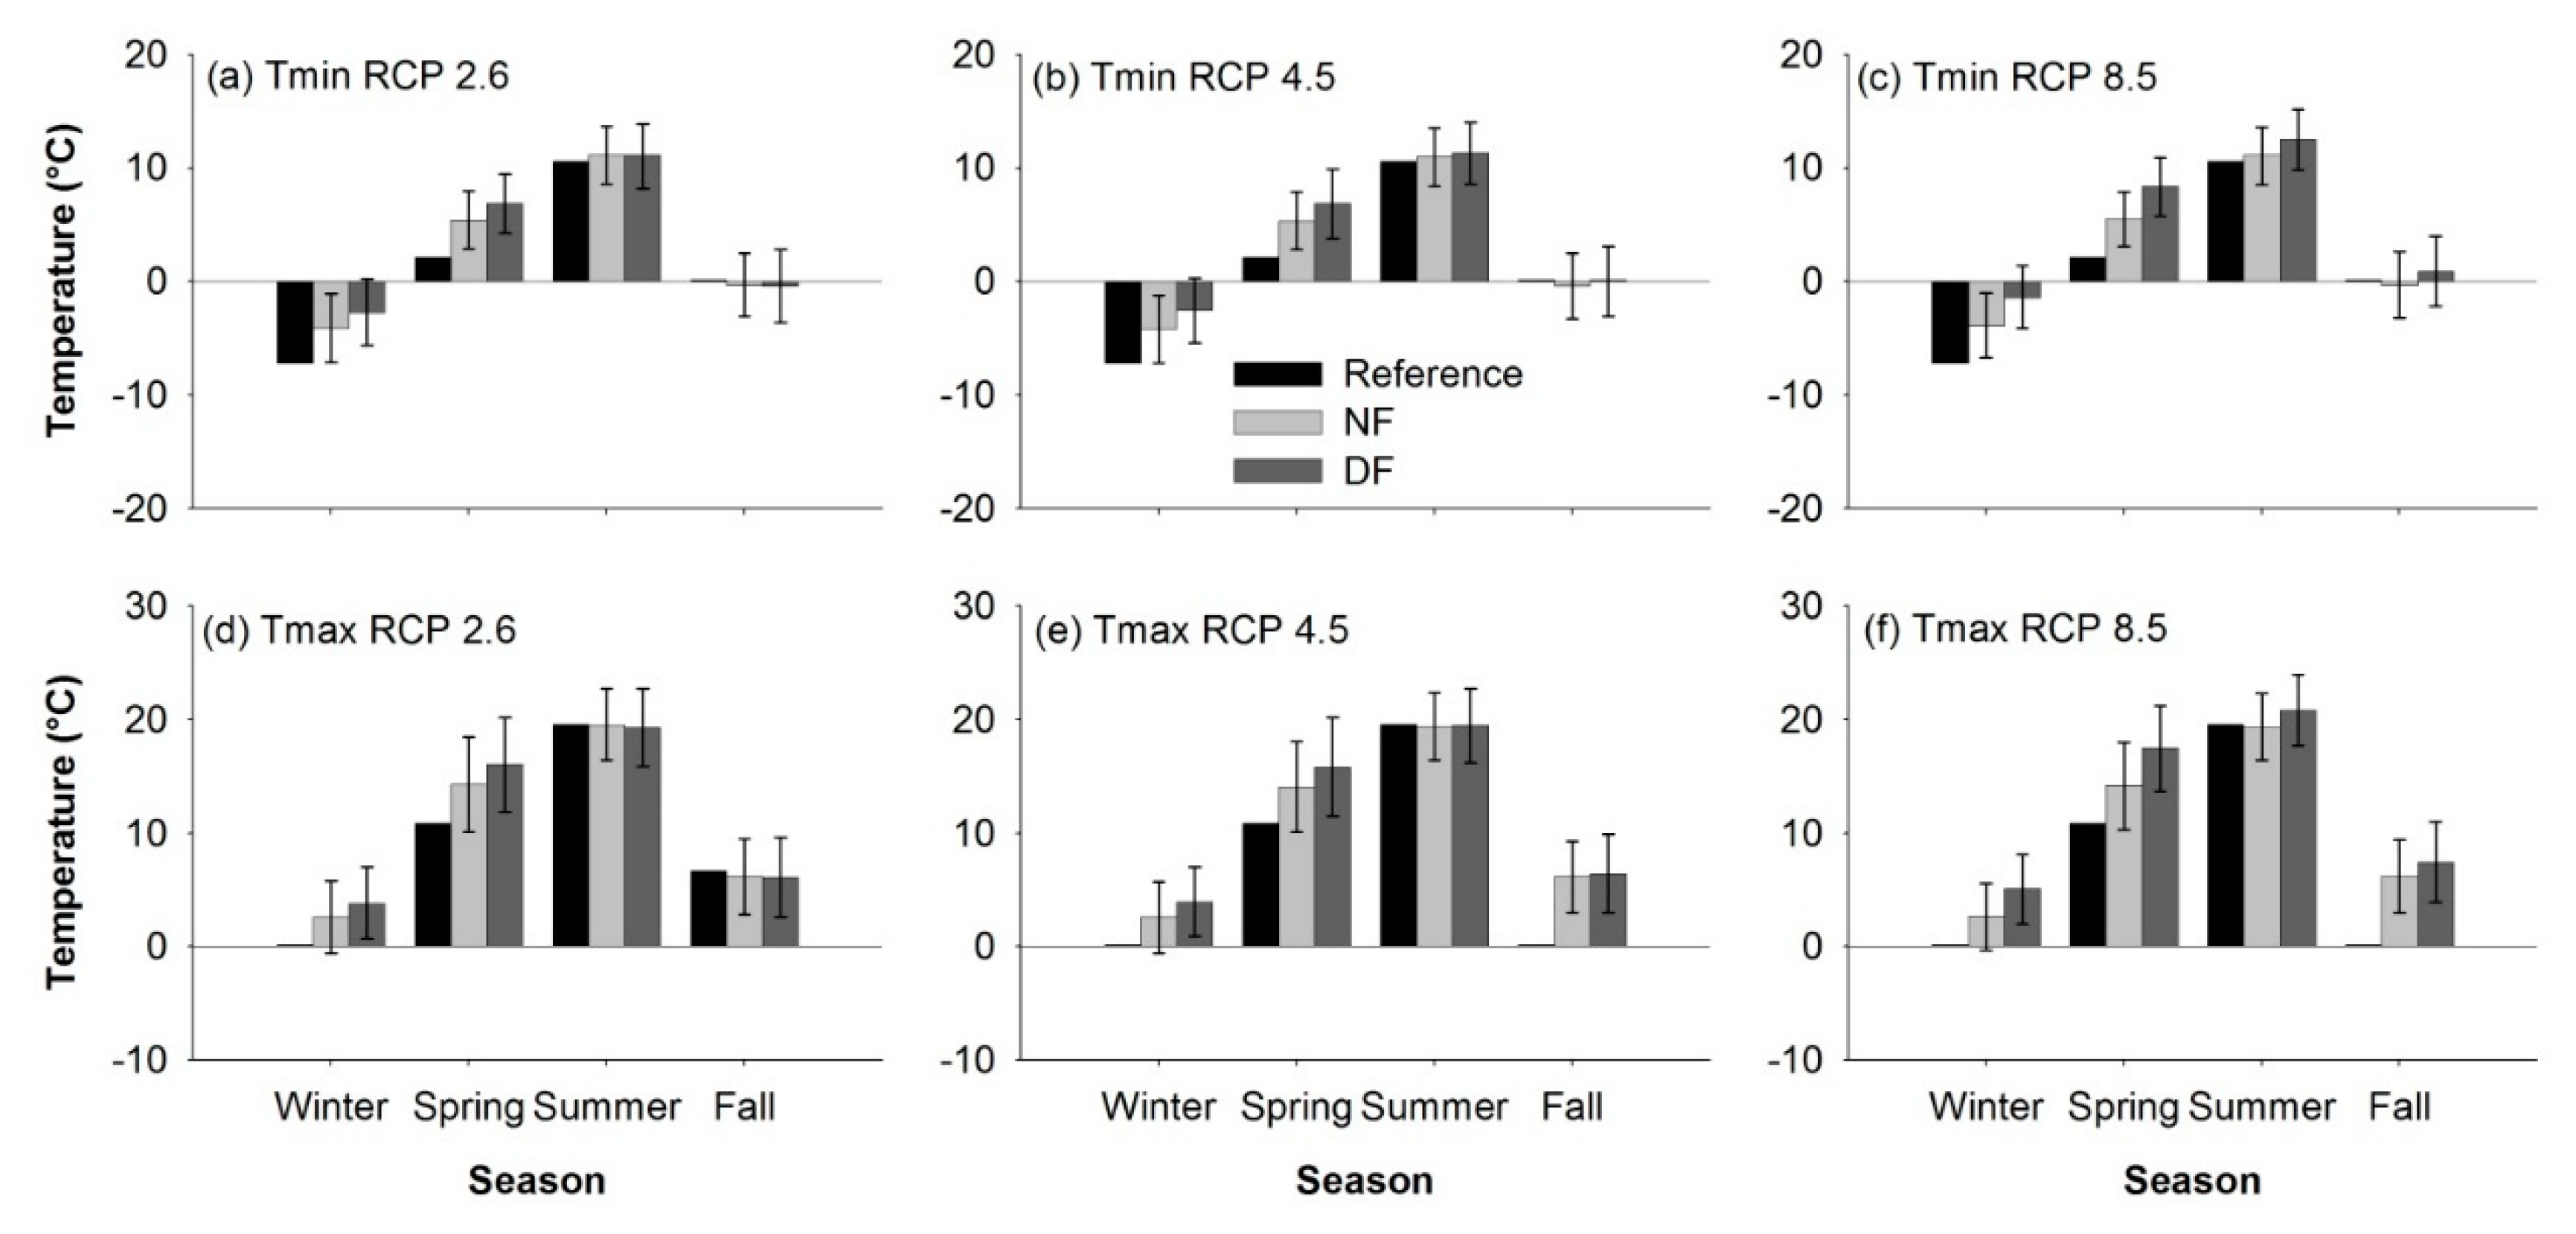
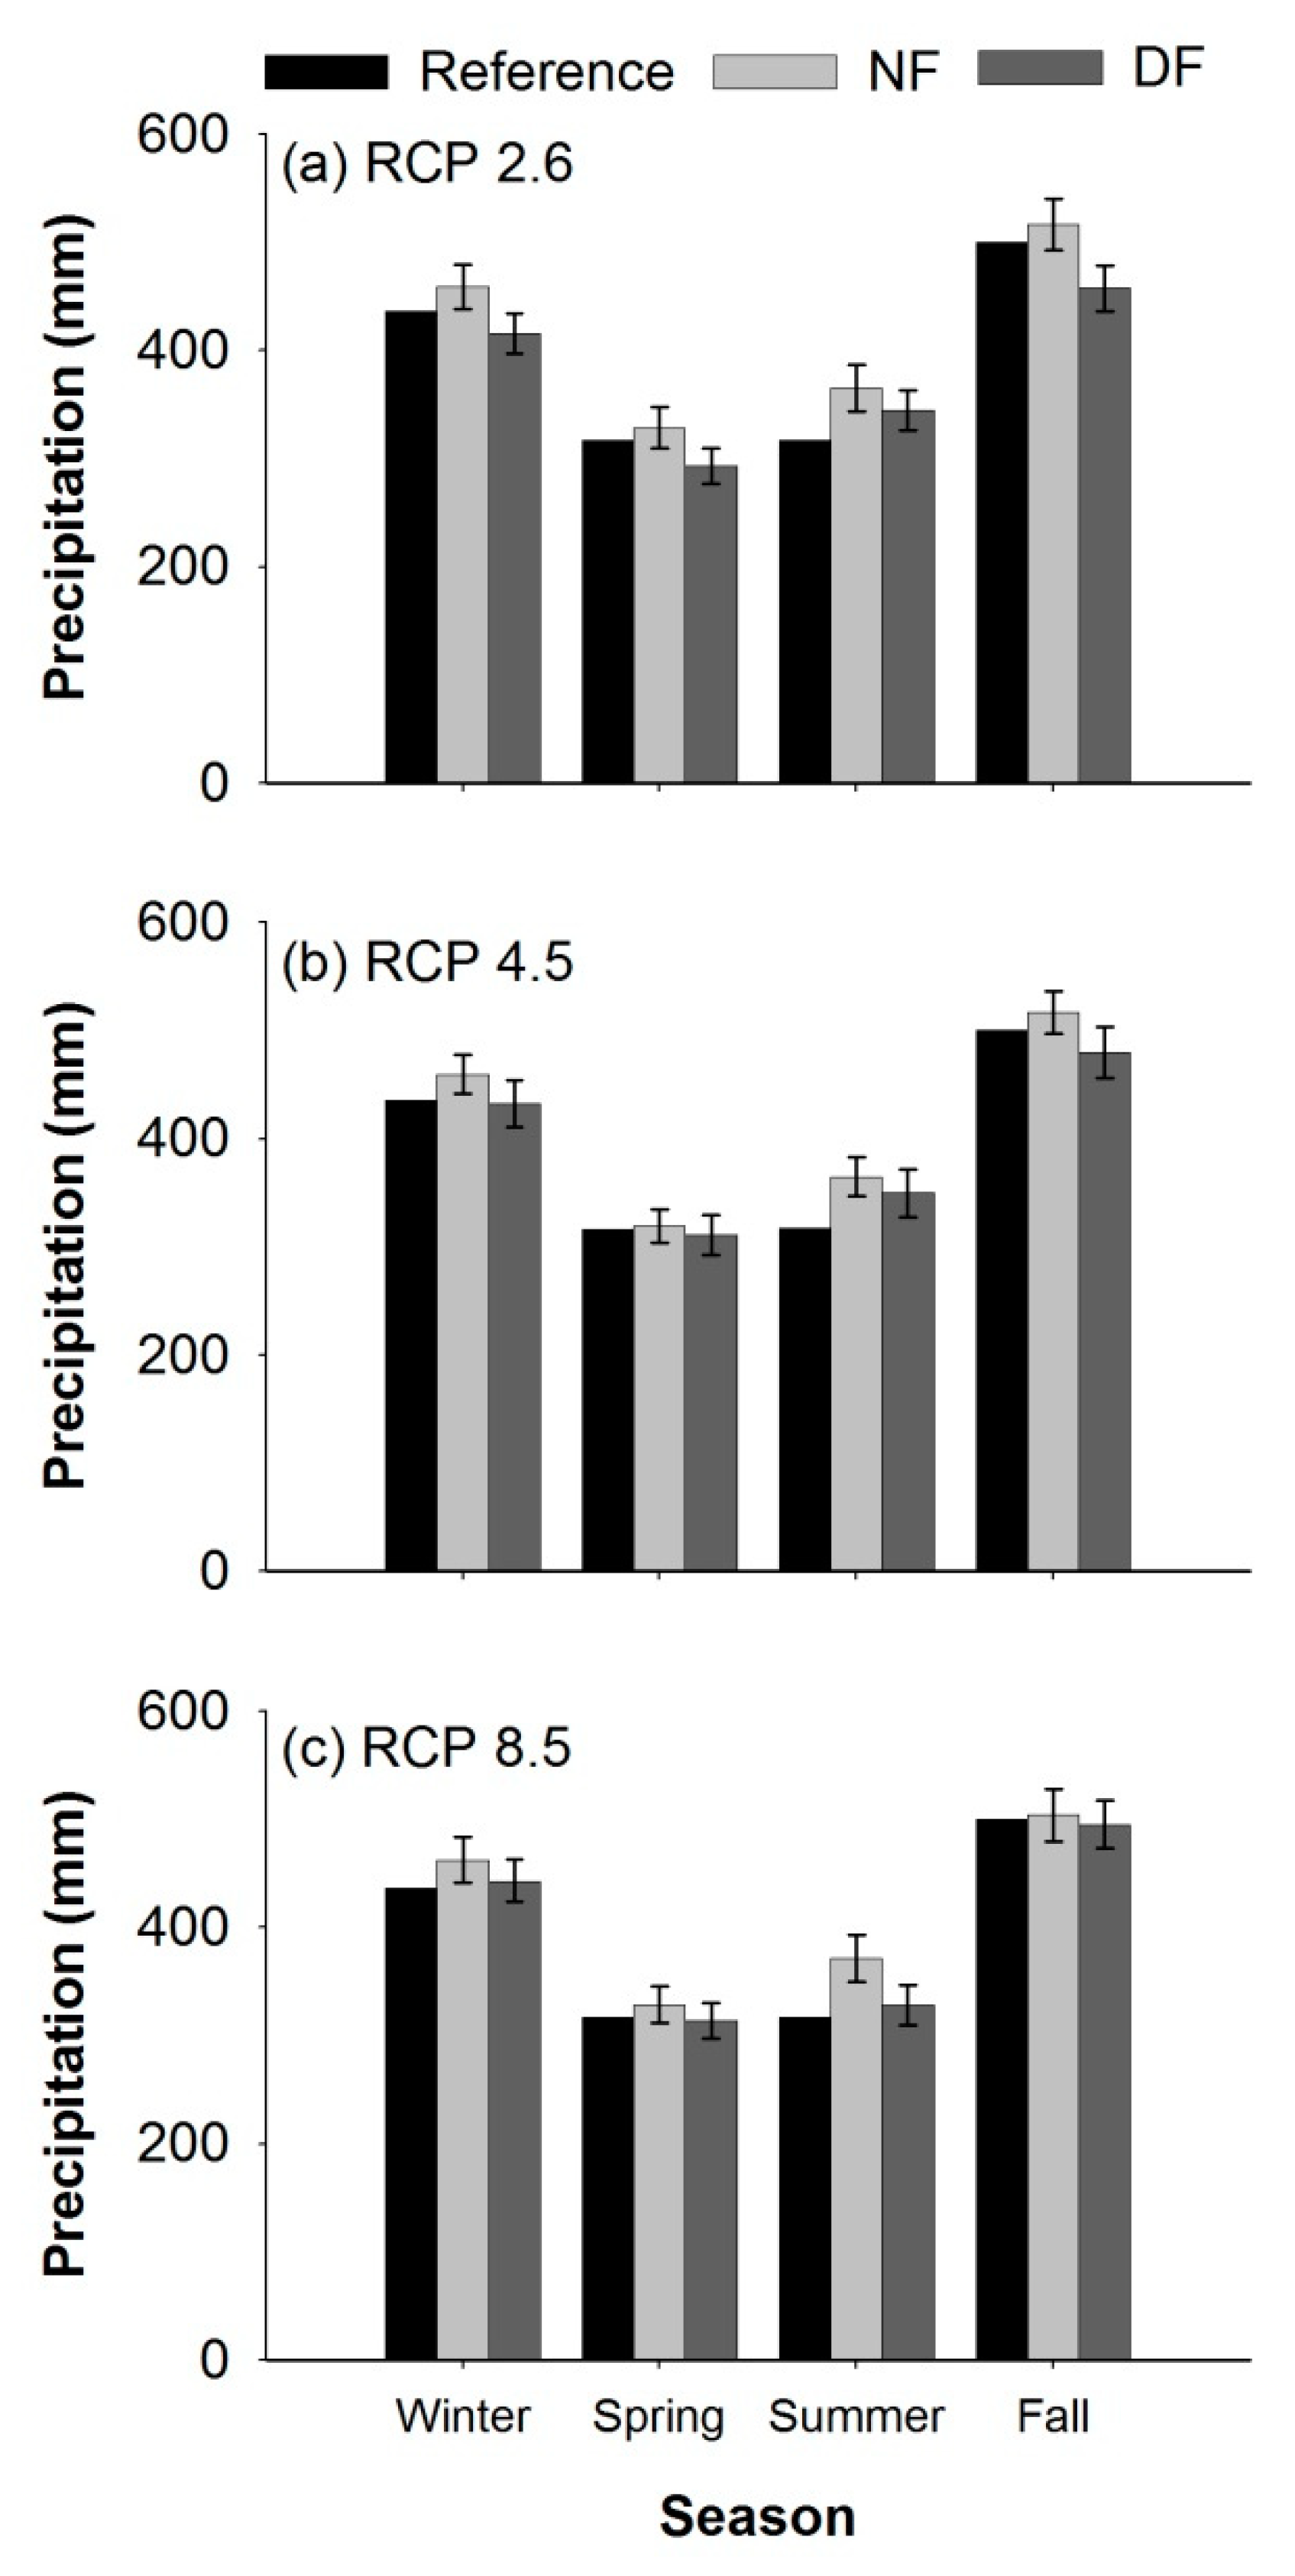
3.1. Future Climate Trends

Analysis of the climatic model ensemble and datasets suggests that temperature increased gradually during the reference period (i.e., 1990–2016) and is expected to continue to increase in the future (Figure 2a–c). Significant trends (p < 0.05) were detected by the Mann–Kendall test for annual average maximum and minimum temperatures for all the periods analyzed including the overall period (1990–2079). The exceptions were maximum temperature in the near future (p = 0.05) and minimum temperature in the distant future (p = 0.15) under RCP 2.6. Despite the significant trends, uncertainty is evident from the relatively large 90% confidence interval estimated from the future climate ensembles (Figure 2a–c), which is not unexpected given that the study area is on the edge of current agricultural production in the Atlantic region of Canada.
Trends towards increasing temperatures were more pronounced in some seasons (Figure 3). Minimum and maximum temperature tended to increase in winter and spring for all RCP, but remained fairly stable in summer and fall. Average winter temperature ranged from 2.8 °C in the near future under RCP 2.6, to 5.4 °C in the distant future under RCP 8.5. During spring, this increase ranged from 3.2 °C in the near future under RCP 4.5 to 6.4 °C in the distant future under RCP 8.5. Increases in average temperatures during summer ranged from a 0 °C in the near future under RCP 4.5 to a 1.5 °C in the distant future under RCP 8.5, while temperature changes in fall ranged from 0.6 °C decrease in the near future under RCP 4.5 to 0.7 °C increase in the distant future under RCP 8.5. The uncertainty associated with these trends are reflected by the 90% confidence interval (represented by the error bars), which suggests variability in the magnitude of change in seasonal temperatures (Figure 3).
Seasonal heat accumulation also increased due to increasing temperatures (Figure 2d–f), but the trends were not always statistically significant. Under RCP 2.6, the trend was significant over the entire period only for CHU (p < 0.01), despite non-significant trends in the near future (p = 0.6). The non-significant trend for GDD in the entire period (p = 0.37) were likely due to the lack of significance in the reference period (p = 0.07) and near future (p = 0.15). Under RCP 4.5, the trend was significant over the entire period for both GDD and CHU (p < 0.01), despite the lack of significance for GDD in the reference period (p = 0.07) and for both GDD and CHU in the near future (p = 0.75 and p = 0.86, respectively). The trends under RCP 8.5 were significant over the entire period for both GDD and CHU, despite the lack of significance for GDD in the reference period (p = 0.07). As for temperature, there was considerable uncertainty associated with the heat unit estimates (i.e., GDD and CHU), although this uncertainty was more constrained for GDD (i.e., narrow confidence interval) than for CHU (Figure 2d–f).
On average, there was a relatively small (<10%) increase in annual precipitation in the near future (+100 mm from the reference period to near future under RCP 2.6; +92 mm under RCP 4.5; +96 mm for RCP 8.5), with a subsequent small decrease in the distant future (−156 mm from near to distant future under RCP 2.6; −88 mm under RCP 4.5; −86 mm under RCP 8.5). The increase in precipitation in the near future and decrease in the distant future was distributed over all seasons (Figure 4b–d). The seasonal precipitation pattern in all the RCP scenarios followed that of the reference period, with relatively greater precipitation during the winter and fall. A statistically significant negative trend for annual precipitation over the entire period (1990–2079) was detected for RCP 2.6 (p < 0.01), although the only specific period with a statistically significant trend was the distant future (p = 0.03). Conversely, there was a statistically significant positive trend for this variable for the entire period under RCP 4.5 and RCP 8.5, although no specific period showed statistically significant trends under any RCP. As observed for temperature, uncertainty was associated with precipitation, as indicated by the error bars in Figure 4.
The effect of climate change on evapotranspiration (ET) was an increase in water demand by crops (Figure 5), which indicates the more favorable agronomic conditions. On average (across the three RCP), annual ET is expected to increase by 43 mm (9%) and 64 mm (13%) in the near and distant future periods, respectively, in relation to the reference period. Differences among different RCP are minimal in the near future, but increase in the distant future (Figure 5).

3.2. Agronomic Performance in the Reference Period (1990–2016)

The productivity and feed quality simulated by IFSM for the three major components of the forage diet were within the ranges reported by the farmer for the past 10 years (Table 2). The crop simulations by IFSM indicated that, on average, the farm produced 741 t DM year−1 of forage and 622 t DM year−1 of grain silage under the weather of the past 25 years and this compares well with 759 and 670 t DM year−1, respectively, reported by the farmer (long-term average annual production). The predicted forage balance of the farm (i.e., (forage production–forage sales)/forage consumed) indicates that the farm is 82% self-sufficient in forage production, which is very similar to the self-sufficiency reported by the farm (i.e., ~83%). The lactating cow density in the farm (192 cows/221.5 ha under forage production) was around 0.87 cows ha−1.
An unusual feature of the corn silage produced on the farm is the low yield and DM concentration (≤32%; Table 2). This corn silage performance, typical of cold regions, results from the short growing season and low CHU accumulation (<2000) relative to the maturity requirements of commercially available corn hybrids, and wet frost-free autumns. The low DM content in some years can cause seepage and negatively affect ensiling and animal performance (intake and milk production).
The simulated annual average feed intake of all animals on the farm was 2336 t DM, of which 1363 t (58%) was perennial forage, corn, and grain silage. The remainder of the diet (42%) was comprised of purchased grains. The simulated average FPCM was 9160 kg cow−1, which corresponds to 29.2 kg FPCM cow−1 day−1 for the 230 cows (including both lactating groups and dry cows), which was similar to the average productivity reported by the farm (i.e., 31.6 kg FPCM cow−1 day−1).

3.3. Impact of Cropland Expansion and Climate Change on Agronomic Performance

Expansion of the grass-legume cropped area under the reference climate (i.e., 1990–2016) resulted in a slight increase in yield per ha (Figure 6a) ranging from 1% for the 20% cropland expansion scenario to 3% in the 40% expansion scenario. No new facilities (e.g., silage pits) or equipment (harvesters) were needed. Productivity was also enhanced with all the future climate scenarios. Improvements in yield per ha ranged from 8% for the 40% cropland expansion under RCP 2.6 in the near future to 52% for 40% cropland expansion under RCP 8.5 in the distant future.
The slight increase in grass-legume yield per ha, associated with the expansion of cropped area, contributed to an increase in total farm forage production (t DM) either proportional to, or more than proportional to, the crop land expansion in the reference period (Figure 6b). In the 20, 30, and 40% cropland expansion scenarios, which corresponded to 15, 25, and 35% expansion in grass-legume area, a 16, 25, and 39% increase in grass-legume production was achieved using recent historical weather, respectively. The total farm production increases for future climate scenarios ranged from 11% for the current crop area under RCP 2.6 in the near future to 105% for the 40% cropland expansion under RCP 8.5 in the distant future.
Under recent weather conditions, an increase in corn yield per hectare of 1% was achieved by the 20% expansion in cropped area, while an increase of 5% was realized for the 40% expansion scenario (Figure 7a). It should be noted, though, that the expansion in corn silage area was only 5% for any cropland expansion scenario, indicating that the farm became more efficient as the cropped area increased. Similarly to grass-legume scenarios, corn yield per ha was enhanced for all the future climate scenarios. Simulations showed that the DM content in the reference period (i.e., 25%) was actually lower than the average DM content in the near and distant future (30% and 34%, respectively, across all RCP and land use scenarios), likely due to increased temperatures in the future leading to corn reaching maturity more quickly and more suitable conditions for field drying. Increments in yield per ha ranged from 28% for the 20% cropland expansion under RCP 2.6 in the near future to 69% for 40% cropland expansion under RCP 8.5 in the distant future. The uncertainty in yield estimates for corn silage (Figure 7a) was smaller than those for perennial forages (Figure 6a). Uncertainty was relatively low under RCP 4.5 in the near future and RCP 2.6 in the distant future because future temperatures were closer the optimum range for corn development (i.e., 10 °C and 30°C; [7]). The increases in corn silage yield per ha, coupled with the expansion of cropped area, resulted in predicted increases in farm corn silage production ranging from 29% for the current farm area under near-future RCP 4.5 to 77% for the 40% area expansion under distant-future RCP 8.5.
There was some uncertainty associated with the estimated yield and production increases of grass-legume and corn silage, as indicated by the standard deviation represented by the error bars (Figure 6 and Figure 7). Uncertainties were generally more constrained for corn than for grass-legume and for the distant future scenarios compared to the near future scenarios, suggesting more unequivocal impact of climate change on corn silage.

3.4. Forage Self-Sufficiency

According to IFSM simulations, a cropland expansion of 30% would be sufficient to meet the demand for forage off the farm under current climatic conditions assuming constant herd size and milk production, while a 40% expansion would generate a 4% forage surplus (Table 3). The current land-base of the farm would achieve self-sufficiency for the cow herd in the near future only for RCP 4.5, although self-sufficiency will improve for all scenarios. In the distant future, the farm would be self-sufficient under any climate scenario. An expansion of 20% would enable the farm to be self-sufficient under the near and distant future scenarios. However, there is variability associated with self-sufficiency in the future, as indicated by the standard deviation of the mean (Table 3). For all land use scenarios, the average uncertainty of forage self-sufficiency is 12% in the near future and 15% in the distant future, due to greater variability among the distant future projections of the GCM. Surplus feed would enable the dairy industry to respond to expected population increases, or to diversify into other broad-acre or horticultural crops.

4. Discussion

Census data indicate that in recent years the number of dairy cows in Newfoundland has decreased by 13.9% [58] while milk production increased by 1.8% [59,60]. The decline in number of cows is due to increased milk production per animal and suggests that the total requirements for feed quantity (but not quality) has declined somewhat due to the decrease in cow population.
Dairy farms in Newfoundland are 85% self-sufficient in forage production [12], which renders the dairy industry vulnerable to fluctuations in forage availability and quality. Forage availability is influenced by direct factors like crop yield, and indirect factors like cropping choices and commodity prices. For example, the decrease in corn silage area between 2011 and 2016 matched wheat expansion in the same period [61]. The dairy industry seeks greater self-sufficiency in forage production through both cropland expansion and increased productivity. As our analysis was conducted on a typical farm in a key region within Newfoundland, the results will help clarify trends in total forage production and forage self-sufficiency that will apply also to other farms. Our results may help farmers and policy makers plan for climate change in order to best exploit more favorable conditions.
The relationship between farm size and productivity per land area is quite complex but recent investigations suggest that larger farms may have higher crop yield per ha than smaller farms [62,63,64]. The simulation predicted that current equipment is adequate for farm cropland expansion of up to 30%, beyond which it would require additional equipment or perhaps contractor support (i.e., farm operation outsourcing). The slight increase in yield under the reference climate conditions of both grass-legume and corn silage for the 20% and 30% cropland expansions (which did not require any change in machinery size or management) is due to interactions between farm operations within IFSM (e.g., harvest being delayed and allowing more time for growth). Future studies should consider the effect of changes in farm size on forage production and other aspects of the farm including economics and environmental footprints. Strategies to adapt to the longer growing season must also be considered.
The increasing temperature in the recent past in Newfoundland (Figure 1a–c) agrees with trends reported at varying scales for the Northern Hemisphere [65], Canada [66], and Newfoundland specifically [7]. Slight long-term increases in precipitation have also been reported for eastern Canada in the past century [67]. The future increases in temperature and precipitation described in this study also agree with previous projections for Atlantic Canada [56]. Previous climate projections for 2040 and 2069 in Atlantic Canada predicted yield increases from 40% to 115% for corn grain and from 21% to 50% for soybeans [3]. Recent analyses of the dairy farms in Quebec and Alberta indicated that yield of perennial forage crops will increase, while corn silage yield will only increase in the cooler regions of those provinces [4,5,6], which is in alignment with the results of the present study. However, there are some differences in grass-legume productivity patterns. The increased yields of perennial forages in Quebec were fully attributed to increases in the first cut, while yields of subsequent cuts actually decreased [5]. In contrast, yield increases in Newfoundland come from increases in both the first and the (small) second cuts, while the third cut yield is decreased likely due to unfavorable conditions created by increased precipitation (under any RCP in the near and distant future; data not shown). Despite these changes, there is an overall improvement of growing season conditions in the future, as evidenced by the increases in evapotranspiration (Figure 5). These results suggest a greater benefit of climatic change for Newfoundland than Quebec or Alberta, especially during the spring. In fact, yield improvement is likely to be greater with adaptation strategies, such as modified harvest dates and additional cuts [5], but these require further evaluation.
The slight improvement in yield due to cropland expansion alone will be negated under certain climate projections, although the overall result is an increase in yield due to the overriding effect of temperature changes over cropland expansion. For instance, there is a loss in yield as the grass-legume and corn silage cropland expands under RCP 2.6 in both near and distant future, although this effect is more pronounced in the second period (Figure 6a). Such a decrease in yield is likely due to modest increases in temperature combined with an increase in precipitation. Also noteworthy is the general trend of increasing uncertainty as cropland expands within a single climate scenario for both crops, suggesting that cropland expansion will represent more risk to the farmer due to attempting more work within the same time frame (e.g., planting and harvesting). Despite this uncertainty in yield, forage production in the future is expected to increase, with increases for corn silage appearing more certain (less uncertainty) than those for grass-legume.
In terms of attaining self-sufficiency in forage production, relying on the effects of climate change alone is a high-risk approach for the farm because most of the forage is grass-legume cropland and yield and production of this crop is more uncertain under climate change. This uncertainty comes from several factors such as (i) relatively larger uncertainty for grass-legume yield when compared to corn silage (because higher temperatures will have a more unequivocal effect on corn productivity); and (ii) narrower time windows for farming operations to occur. When combined, these aspects result in self-sufficiency of 95% for RCP 2.6 and 96% for RCP 8.5 in the near future with no cropland expansion (Table 3). Moreover, the effects of climate change occur over decades whereas more forage is needed now. Thus, a combination of cropland expansion and climate change would allow the farm to become self-sufficient in forage production sooner, which may be possible given the predictions of increased availability of agricultural land in the future [11].
Another approach would be to alter the proportion of grass-legume and corn silage with the land base expansion. While the scenarios of cropland expansions considered in the present analysis were dedicated primarily to grass-legume forage in consultation with the farmer, the larger and more certain impacts of climate change on corn silage suggest that expanding this crop’s area would be an advisable approach. Production of corn silage would take advantage of climate change because corn silage was shown to perform better than grass-legume stands under the increasing temperature trends of the future. Besides enhancing forage production per se, climate change could also promote more cost-effective farm operations and provide a lengthened growing season. For example, increasing temperatures in the spring could mean that corn could be planted without the need of plastic mulch currently practiced in Newfoundland to prevent frost or chilling injury [28], which would reduce the cost of production.

5. Conclusions

Agricultural production is expected to increase in Newfoundland as a result of climate change and cropland expansion. Examining the impact of cropland expansion under climate change scenarios at the farm level provides valuable insight into optimum strategies for dairy farms located in the east coast of Newfoundland and elsewhere on the Island. The IFSM was parameterized using observed data from a dairy farm and climate data to represent baseline conditions and future scenarios. These scenarios included cropland expansions of 20, 30, and 40% (in which 5% were allocated to corn silage with the remainder allocated to grass-legume forage), and climate change under RCP 2.6, 4.5, and 8.5 in the near and distant future. Climate analysis indicated that temperatures have increased in the recent past (1990–2016) and will continue to do so in the future, although the estimated magnitude of the increase depends on the GHG emission scenario (i.e., RCP). The increase in winter and spring temperatures will favor agronomic production in the region. A slight increase in precipitation of less than 10% compared to the current conditions will somewhat narrow the time windows for farm operations. Although the extra precipitation may be mitigated by the expected higher ET, this extra wetness can exacerbate the challenge of excess moisture that the province already faces. Although self-sufficiency of dairy farms will gradually improve due to climate change, we estimate that a 20% expansion in cropland will help achieve this self-sufficiency faster. Greater expansions in cropland (i.e., 40%) are warranted to mitigate risk due to uncertainty in predictions.

Author Contributions

M.R.C.C., R.K., and S.B. conceived and designed the modelling experiment. M.R.C.C. and A.R. prepared the model setup and input datasets, and analyzed the model output. K.A.B., K.M.K., D.H., and S.B. contributed to analysis regarding dairy farm forage and milk production, animal diets, and nutrient inputs. D.B.M. contributed to materials and farm data acquisition. M.R.C.C. wrote the manuscript. All authors revised the manuscript.

Funding

This research was funded by Agriculture and Agri-Food Canada grant number A23-1605. The APC was funded by Agriculture and Agri-Food Canada.

Acknowledgments

The authors thank the farmer for agreeing to participate in this study and Wayne Molloy (AAFC) for collecting the data and communicating with the farmer to answer numerous questions during the model setup. This research was supported by funding under Agriculture and Agri-Food Canada’s Growing Forward 2 Program and the Canadian Agricultural Partnership Program.

Conflicts of Interest

The authors declare no conflict of interest.

Abbreviations

CanESM2Canadian Earth System Model - Second generation
CCSM4Community Climate System Model version 4
CHUCorn heat unit
CMIP5Coupled Model Intercomparison Project Phase 5
CPCrude protein
DFDistant future
DMDry matter
ETEvapotranspiration
FPCMFat and protein corrected milk
GCMGeneral circulation model
GHGGreenhouse gas
GDDGrowing degree-days
HadGEM2Hadley Centre Global Environmental Model version 2
IFSMIntegrated Farm System Model
NFNear future
NDFNeutral detergent fiber
PCICPacific Climate Impacts Consortium
RCPRepresentative concentration pathway

References

  1. Godfray, H.C.J.; Beddington, J.R.; Crute, I.R.; Haddad, L.; Lawrence, D.; Muir, J.F.; Pretty, J.; Robinson, S.; Thomas, S.M.; Toulmin, C. Food security: The challenge of feeding 9 billion people. Science 2010, 327, 812–818. [Google Scholar] [CrossRef] [PubMed]
  2. King, M.; Altdorff, D.; Li, P.; Galagedara, L.; Holden, J.; Unc, A. Northward shift of the agricultural climate zone under 21st-century global climate change. Sci. Rep. 2018, 8, 7904. [Google Scholar] [CrossRef] [PubMed]
  3. Bootsma, A.; Gameda, S.; McKenney, D.W. Potential impacts of climate change on corn, soybeans and barley yields in atlantic Canada. Can. J. Soil Sci. 2005, 85, 345–357. [Google Scholar] [CrossRef]
  4. Thivierge, M.-N.; Jégo, G.; Bélanger, G.; Chantigny, M.H.; Rotz, C.A.; Charbonneau, É.; Baron, V.S.; Qian, B. Projected impact of future climate conditions on the agronomic and environmental performance of canadian dairy farms. Agric. Syst. 2017, 157, 241–257. [Google Scholar] [CrossRef]
  5. Thivierge, M.-N.; Jégo, G.; Bélanger, G.; Bertrand, A.; Tremblay, G.F.; Rotz, C.A.; Qian, B. Predicted yield and nutritive value of an alfalfa–timothy mixture under climate change and elevated atmospheric carbon dioxide. Agron. J. 2016, 108, 585–603. [Google Scholar] [CrossRef]
  6. Thivierge, M.-N.; Jégo, G.; Belanger, G.; Bertrand, A.; Tremblay, G.; Baron, V.; Rotz, C.; Qian, B. Forage crop yield and nutritive value under climate change in Canada. In Proceedings of the Multiple Roles of Grassland in the European Bioeconomy. Proceedings of the 26th General Meeting of the European Grassland Federation, Trondheim, Norway, 4–8 September 2016; pp. 826–828. [Google Scholar]
  7. Kwabiah, A.B.; MacPherson, M.; McKenzie, D.B. Corn heat unit variability and potential of corn (zea mays l.) production in a cool climate ecosystem. Can. J. Plant Sci. 2003, 83, 689–698. [Google Scholar] [CrossRef]
  8. Jamieson, S.; Hughes, S.; Knezevic, I. Considerations for Seed Security and Biodiversity Conservation in Newfoundland; Atlantic Canadian Organic Regional Network: Sackville, NB, Canada, 2016. [Google Scholar]
  9. Todd, A.G.; Spaner, D. Spring cereals for forage and grain production in a cool maritime climate. J. Agron. Crop Sci. 2003, 189, 7–13. [Google Scholar] [CrossRef]
  10. Spaner, D.; McKenzie, D.B.; Todd, A.G.; Simms, A.; MacPherson, M.; Woodrow, E.F. Six years of adaptive and on-farm spring cereal research in newfoundland. Can. J. Plant Sci. 2000, 80, 205–216. [Google Scholar] [CrossRef]
  11. CBC. Grow your own: How n.L. Plans to produce more of its own food. Available online: http://www.Cbc.Ca/news/canada/newfoundland-labrador/crown-land-farming-food-security-young-farmers-1.3990939 (accessed on 11 January 2019).
  12. Government of Newfoundland and Labrador. Fisheries and land resources: Dairy. Available online: http://www.Faa.Gov.Nl.Ca/agrifoods/animals/livestock/dairy.Html (accessed on 11 January 2019).
  13. Ahuja, L.R.; Andales, A.A.; Ma, L.; Saseendran, S.A. Whole-system integration and modeling essential to agricultural science and technology for the 21st century. J. Crop Improv. 2007, 19, 73–103. [Google Scholar] [CrossRef]
  14. Beukes, P.C.; Palliser, C.C.; Macdonald, K.A.; Lancaster, J.A.S.; Levy, G.; Thorrold, B.S.; Wastney, M.E. Evaluation of a whole-farm model for pasture-based dairy systems. J. Dairy Sci. 2008, 91, 2353–2360. [Google Scholar] [CrossRef]
  15. Rodriguez, D.; Cox, H.; deVoil, P.; Power, B. A participatory whole farm modelling approach to understand impacts and increase preparedness to climate change in australia. Agric. Syst. 2014, 126, 50–61. [Google Scholar] [CrossRef]
  16. Crosson, P.; Shalloo, L.; O’Brien, D.; Lanigan, G.J.; Foley, P.A.; Boland, T.M.; Kenny, D.A. A review of whole farm systems models of greenhouse gas emissions from beef and dairy cattle production systems. Anim. Feed Sci. Technol. 2011, 166–167, 29–45. [Google Scholar] [CrossRef]
  17. Janzen, H.H.; Angers, D.A.; Boehm, M.; Bolinder, M.; Desjardins, R.L.; Dyer, J.; Ellert, B.H.; Gibb, D.J.; Gregorich, E.G.; Helgason, B.L.; et al. A proposed approach to estimate and reduce net greenhouse gas emissions from whole farms. Can. J. Soil Sci. 2006, 86, 401–418. [Google Scholar] [CrossRef] [Green Version]
  18. Chianese, D.S.; Rotz, C.A.; Richard, T.L. Whole-farm greenhouse gas emissions: A review with application to a pennsylvania dairy farm. Appl. Eng. Agric. 2009, 25, 431. [Google Scholar] [CrossRef]
  19. McGeough, E.J.; Little, S.M.; Janzen, H.H.; McAllister, T.A.; McGinn, S.M.; Beauchemin, K.A. Life-cycle assessment of greenhouse gas emissions from dairy production in eastern Canada: A case study. J. Dairy Sci. 2012, 95, 5164–5175. [Google Scholar] [CrossRef] [PubMed]
  20. Little, S.; Benchaar, C.; Janzen, H.; Kröbel, R.; McGeough, E.; Beauchemin, K. Demonstrating the effect of forage source on the carbon footprint of a canadian dairy farm using whole-systems analysis and the holos model: Alfalfa silage vs. Corn silage. Climate 2017, 5, 87. [Google Scholar] [CrossRef]
  21. Statistics Canada. Table 32-10-0403-01—Farms classified by farm type, cansim (database). 2018. Available online: https://www150.statcan.gc.ca/t1/tbl1/en/tv.action?pid=3210040301 (accessed on 11 January 2019).
  22. Kottek, M.; Grieser, J.; Beck, C.; Rudolf, B.; Rubel, F. World map of the köppen-geiger climate classification updated. Meteorologische Zeitschrift 2006, 15, 259–263. [Google Scholar] [CrossRef]
  23. Environment and Climate Change Canada. Canadian climate normals 1981–2010. 2018. Available online: http://climate.Weather.Gc.Ca/climate_normals/ (accessed on 11 January 2019).
  24. Mahanna, B.; Thomas, E. Tips to compare corn maturity. Available online: https://www.Pioneer.Com/home/site/us/silage-zone/corn_silage_plant/compare-corn-maturity/ (accessed on 11 January 2019).
  25. Heringa, P.K. Soils of the Avalon Peninsula, Newfoundland; Research Branch Agriculture Canada: St. John’s, NL, Canada, 1981; Volume 113. [Google Scholar]
  26. Expert Committee on Soil Survey. The Canada Soil Information System (Cansis): Manual for Describing Soils in the Field, 1982 Revised; Land Resource Research Institute, Research Branch, Agriculture Canada: Ottawa, ON, Canada, 1982; p. 166. [Google Scholar]
  27. Statistics Canada. Table 001-0071—Estimated areas, yield and production of principal field crops by small area data regions, in metric and imperial units, annual, cansim (database). 2017. Available online: https://www150.statcan.gc.ca/t1/tbl1/en/tv.action?pid=3210000201 (accessed on 11 January 2019).
  28. Kwabiah, A.B. Growth, maturity, and yield responses of silage maize (zea mays l.) to hybrid, planting date and plastic mulch. J. New Seeds 2005, 7, 37–59. [Google Scholar] [CrossRef]
  29. American Society of Agricultural and Biological Engineers (ASABE). Manure Production and Characteristics; ASABE: St. Joseph, MI, USA, 2005.
  30. Rotz, C.; Corson, M.; Chianese, D.; Montes, F.; Hafner, S.; Bonifacio, H.; Coiner, C. The integrated farm system model, reference manual version 4.2. Agricultural research service, USDA. 2015. [Google Scholar]
  31. Jégo, G.; Rotz, C.A.; Bélanger, G.; Tremblay, G.F.; Charbonneau, É.; Pellerin, D. Simulating forage crop production in a northern climate with the integrated farm system model. Can. J. Plant Sci. 2015, 95, 745–757. [Google Scholar] [CrossRef]
  32. Rotz, C.; Corson, M.; Chianese, D.; Montes, F.; Hafner, S.; Bonifacio, H.; Coiner, C. The integrated farm system model, reference manual version 4.4. Agricultural research service, USDA; 2018. Available online: https://www.Ars.Usda.Gov/northeast-area/uppa/pswmru/docs/integrated-farm-system-model/#reference (accessed on 11 January 2019).
  33. Environment and Climate Change Canada. Historical climate data. Available online: http://climate.Weather.Gc.Ca/index_e.Html#access (accessed on 18 January 2018).
  34. Hargreaves, G.H.; Samani, Z.A. Reference crop evapotranspiration from temperature. Appl. Eng. Agric. 1985, 1, 96–99. [Google Scholar] [CrossRef]
  35. Aladenola, O.O.; Madramootoo, C.A. Evaluation of solar radiation estimation methods for reference evapotranspiration estimation in Canada. Theor. Appl. Climatol. 2013, 118, 377–385. [Google Scholar] [CrossRef]
  36. Meinshausen, M.; Smith, S.J.; Calvin, K.; Daniel, J.S.; Kainuma, M.L.T.; Lamarque, J.-F.; Matsumoto, K.; Montzka, S.A.; Raper, S.C.B.; Riahi, K.; et al. The rcp greenhouse gas concentrations and their extensions from 1765 to 2300. Clim. Change 2011, 109, 213–241. [Google Scholar] [CrossRef]
  37. van Vuuren, D.P.; Edmonds, J.; Kainuma, M.; Riahi, K.; Thomson, A.; Hibbard, K.; Hurtt, G.C.; Kram, T.; Krey, V.; Lamarque, J.-F.; et al. The representative concentration pathways: An overview. Clim. Change 2011, 109, 5. [Google Scholar] [CrossRef]
  38. Taylor, K.E.; Stouffer, R.J.; Meehl, G.A. An overview of cmip5 and the experiment design. Bull. Am. Meteorol. Soc. 2012, 93, 485–498. [Google Scholar] [CrossRef]
  39. Hopkinson, R.F.; McKenney, D.W.; Milewska, E.J.; Hutchinson, M.F.; Papadopol, P.; Vincent, L.A. Impact of aligning climatological day on gridding daily maximum–minimum temperature and precipitation over Canada. J. Appl. Meteorol. Climatol. 2011, 50, 1654–1665. [Google Scholar] [CrossRef]
  40. McKenney, D.W.; Hutchinson, M.F.; Papadopol, P.; Lawrence, K.; Pedlar, J.; Campbell, K.; Milewska, E.; Hopkinson, R.F.; Price, D.; Owen, T. Customized spatial climate models for North America. Bull. Am. Meteorol. Soc. 2011, 92, 1611–1622. [Google Scholar] [CrossRef]
  41. Arora, V.K.; Scinocca, J.F.; Boer, G.J.; Christian, J.R.; Denman, K.L.; Flato, G.M.; Kharin, V.V.; Lee, W.G.; Merryfield, W.J. Carbon emission limits required to satisfy future representative concentration pathways of greenhouse gases. Geophys. Res. Lett. 2011, 38. [Google Scholar] [CrossRef] [Green Version]
  42. Johns, T.C.; Durman, C.F.; Banks, H.T.; Roberts, M.J.; McLaren, A.J.; Ridley, J.K.; Senior, C.A.; Williams, K.D.; Jones, A.; Rickard, G.J.; et al. The new hadley centre climate model (hadgem1): Evaluation of coupled simulations. J. Clim. 2006, 19, 1327–1353. [Google Scholar] [CrossRef]
  43. Gent, P.R.; Danabasoglu, G.; Donner, L.J.; Holland, M.M.; Hunke, E.C.; Jayne, S.R.; Lawrence, D.M.; Neale, R.B.; Rasch, P.J.; Vertenstein, M.; et al. The community climate system model version 4. J. Clim. 2011, 24, 4973–4991. [Google Scholar] [CrossRef]
  44. Rotz, C.A.; Skinner, R.H.; Stoner, A.M.K.; Hayhoe, K. Farm simulation can help dairy production systems adapt to climate change. In Improving Modeling Tools to Assess Climate Change Effects on Crop Response; Hatfield, J.L., Fleisher, D., Eds.; American Society of Agronomy, Crop Science Society of America, and Soil Science Society of America, Inc.: Madison, WI, USA, 2016; pp. 91–124. [Google Scholar]
  45. Winkler, T.; Winiwarter, W. Greenhouse gas scenarios for austria: A comparison of different approaches to emission trends. Mitig. Adapt. Strateg. Glob. Change 2016, 21, 1181–1196. [Google Scholar] [CrossRef]
  46. Wollenberg, E.; Richards, M.; Smith, P.; Havlík, P.; Obersteiner, M.; Tubiello, F.N.; Herold, M.; Gerber, P.; Carter, S.; Reisinger, A.; et al. Reducing emissions from agriculture to meet the 2 °C target. Glob. Change Biol. 2016, 22, 3859–3864. [Google Scholar] [CrossRef] [PubMed] [Green Version]
  47. Justus, C.G.; Hargraves, W.R.; Mikhail, A.; Graber, D. Methods for estimating wind speed frequency distributions. J. Appl. Meteorol. 1978, 17, 350–353. [Google Scholar] [CrossRef]
  48. Sammis, T.W.; Mapel, C.L.; Lugg, D.G.; Lansford, R.R.; McGuckin, J.T. Evapotranspiration crop coefficients predicted using growing-degree-days. Trans. ASAE 1985, 28, 773. [Google Scholar] [CrossRef]
  49. Cutforth, H.W.; Shaykewich, C.F. A temperature response function for corn development. Agric. For. Meteorol. 1990, 50, 159–171. [Google Scholar] [CrossRef]
  50. Goodin, D.G.; Henebry, G.M. A technique for monitoring ecological disturbance in tallgrass prairie using seasonal ndvi trajectories and a discriminant function mixture model. Remote Sens. Environ. 1997, 61, 270–278. [Google Scholar] [CrossRef]
  51. de Beurs, K.M.; Henebry, G.M. Spatio-temporal statistical methods for modelling land surface phenology. In Phenological Research: Methods for Environmental and Climate Change Analysis; Hudson, I.L., Keatley, M.R., Eds.; Springer Netherlands: Dordrecht, The Netherlands, 2010; pp. 177–208. [Google Scholar]
  52. Frank, A.B.; Hofmann, L. Relationship among grazing management, growing degree-days, and morphological development for native grasses on the northern great plains. J. Range Manag. 1989, 42, 199–202. [Google Scholar] [CrossRef]
  53. Helsel, D.R.; Hirsch, R.M. Statistical Methods in Water Resources Techniques of Water Resources Investigations. 2002; Book 4, Chapter a3. 522. [Google Scholar]
  54. McLeod, A.I. Kendall-Package: Kendall Correlation and Trend Tests. R Package Version 2.2. 2011. Available online: https://cran.r-project.org/web/packages/Kendall/index.html (accessed on 11 January 2019).
  55. Gifford, M. Canada’s dairy industry: Can supply management survive an open trade environment? Policy Opt. 2005, 26, 57–63. [Google Scholar]
  56. Qian, B.; Jong, R.D.; Gameda, S.; Huffman, T.; Neilsen, D.; Desjardins, R.; Wang, H.; McConkey, B. Impact of climate change scenarios on Canadian agroclimatic indices. Can. J. Soil Sci. 2013, 93, 243–259. [Google Scholar] [CrossRef]
  57. Smith, W.N.; Grant, B.B.; Desjardins, R.L.; Kroebel, R.; Li, C.; Qian, B.; Worth, D.E.; McConkey, B.G.; Drury, C.F. Assessing the effects of climate change on crop production and ghg emissions in Canada. Agric. Ecosyst. Environ. 2013, 179, 139–150. [Google Scholar] [CrossRef]
  58. Statistics Canada. Table 32-10-0424-01—Census of agriculture, cattle and calves on census day. 2018. Available online: https://www150.statcan.gc.ca/t1/tbl1/en/tv.action?pid=3210042401 (accessed on 11 January 2019).
  59. Statistics Canada. Table 32-10-0113-01—Census of agriculture, milk production and utilization. 2018. Available online: https://www150.statcan.gc.ca/t1/tbl1/en/tv.action?pid=3210011301 (accessed on 11 January 2019).
  60. Statistics Canada. Farm and farm operator data—Newfoundland and labrador farms have the highest rate of direct marketing. 2017. Available online: https://www150.statcan.gc.ca/n1/en/catalogue/95-640-X201600114800 (accessed on 11 January 2019).
  61. Statistics Canada. Table 004-0213—Census of agriculture, hay and field crops, cansim (database). 2017. Available online: https://www150.statcan.gc.ca/t1/tbl1/en/tv.action?pid=3210041601 (accessed on 11 January 2019).
  62. Woodhouse, P. Beyond industrial agriculture? Some questions about farm size, productivity and sustainability. J. Agrar. Change 2010, 10, 437–453. [Google Scholar] [CrossRef]
  63. Alvarez, A.; Arias, C. Technical efficiency and farm size: A conditional analysis. Agric. Econ. 2004, 30, 241–250. [Google Scholar] [CrossRef]
  64. Gorton, M. Farm productivity and efficiency in the cee applicant countries: A synthesis of results. Agric. Econ. 2004, 30, 1–16. [Google Scholar] [CrossRef]
  65. Shindell, D.T.; Miller, R.L.; Schmidt, G.A.; Pandolfo, L. Simulation of recent northern winter climate trends by greenhouse-gas forcing. Nature 1999, 399, 452. [Google Scholar] [CrossRef]
  66. Zhang, X.; Vincent, L.A.; Hogg, W.D.; Niitsoo, A. Temperature and precipitation trends in Canada during the 20th century. Atmosphere-Ocean 2000, 38, 395–429. [Google Scholar] [CrossRef] [Green Version]
  67. Bootsma, A. Long term (100 year) climatic trends for agriculture at selected locations in Canada. Clim. Change 1994, 26, 65–88. [Google Scholar] [CrossRef]
Figure 1. Flowchart depicting major model input (yellow boxes) as well as cropland expansion and weather scenarios. The baseline scenario refers to the current cropped area used on the farm, while the recent past is the historical weather between 1990 and 2016. The 20%, 30%, and 40% cropland expansion refer to a 5% increase in corn silage area for all scenarios, with the remainder of the expansion dedicated for grass-legume area. RCP = representative concentration pathway; IFSM = Integrated Farm System Model.
Agronomy 09 00031 g001
Figure 2. Long-term trends of maximum (Tmax) and minimum (Tmin) daily temperatures (panels a through c) and heat units (growing degree days (GDD; calculated for grass-legume) and corn heat units (CHU; calculated for corn silage)) (panels d through f) under RCP 2.6 (panels a and d), RCP 4.5 (panels b and e), and RCP 8.5 (panels c and f) for the recent past (1990–2016), near future (2020–2049), and distant future (2050–2079). Solid lines represent the annual averages for temperature and seasonal accumulation of heat units calculated from the daily median values from the model ensemble. Shaded areas represent the 90% confidence interval calculated from the GCM model ensemble comprised of three downscaled models.
Agronomy 09 00031 g002
Figure 3. Long-term average of seasonal minimum (panels a through c) and maximum (panels d through f) temperature for the reference period (Reference), near future (NF), and distant future (DF) under RCP 2.6, RCP 4.5, and RCP 8.5. Uncertainty in future temperatures is represented by error bars.
Agronomy 09 00031 g003
Figure 4. Long-term average seasonal precipitation pattern for the reference period (Reference), near future (NF) and distant future (DF) under RCP 2.6 (a), RCP 4.5 (b), and RCP 8.5 (c). Uncertainty in future precipitation is represented by error bars.
Agronomy 09 00031 g004
Figure 5. Long-term average annual evapotranspiration (ET) for the reference period (Reference), near future (NF) and distant future (DF) under RCP 2.6, RCP 4.5, and RCP 8.5. Uncertainty in future annual ET is represented by error bars.
Agronomy 09 00031 g005
Figure 6. Change in grass-legume yield (t DM ha−1) (panel a) and farm production (t DM) (panel b) due to expansion of cropland and climate change. Error bars reflect the variability predicted among climate models.
Agronomy 09 00031 g006
Figure 7. Change in corn silage yield (t DM ha−1) (panel a) and farm production (t DM) (panel b) due to expansion of cropland and climate change.
Agronomy 09 00031 g007
Table 1. Standard annual fertilizer applications for cropping operations at a selected dairy farm near St. John’s, Newfoundland.
CropNutrient Applied by SourceTotal Nutrient Applied
N 1 (kg ha−1)P 2 (kg ha−1)N (kg ha−1)P (kg ha−1)
ManureSynthetic FertilizerManureSynthetic Fertilizer
Pure grass4022295726265
Grass-legume4013793517744
Corn silage805518013518
Peas-oats11701170
1 N = nitrogen; 2 P = phosphorus.
Table 2. Observed (Farm) and simulated (IFSM) 25-year average yield and feed quality parameters for the three forages produced on the farm.
Feed itemYield 1 (t DM ha−1)Dry matter (%)CP 2 (% DM)NDF 3 (% DM)
FarmIFSM 4FarmIFSMFarmIFSMFarmIFSM
Grass-legume4.0–7.07.032–50NA 514.0–22.021.644–6046.4
Corn silage8.0–13.010.924–3225.07.0–10.59.645–5547.3
Peas-oats silage4.0–6.55.326–4031.712.0–18.014.745–5857.1
1 DM = dry matter; 2 CP = crude protein; 3 NDF = neutral detergent fiber; 4 IFSM = Integrated Farm System Model; 5 NA = not available/simulated.
Table 3. Forage self-sufficiency expressed as percentage of demand met by farm production under different land use and climate scenarios. For future climate scenarios, self-sufficiency averages are followed by standard deviation of the mean.
Land Use ScenarioClimate Scenario
Reference PeriodNear FutureDistant Future
RCP 1 2.6RCP 4.5RCP 8.5RCP 2.6RCP 4.5RCP 8.5
No expansion8295 ± 12100 ± 996 ± 10104 ± 8101 ± 16106 ± 12
20% expansion93100 ± 12106 ± 11100 ± 11109 ± 10104 ± 17108 ± 15
30% expansion98102 ± 14110 ± 12102 ± 11113 ± 12106 ± 17109 ± 17
40% expansion104104 ± 14113 ± 13103 ± 12114 ± 15108 ± 18110 ± 18
1 RCP = representative concentration pathway.

