Analysis of Dual-Polarimetric Radar Variables and Quantitative Precipitation Estimators for Landfall Typhoons and Squall Lines Based on Disdrometer Data in Southern China

 , ,
, ,
Abstract
:1. Introduction
2. DSD Dataset and Retrieval of Polarimetric Variables
2.1. Retrieval of Dual-Pol Radar Variables from DSD
2.2. Method Fitting for QPE
2.3. Parameters for Evaluating the Performance of QPE
3. Characteristics of DSD and Polarimetric Variables for Typhoon and Squall Line
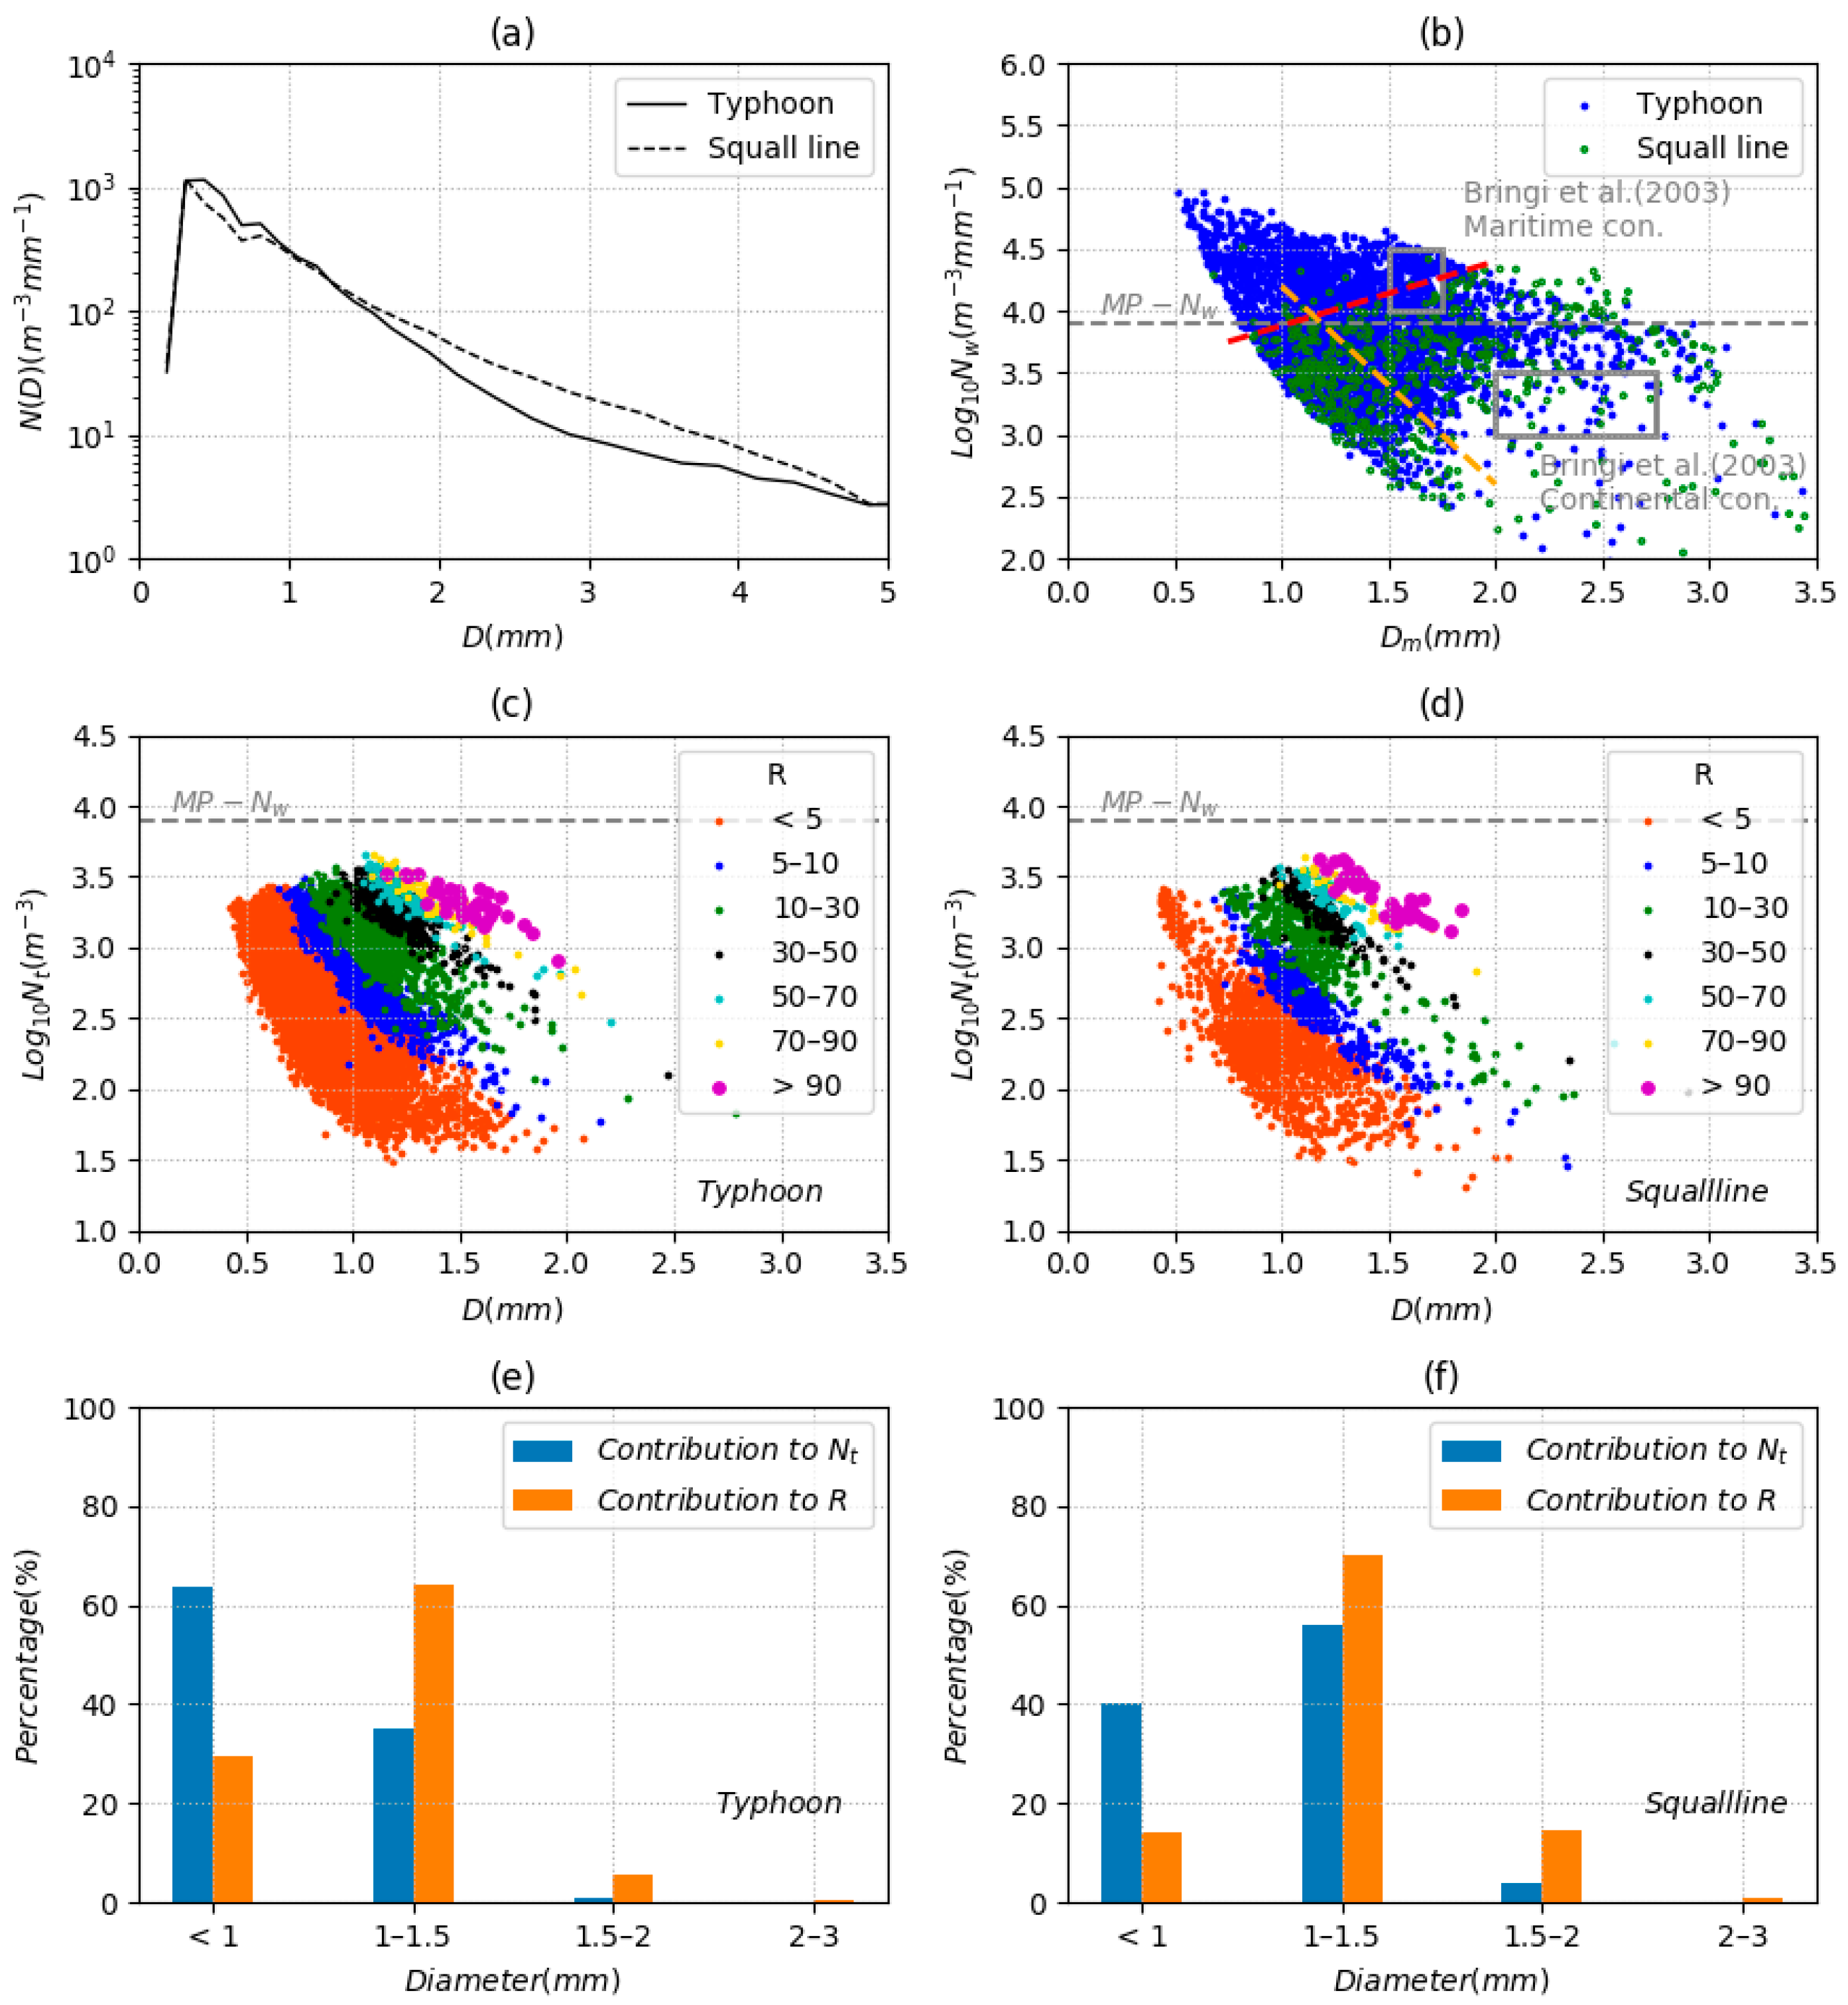
3.1. Comparison of DSD from Typhoon and Squall Line
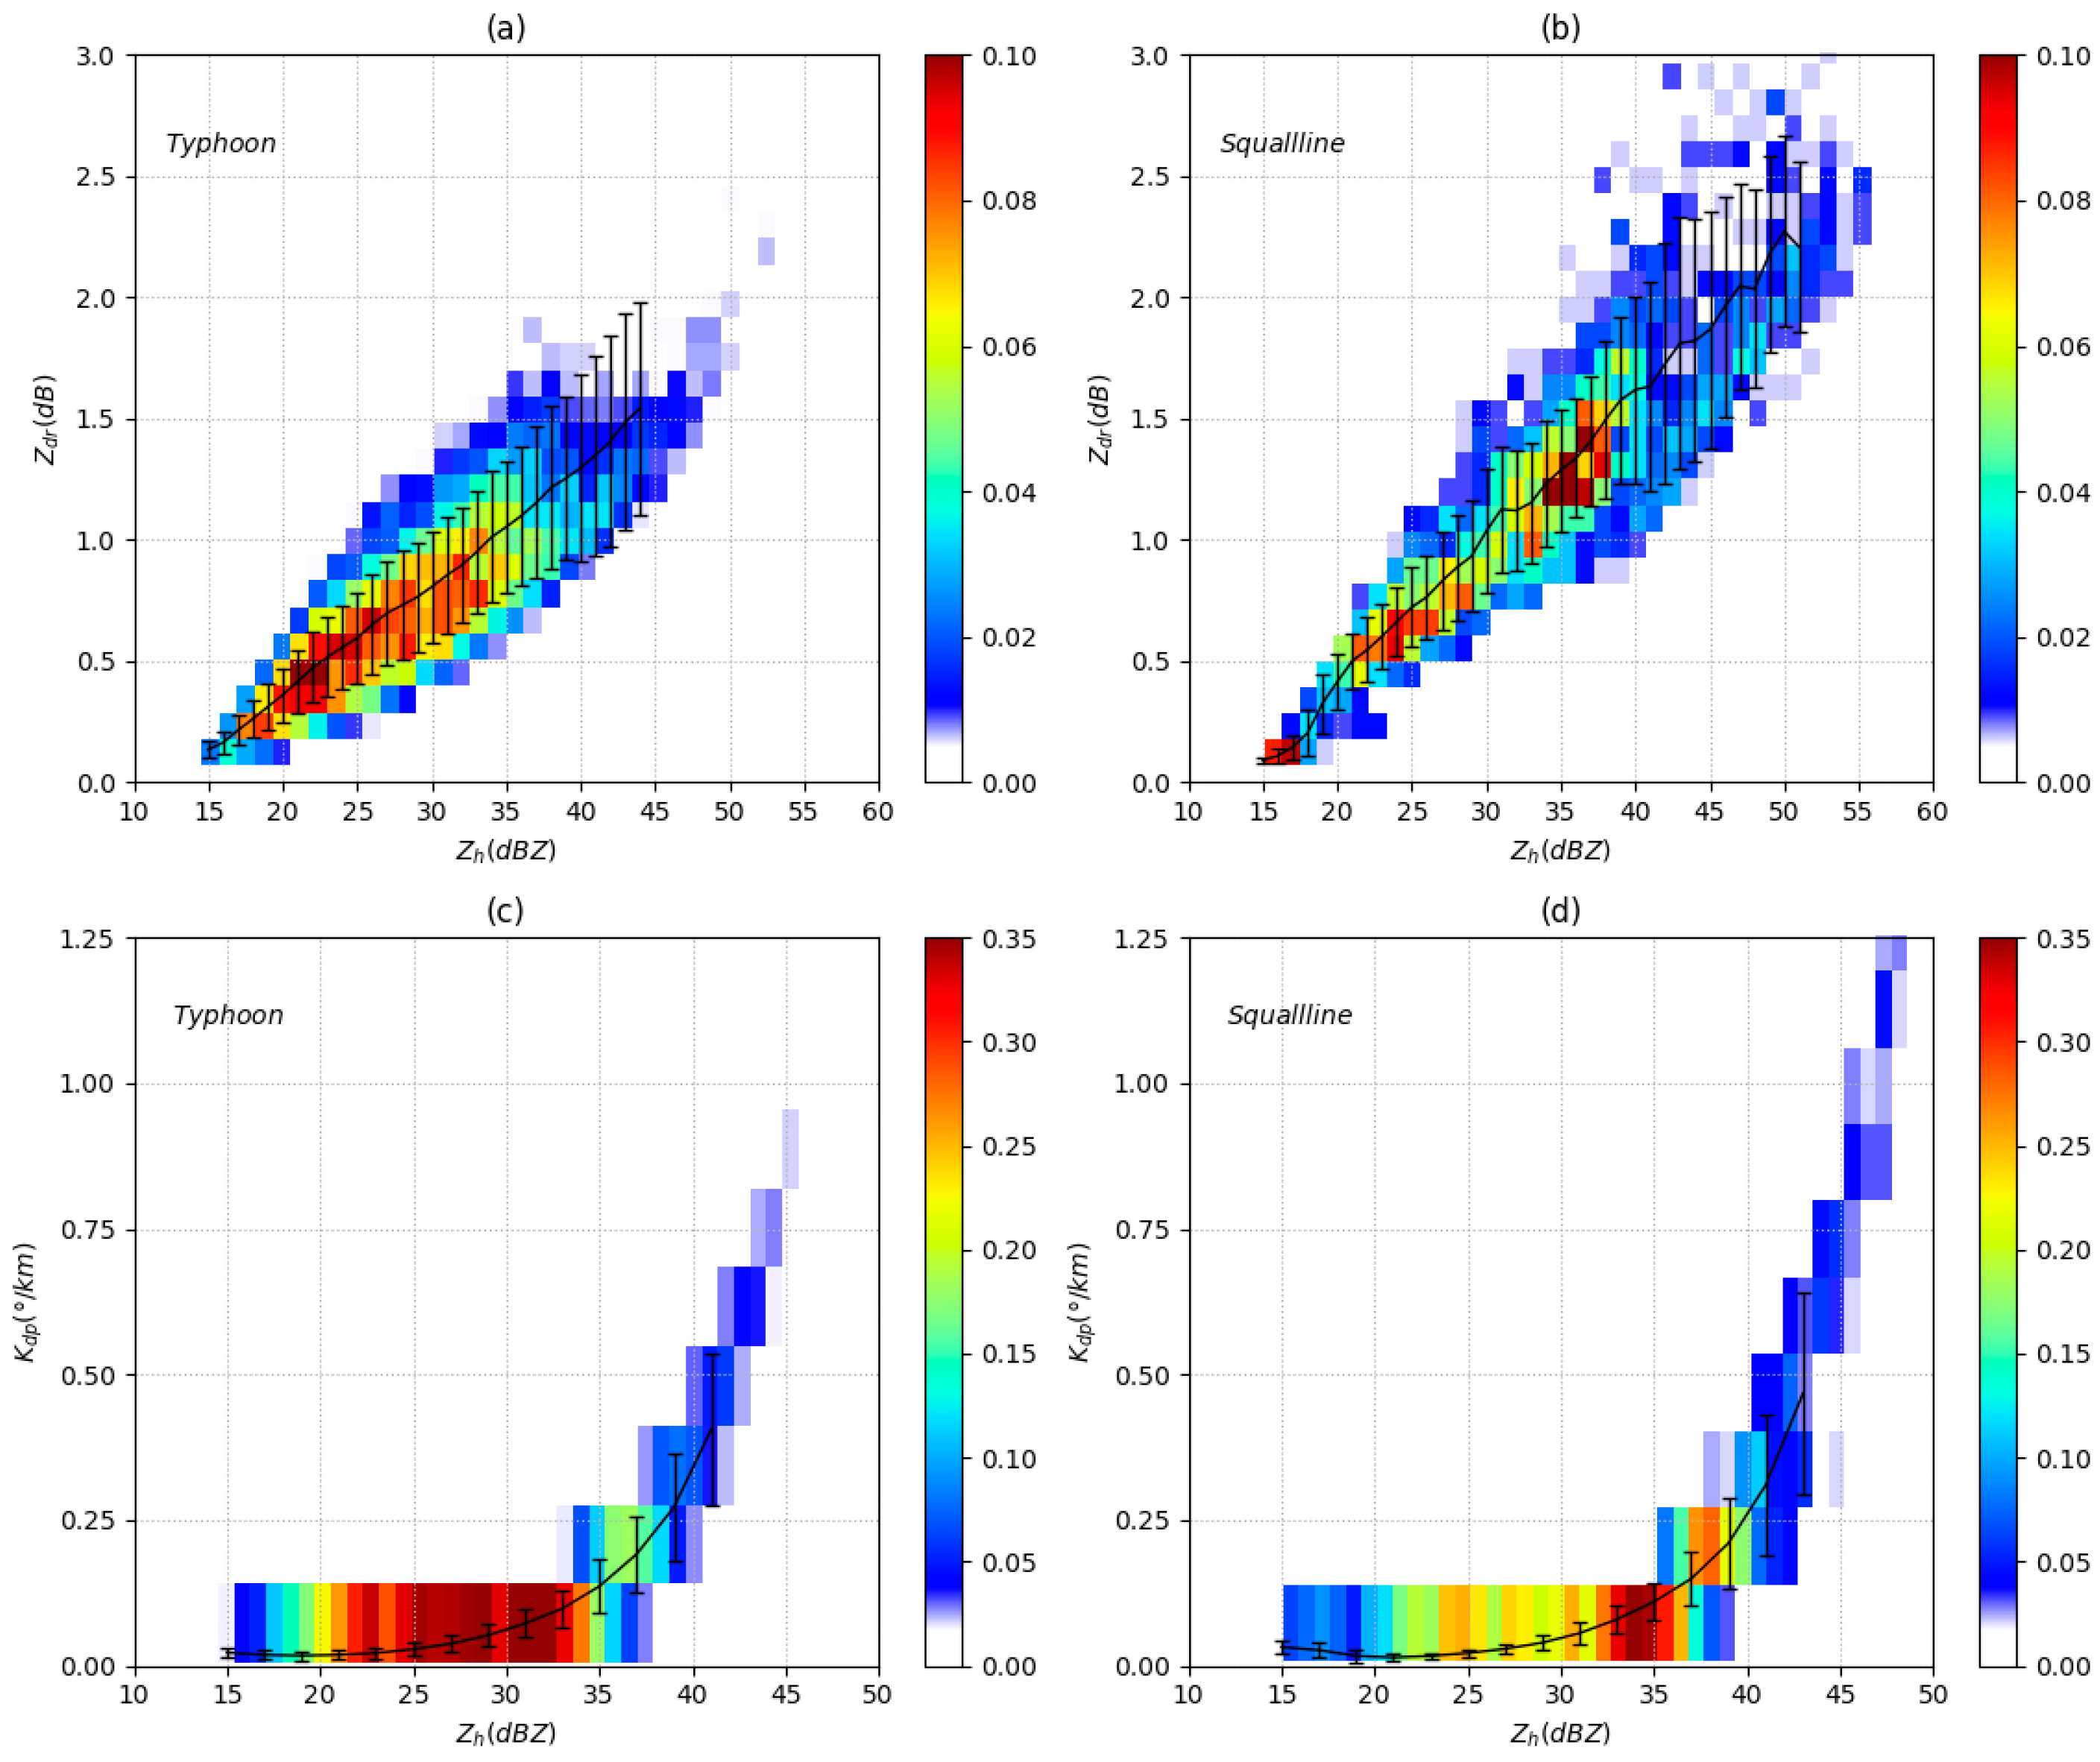
3.2. Comparison of Polarimetric Radar Variables
4. Dual-Pol Estimators for Typhoon and Squall Line
4.1. Comparison of the Parameters for the Two Estimators
4.1.1. Estimators and Their Performance from CFM
4.1.2. Estimators and Their Performance from PFM
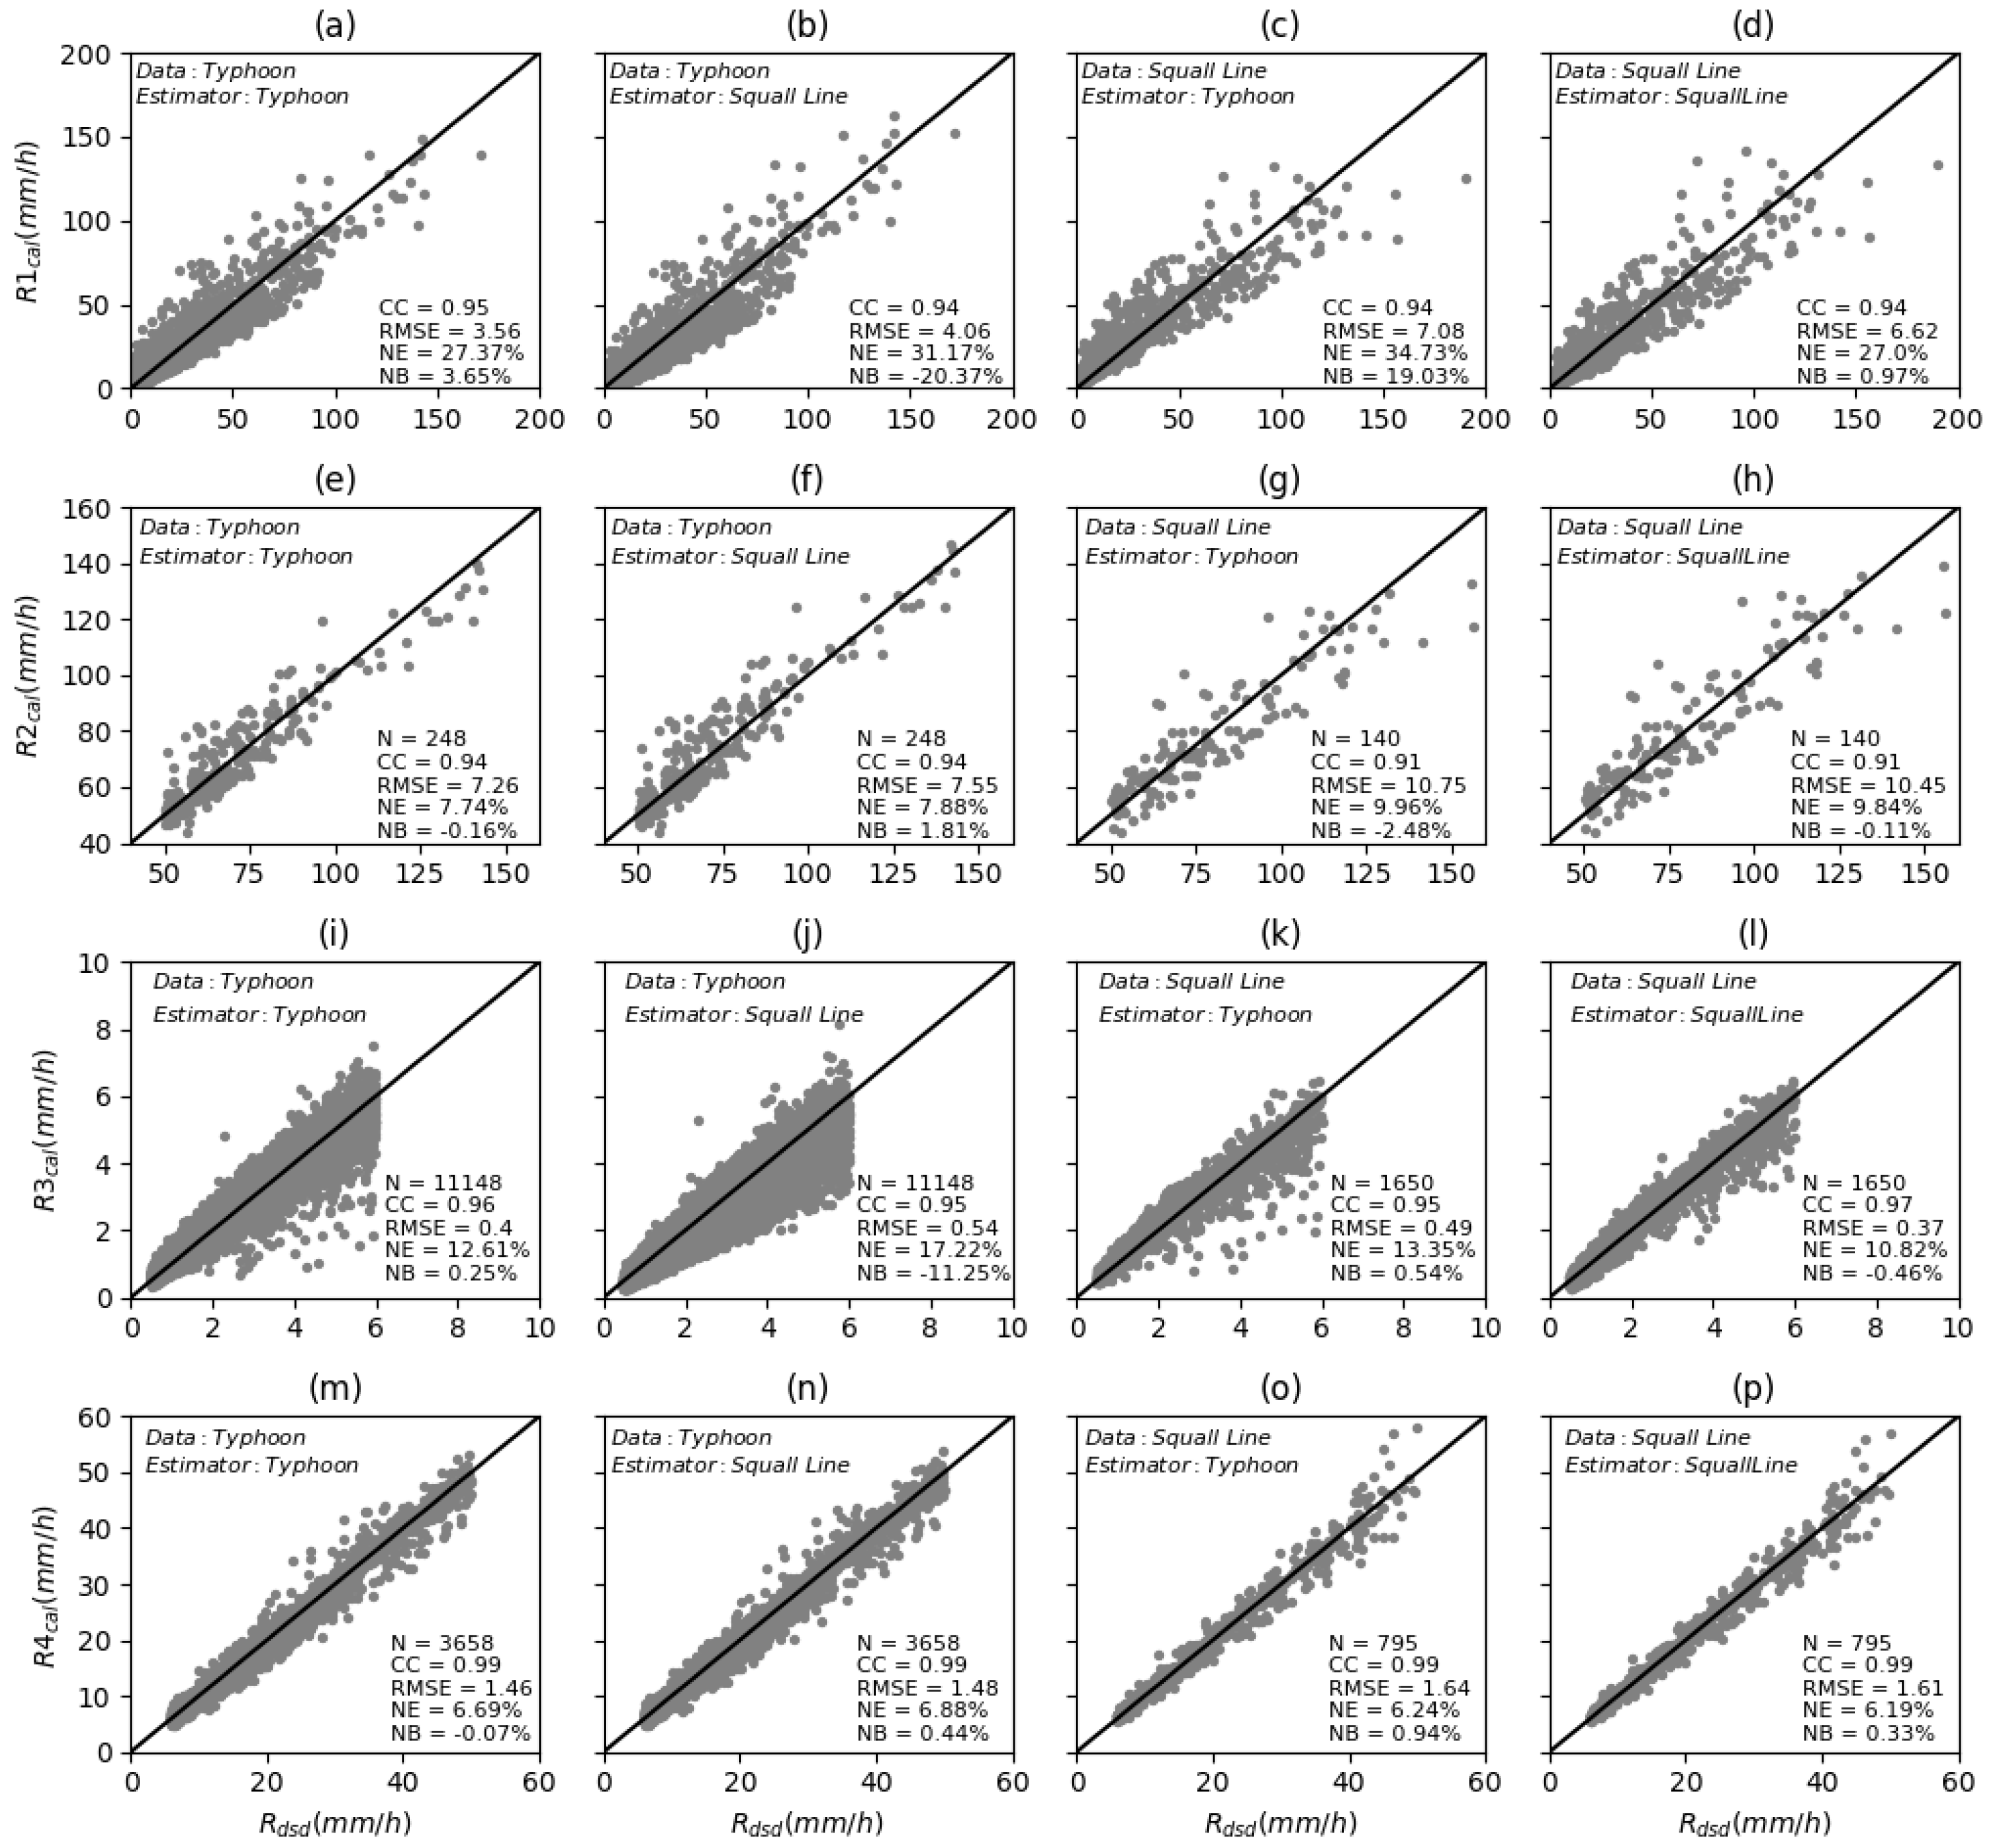
4.2. Evaluation of the Performance of QPEs Obtained using CFM and PFM
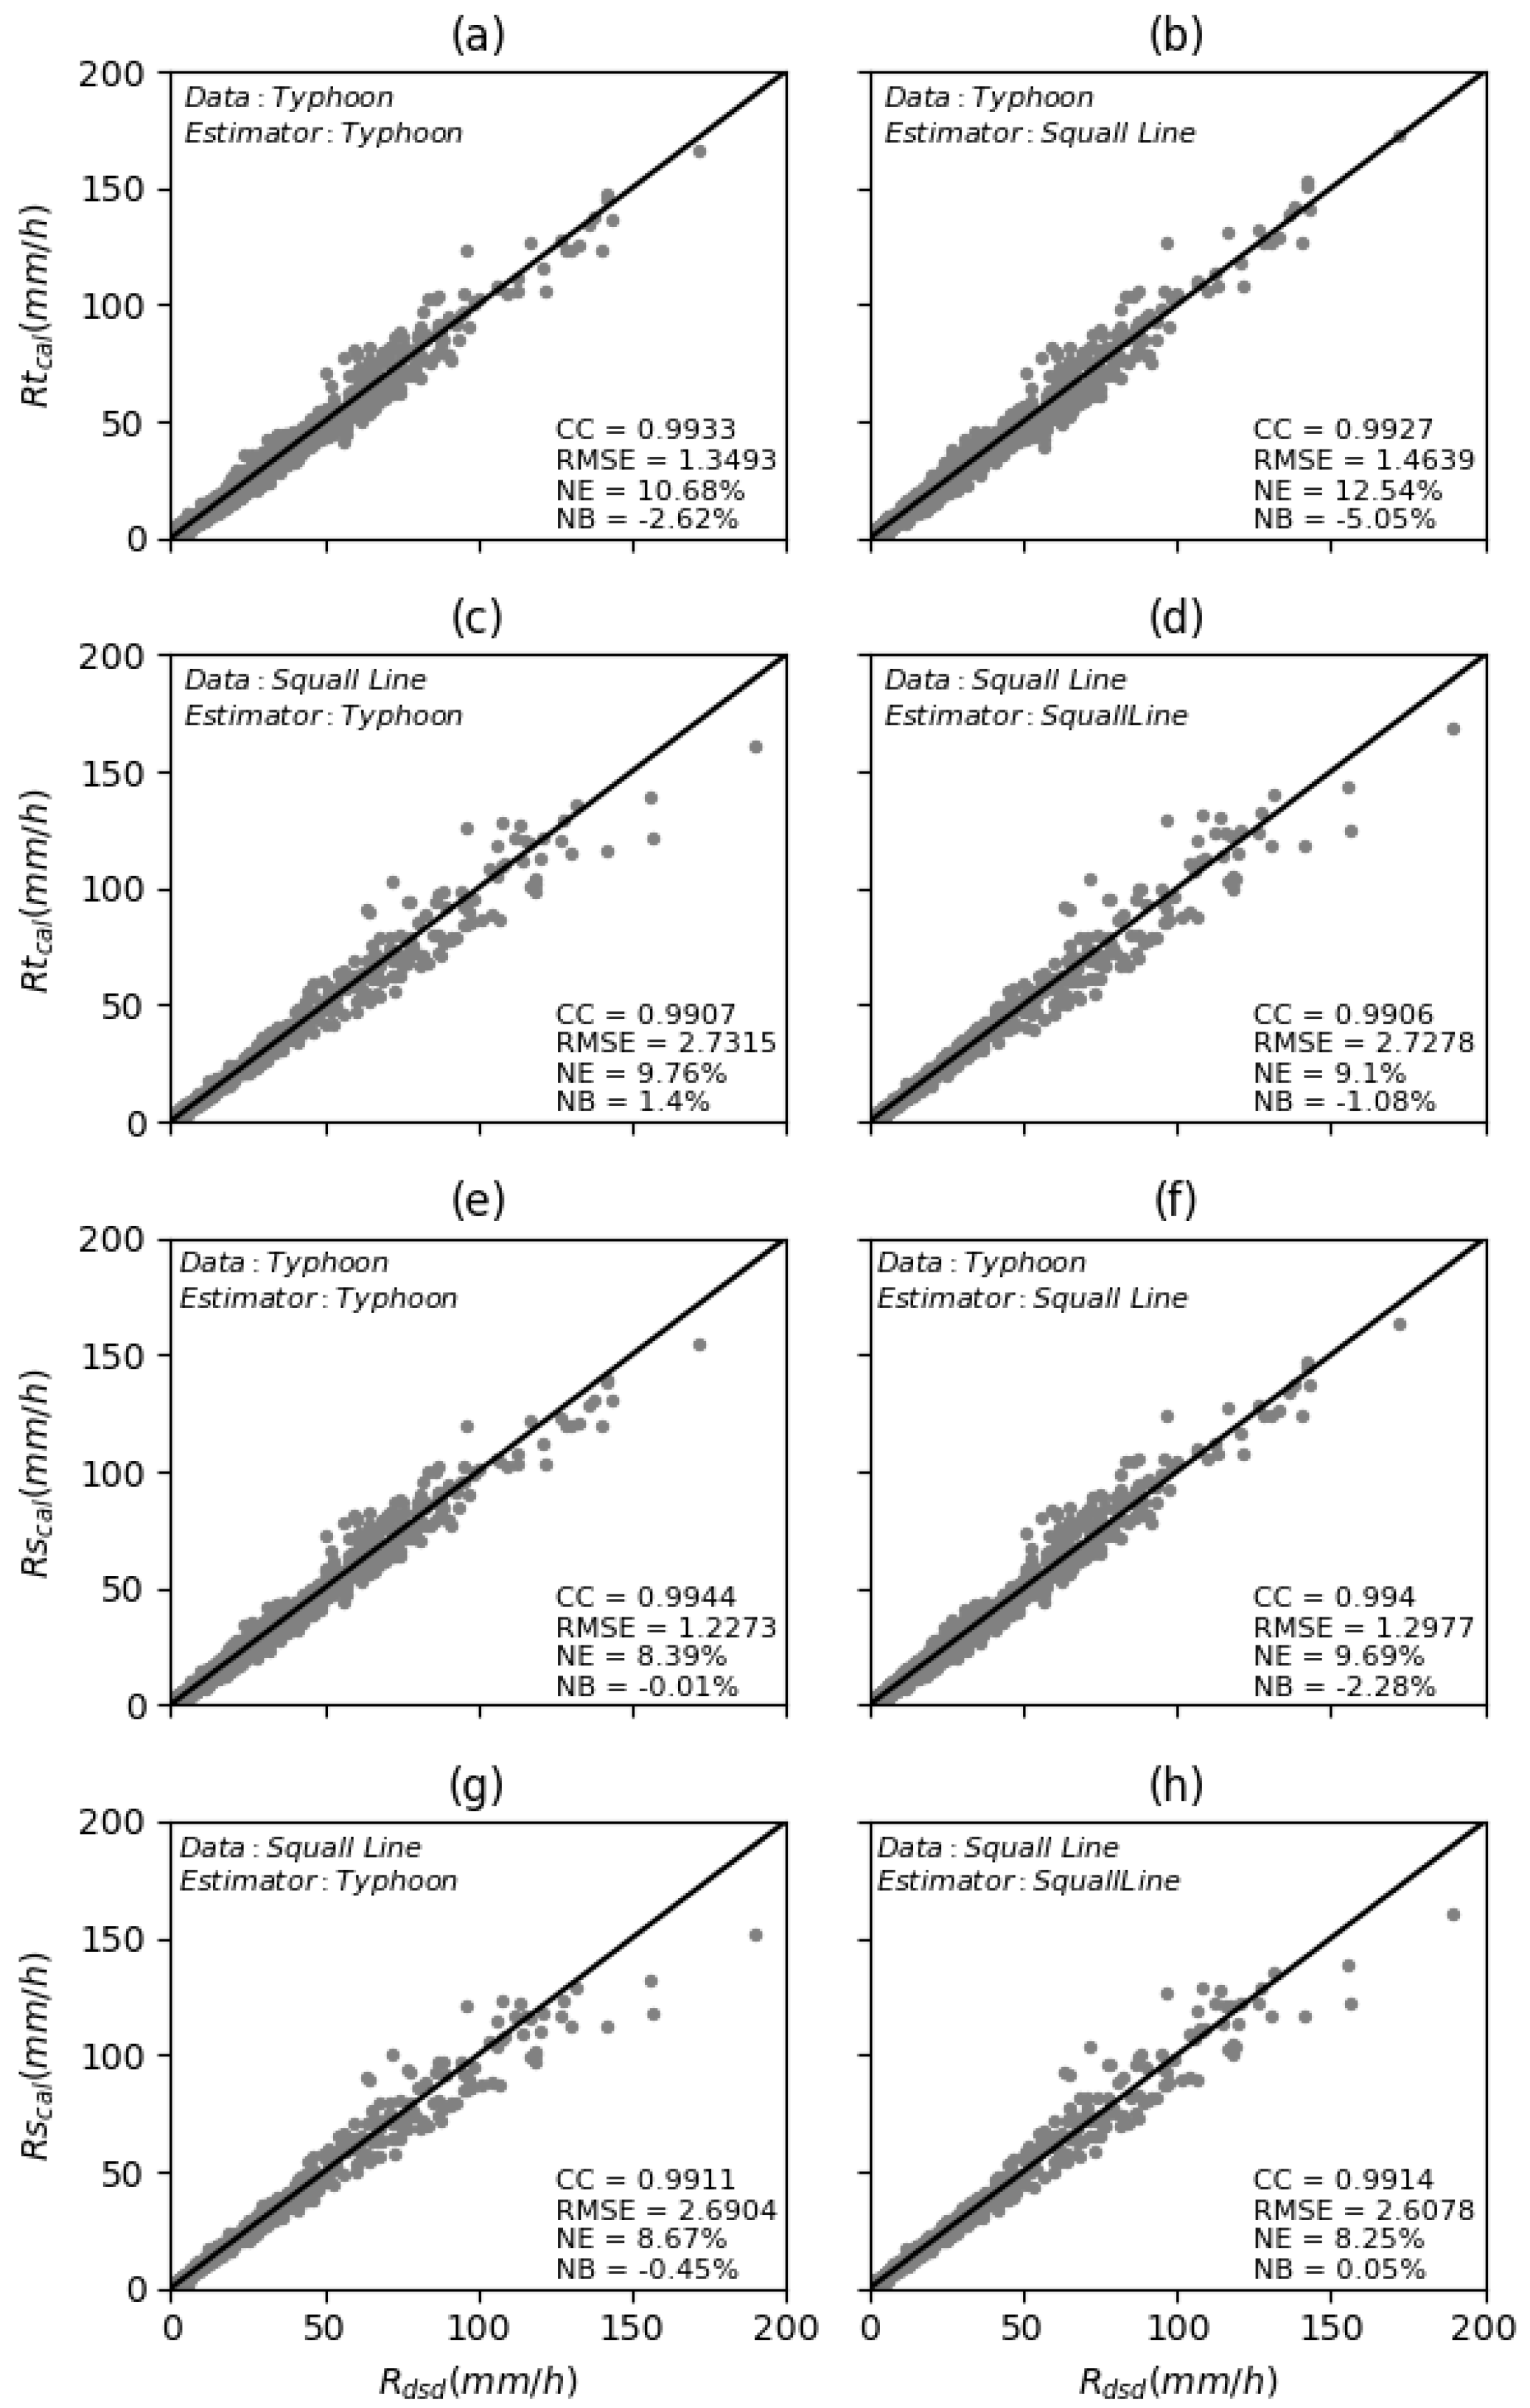
4.3. Sensitivity Experiment for Different QPE Estimators
5. Discussion and Conclusions
5.1. Discussion
5.2. Conclusions
Author Contributions
Funding
Acknowledgments
Conflicts of Interest
References
- Lin, Y.; Fujiang, Y. The long-range change and forecast of storm surge disasters in China. Chin. J. Mar. Forecasts 2002, 19, 89–96. [Google Scholar] [CrossRef]
- Huijuan, Y.; Ning, L.; Yang, L. Features of typhoon in southeast coastal regions of China in the recent 54 years. Chin. J. Sci. Meteorol. Sin. 2007, 27, 413–418. [Google Scholar]
- Zhang, J.X.; Ping-ri, L.I.; Guang-qing, H.; Zhang, H.O. Risk assessment of swingeing stom surge disaster in coastal area of China induced by typhoonbased on information diffusion method. Chin. J. Trop. Geogr. 2007, 27, 11–14. [Google Scholar]
- Haiyan, N.; Min, L.; Min, L.; Ruisong, Q.; Jingjing, W.; Ning, Z. Losses assessment of typhoon disaster in China coastal areas. Chin. J. Catastrophol. 2011, 26, 61–64. [Google Scholar]
- Rosenfeld, D.; Ulbrich, C.W. Cloud microphysical properties, processes, and rainfall estimation opportunities. Radar and Atmospheric Science: A Collection of Essays in Honor of David Atlas, Meteor. Monogr. Am. Meteor. Soc. 2003, 30, 237–258. [Google Scholar]
- Zhang, G.; Sun, J.; Brandes, E.A. Improving parameterization of rain microphysics with disdrometer and radar observations. J. Atmos. Sci. 2006, 63, 1273–1290. [Google Scholar] [CrossRef]
- Yujie, P.; Kun, Z.; Yinong, P.; Yiping, W. Dual-doppler analysis of a squall line in southern China. Chin. J. Acta Meteorol. Sin. 2012, 70, 736–751. [Google Scholar]
- Hong, G.; Yonghui, L.; Miao, Z. Mesoscale analysis on a squall line in the warm-sector heavy rainfall over southern China. Chin. J. Torrential Rain Disasters 2014, 33, 171–180. [Google Scholar] [CrossRef]
- Chong, F.; Yinjing, L.; Yancha, C.; Jie, S.; Wenjian, Z. Comparative analysis of statistical environmental characteristics between westerly squall line and typhoon squall line in south China. Chin. J. Trop. Meteorol. 2017, 33, 965–974. [Google Scholar] [CrossRef]
- Ryzhkov, A.V.; Zrnić, D.S. Comparison of dual–polarization radar estimators of rain. J. Atmos. Ocean. Technol. 1995, 12, 249–256. [Google Scholar] [CrossRef]
- Ryzhkov, A.V.; Zrnić, D.S. Assessment of rainfall measurement that uses specific differential phase. J. Appl. Meteorol. 1996, 35, 2080–2090. [Google Scholar] [CrossRef]
- Zhang, G.; Vivekanandan, J.; Brandes, E. A method for estimating rain rate and drop size distribution from polarimetric radar measurements. IEEE Trans. Geosci. Remote Sens. 2001, 39, 830–841. [Google Scholar] [CrossRef]
- Brandes, E.A.; Zhang, G.; Vivekanandan, J. Comparison of polarimetric radar drop size distribution retrieval algorithms. J. Atmos. Ocean. Technol. 2004, 21, 584–598. [Google Scholar] [CrossRef]
- Ryzhkov, A.V.; Giangrande, S.E.; Schuur, T.J. Rainfall estimation with a polarimetric prototype of WSR–88D. J. Appl. Meteorol. 2005, 44, 502–515. [Google Scholar] [CrossRef]
- Ryzhkov, A.V.; Schuur, T.J.; Burgess, D.W.; Heinselman, P.; Zrnić, D.S. The joint polarization experiment: Polarimetric rainfall measurements and hydrometeor classification. Bull. Am. Meteorol. Soc. 2005, 86, 809–824. [Google Scholar] [CrossRef]
- Bringi, V.; Thurai, M.; Nakagawa, K.; Huang, G.; Kobayashi, T.; Adachi, A.; Hanado, H.; Sekizawa, S. Rainfall estimation from c-band polarimetric radar in Okinawa, Japan: Comparisons with 2D-video disdrometer and 400MHz wind profiler. J. Meteorol. Soc. Jpn. Ser. II 2006, 84, 705–724. [Google Scholar] [CrossRef]
- Wang, Y.; Zhang, J.; Ryzhkov, A.V.; Tang, L. C-Band polarimetric radar QPE based on specific differential propagation phase for extreme typhoon rainfall. J. Atmos. Ocean. Technol. 2013, 30, 1354–1370. [Google Scholar] [CrossRef]
- You, C.H.; Kang, M.Y.; Lee, D.I.; Uyeda, H. Rainfall estimation by S-band polarimetric radar in Korea. Part I: Preprocessing and preliminary results. Meteorol. Appl. 2014, 21, 975–983. [Google Scholar] [CrossRef]
- Matrosov, S.Y.; Cifelli, R.; Neiman, P.J.; White, A.B. Radar rain-rate estimators and their variability due to rainfall type: An assessment based on hydrometeorology testbed data from the southeastern United States. J. Appl. Meteorol. Climatol. 2016, 55, 1345–1358. [Google Scholar] [CrossRef]
- Montopoli, M.; Roberto, N.; Adirosi, E.; Gorgucci, E.; Baldini, L. Investigation of weather radar quantitative precipitation estimation methodologies in complex orography. Atmosphere 2017, 8, 34. [Google Scholar] [CrossRef]
- Zhang, Y.; Liu, L.; Wen, H.; Wu, C.; Zhang, Y. Evaluation of the polarimetric-radar quantitative precipitation estimates of an extremely heavy rainfall event and nine common rainfall events in Guangzhou. Atmosphere 2018, 9, 330. [Google Scholar] [CrossRef]
- Adirosi, E.; Roberto, N.; Montopoli, M.; Gorgucci, E.; Baldini, L. Influence of disdrometer type on weather radar algorithms from measured DSD: Application to Italian climatology. Atmosphere 2018, 9, 360. [Google Scholar] [CrossRef]
- Wang, J.; Liu, L.; Cao, J. A comparison of methods of rainfall rate measurements by dual linear polarization Doppler radar. Chin. J. Meteorol. Mon. 2005, 31, 25–30. [Google Scholar] [CrossRef]
- Aydin, K.; Giridhar, V. C–band dual–polarization radar observables in rain. Atmos. Ocean. Technol. 2009, 9, 383–390. [Google Scholar] [CrossRef]
- Gu, J.Y.; Ryzhkov, A.; Zhang, P.; Neilley, P.; Knight, M.; Wolf, B.; Lee, D.I. Polarimetric attenuation correction in heavy rain at C band. J. Appl. Meteorol. Climatol. 2011, 50, 39–58. [Google Scholar] [CrossRef]
- Wu, L. Application Study of Mobile c–Band dual–Polarization Radar Quality Control and QPE Using Raindrop Size Distribution. Ph.D. Thesis, Chinese Academy of Meteorological Sciences, Beijing, China, 2014. [Google Scholar]
- Silvestro, F.; Rebora, N.; Ferraris, L. An algorithm for real–time rainfall rate estimation by using polarimetric radar: RIME. J. Hydrometeorol. 2009, 10, 227–240. [Google Scholar] [CrossRef]
- Bringi, V.N.; Rico-Ramirez, M.A.; Thurai, M. Rainfall Estimation with an Operational Polarimetric C-Band Radar in the United Kingdom: Comparison with a Gauge Network and Error Analysis. J. Hydrometeorol. 2011, 12, 935–954. [Google Scholar] [CrossRef]
- Lee, G.W. Sources of errors in rainfall measurements by polarimetric radar: Variability of drop size distributions, observational noise, and variation of relationships between R and polarimetric parameters. J. Atmos. Ocean. Technol. 2006, 23, 1005–1028. [Google Scholar] [CrossRef]
- Kwon, S.; Lee, G.; Kim, G. Rainfall Estimation from an Operational S-Band Dual-Polarization Radar: Effect of Radar Calibration. J. Meteorol. Soc. Japan. Ser. II 2015, 93, 65–79. [Google Scholar] [CrossRef] [Green Version]
- Qiming, C.; Boxiang, X.; Liping, L. A Study of The Relation between raininess, extinction of rain cloud and Parameters Measured by a dual linear polarization radar. Chin. J. Plateau Meteorol. 1990, 4, 347–355. [Google Scholar]
- Hongfa, Z.; Baoxiang, X.; Zhijun, W.; Qiming, C. Study on Rainfall Measurement and Raindrop Spectra with Differential Reflectivity Zdr Technique of Dual Linear Polarization Radar. Chin. J. Acta Meteorol. Sin. 1996, 54, 154–165. [Google Scholar] [CrossRef]
- Liu, L.; Ge, R.; Zhang, P. A study of method and accuracy of rainfall rate and liquid water content measurements by dual linear polarization Doppler radar. Chin. J. Atmos. Sci. 2002, 5, 709–720. [Google Scholar]
- Xueqian, M.; Wansheng, D.; Rongzhong, C.; Zhigang, W. Experiment of Rainfall Estimation Using X-Band Dual-Polarized Doppler Weather Radar. Chin. J. Plateau Meteorol. 2008, 2, 382–391. [Google Scholar]
- Yichen, C.; Jinli, L.; Shu, D.; Debin, S.; Daren, L. Application of X-band dual polarization radar in precipitation estimation in summer of Beijing. Chin. J. Clim. Environ. Res. 2012, 17, 292–302. [Google Scholar] [CrossRef]
- Chen, G.; Zhao, K.; Zhang, G.; Huang, H.; Liu, S.; Wen, L.; Yang, Z.L.; Yang, Z.W.; Xu, L.; Zhu, W. Improving polarimetric c–band radar rainfall estimation with two–dimensional video disdrometer observations in eastern China. J. Hydrometeorol. 2017, 18, 1375–1391. [Google Scholar] [CrossRef]
- May, P.T.; Kepert, J.D.; Keenan, T.D. Polarimetric radar observations of the persistently asymmetric structure of tropical cyclone ingrid. Mon. Weather Rev. 2008, 136, 616–630. [Google Scholar] [CrossRef]
- Tokay, A.; Bashor, P.G.; Habib, E.; Kasparis, T. Raindrop size distribution measurements in tropical cyclones. Mon. Weather Rev. 2008, 136, 1669–1685. [Google Scholar] [CrossRef]
- Bringi, V.; Williams, C.; Thural, M.; May, P.T. Using dual-polarized radar and dual-frequency profiler for DSD characterization: A case study from Darwin, Australia. J. Atmos. Ocean. Technol. 647 Ser. II 2009, 84, 705–724. [Google Scholar] [CrossRef]
- Chang, W.; Wang, T.C.; Lin, P. Characteristics of the raindrop size distribution and drop shape relation in typhoon systems in the western racific from the 2D video disdrometer and NCU c-band polarimetric radar. J. Atmos.Ocean. Technol. 2009, 26. [Google Scholar] [CrossRef]
- Baojun, C.; Yuan, W.; Jie, M. Microphysical characteristics of the raindrop size distribution in Typhoon Morakot. J Trop. Meteorol. 2012, 18, 162–171. [Google Scholar]
- Wang, M.; Zhao, K.; Xue, M.; Zhang, G.; Liu, S.; Wen, L.; Chen, G. Precipitation microphysics characteristics of a Typhoon Matmo (2014) rainband after landfall over eastern China based on polarimetric radar observations. J. Geophys. Res. Atmos. 2016, 121. [Google Scholar] [CrossRef]
- Bringi, V.N.; Chandrasekar, V.; Hubbert, J.; Gorgucci, E.; Randeu, W.L.; Schoenhuber, M. Raindrop size distribution in different climatic regimes from disdrometer and dual-polarized radar analysis. J. Atmos. Sci. 2003, 60, 354–365. [Google Scholar] [CrossRef]
- Jiangping, P.; Wei, Z.; Aijun, J.; Aihui, Z.; Kefa, W. Characteristics of gamma raindrop size distribution based on the precipitation particle spectrometer. Chin. J. Sci. Meteorol. Sin. 2010, 30, 701–707. [Google Scholar] [CrossRef]
- Tang, Q.; Xiao, H.; Guo, C.; Feng, L. Characteristics of the raindrop size distributions and their retrieved polarimetric radar parameters in northern and Southern China. Atmos. Res. 2014, 59–75. [Google Scholar] [CrossRef]
- Jaffrain, J.; Berne, A. Experimental quantification of the sampling uncertainty associated with measurements from PARSIVEL disdrometers. J. Hydrometeorol. 2011, 12, 352–370. [Google Scholar] [CrossRef]
- Atlas, D.; Ulbrich, C.W.; Meneghini, R. The multi-parameter remote measurement of rainfall. J. Radio Sci. 1984, 19, 3–22. [Google Scholar] [CrossRef]
- Testud, J.; Oury, S.; Amayenc, P. The concept of “normalized” distribution to describe raindrop spectra: A tool for hydrometeor remote sensing. Phys. Chem. Earth 2000, 25, 897–902. [Google Scholar] [CrossRef]
- Barber, P.; Yeh, C. Scattering of electromagnetic wave by arbitrarily shaped dielectric bodies. J. Appl. Opt. 1975, 14, 2864–2872. [Google Scholar] [CrossRef] [PubMed]
- Pruppacher, H.R.; Beard, K.V. A wind tunnel investigation of the internal circulation and shape of water drops falling at terminal velocity in air. Q. J. Roy. Meteorol. Sci. 1970, 96, 247–256. [Google Scholar] [CrossRef]
- Gorgucci, E.; Scarchilli, G.; Chandrasekar, V. A robust estimator of rainfall rate using differential reflectivity. J. Atmos. Ocean. Technol. 1994, 1, 586–592. [Google Scholar] [CrossRef]
- Gorgucci, E.; Scarchilli, G. Application of multiparameter radar measurements to detect and est intercomparison of multiparameter radar algorithms for estimating of rainfall rate. In Proceedings of the Program 28th Conference on Radar Meterorology, Boston, MA, USA, 7–12 September 1997; p. 1348. [Google Scholar]
- Scharfenberg, K.A.; Miller, D.J.; Schuur, T.J.; Schlatter, P.T.; Giangrande, S.E.; Melnikov, V.M.; Burgess, D.W. The joint polarization experiment: Polarimetric radar in forecasting and warning decision making. Weather Forecast. 2004, 20, 775–788. [Google Scholar] [CrossRef]
- Gao, Y.F.; Chen, Y.D.; Gochis, D.; Ikeda, K.; Ye, J. Analysis of JPOLE algorithm with a dual polarization radar in different precipitation processes. J. Trop. Meteorol. 2014, 2, 361–366. [Google Scholar]
- Noh, S.J.; Lim, S.; Choi, S.W.; Hwang, S.H.; Lee, D.R. Comparison of quantitative precipitation estimation algorithms using dual polarization radar measurements in Korea. J. Acoust. Soc. Am. 2014, 14, 105–116. [Google Scholar] [CrossRef]
- Gorgucci, E.; Scarchilli, G.; Chandrasekar, V. Sensitivity of multiparameter radar rainfall algorithms. J. Geophys. Res. Atmos. 2000, 105, 2215–2223. [Google Scholar] [CrossRef] [Green Version]
- Zhang, Y.; Liu, L.; Wen, H.; Chen, C.; Wang, H.; Xi, B. Development and Assessment of Quantitative Precipitation Estimation Algorithms for S-, C-, and X-band Dual-Polarization Radars Based on Disdrometer Data from Three Regions of China. J. Trop. Meteor. 2018. submitted. [Google Scholar]


| Location | Longitude (′E) | Latitude (′N) | Altitude (m) | Instrument Type | Identification |
|---|---|---|---|---|---|
| Luogang, Guangzhou | 113.48 | 23.21 | 70.7 | LPA10 | LG |
| Baiyun, Guangzhou | 113.25 | 23.27 | 20.0 | LPA10 | BY |
| Nanhai, Foshan | 113.01 | 23.15 | 30.1 | LPA10 | NH |
| Nanxiong, Shaoguan | 114.26 | 25.08 | 149.7 | Parsivel2 | NX |
| Pingyuan, Meizhou | 115.87 | 24.56 | 200.8 | Parsivel2 | PY |
| RenHua, Shaoguan | 113.76 | 25.06 | 111.7 | Parsivel2 | RH |
| Longchuan, Heyuan | 115.28 | 24.11 | 179.6 | Parsivel2 | LC |
| Huidong, Huizhou | 115.03 | 23.08 | 86.0 | Parsivel2 | HD |
| Yingde, Qingyuan | 113.17 | 24.37 | 230.0 | Parsivel2 | YD |
| Gaozhou, Maoming | 111.02 | 22.05 | 115.0 | Parsivel2 | GZ |
| Precipitation Type | Weather Event | Observation Period | Observatory (ID) | Samples (Number) |
|---|---|---|---|---|
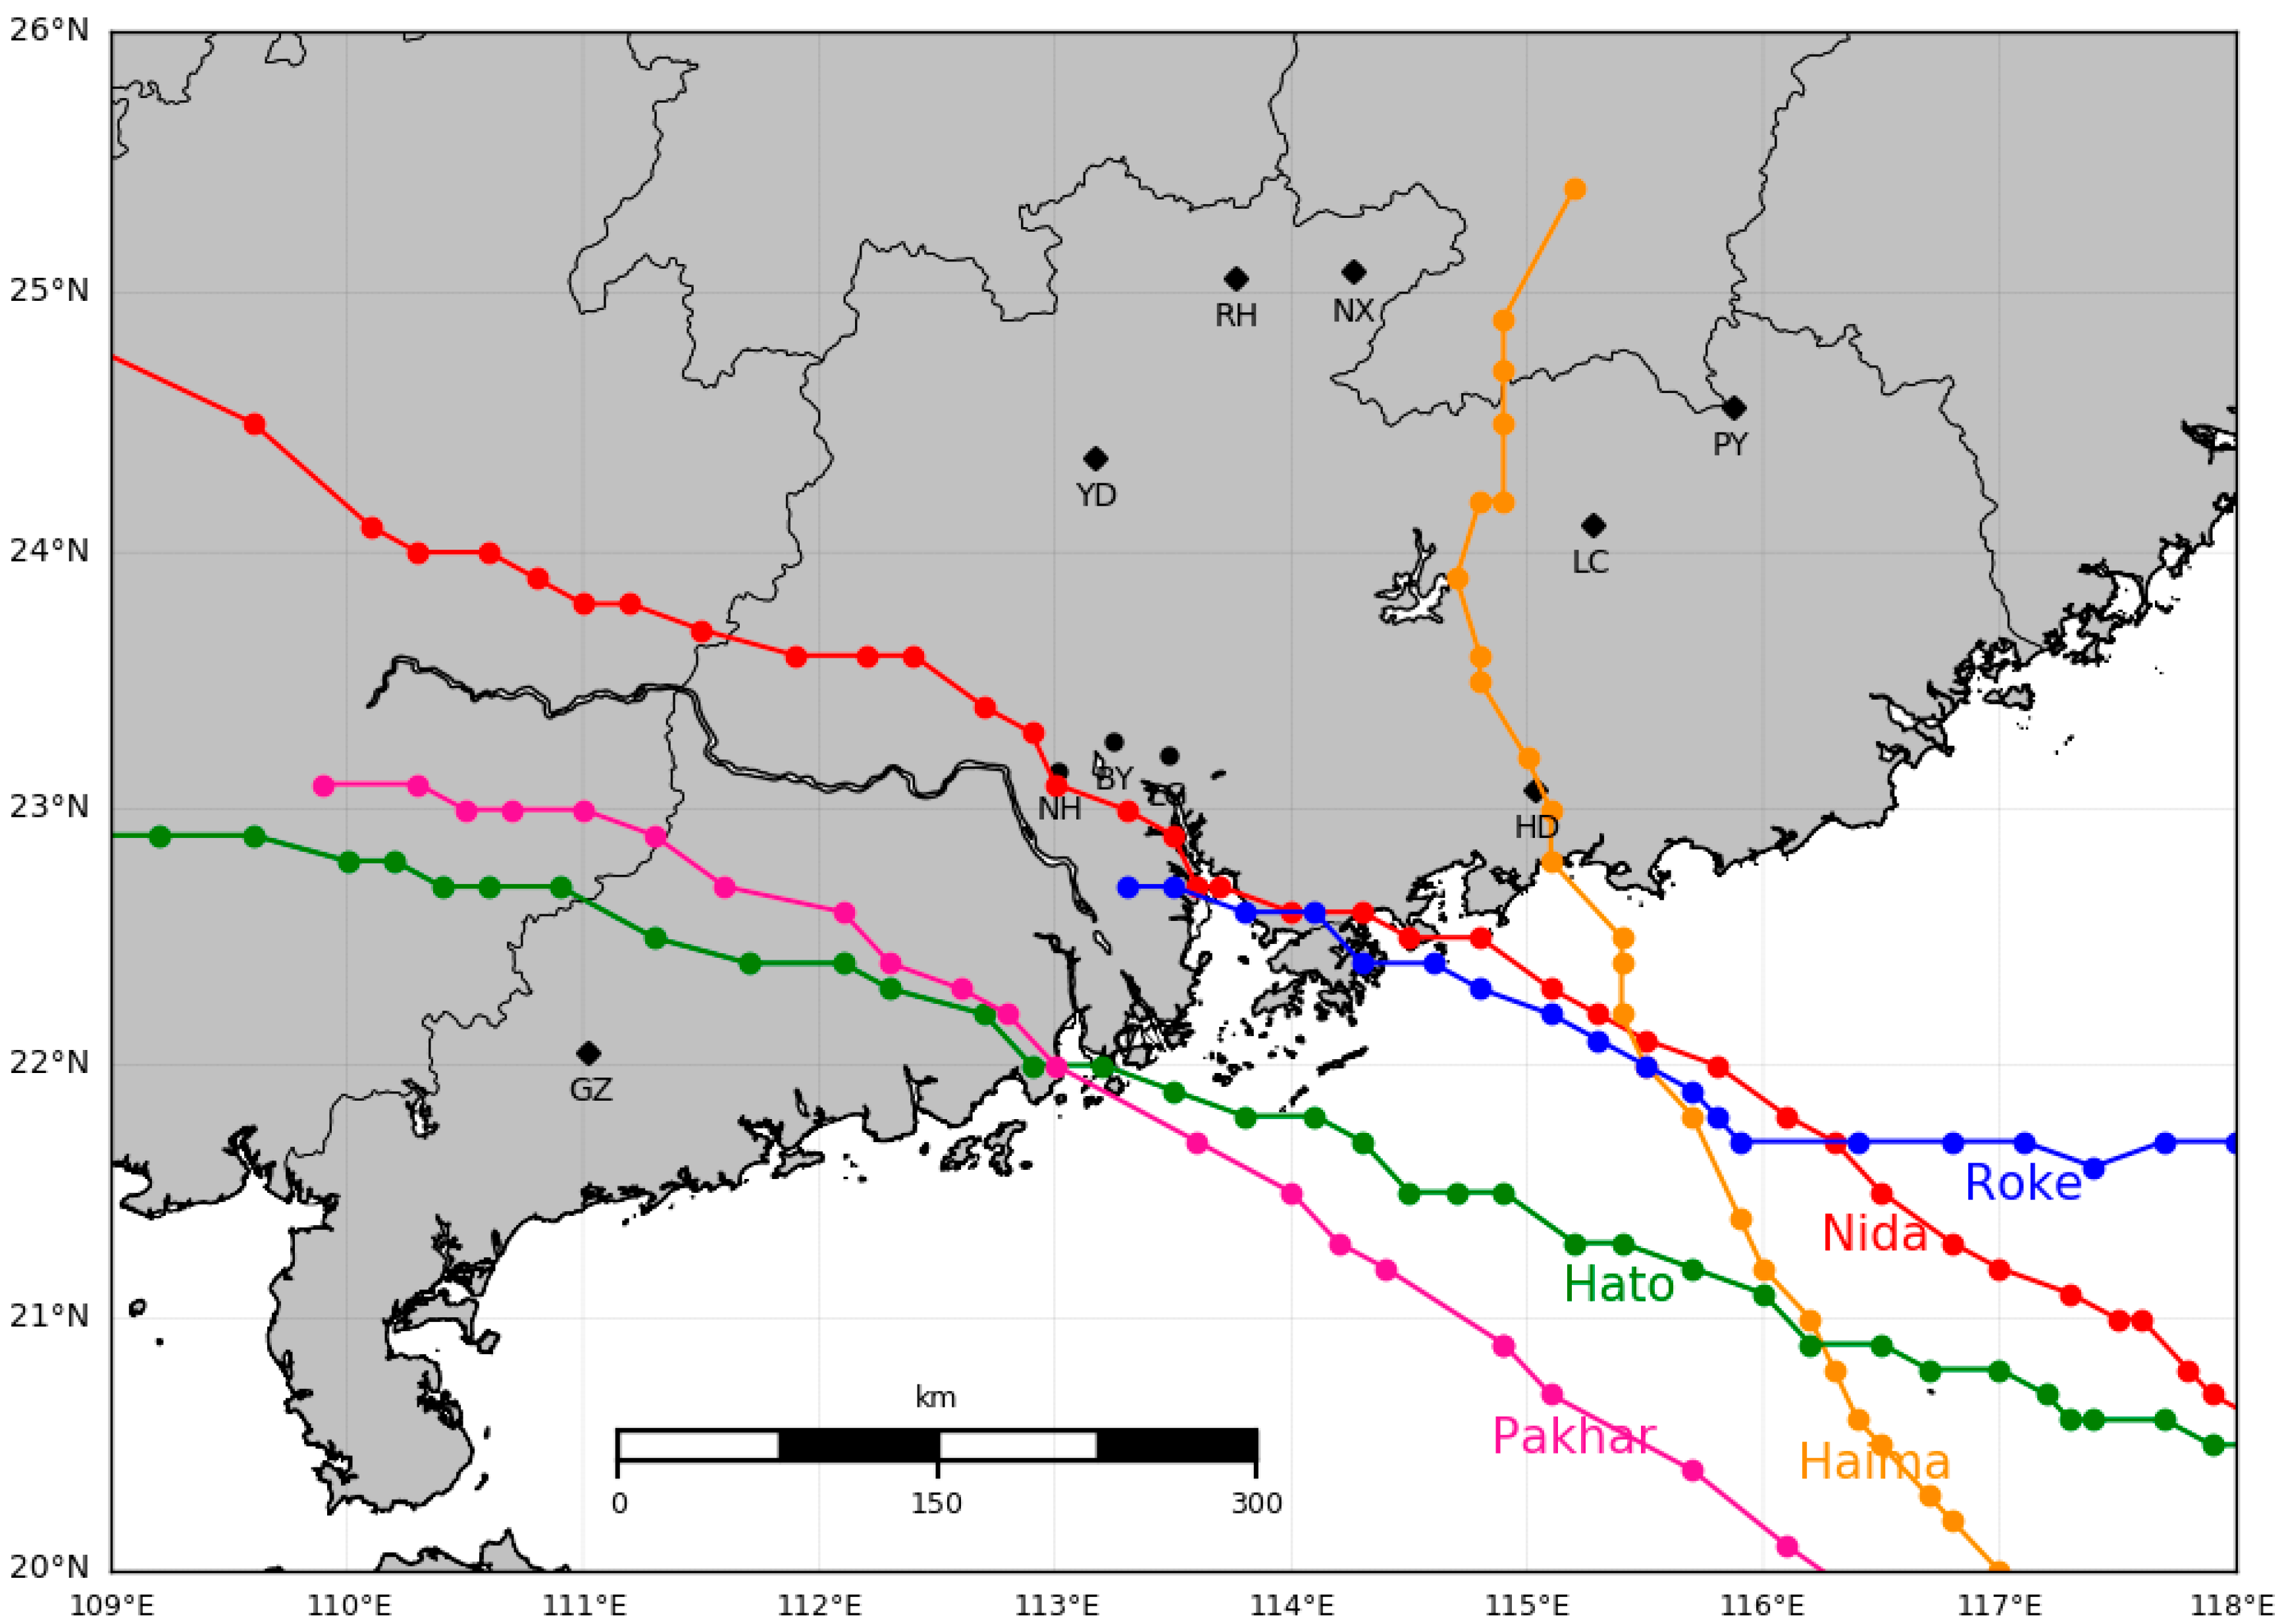
| Typhoon | Nida (1604) | 3:00~18:00, August 2, 2016 | LG, BY, NH, NX, PY, RH, YD | 3054 |
| Haima (1622) | 12:00~21:00, October 21, 2016 | BY, NH, NX, PY, RH, YD | 1845 | |
| Roke (1707) | 10:00~19:00, July 23, 2017 | LG, BY, NH, NX, LC, HD, YD, GZ | 1592 | |
| Hato (1713) | 5:00~17:00, August 23, 2017 | LG, BY, NH, NX, PY, RH, LC, HD, YD, GZ | 3370 | |
| Pakhar (1714) | 0:00~14:00, August 27, 2017 | LG, BY, NH, NX, PY, RH, LC, HD, YD, GZ | 5193 | |
| Squall line | 20160413 | 1:00~12:00, April 13, 2016 | LG, BY, NH, NX, PY, RH, HD, GZ | 767 |
| 20160417 | 17:00, April 17, 2016~4:00, April 18, 2016 | LG, NX, LC, GZ | 496 | |
| 20170421 | 10:00~20:00, April 21, 2016 | LG, BY, NH, NX, PY, RH, TD | 1322 |
| Precipitation System | Estimator | a | b | c |
|---|---|---|---|---|
| Typhoons | R1(ZH) | 0.060 | 0.587 | X |
| R2(KDP) | 33.614 | 0.833 | X | |
| R3(ZH, ZDR) | 0.012 | 0.882 | −0.358 | |
| R4(KDP, ZDR) | 52.801 | 0.957 | −0.113 | |
| Squall lines | R1(ZH) | 0.020 | 0.677 | X |
| R2(KDP) | 32.023 | 0.881 | X | |
| R3(ZH, ZDR) | 0.007 | 0.947 | −0.409 | |
| R4(KDP, ZDR) | 61.027 | 0.983 | −0.146 |
| Precipitation System | Estimator | CC | RMSE (mm/h) | NE (%) | NB (%) |
|---|---|---|---|---|---|
| Typhoons | R1(ZH) | 0.952 | 3.564 | 27.37 | 3.65 |
| R2(KDP) | 0.990 | 1.622 | 12.36 | 2.65 | |
| R3(ZH, ZDR) | 0.992 | 1.505 | 12.78 | −2.49 | |
| R4(KDP, ZDR) | 0.996 | 1.043 | 7.75 | 0.08 | |
| Squall lines | R1(ZH) | 0.943 | 6.621 | 27.00 | 0.97 |
| R2(KDP) | 0.988 | 3.139 | 11.60 | 0.81 | |
| R3(ZH, ZDR) | 0.995 | 2.030 | 8.78 | −0.75 | |
| R4(KDP, ZDR) | 0.996 | 1.823 | 6.66 | 0.59 |
| Precipitation Type | Estimator | a | b | c |
|---|---|---|---|---|
| Typhoon | R1(ZH) | 0.060 | 0.587 | X |
| R2(KDP) | 36.776 | 0.752 | X | |
| R3(ZH, ZDR) | 0.0253 | 0.842 | −0.578 | |
| R4(KDP, ZDR) | 52.778 | 0.929 | −0.117 | |
| Squall line | R1(ZH) | 0.020 | 0.677 | X |
| R2(KDP) | 36.260 | 0.788 | X | |
| R3(ZH, ZDR) | 0.018 | 0.837 | −0.433 | |
| R4(KDP, ZDR) | 55.773 | 0.940 | −0.130 |
| KDP (°/km) | CFM | PFM | ||
|---|---|---|---|---|
| R_TY (mm/h) | R_SQ (mm/h) | R_TY (mm/h) | R_SQ (mm/h) | |
| 0.5 | 18.87 | 17.39 | 21.84 | 21.00 |
| 1 | 33.61 | 32.02 | 36.78 | 36.26 |
| 1.5 | 47.12 | 45.77 | 49.89 | 49.91 |
| 2 | 59.89 | 58.97 | 61.93 | 62.61 |
| 2.5 | 72.13 | 71.77 | 73.25 | 74.65 |
| 3 | 83.96 | 84.28 | 84.01 | 86.18 |
| 3.5 | 95.46 | 96.53 | 94.34 | 97.31 |
| 4 | 106.70 | 108.58 | 104.31 | 108.11 |
| Precipitation Type (Standard Value) | Fitting Method | Average R | CC | RMSE(mm/h) | NE (%) | NB (%) |
|---|---|---|---|---|---|---|
| Typhoon (6.49) | PFM | 6.49 | 0.994 | 1.227 | 8.39 | −0.006 |
| CFM | 6.32 | 0.993 | 1.349 | 10.68 | −2.62 | |
| Squall Line (11.15) | PFM | 11.15 | 0.991 | 2.608 | 8.25 | 0.050 |
| CFM | 11.03 | 0.991 | 2.728 | 9.10 | −1.08 |
© 2019 by the authors. Licensee MDPI, Basel, Switzerland. This article is an open access article distributed under the terms and conditions of the Creative Commons Attribution (CC BY) license (http://creativecommons.org/licenses/by/4.0/).
Share and Cite
Zhang, Y.; Liu, L.; Bi, S.; Wu, Z.; Shen, P.; Ao, Z.; Chen, C.; Zhang, Y. Analysis of Dual-Polarimetric Radar Variables and Quantitative Precipitation Estimators for Landfall Typhoons and Squall Lines Based on Disdrometer Data in Southern China. Atmosphere 2019, 10, 30. https://doi.org/10.3390/atmos10010030
Zhang Y, Liu L, Bi S, Wu Z, Shen P, Ao Z, Chen C, Zhang Y. Analysis of Dual-Polarimetric Radar Variables and Quantitative Precipitation Estimators for Landfall Typhoons and Squall Lines Based on Disdrometer Data in Southern China. Atmosphere. 2019; 10(1):30. https://doi.org/10.3390/atmos10010030
Chicago/Turabian StyleZhang, Yonghua, Liping Liu, Shuoben Bi, Zhifang Wu, Ping Shen, Zhenlang Ao, Chao Chen, and Yang Zhang. 2019. "Analysis of Dual-Polarimetric Radar Variables and Quantitative Precipitation Estimators for Landfall Typhoons and Squall Lines Based on Disdrometer Data in Southern China" Atmosphere 10, no. 1: 30. https://doi.org/10.3390/atmos10010030