The Study of Ar I and Ne I Spectral Line Shapes in the Cathode Sheath Region of an Abnormal Glow Discharge

Faculty of Agriculture, University of Belgrade, 11080 Belgrade, Serbia
Atoms 2019, 7(1), 9; https://doi.org/10.3390/atoms7010009
Submission received: 30 November 2018
/
Revised: 31 December 2018
/
Accepted: 3 January 2019
/
Published: 9 January 2019
(This article belongs to the Special Issue SPIG2018)
Abstract
:The cathode sheath (CS) region is the most important part of abnormal glow discharge (GD), where various processes relevant for the operation and application occur. The most important parameter of the CS is the distribution of electric field strength E which is of crucial importance for charged particles acceleration, their trajectories, kinetic energies, and collisions with other particles and cathode sputtering. All these processes are relevant for the operation of GD as well as for numerous applications in the field of spectroscopic analysis, plasma etching, thin film deposition, and depth profiling of cathode material. Thus, the importance of non-perturbing technique for E distribution measurement in the CS region was recognized long time ago. Within this article, a simple technique based on standard optical emission spectroscopy (OES) and typical laboratory equipment has been used for E mapping in the CS region of an abnormal glow discharge.
1. Introduction
Over several past decades, glow discharges (GD) have been successfully used as the excitation sources in analytical spectroscopy of metal and alloy samples, as well as in their depth profiling [1,2,3]. For successful operation and maintenance of GD, their cathode sheath (CS) region turns out to be of crucial importance. The condition necessary for successful use of the CS region for investigation of electric field was first given by Lo Surdo see e.g., [4]. By reduction of the distance between cathode and anode, a great potential drop located in a few millimeters is attained. In such a way, an appreciable density of the electric current arises, and this is of vital importance for the intensity of light emitted from the discharge.
In the cathode sheath region, the emitted spectral lines exhibit a direct current (dc) Stark effect under the influence of electric field E, causing splitting of the radiation into Stark components and their Stark shifting. A well-established method for the measurement of electric field is based on the spectroscopy of the first two hydrogen Balmer lines (Hα, Hβ), which exhibit a linear dc Stark effect, see for instance [4].
Recent studies of He I lines, see e.g., [5,6,7,8,9,10,11,12], indicate that some of the He I lines may be used for low electric field E measurement with an accuracy of several percent. Other experiments were performed with argon and neon as the working gas, where the spectral lines of argon and neon atoms, Ar I and Ne I, exhibit a quadratic Stark effect, see e.g., [13,14,15,16]. Most of these experiments were performed at relatively high E values exceeding 100 kVcm−1. A theoretical study of neutral neon lines was given by Ziegelbecker and Schnizer [17].
Because glow discharge sources were intensively used for applications in optical emission spectroscopy (OES), it has become evident that reliable wavelength tables of glow discharge spectra are needed. A group of authors decided to overcome this lack of data and began measuring and comparing GD wavelengths and line intensity data with other available sources of information [18]. For the measurement of line intensity and wavelength several instruments were used, see [18] for details. In order to achieve a high spectral resolution a Fourier transform spectrometer is used (FTS). As a light source, a Grimm-type GD with 4 mm anode hole operated at the pressure of about 15 mbar in argon or neon is used. This analytical GD source is built on the basis of the Grimm original design [19]. All discharge observations are carried out end-on through the anode opening, perpendicular to the cathode surface, with argon and neon as working gas. These two gases were used most frequently to operate an analytical GD. This investigation showed that some Ar I and Ne I lines have large widths, exceeding 4–5 times the instrumental width, and in addition to line broadening, red shifting of lines has also been detected [20].
Theoretically speaking, there are two possible reasons for the broadening and shifting of non-hydrogenic spectral lines in a Grimm GD source observed perpendicular to the cathode surface. These are: (i) the dc Stark effect within the cathode sheath region; and (ii) plasma broadening in the negative glow (NG) region. The aim of this work is to study and explain the origin of large widths and shifts detected in [18], as well as to supply experimental Stark shift data for several Ne I lines not studied before. The explanation is of importance for the application of new wavelength tables and may have a considerable importance to preventing possible misinterpretation of the profile wavy features as a weak radiation emitted by some elements that are contained in traces in the samples under study. Also, an appropriated method for measurement of electric field in CS region was developed.
2. Description of Experimental Setup
The discharge source, a modified Grimm GD, was laboratory made after a Ferreira et al. design [21]. A hollow anode 30 mm long with inner and outer diameter 8 mm and 13 mm, respectively, has a longitudinal slot (16 mm long and 1.5 mm wide) for side-on observations along the discharge axis, see Figure 1. The water-cooled cathode holder has an exchangeable electrode (Fe, W), 18 mm long and 7.60 mm in diameter, which screws tightly into its holder to ensure good cooling.
Experiments were carried out with argon (purity 99.999%) and mixture of neon and hydrogen (vol. 99.2% Ne + 0.8% H2). The continuous flow of about 300 cm3/min of working gases was sustained in the pressure range 5–10 mbar by means of needle valve and two two-stage mechanical vacuum pumps. The reported results for gas pressure represent an average between gas inlet and outlet pressure measurements.
To run the discharge a current stabilized dc power supply (0–2 kV, 0–100 mA) is used. A ballast resistor of 5.3 kΩ is placed in series with the discharge and the power supply. Spectroscopic observations of Grimm GD were performed end-on, while for axial intensity distribution of side-on radiation observed through the anode slot, the discharge tube was moved in ≈0.125 mm steps. The light from the discharge was focused with an achromatic lens (focal length 75.8 mm) with 1:1 magnification onto the 20 μm entrance slit (height restriction 2 mm) of 2 m focal length Ebert type spectrometer with 651 g/mm reflection grating blazed at 1050 nm. For the line shape measurements, the reciprocal dispersion of 0.37 nm/mm in second diffraction order is used. All spectral measurements were performed with an instrumental profile very close to Gaussian form with measured full width at half maximum (FWHM) of 0.0082 nm. Signals from CCD detector (29.1 mm length, 3648 pixels, 1 pixel ≈ 0.00278 nm) were A/D converted, collected, and processed by PC.
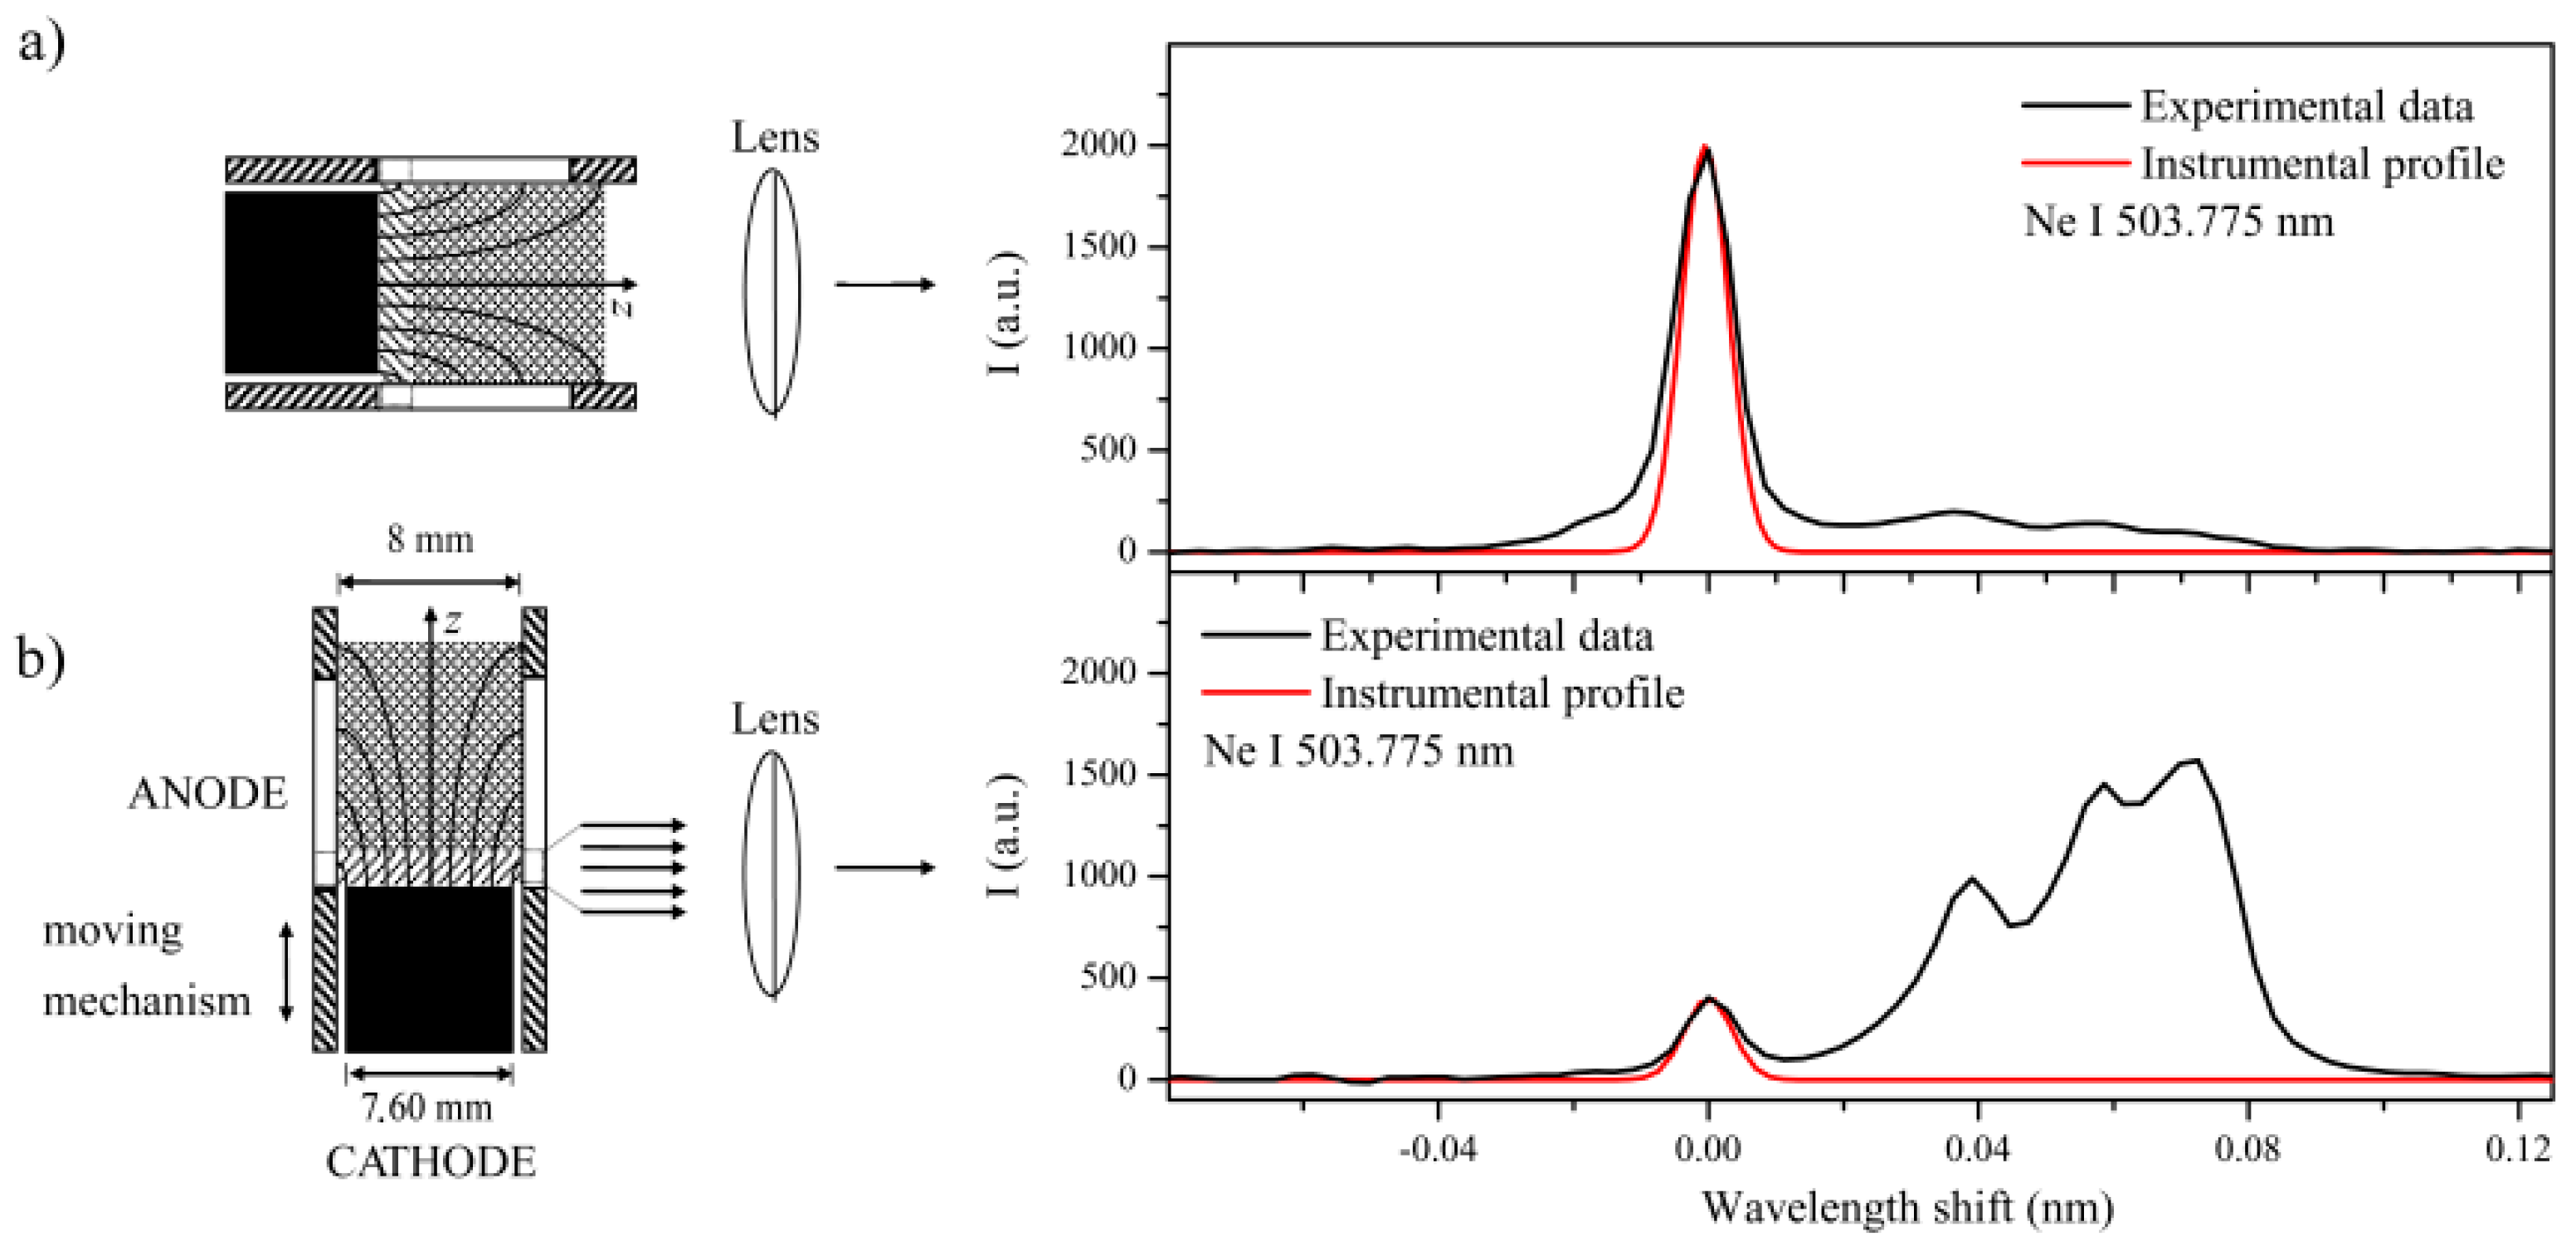
The spectral lines were observed along the axis of a cylindrical glow discharge perpendicular to the cathode surface, see end-on profile in Figure 1a, and parallel to the cathode surface, see side-on profile in Figure 1b. The overall profile of the Ne I 503.775 nm spectral line recorded end-on comprises of the pronounced central peak and a wavy red wing, see Figure 1a.
3. Historical Background
3.1. The dc Stark Effect on Ar I Spectral Lines
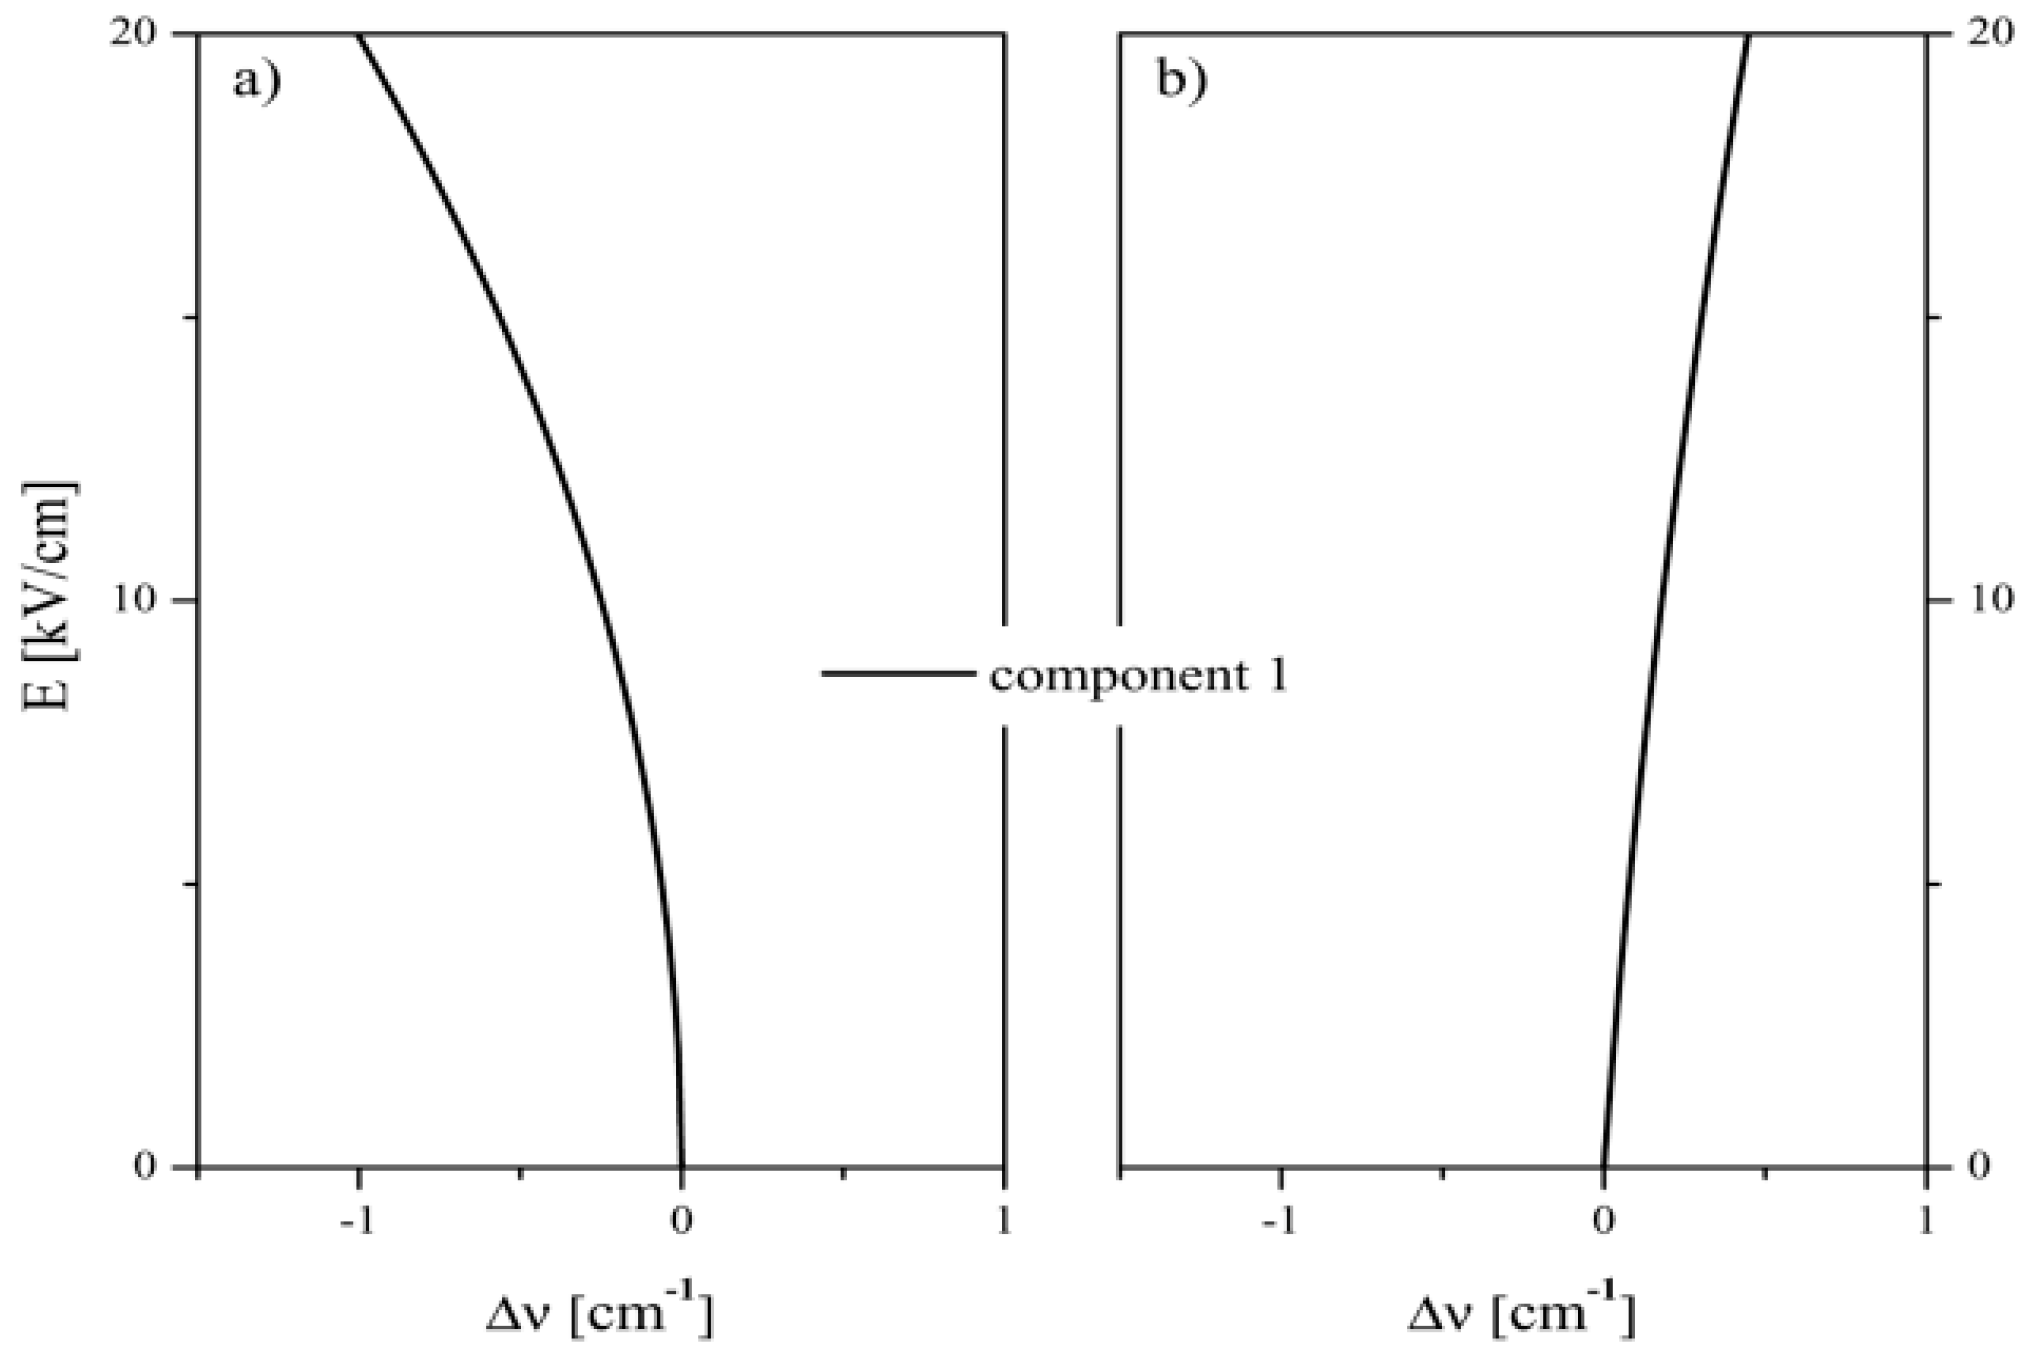
The line shifting of ninety-one Ar I lines with electric field were studied in [13]. Only two Ar I lines from this study are detected in our experimental conditions, see Table 1 containing their configuration, term values and total angular momentum. The shifting of the non-degenerate upper level of Ar I 522.127 nm as a function of electric field strength E can be evaluated by means of the approximate formulas [13]:
and for the upper level of Ar I 518.775 nm line by the following Formula [13]:
where: in both formulas represents the change of wave number of level i; E is the strength of electric field, while a1, a2, A1, and A2 are the algebraic coefficients for the studied energy levels taken from Tables III and IV in [13]. The list of studied Ar I lines with relevant spectroscopic data is given in Table 1, and the list of algebraic coefficients for these lines is given in Table 2.
Examples of Stark shifts for the Ar I 522.127 nm and the Ar I 518.775 nm lines are given in Figure 2a,b, respectively, as electric field strength E against the change of wave number .
3.2. The dc Stark Effect on Ne I Spectral Lines
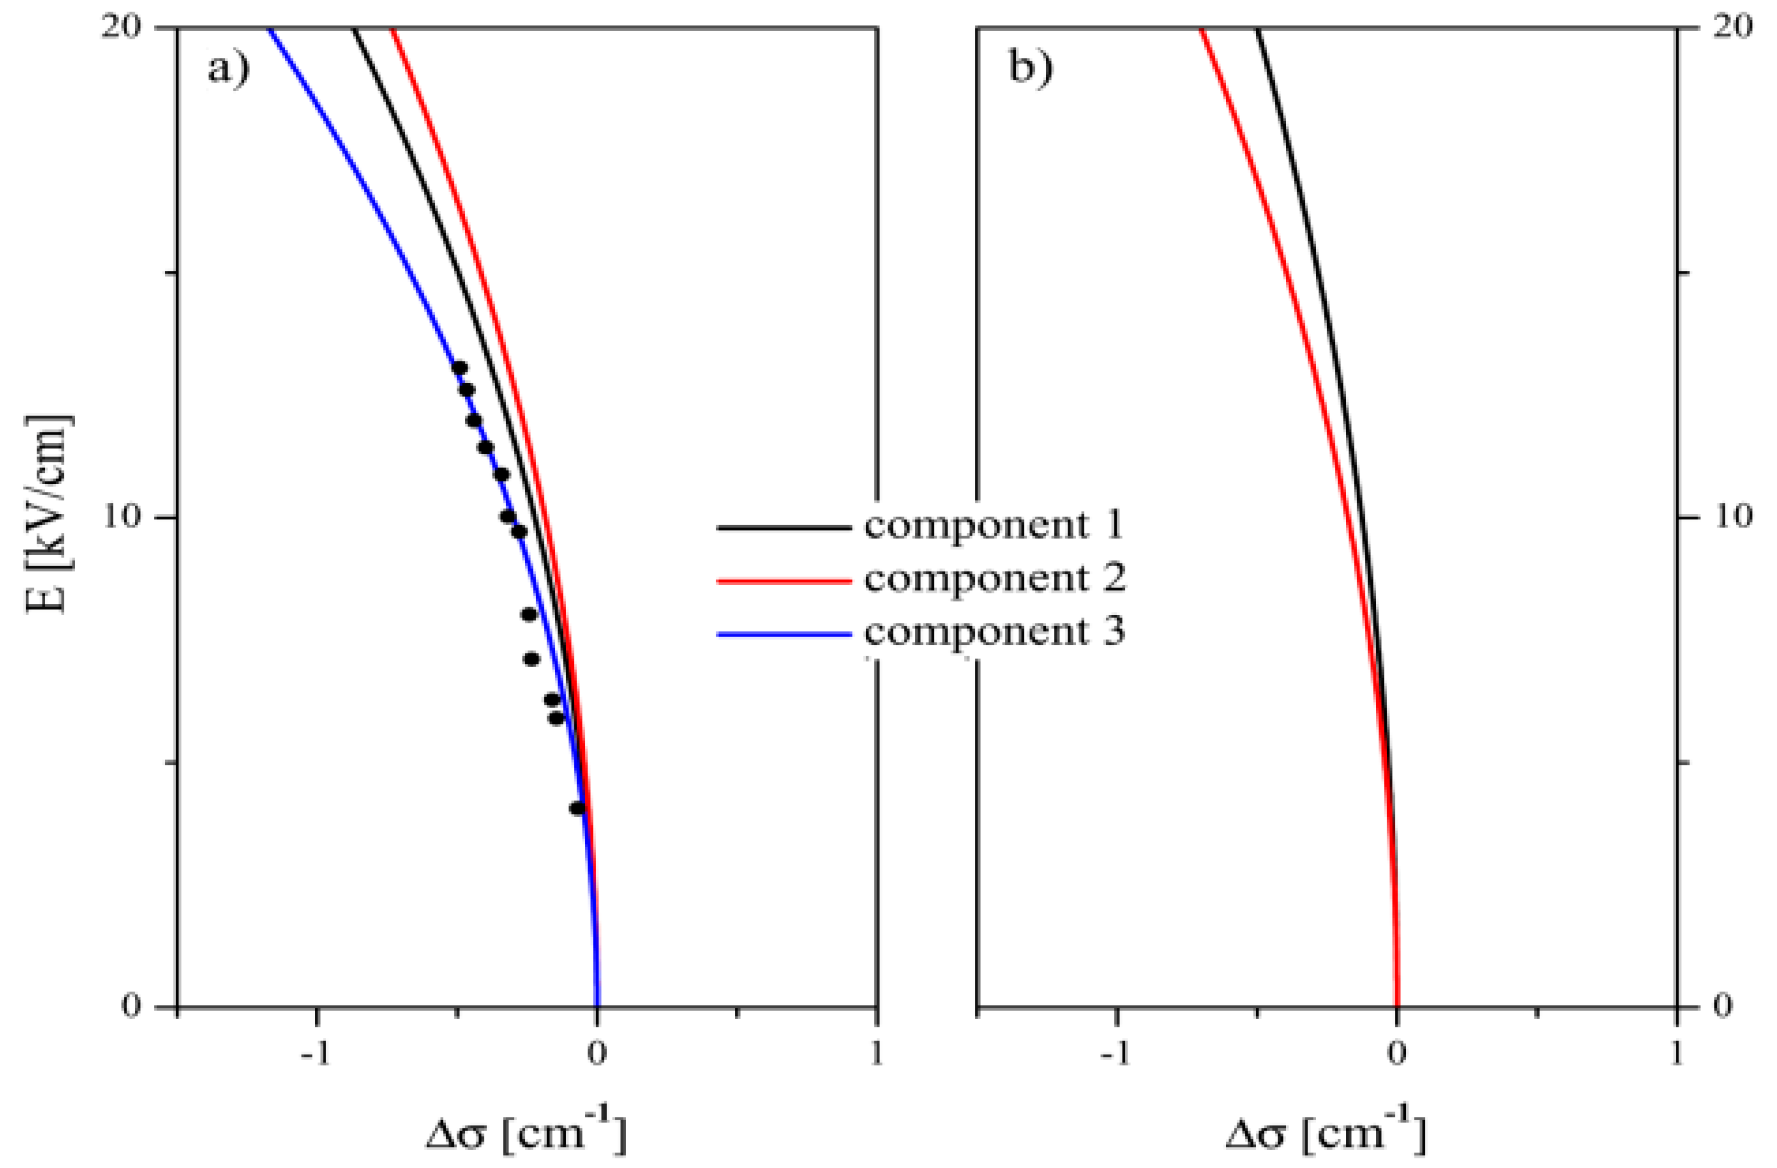
In Table 3, the list of studied Ne I spectral lines are presented. For the two Ne I spectral lines denoted with asterisk, the relevant dc Stark shift data are taken from [14].
In reference [14], Jäger and Windholz presented the results of experimental study of dc Stark shift for 141 Ne I lines corresponding to 31 levels of neon atom. This study showed that the relation between electric field strength E and measured wave number shifts Δσ can be approximated in a rather wide range of E by the analytical expressions:
resulting in explicit form:
In Equations (3) and (4), the parameters A1, A2, and A3 are the line-specific coefficients chosen in such way to obtain the best agreement with experimental data. The values of these three coefficients for each Stark component of Ne I 511.367 nm (3 components) and Ne I 534.109 nm line (2 components), are presented in Table 4 in accordance with [14].
The Stark shift dependence versus electric field strength E for the Ne I 511.367 nm line and the Ne I 534.109 nm line are given in Figure 3a,b, respectively.
4. Results
Taking into consideration the results of analytical GD investigation presented in [22], the first end-on recordings were performed on Ne I 503.775 nm line. One may notice that the overall profile of Ne I 503.775 nm line comprises the central peak and a wavy red wing, see Figure 1a. The central peak dominantly consists of the unshifted radiation from the NG region, while the wavy wing consists of the red-shifted radiation from the CS region due to quadratic dc Stark effect. When observed side-on, the profile of Ne I 503.775 nm line emitted in the vicinity of cathode surface shows a complex structure, see Figure 1b. From this Ne I profile, one can easily recognize a small central peak of the unshifted radiation, followed by a pronounced red wing consisting of three components with different red shifts. The unshifted radiation is emitted from the discharge protruding outside of electric field region, and this phenomenon was noticed earlier in the study of He I lines in the same type of discharge [6]. The presence of unshifted radiation enabled us to measure dc Stark shift of studied lines. Increasing the distance to the cathode, the position of shifted profiles maxima move towards the central peak due to decrease of E, which falls to zero at the boundary between CS and NG region. For that reason, the three wavy peaks of the end-on profile, representing the integral radiation both from CS and NG, are shifted somewhat towards the central peak but remain correlated with the maxima of the presented Ne I side-on profile. On the basis of this research, one may conclude that the wavy forms observed during end-on recordings, are the result of superposition of line intensities emitted from the CS region (the influence of the dc Stark effect) and the NG region. It is important to mention that similar behavior was observed as well for other investigated spectral lines (Ar I and Ne I), but the Ne I 503.775 nm line represent the best example. The primary goals of this work are the study of Ar I and Ne I spectral lines emitted from CS region, the measurement of dc Stark shifts and determination of the electric field distribution along CS region of Grimm type abnormal glow discharge.
4.1. Results of the dc Stark Shift Measurements for Ar I Lines
Although, a numerous Ar I lines in the presence of dc electric field were already investigated (E > 60 kV/cm) [13], under our experimental conditions (E<15 kV/cm), only two Ar I spectral lines with noticeable dc Stark effect are detected. From Figure 2a one may notice that Ar I 522.127 nm line shifts toward higher wavelengths (smaller wave numbers). For the Ar I 518.775 nm line, the dc Stark shift is smaller and directed toward the blue spectral region (shorter wavelengths), see Figure 2b. The dc Stark shift of Ar I 518.775 nm line as well as other Ar I lines originating from versatile upper levels shows a complex dependence on E [13]. For these levels, a maximum shift takes place at certain field strength, and above this value the shift decreases. A thorough investigation of Ar I 518.775 nm line was made in [23]. Here, for the sake of electric field distribution measurement, Ar I 522.127 nm line was used.
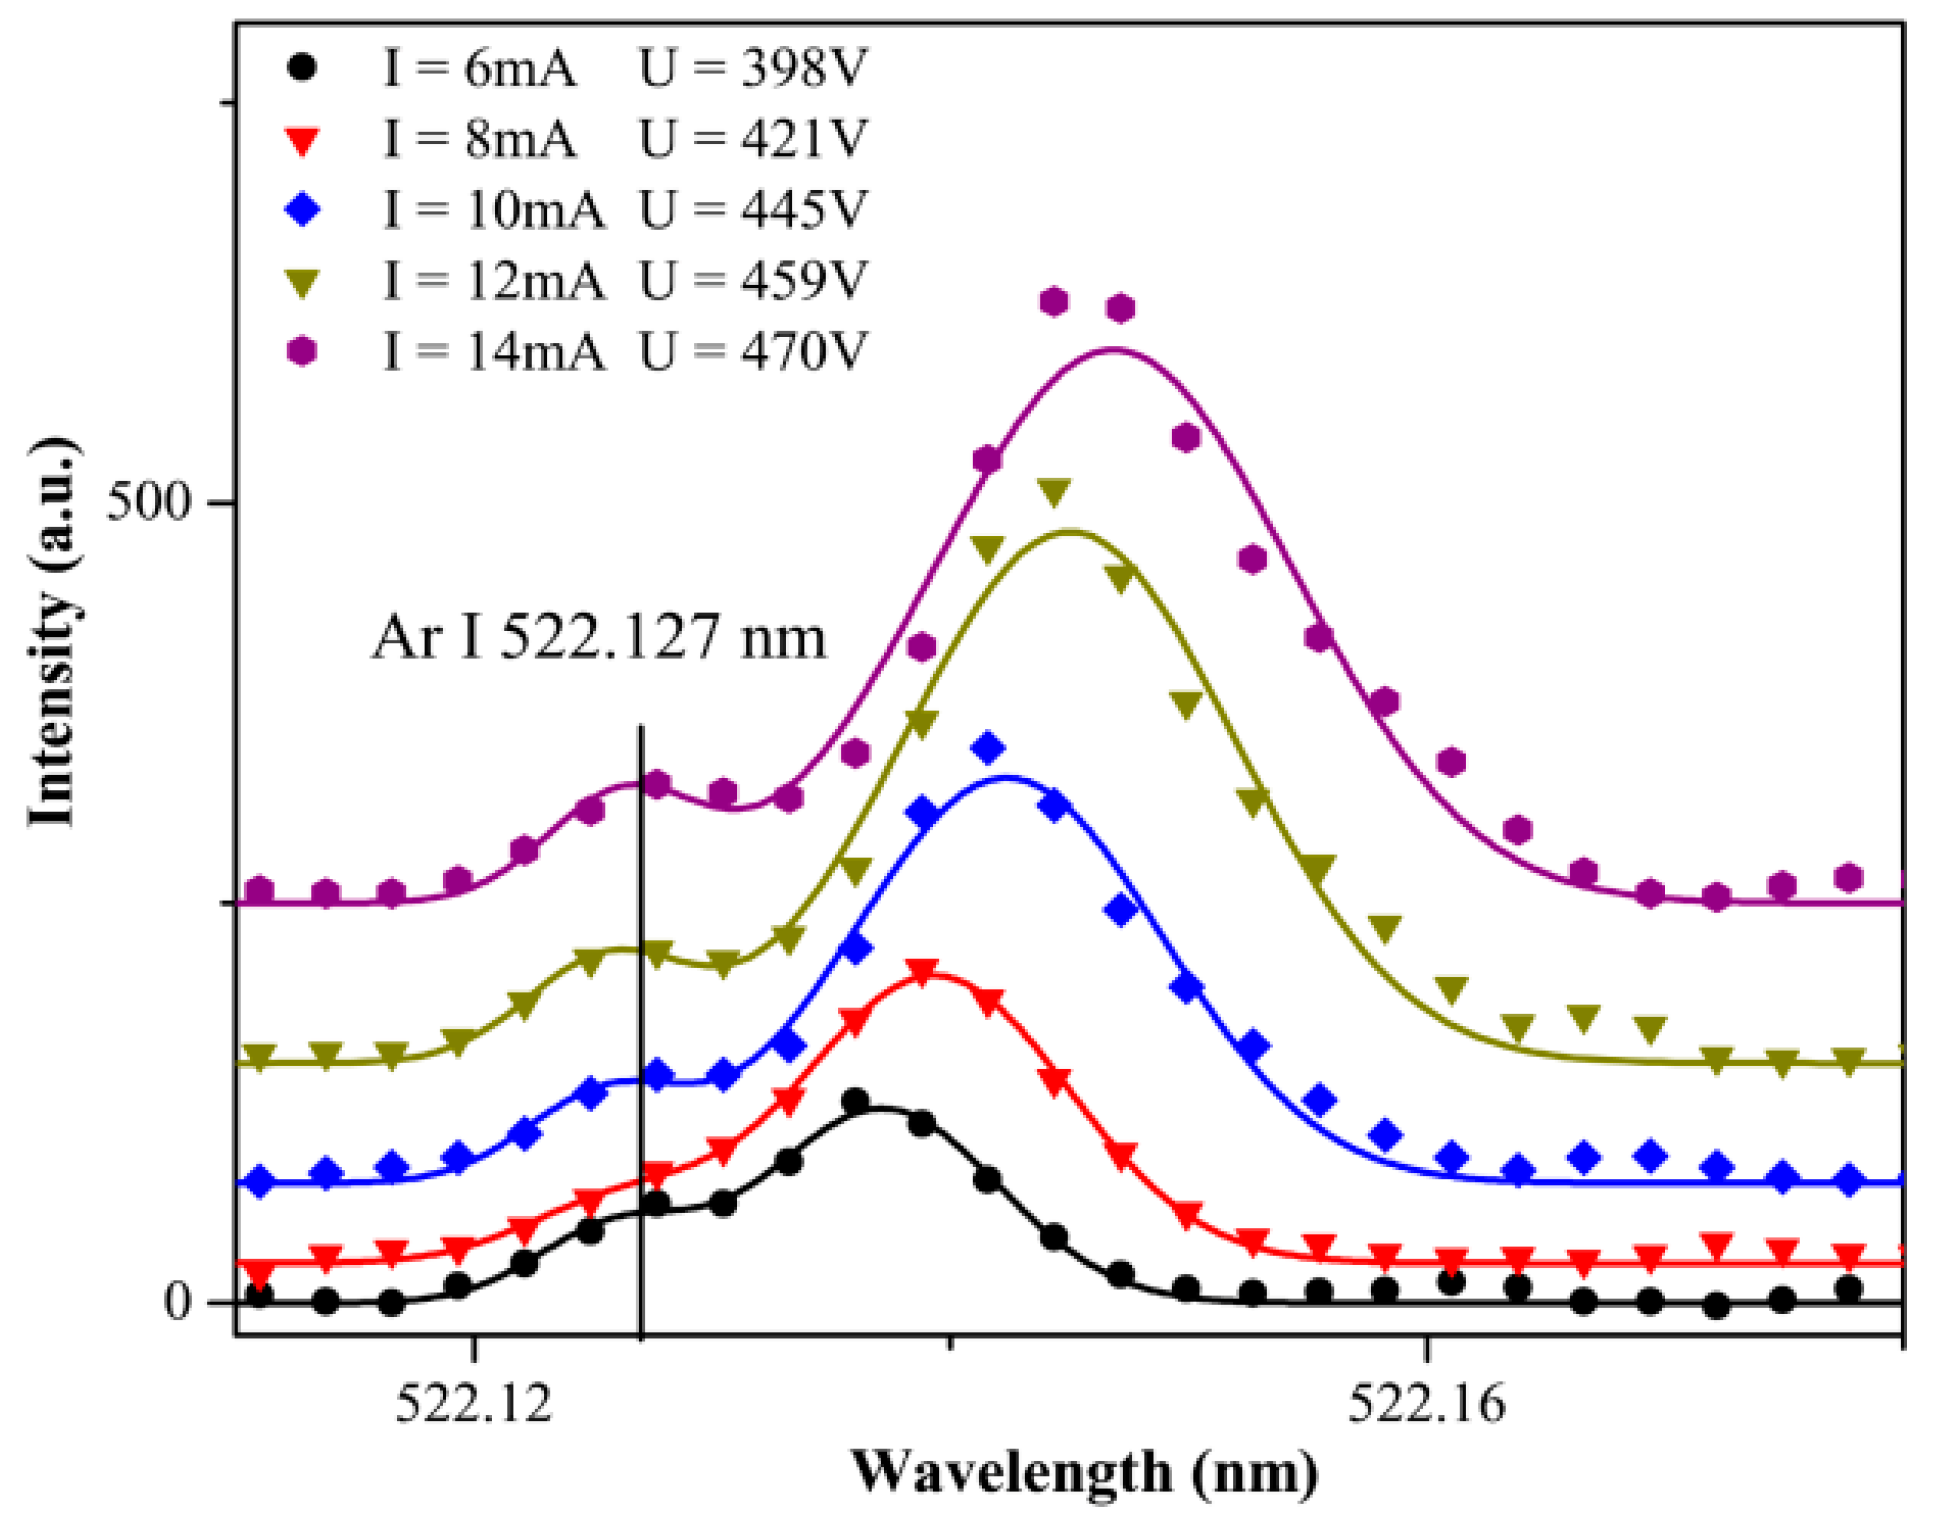
In order to confirm the influence of the dc Stark effect on the profiles of Ar I 522.127 nm line, a simple experiment was carried out. The profile of Ar I spectral line was recorded side-on near the cathode surface, where the maximum strength of the electric field is expected. The change in observed Ar I 522.127 nm spectral line profiles with the input electrical power (primarily by increasing the discharge current) is shown in Figure 4. For different values of electrical power, the profile of Ar I 522.127 nm spectral line shows different values of dc Stark shifts and the width, which indicates the presence of dc Stark effect.
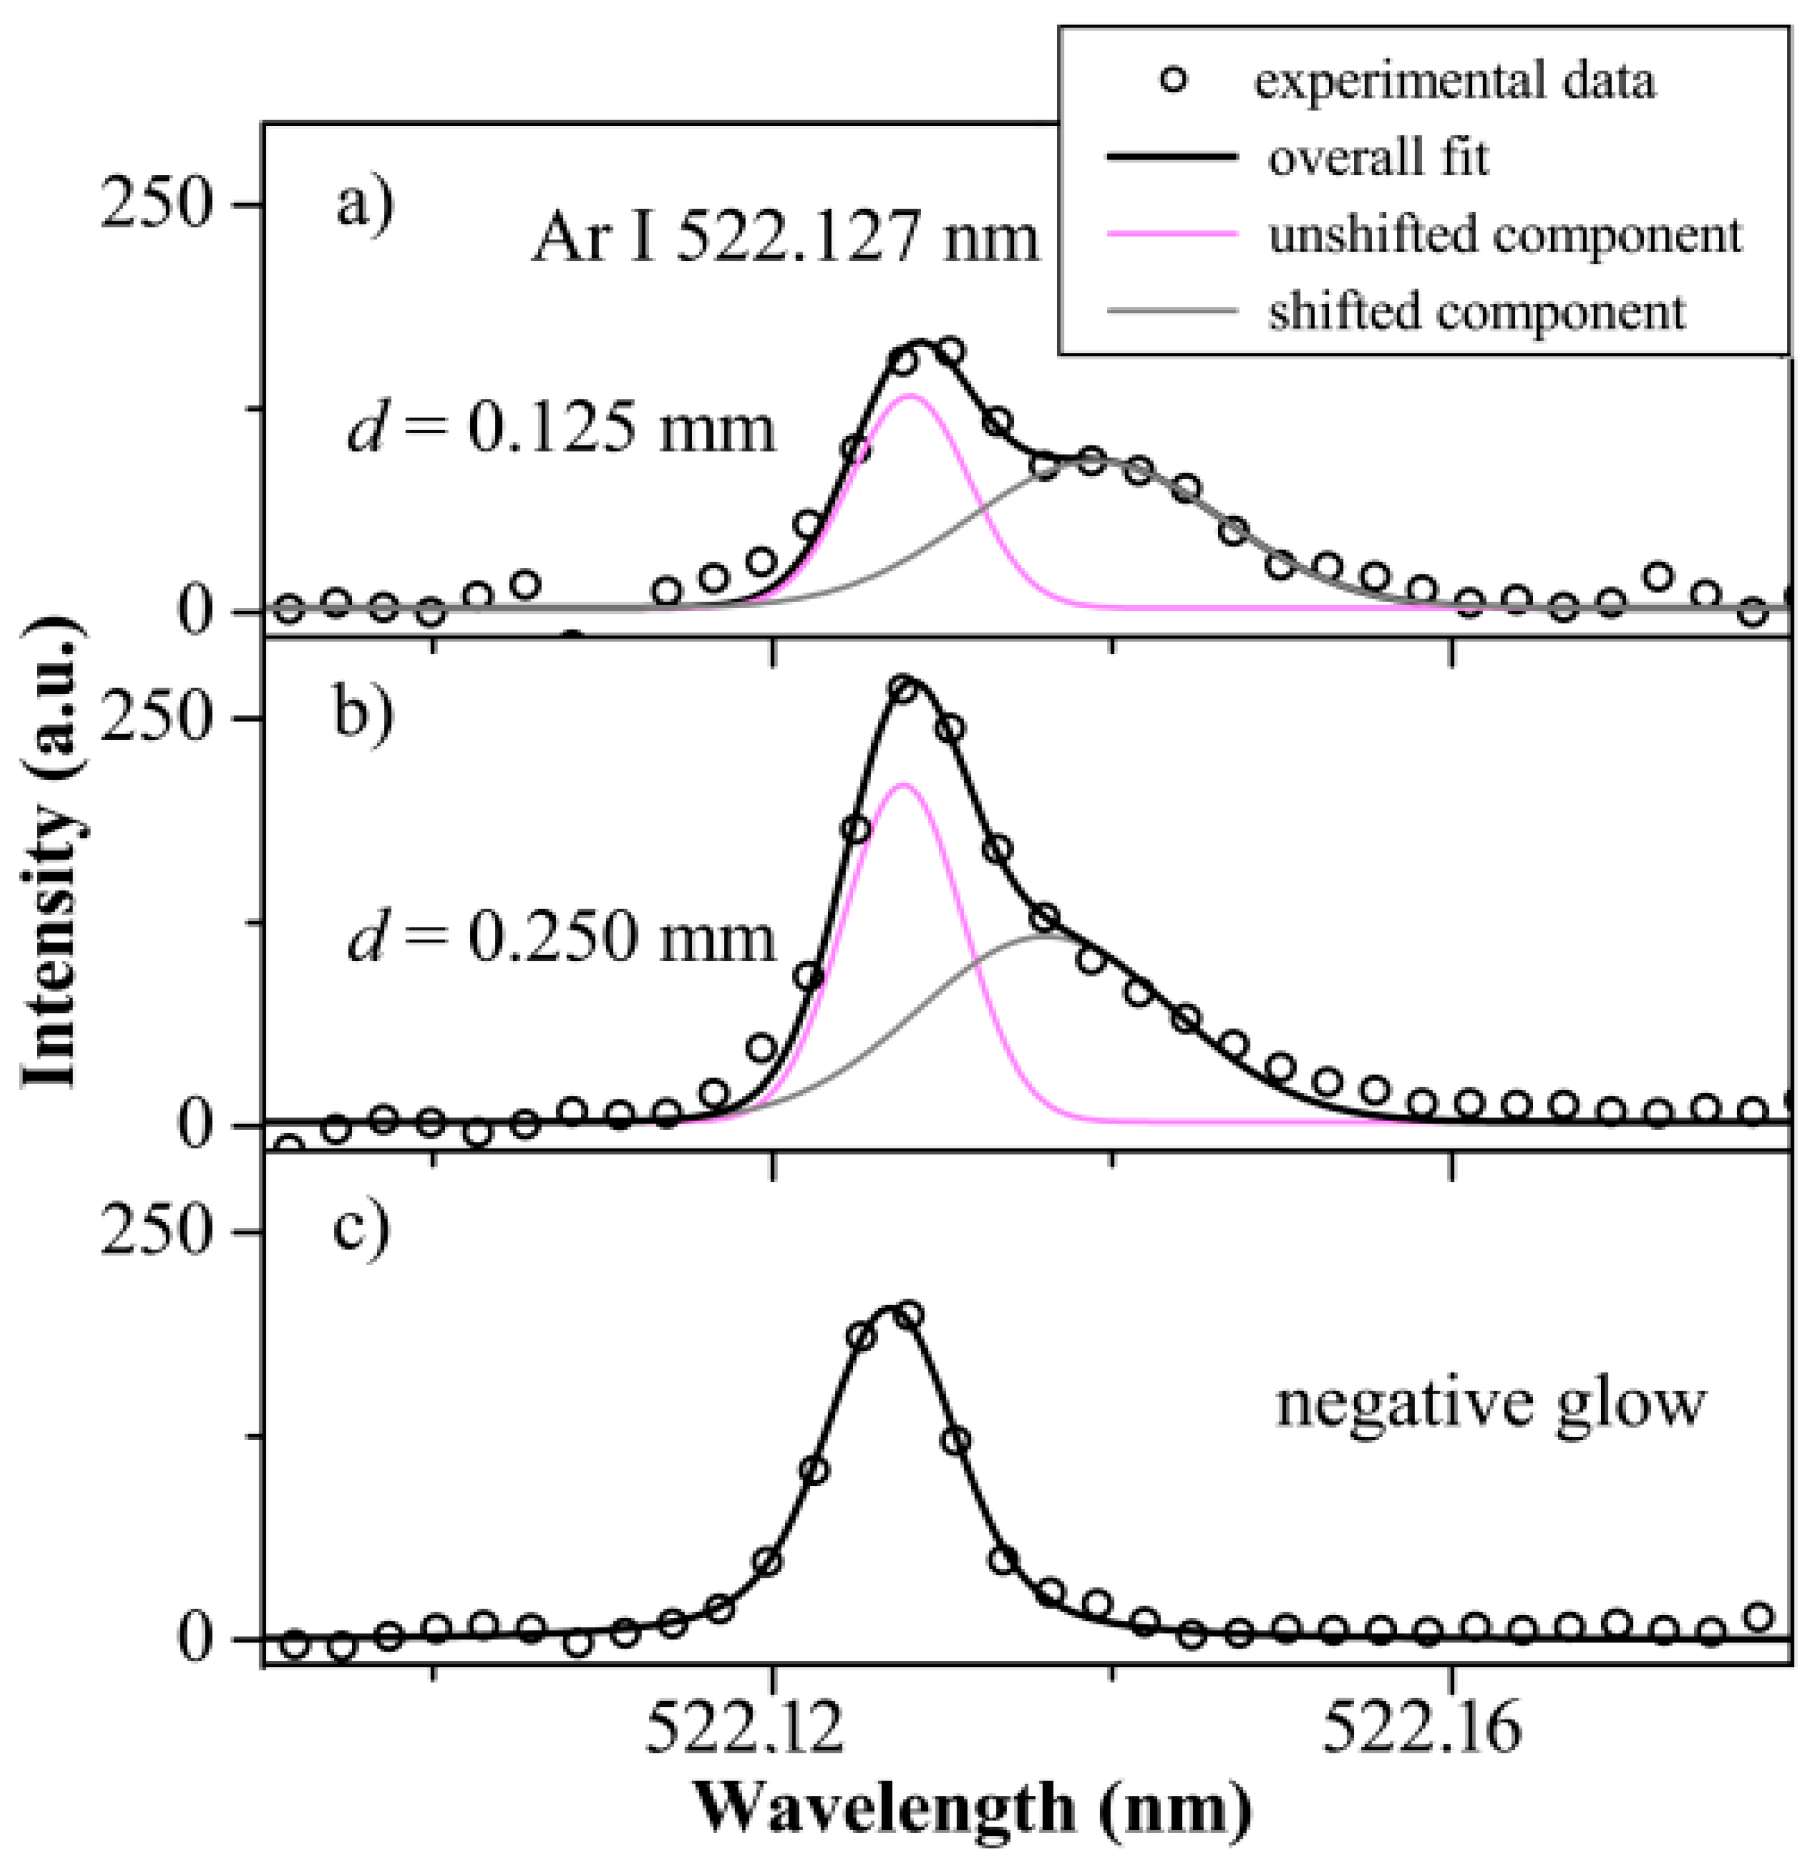
A systematic study of Ar I spectral line profiles in the CS region is performed in the scope of this study. Spectroscopic observations are performed side-on i.e., along the direction normal to direction of the electric field strength, see Figure 1. Ar I spectral lines was observed end-on but for more details see [24]. The change in Ar I 522.127 nm line profiles along CS region is shown in Figure 5. The spectra shown in Figure 5 a–c depict the spectral line shape at three GD axial positions starting from the vicinity of the cathode surface. The unshifted component in Figure 5 appears in side-on spectra as well and is successfully used to measure dc Stark shift.
In order to accurately determine the position of the shifted Stark component, the profiles of Ar I 522.127 nm line, shown in Figure 5a,b, are fitted with Gaussian profiles. The unshifted component has a Gaussian instrumental profile with constant width for all recorded spectra, while the width of shifted Stark component is considered to be twice as large as the unshifted component, in accordance with results given in [25]. The profile recorded in the NG region is fitted with a symmetric Voigt function. Also, one should mention that the sensitivity of line detection system and geometrical factors of the optical system are identical for each spectra presented in Figure 5a–c.
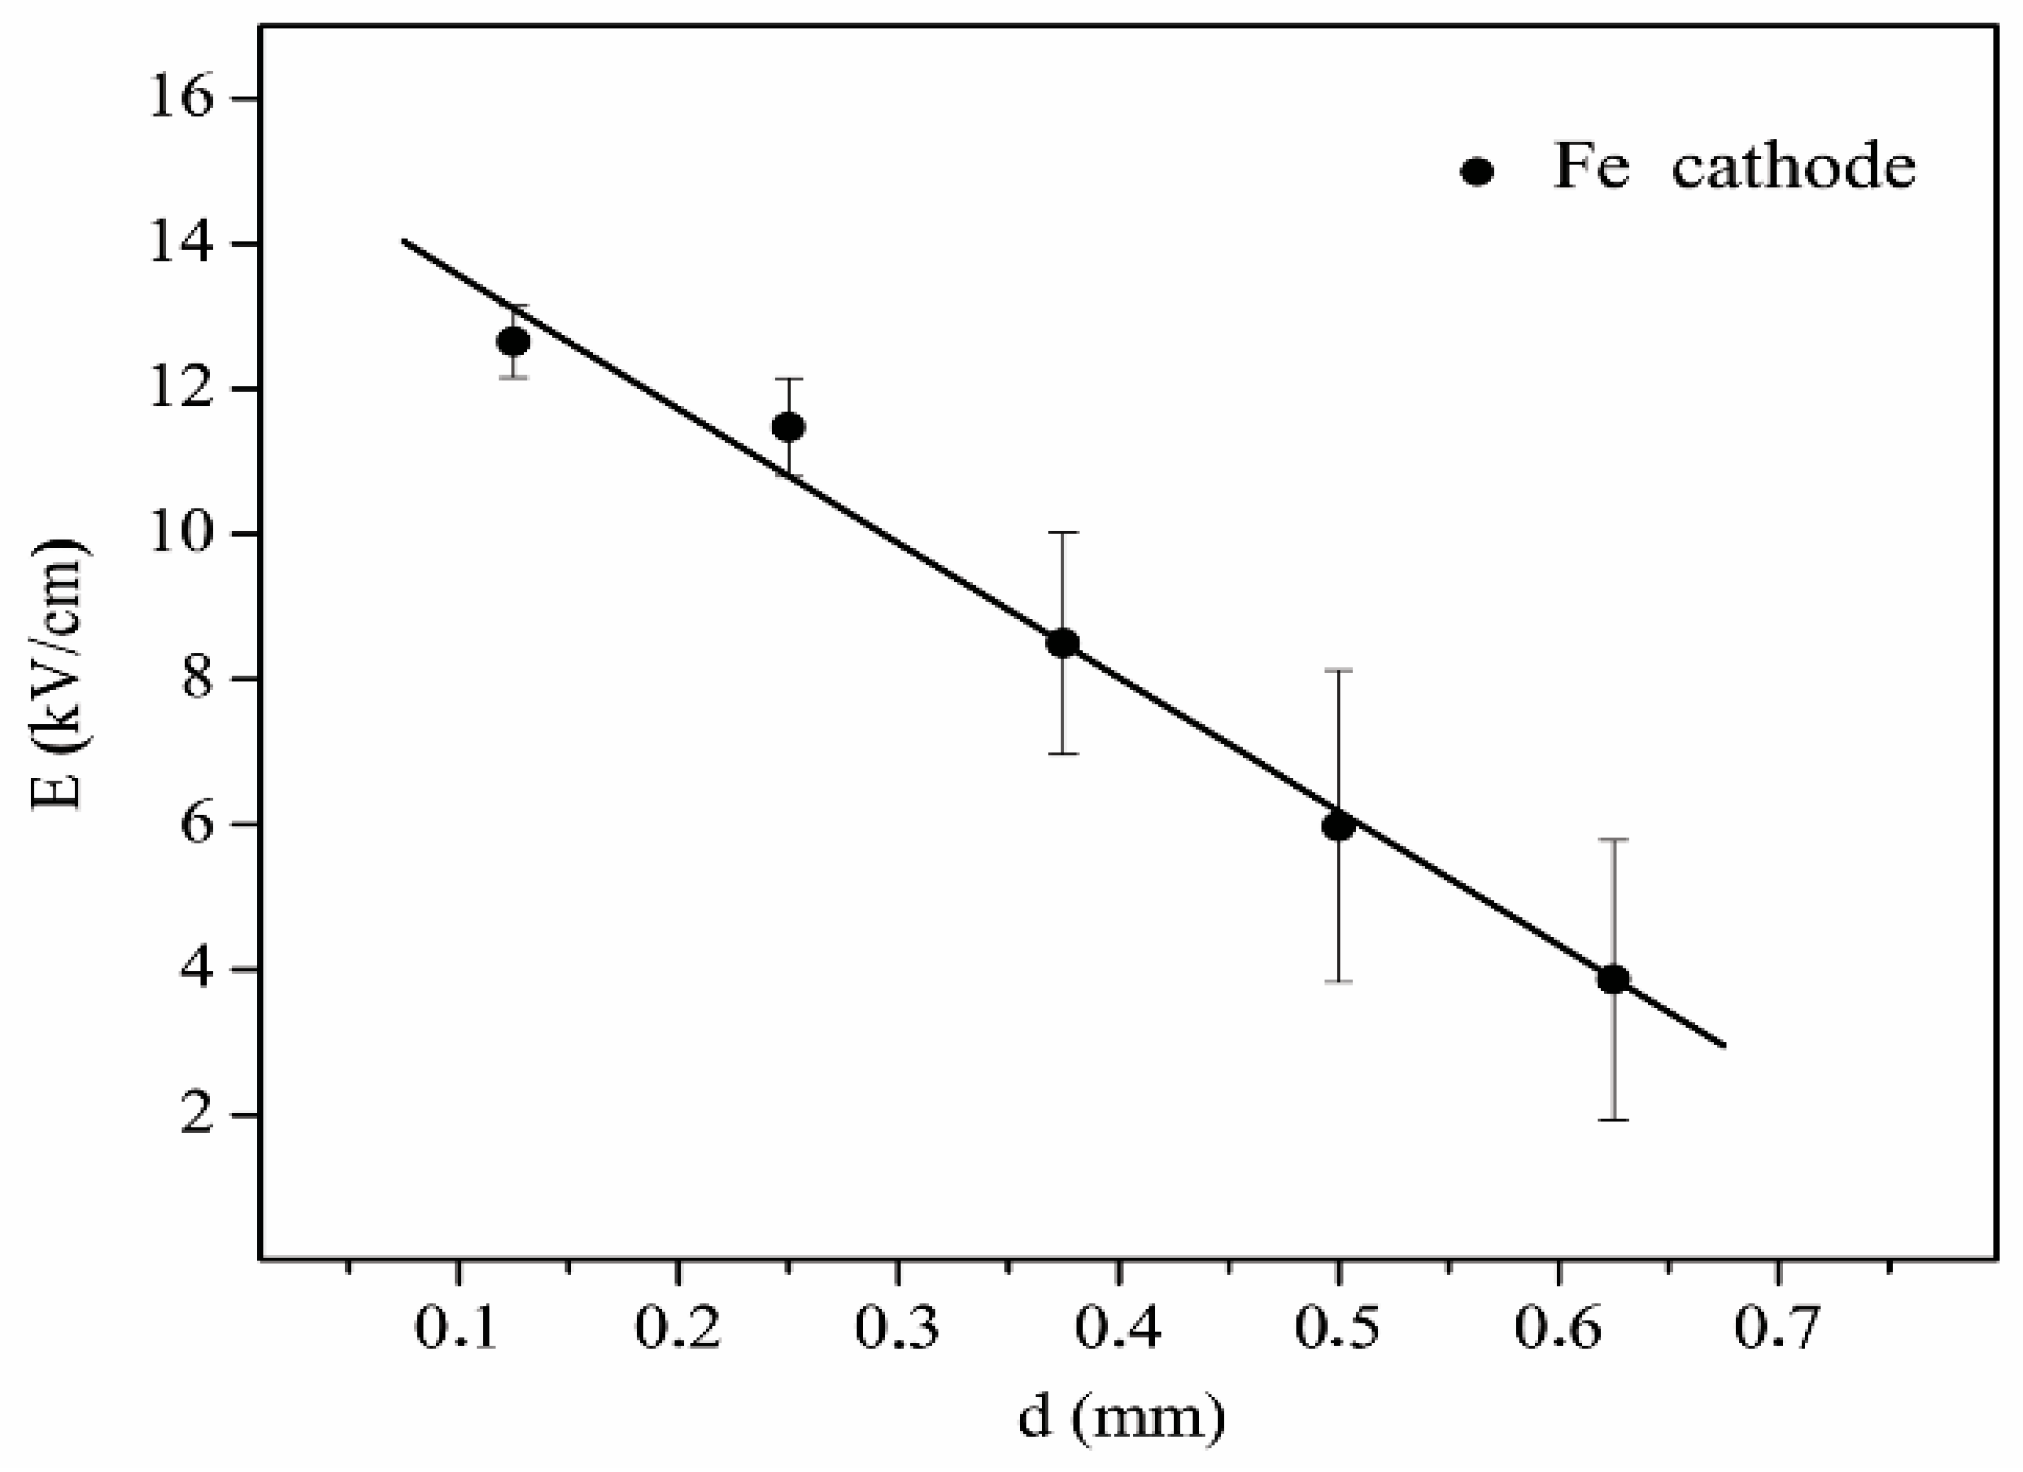
Finally, using the results of Ar I 522.127 nm line dc Stark shifts in conjunction with Equation (1), it is possible to determine the electric field strength distribution in the CS region, see Figure 6. The voltage drop across the CS shown in Figure 6, calculated by integrating the measured field strength distribution, agrees well within 15% with the applied discharge voltage for iron as cathode material.
4.2. Results of the dc Stark Shift Measurements for Ne I Lines
During investigation of Ne I spectral lines, see [26], it was shown that Ne I lines are good candidates for electric field strength diagnostics in the CS region of an abnormal Grimm type glow discharge. In relation to this, the Hα line of hydrogen is analyzed first in order to measure E, while dc Stark shifts are determined using Ne I spectral lines, recorded from the CS region.
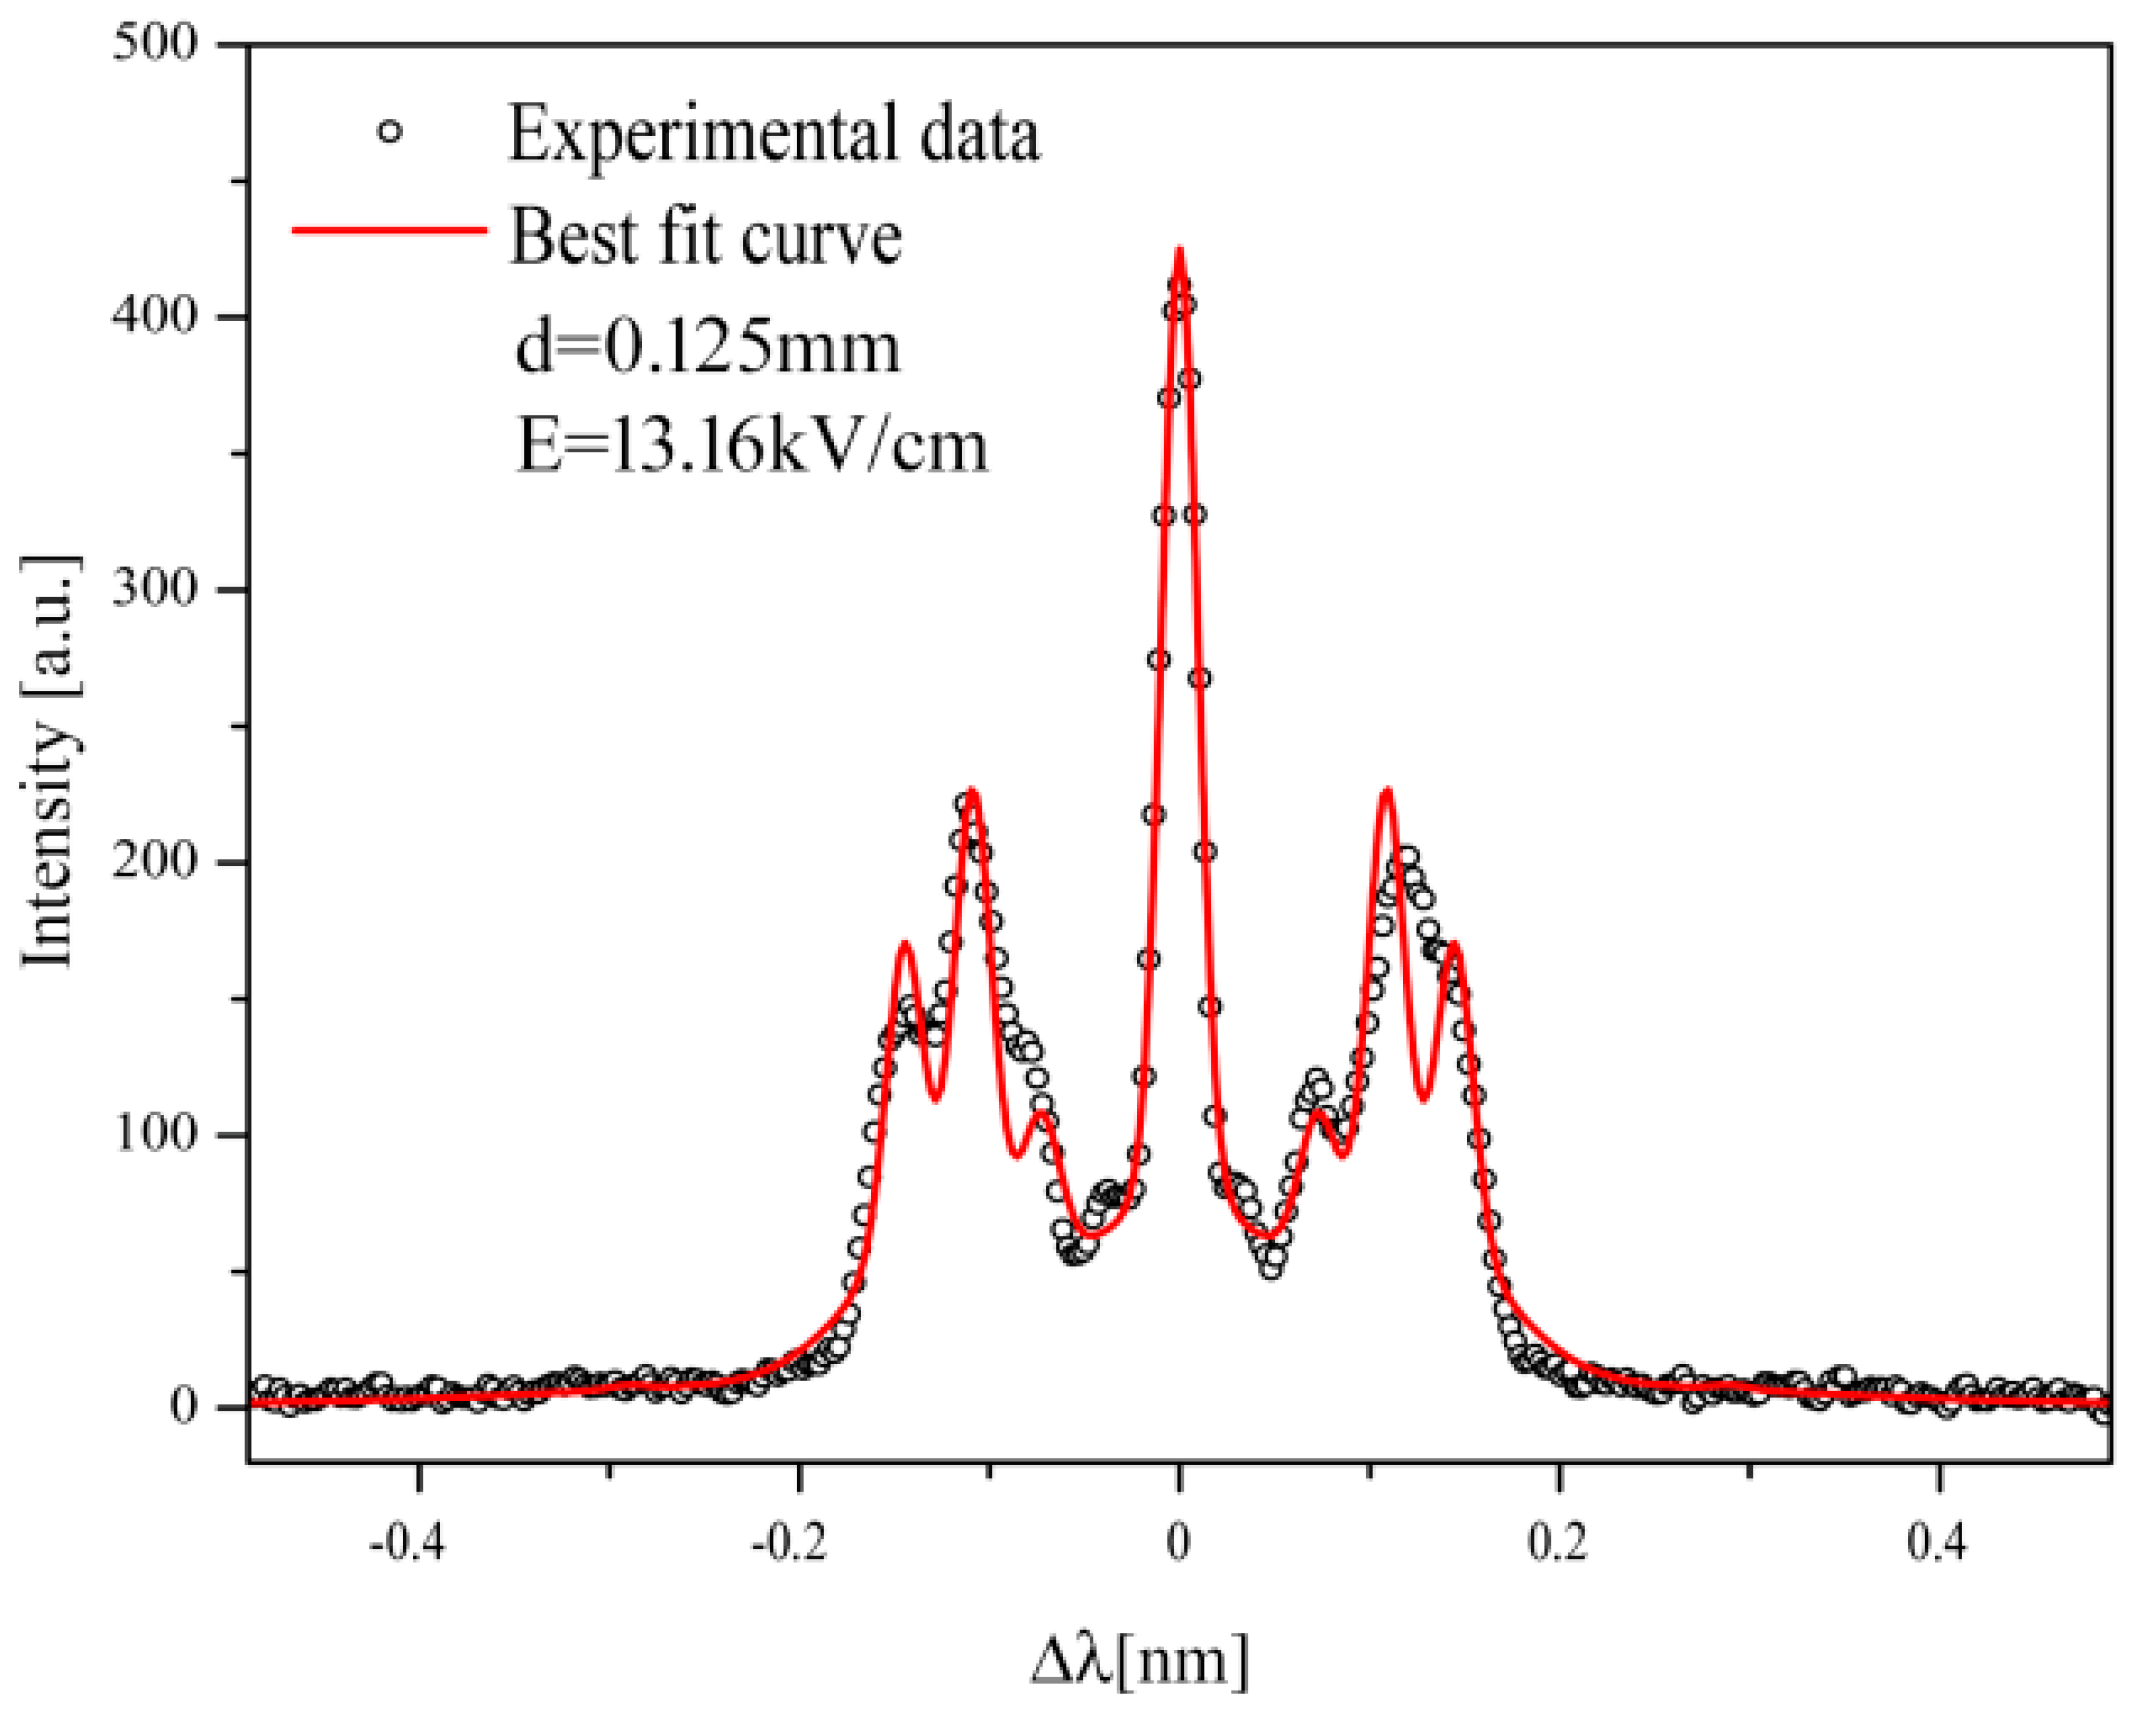
In the study of Grimm type discharge CS region in neon, a small amount (vol. 0.8%) of hydrogen was added as the admixture to perform the spectroscopic diagnostics of electric field using π-polarized side-on profiles of the Hα line. In Figure 7, an example of such profile recorded from the cathode surface region is presented. The unperturbed central peak corresponds to radiation emitted from the protruding discharge through the anode slot, as already mentioned previously. This peak is superimposed with the π-polarized profile of the Hα shifted radiation, originating from a non-zero electric field CS region visible through the slot. The presence of the central peak enabled us to present data in Figure 7 in the function of wavelength shift Δλ instead of wavelength λ. The solid (red) line represent the best fit of experimental data obtained by advanced model function, see Equation (8), given in [27]. The corresponding best fit value of E together with the distance d from cathode surface is shown in Figure 7. For more details about the measurement of electric field strength distribution in CS region analyzing the Hα line profiles, see [27].
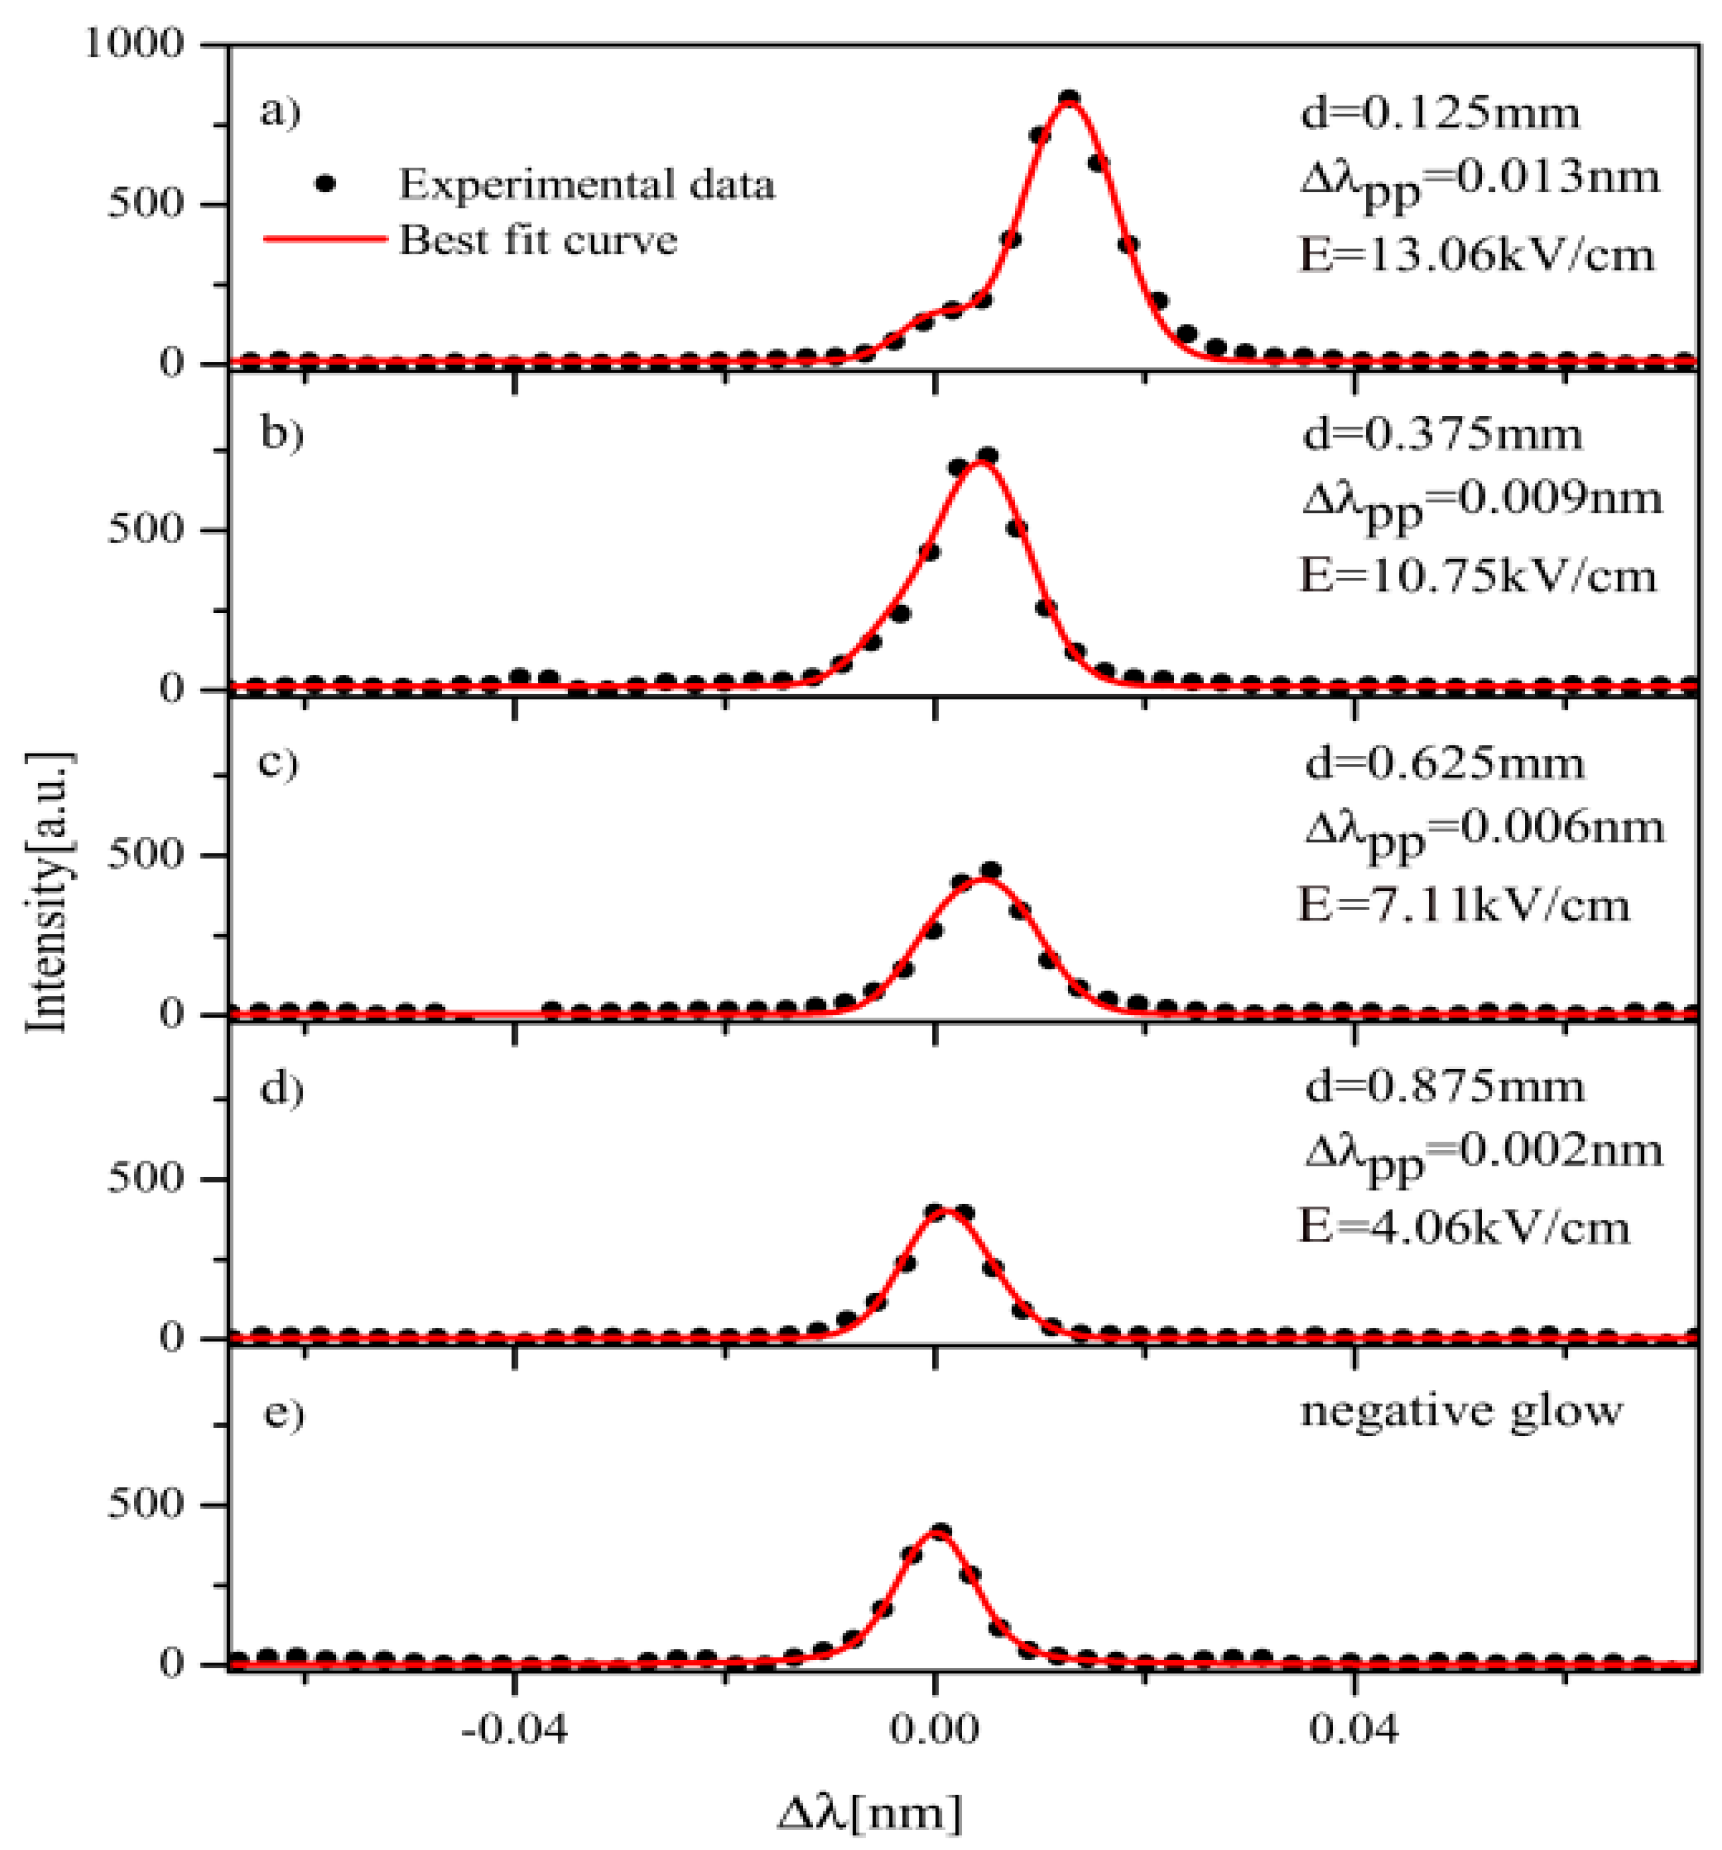
The analysis of Ne I 511.367 nm line dc Stark shift, previously reported by Jäger and Windholz [14], revealed that the line splits into three Stark components (Figure 3a) but under experimental conditions in [14], only one component is detected. In Figure 8, the Ne I 511.367 nm line profiles recorded side-on at four different positions within the CS, as well as the profile recorded in the NG region are presented. In order to measure dc Stark shifts of the studied Ne I line the following model function is applied:
As shown in Equation (5), the model function comprises the three fitting parameters: the height HNe and the center cNe of Gaussian profile, see Equation (6), as well as the base line level bNe
The function shown in Equation (6) represents the Doppler broadening profile of the Stark shifted Ne I 511.367 nm line. The two remaining parameters appearing in Equation (5), the area of protruded radiation A and the FWHM of Stark shifted neon line wNe, maintain the constant values for all profiles recorded from the CS region. The profile observed from the NG region is well described with symmetric Voigt function.
The dc Stark shifts determined using mentioned numerical procedure show the reasonable agreement with prediction of Jäger and Windholz’s for the Ne I 511.367 nm line third Stark component, see black dots in Figure 3a.
In addition to experimentally obtained Ne I lines, an additional six Ne I lines were detected with the primary task to supply dc Stark shift data for these lines. To measure dc Stark shift, the model function (5) is employed once again, while the distribution of electric field is calculated by means of the Hα line, see the text above. As an example, the side-on profiles of the Ne I 503.134 nm line recorded at the same set of distances from the cathode as in Figure 8 are given in Figure 9. Due to presence and crossing of more than one Stark component, experimental data designated with hollow dots in Figure 9 are excluded from the fitting curve. This was accomplished with the aid of the advanced numerical algorithm of outlier detection [28]. The Ne I 503.134 nm line (as well as five other Ne I lines) has significantly higher wavelength shifts then the studied Ne I 511.367 nm line, showing the full separation between the Stark shifted component and the unshifted peak of protruded radiation. In the position where the clear separation between unshifted and shifted component occurs, the simple “peak to peak” dc Stark shift measurement technique is used, see panels in Figure 9a–c. The same procedure is applied on five other spectral lines. It is a well-known fact that spectral lines of neon atom exhibit a quadratic Stark effect. This was also supported by the Jäger and Windholz Equation (4) which, in the small field range reduces to:
or equally
The measured Stark shifts are fitted with the simple quadratic function given by Equation (7), and the best fit values of the constant C are listed in Table 5.
5. Conclusions
In this work, the diagnostics of the CS region of Grimm type abnormal glow discharge in argon and neon–hydrogen mixture are shown. The broadening and shifting of argon and neon spectral lines in the Grimm type observed perpendicular to cathode surface (end-on) is explained by (i) dc Stark effect within the cathode sheath and (ii) plasma broadening in the negative glow region.
By comparison of the end-on with the side-on profiles, it has been demonstrated that the wavy form of the far red wing of end-on profile originates from the dc Stark effect, causing splitting of the radiation into Stark components and their Stark shifting. Taking into account that the commercial GD sources used for the elemental trace analysis permits only end-on observations, this finding could be valuable because it may prevent possible misinterpretation of the wavy features of the end-on profile as a weak radiation from some elements that are contained in traces in the sample under study.
The investigation of dc Stark effect in the CS region was of particular interest in this study. The distribution of electric field in the CS region is measured using Ar I 522.127 nm spectral line. In another experimental investigation, the Ne I lines were employed in conjunction with the dedicated model function for the dc Stark shift measurement under the conditions of low electric field. The electric field strength in the CS region is determined from the Hα line π-polarized profile using the Stark polarization spectroscopy technique.
On the other hand, the results of the Ne I 511.367 nm line analysis are used for testing the best fit formula derived from measured Stark shifts at high electric fields (about 400 kV/cm). Concerning the other six Ne I lines, the coefficients in the best fit Formula (7) are determined and may be applied for low electric field measurement (up to 13.4 kV/cm) with uncertainty below 5%.
Acknowledgments
This work is supported by the Ministry of Education, Science and Technological Development of the Republic of Serbia under Projects 171014 and 171027. I would like to thank Gordana Majstorović, Đorđe Spasojević, and Nikola Konjević, my coworker Jovica Jovović, and in particular Nikola Šišović who was my supervisor on Ph.D. studies.
Conflicts of Interest
The author declares no conflict of interest. The funders had no role in the design of the study; in the collection, analyses, or interpretation of data; in the writing of the manuscript, or in the decision to publish the results.
References
- Jakubowski, N.; Bogaerts, A.; Hoffmann, V. Glow Discharges in Emission and Mass Spectrometry Atomic Spectroscopy in Elemental Analysis; Cullen, M., Ed.; Blackwell: Sheffield, UK, 2003. [Google Scholar]
- Chapman, B. Glow Discharge Processes Sputtering and Plasma Etching; John Wiley & Sons: New York, NY, USA, 1980. [Google Scholar]
- Marcus, R.K.; Broeckaert, J.A.C. Glow Discharge Plasmas in Analytical Spectroscopy; Wiley: Chichester, UK, 2003. [Google Scholar]
- Ryde, N. Atoms and Molecules in Electric Fields; Almqvist & Wiksell International: Stockholm, Sweden, 1976. [Google Scholar]
- Kuraica, M.M.; Konjević, N.; Videnović, I.R. Spectroscopic study of the cathode fall region of Grimm-type glow discharge in helium. Spectrochim. Acta B 1997, 52, 745–753. [Google Scholar] [CrossRef]
- Kuraica, M.M.; Konjević, N. Electric field measurement in the cathode fall region of a glow discharge in helium. Appl. Phys. Lett. 1997, 70, 1521–1523. [Google Scholar] [CrossRef]
- Windholz, L.; Winklhofer, E.; Drozdowski, R.; Kwela, J.; Waşowicz, T.J.; Heldt, J. Stark effect of atomic helium second triplet series in electric fields up to 1600 kV cm−1. Phys. Scr. 2008, 78, 065303. [Google Scholar] [CrossRef]
- Windholz, L.; Waşowicz, T.J.; Drozdowski, R.; Kwela, J. Stark effect of atomic Helium singlet lines. J. Opt. Soc. Am. B 2012, 29, 934–943. [Google Scholar] [CrossRef]
- Cvetanović, N.; Martinović, M.M.; Obradović, B.M.; Kuraica, M.M.J. Electric field measurement in gas discharges using stark shifts of He I lines and their forbidden counterparts. Phys. D Appl. Phys. 2015, 48, 205201. [Google Scholar] [CrossRef]
- Yatom, S.; Stambulchik, E.; Vekselman, V.; Krasik, Y.E. Spectroscopic study of plasma evolution in runaway nanosecond atmospheric-pressure He discharges. Phys. Rev. E 2013, 88, 013107. [Google Scholar] [CrossRef] [PubMed]
- Yatom, S.; Tskhai, S.; Krasik, Y.E. Electric field in a plasma channel in a high-pressure nanosecond discharge in hydrogen: A coherent anti-stokes Raman scattering study. Phys. Rev. Lett. 2013, 111, 255001. [Google Scholar] [CrossRef] [PubMed]
- Levko, D.; Yatom, S.; Krasik, Y.E. Particle-in-cell modeling of the nanosecond field emission driven discharge in pressurized hydrogen. J. Appl. Phys. 2018, 123, 083303. [Google Scholar] [CrossRef] [Green Version]
- Windholz, L. Stark effect of Ar I’-Lines. Phys. Scr. 1980, 21, 67–74. [Google Scholar] [CrossRef]
- Jäger, H.; Windholz, L. Stark Effect of Nel-Lines (I). Phys. Scr. 1984, 29, 344. [Google Scholar] [CrossRef]
- Windholz, L.; Neureiter, C. Laser spectroscopic measurements of the Stark shift of the Ne i lines at 5852 and 5882 A. Phys. Rev. A 1988, 37, 1978–1982. [Google Scholar] [CrossRef]
- Jäger, H.; Windholz, L.; Ziegelbecker, R.C. Stark effect of neon I–lines (II): designation of Stark levels according to theoretical results. Phys. Scr. 1989, 40, 740–744. [Google Scholar] [CrossRef]
- Ziegelbecker, R.C.; Schnizer, B.Z. Calculation of the Stark effect of neon I using jl coupled wave functions. Z. Phys. D Atoms Mol. Cluster 1987, 6, 327–335. [Google Scholar] [CrossRef]
- Weiss, Z.; Steers, E.B.M.; Šmíd, P.; Hoffmann, V. Towards a catalogue of glow discharge emission spectra. J. Anal. At. Spectrom. 2009, 24, 27. [Google Scholar] [CrossRef]
- Grimm, W. Eine neue glimmentladungslampe für die optische emissionsspektralanalyse. Spectrochim. Acta B 1968, 23, 443. [Google Scholar] [CrossRef]
- Weiss, Z.; (LECO Instrumente Plzeň, spol. s r.o., Plzeň, Czech Republic). Private communication with Konjević, N., (University of Belgrade, Belgrade, Serbia). 2011.
- Ferreira, N.P.; Human, H.G.C.; Butler, L.R.P. Kinetic temperatures and electron densities in the plasma of a side view Grimm-type glow discharge. Spectrochim. Acta B 1980, 35, 285–295. [Google Scholar] [CrossRef]
- Weiss, Z.; Steers, E.B.M.; Šmid, P.; Pickering, J.C. The GLADNET Catalogue of Glow Discharge Spectra: Part 1 finished! (almost). In Proceedings of the EW-GDS Meeting, Kingston, UK, 3–4 September 2012. [Google Scholar]
- Vasiljević, M.M.; Spasojević, Dj.; Šišović, N.M.; Konjević, N. Stark effect of Ar I lines for electric field strength diagnostics in the cathode sheath of glow discharge. Europhys. Lett. 2017, 119, 55001. [Google Scholar] [CrossRef]
- Majstorović, G.L.; Ivanović, N.V.; Šišović, N.M.; Djurović, S.; Konjević, N. Ar I and Ne I spectral line shapes for an abnormal glow discharge diagnostics. Plasma Sources Sci. Technol. 2013, 22, 045015. [Google Scholar] [CrossRef]
- Nakajima, T.; Uchitomi, N.; Adachi, Y.; Maeda, S.; Hirose, C. Stark Shift and Broadening of Atomic Lines as Observed on Optogalvanic Spectra of Noble Gases. J. Phys. Colloque. 1983, 44, C7-497–C7-504. [Google Scholar] [CrossRef]
- Šišović, N.M.; Ivanović, N.V.; Majstorović, G.L.; Konjević, N. Ne I spectral line shapes in Grimm-type glow discharge. J. Anal. At. Spectrom. 2014, 29, 2058–2063. [Google Scholar] [CrossRef]
- Ivanović, N.V.; Šišović, N.M.; Spasojević, D.; Konjević, N. Measurement of the DC Stark shift for visible NeI lines and electric field distribution in the cathode sheath of an abnormal glow discharge. J. Phys. D Appl. Phys. 2017, 50, 125201. [Google Scholar] [CrossRef]
- Bukvić, S.; Spasojević, D.; Žigman, V. Advanced fit technique for astrophysical spectra-Approach insensitive to a large fraction of outliers. Astron. Astrophys. 2008, 477, 967–977. [Google Scholar] [CrossRef]
Figure 1.
(a) Schematic description of the end-on recordings setup (left), and the end-on profile of the Ne I 503.775 nm spectral line (right). (b) Schematic description of the side-on recordings setup (left), and the side-on profile of the same line recorded in the same experiment in the vicinity of the cathode surface.

Figure 2.
Behavior of terms of group: (a) 7d (Ar I 522.127 nm) and (b) 5d′ (Ar I 518.775 nm) in a dc Stark field [13].
Figure 2.
Behavior of terms of group: (a) 7d (Ar I 522.127 nm) and (b) 5d′ (Ar I 518.775 nm) in a dc Stark field [13].

Figure 3.
Behavior of terms of group: (a) 4d′ (Ne I 511.367 nm) and (b) 4d (Ne I 534.109 nm) in a dc Stark field [14].
Figure 3.
Behavior of terms of group: (a) 4d′ (Ne I 511.367 nm) and (b) 4d (Ne I 534.109 nm) in a dc Stark field [14].

Figure 4.
The side-on recording of Ar I 522.127 nm line shapes in the vicinity of cathode for different currents and the best fits. For better representation, the profiles are moved upward deliberately. The discharge pressure was p = 6.5 mbar.
Figure 4.
The side-on recording of Ar I 522.127 nm line shapes in the vicinity of cathode for different currents and the best fits. For better representation, the profiles are moved upward deliberately. The discharge pressure was p = 6.5 mbar.

Figure 5.
Spectral line shapes and best fits of Ar I 522.127 nm line at different axial positions from cathode: (a) 0.125 mm, (b) 0.25 mm and (c) NG region. Discharge conditions: iron cathode, p = 6.5 mbar, I = 12 mA, U = 472 V.
Figure 5.
Spectral line shapes and best fits of Ar I 522.127 nm line at different axial positions from cathode: (a) 0.125 mm, (b) 0.25 mm and (c) NG region. Discharge conditions: iron cathode, p = 6.5 mbar, I = 12 mA, U = 472 V.

Figure 6.
Distribution of electric field strength in the GD CS region determined using measured shifts for the Ar I 522.127 nm line and Equation (1). Discharge conditions: iron cathode, p = 6.5 mbar, I = 12 mA and U = 472V.
Figure 6.
Distribution of electric field strength in the GD CS region determined using measured shifts for the Ar I 522.127 nm line and Equation (1). Discharge conditions: iron cathode, p = 6.5 mbar, I = 12 mA and U = 472V.

Figure 7.
The π polarized profile of the Hα spectral line, recorded from the CS region. Discharge conditions: tungsten cathode, p = 6 mbar, I = 12.11 mA, and U = 914 V.
Figure 7.
The π polarized profile of the Hα spectral line, recorded from the CS region. Discharge conditions: tungsten cathode, p = 6 mbar, I = 12.11 mA, and U = 914 V.

Figure 8.
The Ne I 511.367 nm spectral line (dots) recorded from the CS at four different distances d from the cathode surface (panels (a–d)), and from the NG region (panel (e)). Solid (red) line represents the best fit obtained by model function (5) for the profiles recorded in CS, and by symmetric Voigt profile in NG region. Discharge conditions: same as in Figure 7.

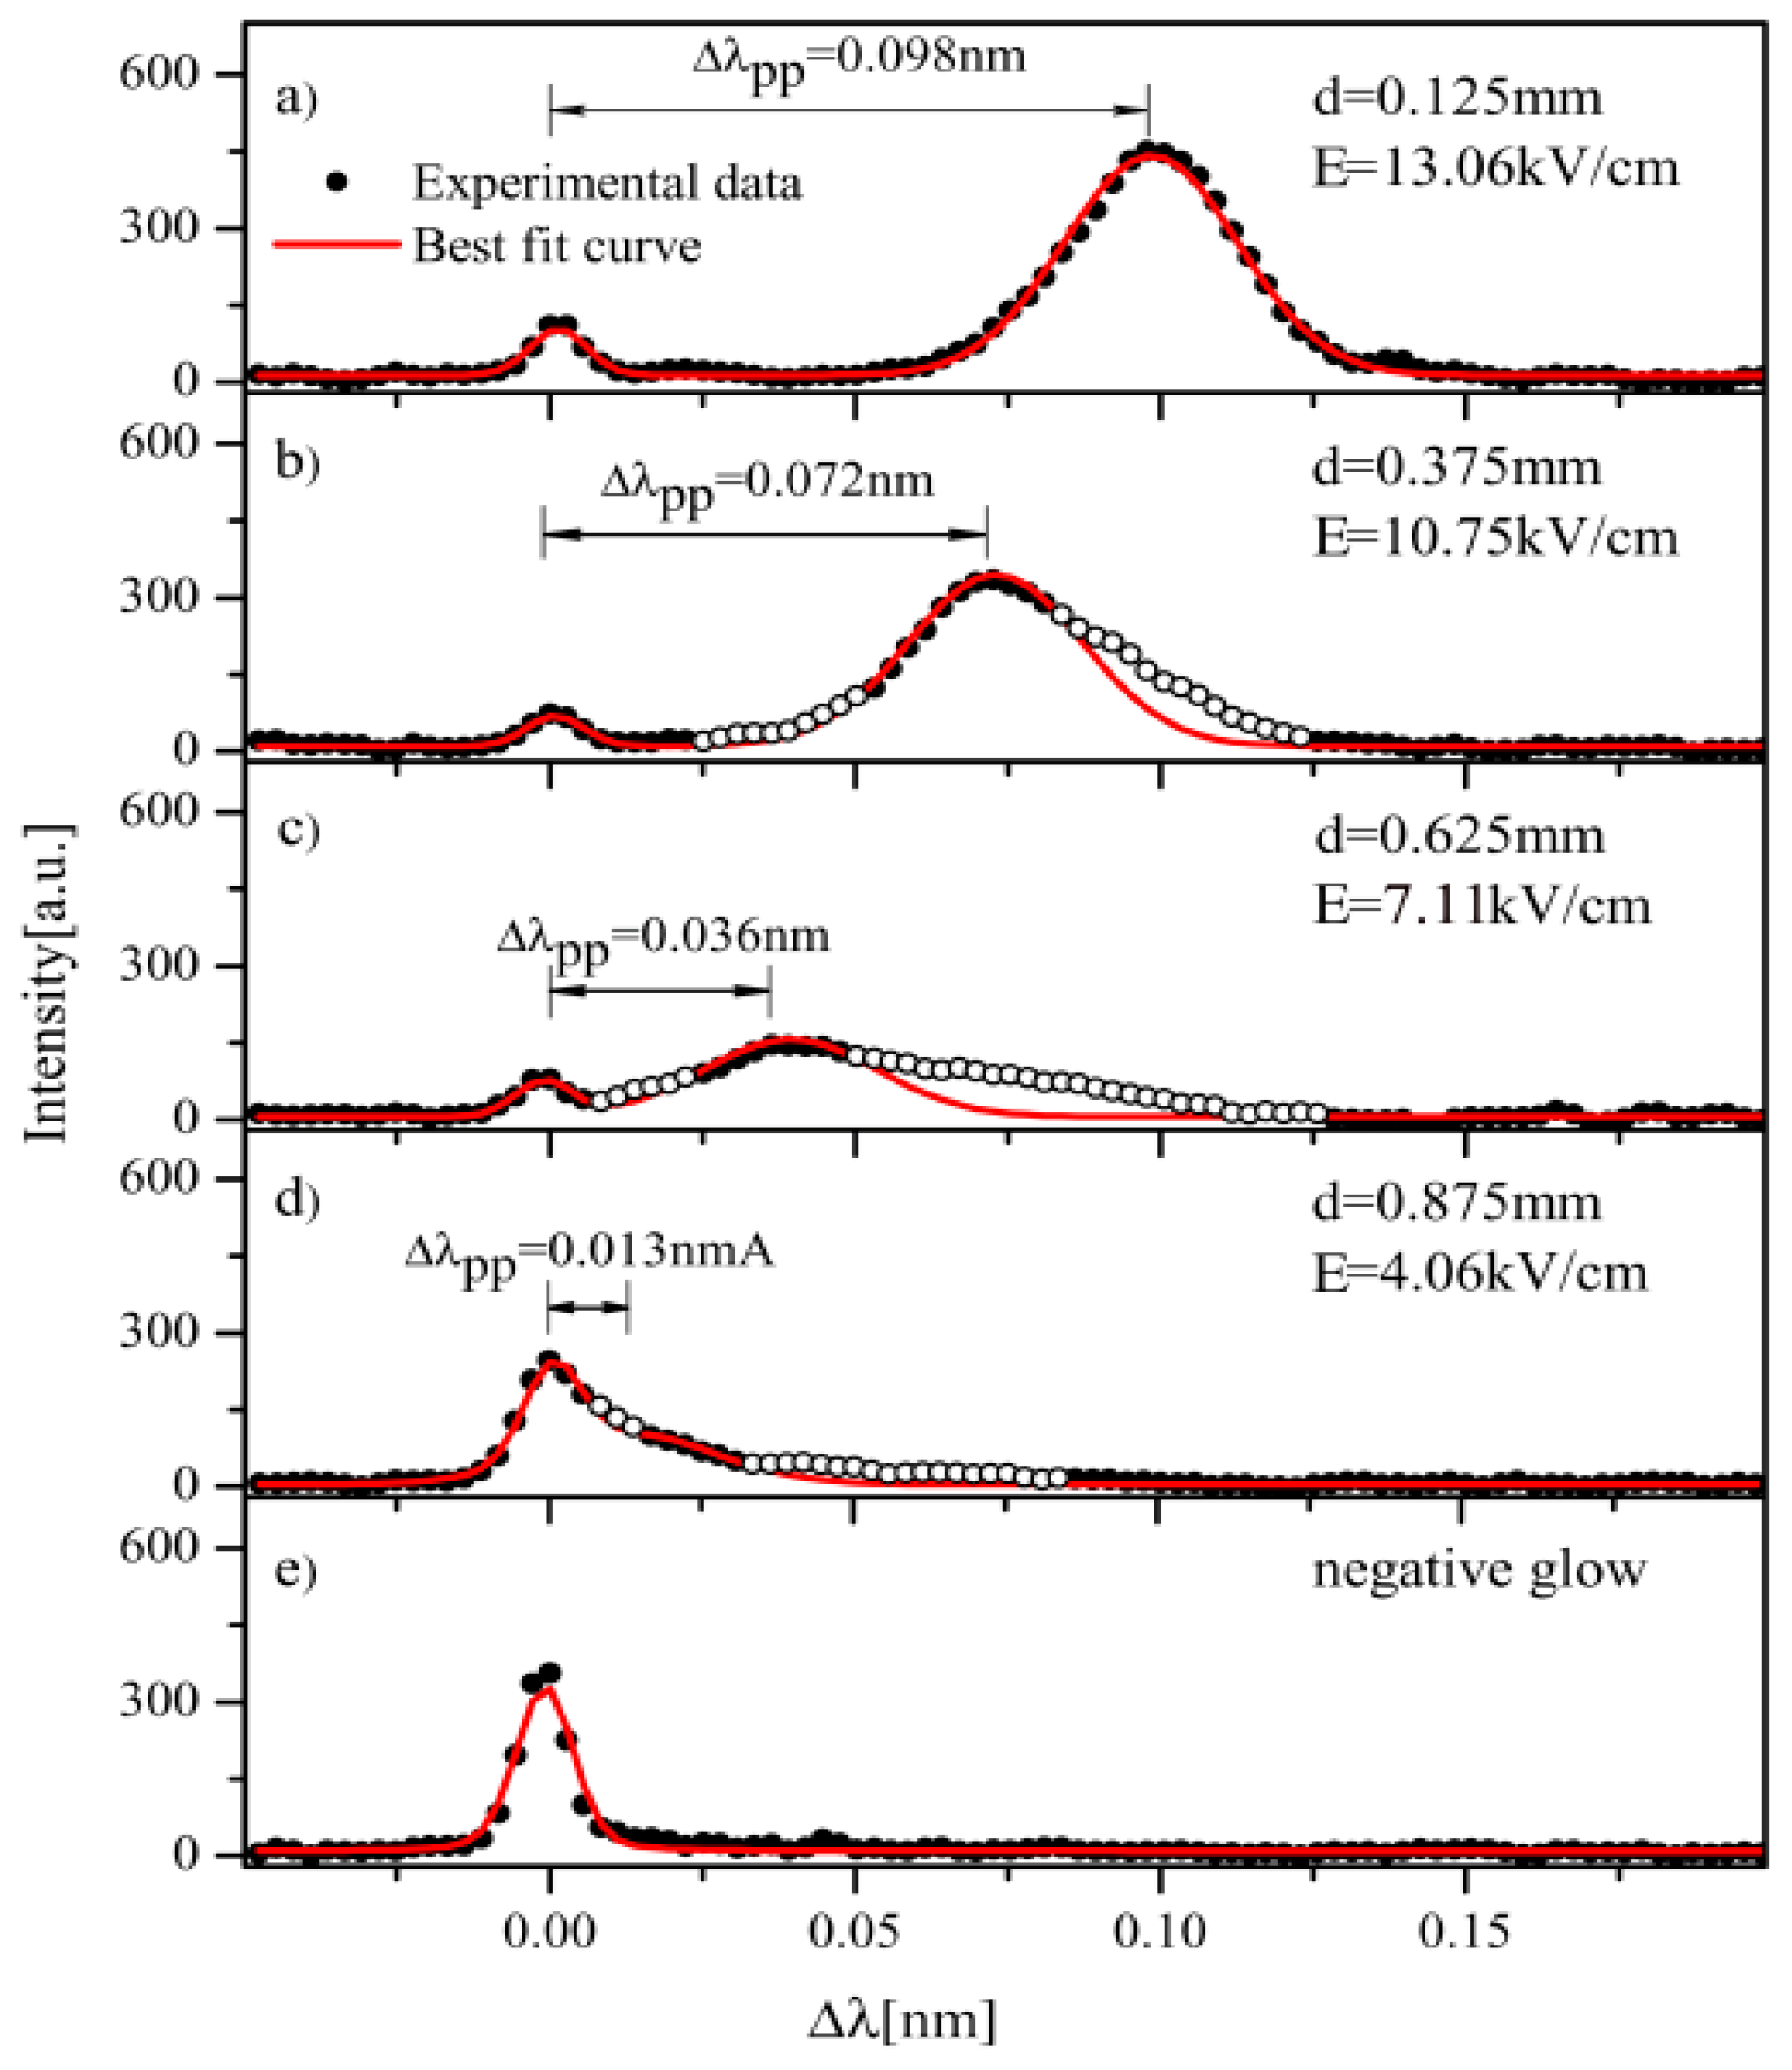
Figure 9.
Experimental profiles (points) of the Ne I 503.134 nm line recorded at different distances d from the cathode surface (panels (a–d)), and from the NG region (panel (e)), and their best fits (red lines); hollow points are discarded in fitting. In legends, I give the corresponding values of electric field strength E and Stark wavelength shift Δλpp measured between the unshifted and shifted components on the recorded line shapes. Discharge conditions: same as in Figure 7.


Table 1.
List of studied Ar I lines [13].
Table 1.
List of studied Ar I lines [13].
| Emitter | Wavelength (nm) | Lower Level Conf., Term, J | Upper Level Conf., Term, J |
|---|---|---|---|
| Ar I | 518.775 | 3s23p5(2P°3/2) 4p2[1/2] 1 | 3s23p5(2P°1/2) 5d′2[3/2]° 2 |
| 522.127 | 3s23p5(2P°3/2) 4p2[5/2] 3 | 3s23p5(2P°3/2) 7d2[7/2]° 4 |
Table 2.
Wavelengths and dc Stark effect coefficients for studied Ar I lines [13].
Table 2.
Wavelengths and dc Stark effect coefficients for studied Ar I lines [13].
| Wavelength (nm) | a1 (kV−2) | a2 (cm−1) | A1 (kV−1) | A2 (kV−2cm−2) | A3 (kV−3cm−2) |
|---|---|---|---|---|---|
| 518.775 | - | - | 1.25× 10⁻¹ | 1.51× 10⁻³ | −4.19× 10⁻⁶ |
| 522.127 | 4.23× 10⁻¹ | −169.34 | - | - | - |
Table 3.
The list of studied Ne I lines. The lines denoted with an asterisk were studied in [14].
Table 3.
The list of studied Ne I lines. The lines denoted with an asterisk were studied in [14].
| Emitter | Wavelength (nm) | Lower Level Conf., Term, J | Upper Level Conf., Term, J |
|---|---|---|---|
| Ne I | 503.135 | 2s22p5(2P°3/2) 3p2[5/2] 3 | 2s22p5(2P°3/2) 5d2[5/2]° 3 |
| 503.775 | 2s22p5(2P°3/2) 3p2[5/2] 3 | 2s22p5(2P°3/2) 5d2[7/2]° 4 | |
| 507.420 | 2s22p5(2P°3/2) 3p2[5/2] 2 | 2s22p5(2P°3/2) 5d2[5/2]° 2 | |
| 508.038 | 2s22p5(2P°3/2) 3p2[5/2] 2 | 2s22p5(2P°3/2) 5d2[7/2]° 3 | |
| 511.367* | 2s22p5(2P°3/2) 3p2[1/2] 1 | 2s22p5(2P°1/2) 4d′2[3/2]° 1 | |
| 515.196 | 2s22p5(2P°3/2) 3p 2[3/2] 1 | 2s22p5(2P°3/2) 5d 2[5/2]° 2 | |
| 515.443 | 2s22p5(2P°3/2) 3p 2[3/2] 1 | 2s22p5(2P°3/2) 5d 2[3/2]° 1 | |
| 520.390 | 2s22p5(2P°3/2) 3p 2[3/2] 2 | 2s22p5(2P°3/2) 5d2[5/2]° 3 | |
| 520.886 | 2s22p5(2P°3/2) 3p 2[3/2] 2 | 2s22p5(2P°3/2) 5d 2[3/2]° 2 | |
| 534.109* | 2s22p5(2P°3/2) 3p2[1/2] 1 | 2s22p5(2P°3/2) 4d2[1/2]° 1 |
| Wavelength (nm) | Comp. | A1 (kV−2) | A2 (cm−1) | A3 (cm kV−2) |
|---|---|---|---|---|
| 511.367 | 1 | −6.111 × 10⁻² | 2.783 × 101 | −4.700 × 10⁻⁵ |
| 2 | −8.889 × 10⁻² | 5.165 × 101 | −1.370 × 10⁻⁴ | |
| 3 | −1.416 × 10⁻¹ | 4.707 × 101 | −6.700 × 10⁻¹⁵ | |
| 534.109 | 1 | −7.935 × 10⁻² | 7.138 × 101 | −1.470 × 10⁻⁴ |
| 2 | −2.330 × 10⁻¹ | 1.883 × 10² | −5.200 × 10⁻⁵ |
Table 5.
The Stark shift coefficients C of quadratic function (7) for the six Ne I lines listed in Table 3. Emax is the maximum value of measured electric field strength.
Table 5.
The Stark shift coefficients C of quadratic function (7) for the six Ne I lines listed in Table 3. Emax is the maximum value of measured electric field strength.
| Wavelength (nm) | Emax [kV/cm] | Upper Level | C [cm/kV2] | ΔC [cm/kV2] |
|---|---|---|---|---|
| 503.135 520.390 | 13.4 | 2s22p5(2P°3/2) 5d 2[5/2]° 3 | −0.0238 | 0.005 |
| 507.420 515.196 | 2s22p5(2P°3/2) 5d 2[5/2]° 2 | −0.0229 | ||
| 515.442 | 2s22p5(2P°3/2) 5d2[3/2]° 1 | −0.0189 | ||
| 520.886 | 2s22p5(2P°3/2) 5d2[3/2]° 2 | −0.0138 |
© 2019 by the author. Licensee MDPI, Basel, Switzerland. This article is an open access article distributed under the terms and conditions of the Creative Commons Attribution (CC BY) license (http://creativecommons.org/licenses/by/4.0/).
Share and Cite
MDPI and ACS Style
Ivanović, N.V. The Study of Ar I and Ne I Spectral Line Shapes in the Cathode Sheath Region of an Abnormal Glow Discharge. Atoms 2019, 7, 9. https://doi.org/10.3390/atoms7010009
AMA Style
Ivanović NV. The Study of Ar I and Ne I Spectral Line Shapes in the Cathode Sheath Region of an Abnormal Glow Discharge. Atoms. 2019; 7(1):9. https://doi.org/10.3390/atoms7010009
Chicago/Turabian StyleIvanović, Nikola V. 2019. "The Study of Ar I and Ne I Spectral Line Shapes in the Cathode Sheath Region of an Abnormal Glow Discharge" Atoms 7, no. 1: 9. https://doi.org/10.3390/atoms7010009
Note that from the first issue of 2016, this journal uses article numbers instead of page numbers. See further details here.