Reliable Rescue Routing Optimization for Urban Emergency Logistics under Travel Time Uncertainty


1
School of Geography Science and Planning, Center of Integrated Geographic Information Anlaysis, Sun Yat-sen University, Guangzhou 510275, China
2
Guangdong Key Laboratory for Urbanization and Geo-simulation, Guangzhou 510275, China
3
Shenzhen Key Laboratory of Spatial Smart Sensing and Services & Research Institute for Smart Cities, School of Architecture and Urban Planning, Shenzhen University, Shenzhen 518060, China
4
Key Laboratory for Geo-Environmental Monitoring of Coastal Zone of the National Administration of Surveying, Mapping and Geoinformation, Shenzhen University, Shenzhen 518060, China
*
Author to whom correspondence should be addressed.
ISPRS Int. J. Geo-Inf. 2018, 7(2), 77; https://doi.org/10.3390/ijgi7020077
Submission received: 20 December 2017
/
Revised: 6 February 2018
/
Accepted: 18 February 2018
/
Published: 24 February 2018
(This article belongs to the Special Issue Human-Centric Data Science for Urban Studies)
Abstract
:The reliability of rescue routes is critical for urban emergency logistics during disasters. However, studies on reliable rescue routing under stochastic networks are still rare. This paper proposes a multiobjective rescue routing model for urban emergency logistics under travel time reliability. A hybrid metaheuristic integrating ant colony optimization (ACO) and tabu search (TS) was designed to solve the model. An experiment optimizing rescue routing plans under a real urban storm event, was carried out to validate the proposed model. The experimental results showed how our approach can improve rescue efficiency with high travel time reliability.
1. Introduction
Cities are becoming increasingly vulnerable to all kinds of hazards or events, such as floods and earthquakes, because of the unpredictable impacts of global climate changes. As a critical aspect of disaster relief operations, the development of comprehensive and efficient rescue plans for urban spaces is urgent. The timely and effective mobilization of resources is essential in aiding people who are vulnerable to natural disasters. However, variations in road travel times under disaster conditions may render emergency responses ineffective and result in increased uncertainties. Therefore, it is important to develop strategies for creating reliable emergency rescue plans.
The problem to be addressed in this research is rescue vehicle routing with stochastic link travel times. Many models and algorithms have been proposed to solve the vehicle routing problem (VRP) from different perspectives, such as the VRP related to pickup and delivery [1], the multidepot VRP [2], and the VRP with a time window [3,4,5]. However, most of them consider the transportation network to be deterministic. The complex nature of emergencies, as well as the lack of knowledge of data (e.g., demand, supply, or cost) in such situations, imply uncertainties in rescue vehicle route optimization. Although some models have been developed for emergency logistics with demand or supply uncertainty [6], for instance, one study [7] proposed a decision support framework for addressing emergency routing problems by taking into account both travel time and deadline uncertainty, the research on travel time/cost uncertainty is relatively insufficient [8]. The lack of research in this direction may be attributed to the lack of real disaster-related travel time data.
In view of the above, this study aims to propose a multiobjective rescue routing (MORR) model, which considers travel time uncertainty for scenarios in which multiple rescue vehicles are dispatched to multiple destinations. Travel time uncertainty will be estimated based on real data. The reliability of travel time is defined as the frequency of successful trips made within a desired time interval [9,10,11]. Determining the α-reliable path requires finding a reliable path with the minimum travel time budget, such that the probability that the path travel time is less than or equal to the travel time budget, which is greater than or equal to α [9]. The α-reliable path is used to guarantee reliability, with a confidence level α, in a stochastic transportation environment.
The objectives of the proposed model are to minimize the sum of the travel time budgets of all rescue vehicles and the maximum travel time budget of an individual rescue vehicle with a certain reliable arrival probability, α. A hybrid metaheuristic integrating ant colony algorithm (ACO) and tabu search (TS) is proposed to solve this routing model. An experiment on optimizing rescue routing plans for an urban storm flooding disaster will be carried out to validate the proposed model.
The rest of this paper is organized as follows. The next section presents a brief literature review. Section 3 defines travel time reliability, the bi-level rescue network, and the rescue vehicle routing problem. A multiobjective optimization model and a hybrid metaheuristic are presented in Section 4. Section 5 introduces the study area and data used. Section 6 analyzes the results of the computational experiments and discusses the sensitivities of the travel time budget of routing plans for different on-time arrival probabilities. The final section provides concluding remarks and future research directions.
2. Literature Review
In recent years, there have been many studies on disaster relief logistics. These studies mainly fall into one of four categories: facility location, inventory management, relief supply collaboration, and network flow problems [8,12]. For network flow problems, many studies have been conducted to achieve rescue path optimization during an emergency response [13,14,15,16,17,18,19,20,21,22,23]. In general, these studies have focused on how to develop suitable mathematical models and algorithms to derive optimal solutions regarding minimum travel time or cost. Transportation networks are considered to be deterministic in most studies. For instance, in the research of [20], a robust methodology for the dispatching and routing of emergency vehicles in a post-disaster environment was proposed, and the traversal speed of each road segment was estimated using a linear function of the expected level of damage of this road. According to Wang et al. [21], route-traveling time is dependent on the length of the route and the normal or maximum velocity associated with a vehicle. These studies considered time-dependent or damage-level-related travel time, but the uncertainties related to disasters were neglected.
Research on the uncertainties of emergency logistics is mainly related to demand or supply uncertainty [6]. Different models have been developed for emergency logistics preparation planning under demand uncertainty [16,24,25]. For instance, Mete and Zabinsky [25] presented a two-stage stochastic programming model for the warehouse selection and storage of medical supplies in the case of demand uncertainty. All sources of uncertainty (demand/supply/cost) can also be integrated into a multiobjective stochastic programming model to determine the location of relief distribution centers, the required inventory quantities for each type of relief item in storage, and the amount of transportation from relief distribution centers to affected areas [18]. However, research on travel time/cost uncertainty is relatively insufficient [8]. Although the study in [7] proposed a decision support framework for addressing emergency routing problems, taking into account both travel time and deadline uncertainty, the travel time uncertainty was assigned with different levels according to the author’s experience.
Some studies have focused on the shortest path calculation between an origin–destination pair, while considering travel time uncertainty [26,27,28]. Miao et al. [26] proposed a reliable route searching method in an uncertain network, with the uncertainty of the road network travel time being depicted by means of a disaster scenario union. Zhang and Kong [27] built a route choice model by considering travel time reliability, road disruption risk, and complexity. Lu and Sheu [28] proposed a model for minimizing the worst-case deviation in the maximum travel time between urgent relief distribution centers and relief stations. Due to random link capacity degradations, travel times are highly stochastic [29]. Travel times were thus viewed as random variables, and followed a probability distribution, for example an exponential, normal, or lognormal distribution [30]. Algorithms have been proposed to find reliable shortest paths or most reliable paths between an origin–destination pair by assuming travel times following a normal or lognormal distribution [9,31]. However, these cannot be easily applied to rescue vehicle routing in the case of multiple destinations (affected areas).
The problem in this research is the rescue vehicle routing problem with stochastic link travel times, which is a variant of the VRP. As a non-deterministic polynomial-time hard (NP-hard) problem, the VRP has been studied for decades, and many algorithms have been proposed to solve it [32,33,34,35,36,37,38]. Among the approaches proposed in the literature, metaheuristics are considered to be efficient and effective state-of-the-art methods. One of the most studied metaheuristic algorithms for vehicle routing problems is ACO [33]. ACO has some advantages, including its ability to explore a solution space [34,35], while it is prone to fall into local optima. TS is another widely used metaheuristic. There are some examples of TS for vehicle routing problems [36,37]. TS starts from a certain initial solution and applies short- or long-term memory to escape from local optima [30]. The quality of the initial solution is of vital importance for the efficiency of TS. Therefore, ACO and TS will be integrated to improve the quality of solutions and the convergence speed [38].
3. The Rescue Routing Problem
3.1. Problem Definition
In this study, we assume that multiple areas are affected by a disaster simultaneously. Since the capacity of a rescue vehicle is limited, multiple rescue vehicles are required to leave the warehouse at the same time to provide rescue services (e.g., to provide medical assistance to injured individuals) to each affected area. When a rescue vehicle arrives at one affected area, it unloads a set of rescue facilities and several rescue personnel and then leaves for another affected area. Our aim is to plan the best routes for the rescue task; therefore, the return routes of the rescue vehicles from the last affected area to the warehouse are not considered in this study. Before establishing the mathematical model, we first propose the following assumptions:
- (1)
- There is only one warehouse in the study area.
- (2)
- All the rescue vehicles should set out from the warehouse only.
- (3)
- One rescue vehicle can provide rescue services to only one affected area once.
- (4)
- The duration of unloading of the facilities of a rescue vehicle at each affected area is ignored because it is much shorter than the rescue route travel time within a large-scale road network.
- (5)
- The return routes of rescue vehicles are not considered.
- (6)
- The travel time along each road is a stochastic variable.
3.2. Travel Time Reliability
Since road travel times within an urban road network are highly stochastic, the transportation network in this study is defined as a directed stochastic graph G(N, A), where N is the set of road nodes and A is the set of road links connecting two nodes. In a stochastic G(N, A), for each node i in N, there is a directed successor node set, , and a directed predecessor node set, . In addition, we assume that each link, , has a random travel time, , with a given probability density function (PDF). The mean value and standard deviation are identified as and σij, respectively. The distribution of link travel times was quantified for the road network in this study using empirical data (see Section 4), and it was found that a lognormal distribution was more representative of roadway travel times than a normal distribution. This result is also in line with the research of Srinivasan et al. [31] and Rakha et al. [39]. Therefore, this research assumes that the travel time of each link follows a lognormal distribution. Then, the mathematical formula of the random travel time of each link, (), and the probability density function (PDF) corresponding to it can be defined as follows [40]:
Subsequently, the travel time, , corresponding to the path, , can be written as:
where nodes r and s represent an origin–destination pair of path, , with and . is defined as:
is also a random variable, and its distribution is the joint PDF of all link travel times along the path. In this study, it is assumed that all link travel times (T12,…, Tij,…) are statistically independent. The correlations between link travel times are omitted in this study for simplicity. This common assumption has been used in previous studies [9,39]. The mean value, , and standard deviation, , of are estimated by Wilkinson’s approach [31,34]:
Then, and can be calculated as follows:
3.3. Bi-Level Transportation Network Representation
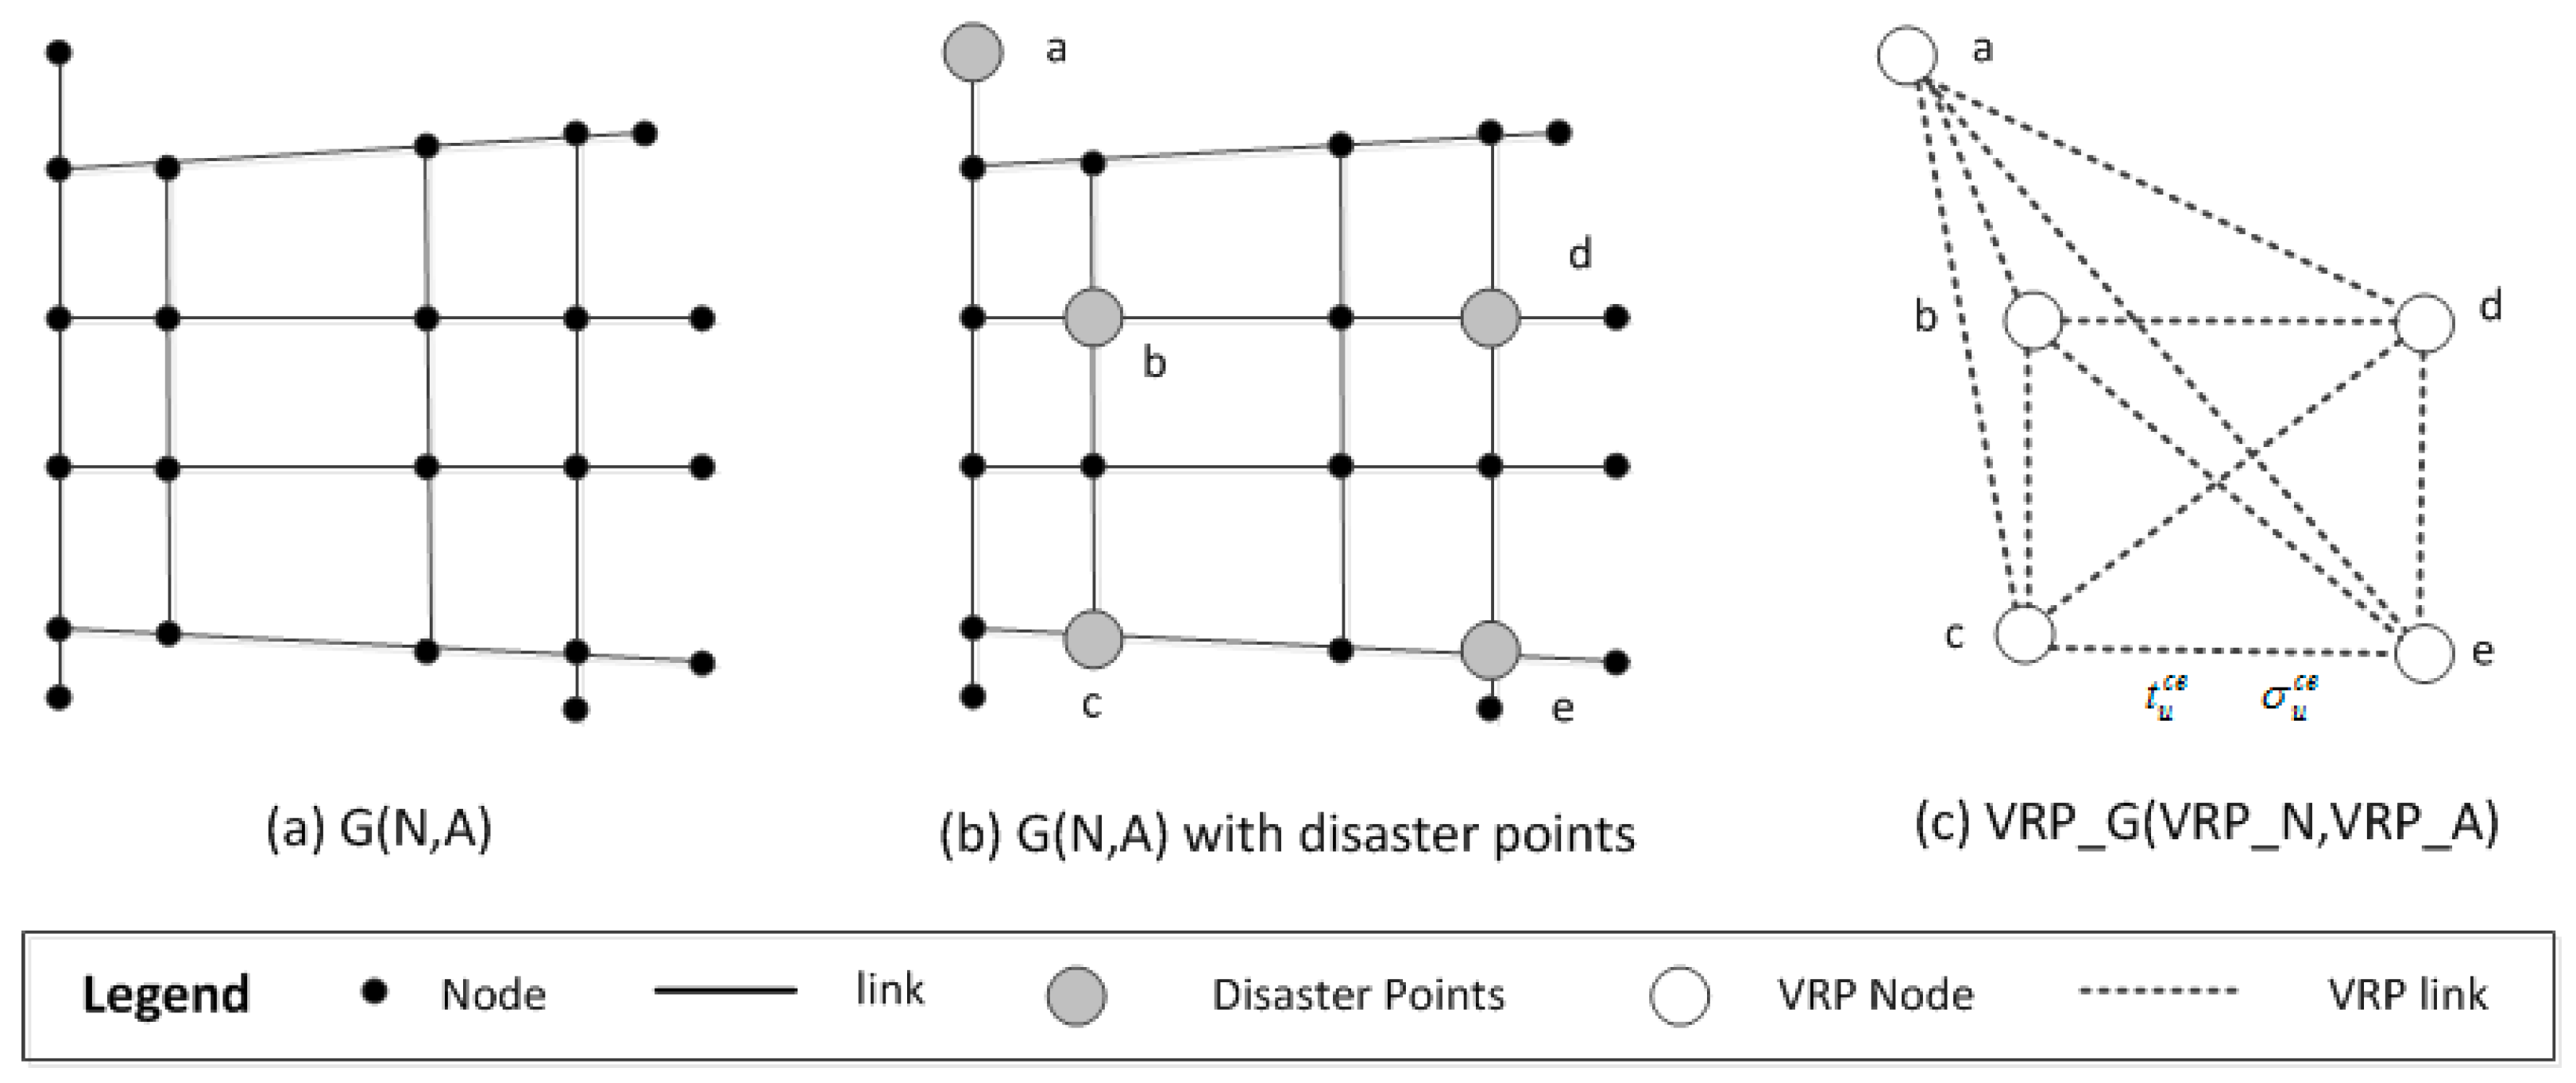
This study presents a bi-level transportation network structure to guarantee that each disaster point can be visited by one rescue vehicle. The abovementioned G(N, A) is the lower-level network, which is the actual transportation network (Figure 1a). The upper-level network is a VRP network defined as VRP_G(VRP_N, VRP_A) (Figure 1c), where VRP_N is a set of nodes representing the warehouse and disaster points and VRP_A is a set of links representing the virtual connections between each node in VRP_N. If there exists a path from a VRP node x to another VRP node y, then there is a VRP link (x, y), and vice versa. As shown in Figure 1b, there are several feasible paths between VRP nodes b and c in the lower-level transportation network. Therefore, there is a link from VRP node b to c in the upper-level VRP_G in Figure 1c.
Since the lower-level network G(N, A) is a stochastic network, the upper-level VRP network VRP_G(VRP_N, VRP_A) is stochastic as well, and the mean and variance values of the travel time of each VRP link can be calculated using Equations (7) and (8), respectively. For a given on-time arrival probability, α, the mean and variance values of the travel time of VRP link (x, y) are considered as those of the reliable shortest path from VRP node x to y under probability α.
3.4. α-Reliable Rescue Route
Since the actual travel time of rescue vehicles depends on the distance between the warehouse and disaster points and on the congestion level within the traffic network, decision makers or route planners cannot determine the travel time budgets of vehicles prior to their trips. The concept of an α-reliable path has been used in many pretrip planning systems to reflect travelers’ desired risk attitudes towards travel time uncertainty [9]. This study uses the concept of an α-reliable path to help decision makers evaluate the probability of on-time arrival for a rescue mission.
3.4.1. α-Reliable Path
For VRP nodes r and s, the α-reliable path from r to s can be defined with respect to a prespecified on-time arrival probability α. Chen et al. [9] provided a detailed definition of this in their research. Equation (9) guarantees that the probability that the travel time is smaller than a predicable value will be greater than a confidence level α. Equation (10) ensures that the links on the α-reliable path are feasible.
The problem of obtaining a reliable path that can fulfill all the constraints above is actually a problem of solving the inverse function of the cumulative distribution function (CDF) of a path’s travel time. The inverse function of the CDF is defined here as . Therefore, the travel time of the reliable path from VRP node r to s, based on the α-reliable path, , can be defined as follows:
3.4.2. α-Reliable Rescue Route
The α-reliable rescue route in this study is an open route from the warehouse to other disaster points. As shown in Figure 2, there are three open rescue routes, denoted as r1 {a, d}, r2 {a, b, e}, and r3 {a, c}, where a is the warehouse and b, c, d, and e are disaster points. The travel times of r1, r2, and r3 with an on-time arrival probability, α, are also indicated in Figure 2. The paths between the warehouse, a, and other disaster points or the paths between disaster points, such as p1 {a, 1, 5, b} and p2 {b, 7, 8, 9, e}, are the α-reliable rescue paths defined above.
3.5. Mathematical Formulation of the MORR
Under the foregoing assumptions, the rescue routing problem in this study can be described as follows. In a transportation network with many affected areas, the travel time along each path is stochastic. A fleet of rescue vehicles will travel from a warehouse to the affected areas to facilitate the distribution of relief supplies and rescue. The minimization of the travel time budget of all rescue vehicles under a high reliable arrival probability is one objective of this study. To avoid imbalance of the travel time budget of each rescue vehicle, the minimization of the maximum travel time budget of an individual rescue vehicle is the other objective. The multiobjective model for solving the rescue routing problem is as follows. Table 1 presents a list of the mathematical annotations used in the proposed model.
Constraints:
The objective function, R, is a linear combination of F1 and F2, which are two objective functions used to minimize the sum of the travel time budgets of all rescue vehicles and the maximum travel time budget of an individual rescue vehicle with a certain reliable arrival probability, α, respectively. Constraints (15) and (16) ensure that each affected area can be visited by only one vehicle. Constraints (17) and (18) ensure that each rescue path from the warehouse can only be accessible by one vehicle and that the vehicle does not need to return to the warehouse after completing the rescue task. Constraint (19) ensures the continuity of each rescue path. Constraint (20) states that each rescue vehicle, k, should participate in the mission and never patrol more than Ck affected areas, where Ck is the loading capacity of a rescue vehicle.
4. The Hybrid Metaheuristic for Solving the MORR Problem
4.1. An Overview of the Proposed Hybrid Metaheuristic
To solve the MORR problem in this study, a hybrid metaheuristic integrating ACO and TS (ACO-TS) is proposed. ACO algorithms have some advantages in solving combinatorial optimization problems because of the effective exploration ability of ants [34,35], while they are prone to fall into local optima. Tabu search is an iterative local search algorithm that starts from a certain initial solution and applies short- or long-term memory to escape from local optima [41]. The initial solution is significant for the tabu search approach. Therefore, ant colony optimization and tabu search are integrated in this study to increase the solution quality and improve the convergence speed.
The ACO-TS comprises two parts, namely, global search and local search. To obtain a preferable initial solution, ACO is adopted in the global search. Subsequently, based on the initial solution, the TS algorithm is utilized in the local search to improve the global optimization ability of the proposed hybrid metaheuristic. An overview of the ACO-TS is shown in Figure 3.
4.2. Main Steps of the ACO-TS Algorithm
This section describes only the most important modifications made to the original ACO and TS algorithms. For details regarding ACO and TS, please refer to [41,42], respectively. We will not repeat the basic descriptions of these two algorithms.
4.2.1. Global Search Using the ACO Algorithm (Step 3)
In this study, we utilize the ACO algorithm for global search. The problem can be described as follows: ant e leaves the warehouse or an affected area, r, calculates state transition probability, , according to pheromone concentration and heuristic information, then chooses the next affected area, s.
In the formulas above, is the amount of pheromone on the VRP link (r, s) at time, t; is the inverse of edge weight, ; δ is the pheromone heuristic factor; and β is the visibility heuristic factor. is the tabu list, recording the disaster areas that ant e has visited.
Since there are several feasible paths from VRP node r to s in the lower-level network G(N, A), is considered here as the travel time budget of the reliable shortest path from VRP node r to s under on-time arrival probability, α. The reliable shortest path problem is non-additive, and the travel time of a path cannot simply be described as the sum of the travel times of relative links; thus, traditional methods for computing the shortest path, such as Dijkstra’s algorithm, are unsuitable for this scenario. In this study, the reliable shortest path between two VRP nodes and its corresponding travel time are calculated using the multicriteria label-setting algorithm proposed by Chen et al. [9]. Once the number of visited disaster areas exceeds the capacity of a rescue vehicle, ant e starts a new route from the warehouse again until all disaster areas are visited. All visited nodes are added to the tabu list, and a solution, Se, is generated. Se contains m rescue open routes, where m is the number of rescue vehicles. Accordingly, when all ants finish their tours, a solution set is obtained.
4.2.2. Evaluation Function (Step 4)
In this step, the performance of each solution, Se, is evaluated. The evaluation function (Equation (12)) is an objective function that involves minimizing both the sum of the travel times of all rescue vehicles and the maximum travel time of an individual rescue vehicle with an arrival probability, α. The travel time budget of a solution, Se, is obtained as follows.
Step 1. Calculate the mean value, μrs, and the standard deviation, σir, of VRP link (r, s). Each VRP link (r, s) belonging to Se contains several links in the lower-level network G(N, A). According to the assumption in Section 3.2, the travel times of these links are statistically independent. Therefore, the mean value, μrs, and the standard deviation, σrs, of the travel times of VRP link (r, s) can be calculated by Equations (7) and (8).
Step 2. Calculate the travel time budget for each open route in Se, and find the longest travel time budget of an individual rescue vehicle, tmax. An open route consists of a set of VRP links, and the mean value, μrs, and the standard deviation, σrs, for VRP link (r, s) are obtained in Step 1. Then, the travel time budget of an open route with a reliable arrival probability, α, can be calculated by Equation (11). By comparing the travel time budgets of all open routes in Se, the longest travel time budget of an individual rescue vehicle, tmax, can be obtained.
Step 3. Calculate the sum of the travel time budgets (tall) of all open routes in Se. The mean value, μrs, and the standard deviation, σrs, for each VRP link (r, s) in Se have already been calculated in Step 1, so the travel time budget of all open routes (tall) in Se with a reliable arrival probability, α, can also be calculated by Equation (11).
The result of the evaluation function can be written as w1 × tall + w2 × tmax. The solution Routebest(t) is the best solution of the global search procedure and is delivered to the local search procedure for further optimization.
4.2.3. Local Search Using TS (Step 5)
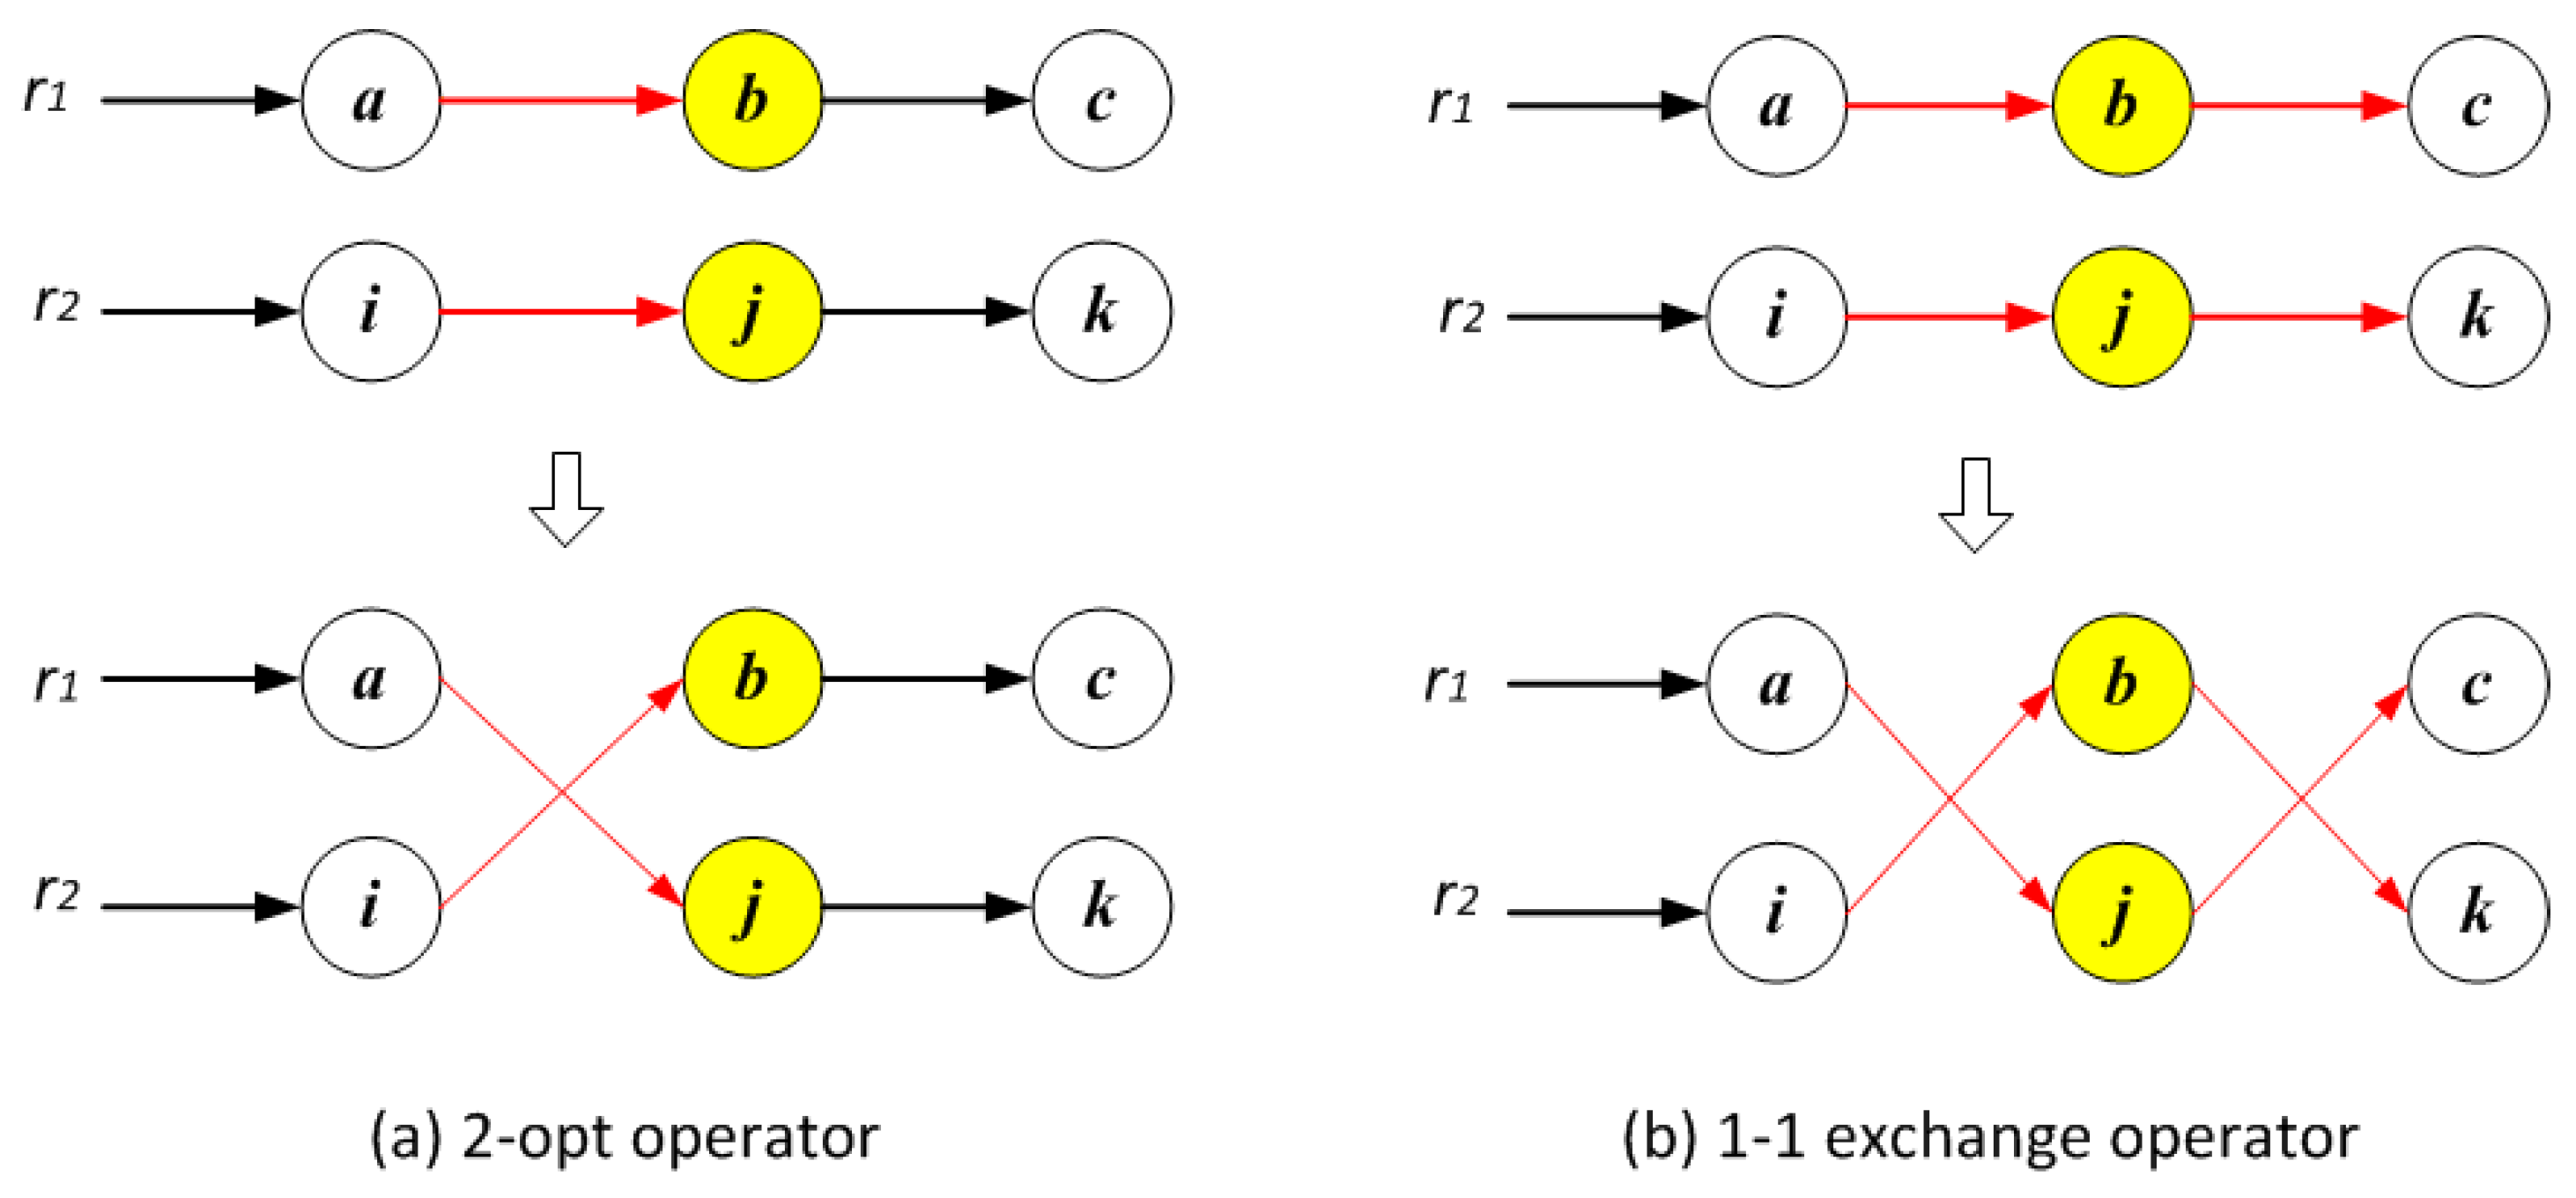
TS is utilized to update the best solutions. It optimizes solutions using two neighborhood operators: the 2-opt operator and the 1-1 exchange operator (Figure 4). These two neighborhood operators are widely used in many local search algorithms [43].
● 2-opt operator
For the case of two open routes (e.g., r1, r2), disconnect them at some place (e.g., node b along r1 and node j along r2). Then, the remaining links after node b along r1 are swapped with the remaining links after node j along r2.
● 1-1 exchange operator
Regarding two open routes (e.g., r1, r2), node b and node j are swapped between r1 and r2.
In each iteration, the 2-opt operator is executed first, followed by the 1-1 exchange operator. This process is repeated n times in each iteration, where n is the number of affected areas. Each affected area is therefore processed using all improvement operators. The move from the current solution, Se, to the neighborhood solution, Se’, is recorded in the tabu list to prevent cycling. The length of the tabu list is L. The aspiration criterion is used to determine when the tabu restriction can be overridden. If a move in the tabu list reappears but the new route is better than any solution found before, then the new solution will still be accepted.
4.2.4. Update Pheromone Concentration (Step 6)
The pheromone will be updated after all the ants complete their tours and can be formulated as:
where indicates whether ant k passes the VRP link (r, s); Q is the total amount of pheromone; and R denotes the value of the objective function. is the pheromone remaining on the VRP link (r, s) after t + 1 iterations; is the pheromone increment on the VRP link (r, s); and ρ is the pheromone evaporation factor ().
4.3. Pseudocode of the Algorithm
The pseudocode of the proposed ACO-TS algorithm is summarized as follows.
Notations:
| Routebest(i): | the best solution at current iteration i |
| Iant: | the maximum number of iterations of ACO |
| Nant: | the number of ants |
| Itabu: | the maximum number of iterations of TS |
| n: | the number of VRP nodes |
| S*: | the final best solution |
Algorithm (ACO-TS)
| 1 Input the road network and initialize parameters |
| 2 For generation i = 1…, Iant |
| 3 For ant e = 1, …, Nant |
| 4 Visit all VRP nodes and obtain a solution |
| 5 End for |
| 6 Evaluate and obtain the current best solution Routebest(i) |
| 7 While j <= Itabu |
| 8 For k = 1, …, n |
| 9 Perform local search operators using 2-opt and 1-1 exchange moves |
| 10 Check the aspiration criteria |
| 11 Update Routebest(i) and update the tabu list |
| 12 End for |
| 13 Increment j by 1 |
| 14 Check the end condition of tabu search |
| 15 End while |
| 16 Update the pheromone concentration |
| 17 Update S* if there is an improvement |
| 18 Check the end condition of the ACO algorithm |
| 19 End for |
| 20 Return the best solution S* |
As shown in the pseudocode, the proposed ACO-TS has the same time complexity as ACO. Lines 3 to 6 correspond to the solution construction and evaluation procedure, the time complexity of which is O (Nant × n), where n is the number of VRP nodes. Lines 7 to 15 correspond to the TS procedure, the complexity of which is O (Itabu × n). Nant and Itabu are the parameters. Integrating TS into ACO does not increase the time complexity of ACO, but the global convergence speed of ACO can be improved.
5. Study Area and Data Description
With the acceleration of global change and urbanization, urban storm flooding disasters caused by continuous heavy rain have become more and more frequent in some metropolises [44,45,46]. Water on road surfaces will greatly affect traffic along these roads. In severe circumstances, vehicles can become stranded on some roads because the water depth exceeds the safety threshold of vehicles. Traffic along these roads is cut off by water, causing serious traffic congestion on adjacent roads. Hence, it is important to develop reliable route plans for rescuing stranded vehicles.
The study area of this research is the central urban district of Guangzhou city. It is located in southern China and has abundant rainfall during the summer, which can easily lead to serious urban storm flooding disasters. Once this kind of disaster occurs, people and vehicles stranded in flooded areas should be rescued as quickly as possible. According to the Guangzhou Water Affair Annual White Paper released in 2013 [47], three flood rescue teams were set up in Guangzhou, and one warehouse containing specialized rescue equipment was established. The transportation network comprised 791 road segments and 690 road nodes.
We used the urban flooding disaster that occurred on 14–15 August 2013, as an example to verify the effectiveness and applicability of the proposed MORR model and algorithms. The urban rainstorms caused by Typhoon Utor resulted in dozens of flooded areas. The exact locations of the 10 most severely submerged flooded areas and the warehouse are shown in Figure 5, where flooded areas are denoted by their IDs.
The stochastic travel times of the roads in this study were derived from the GPS-enabled tracking data of taxis. With the rapid development of information technology, city-wide data from global positioning system (GPS) receivers equipped on taxis have been collected and made available. This data has been widely applied in traffic status analyses [47,48]. Travel time variations can be measured using taxi-enabled GPS tracking data for travel time estimation. On the other hand, large-scale GPS tracking data can cover a city-wide traffic network, which can support research on emergency logistics by providing real data related to real road networks. The GPS data used in this study came from the Guangzhou Commission of Transport, a municipal administration governing the operation of taxis, buses, and other types of road transportation. The data covered all the taxi companies in Guangzhou. The GPS-enabled taxi data included records of the license plate number, latitude, longitude, speed, and status of the taxis, taken every 20 s. This research used GPS-enabled taxi data from 14–15 August 2013, for the analysis.
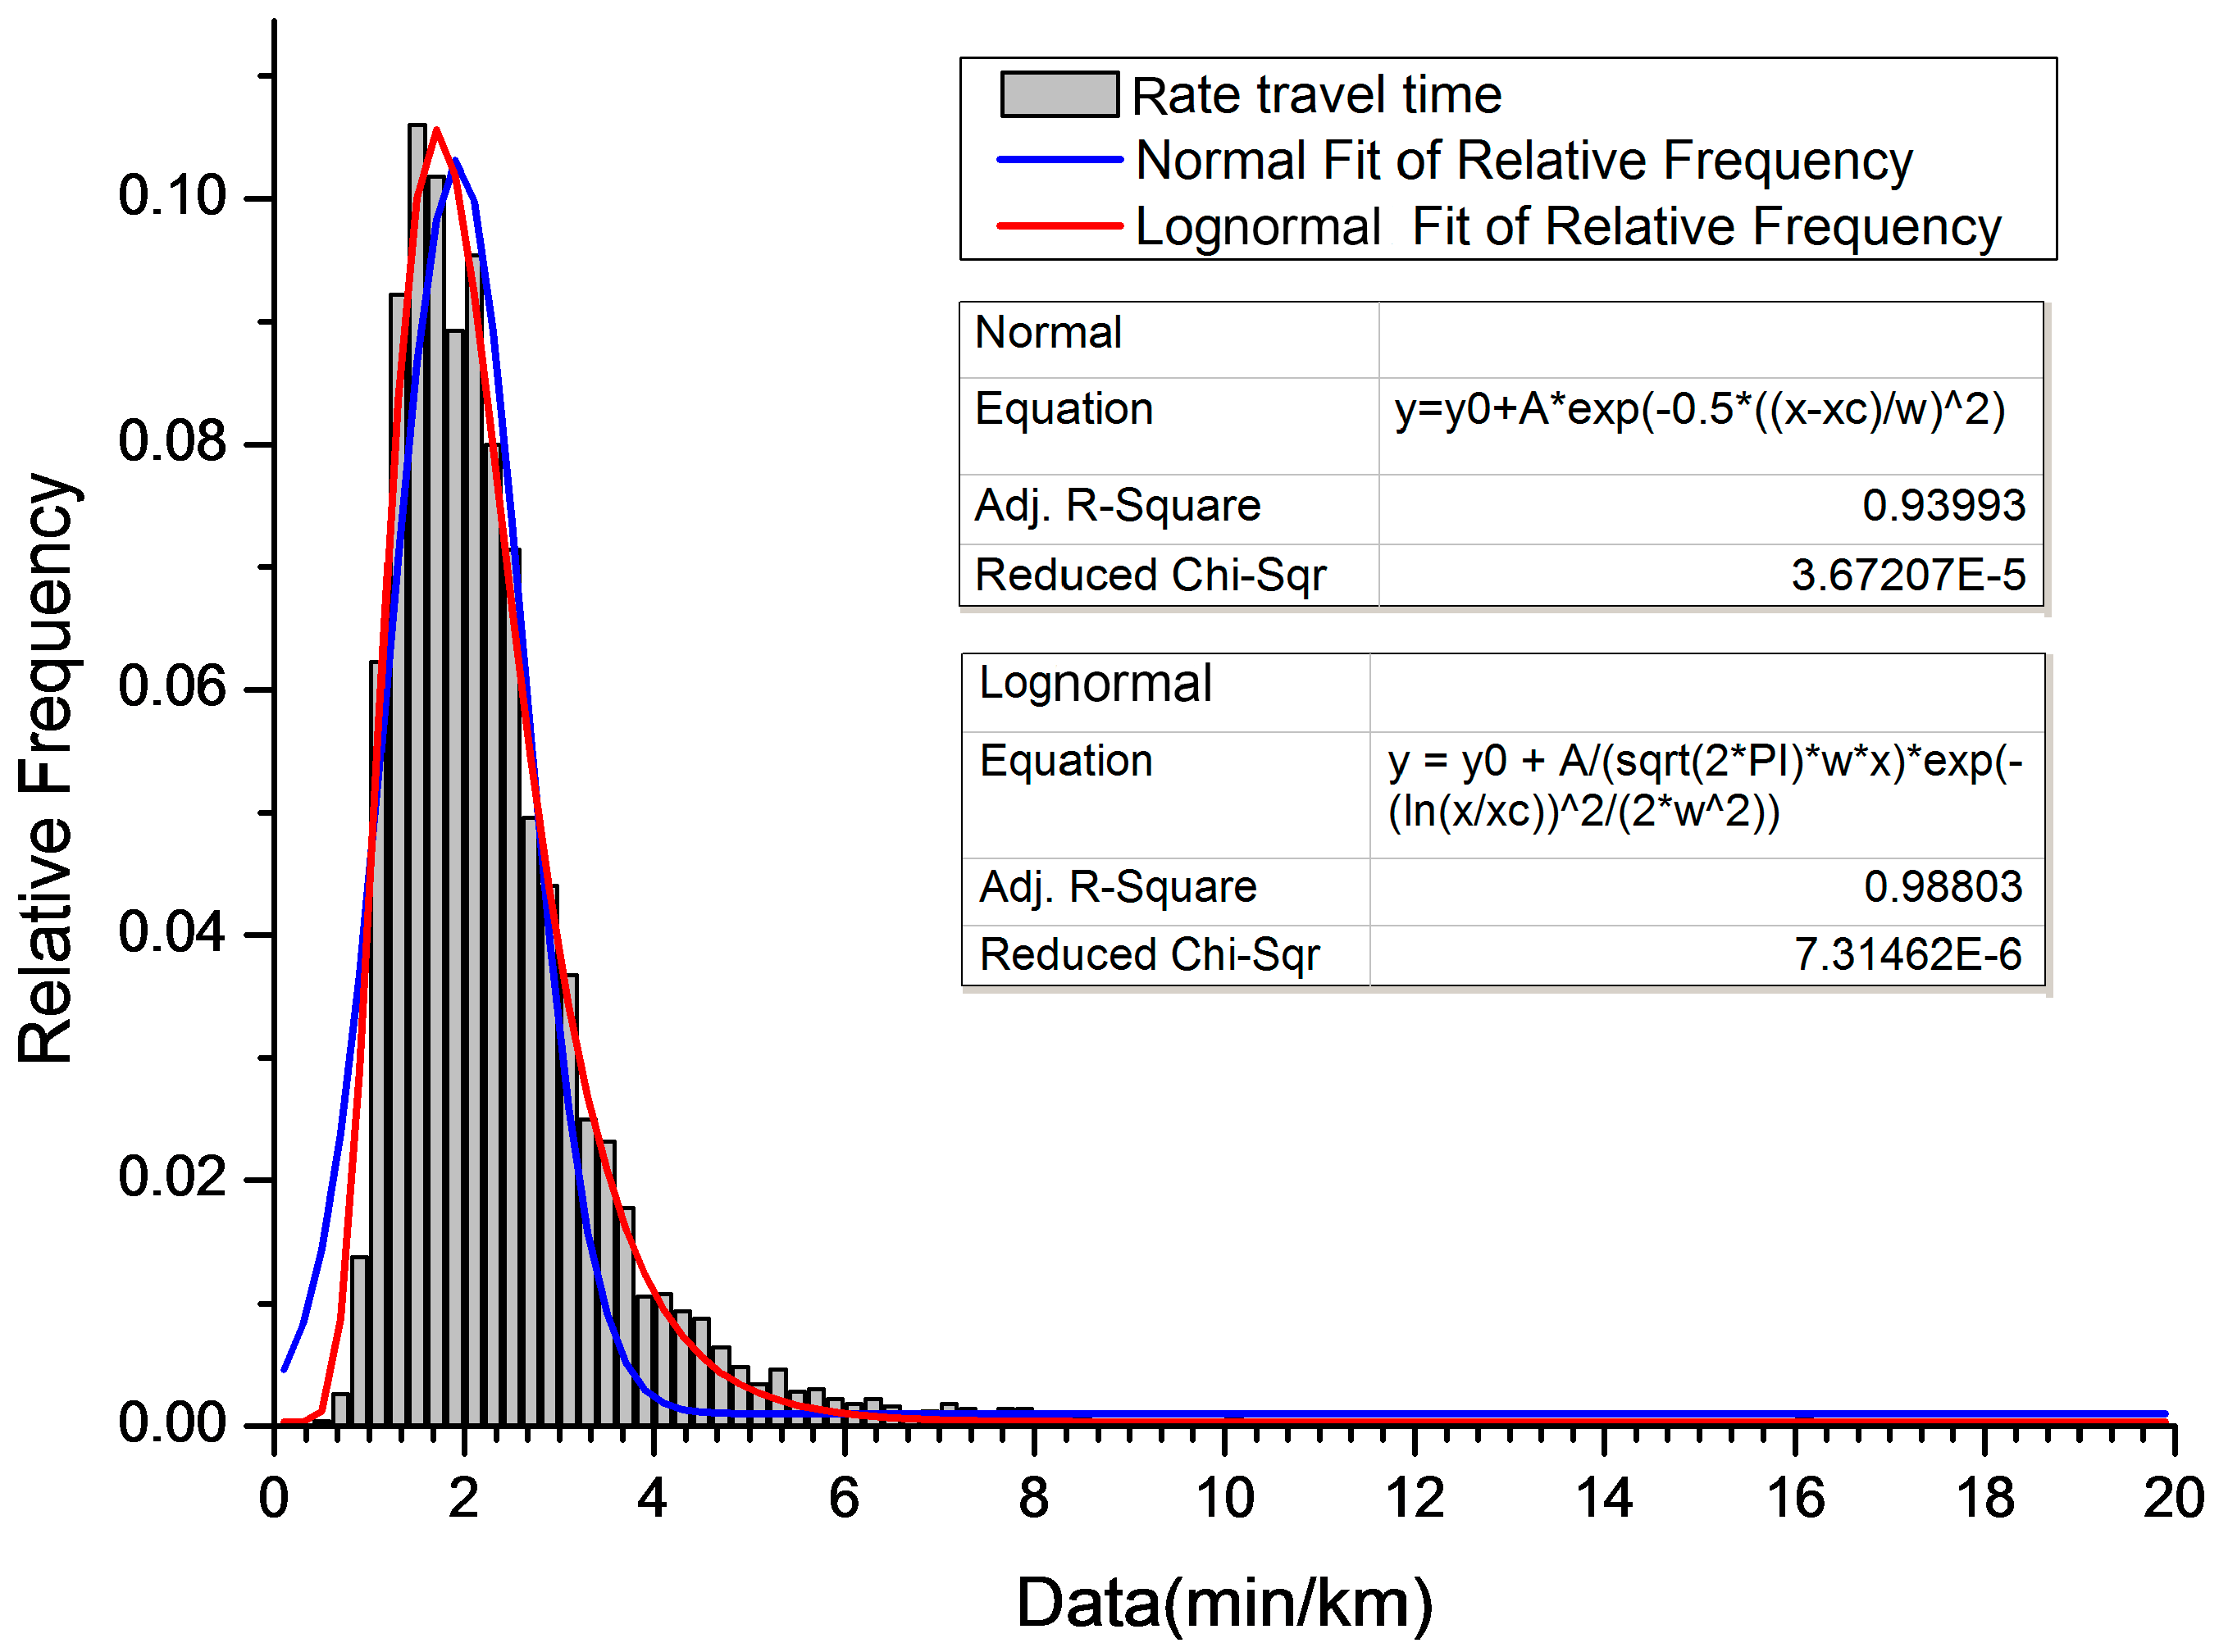
To measure the travel time along road segments of varying lengths, minute/km was adopted as the unit. The average travel time was calculated at intervals of 10 min. Before computing the mean and variance values of each road segment, we fitted the distribution of the samples extracted using a simple random sampling method with both a lognormal distribution and a normal distribution. The fitting results are shown in Figure 6. From the comparison of the R-squared and reduced chi-square values, it can be inferred that the lognormal distribution model was superior to the normal distribution model, in this study.
6. Experiment and Results
To evaluate the rescue performance of the proposed model under uncertain traffic conditions, three problems were defined for comparison (Table 2).
Problem S1: The objective was to minimize the average travel time (ATT) of rescue paths under a deterministic network (DN), with the road travel time as the weight.
Problem S2: The objective was to minimize the travel time budget (TTB) of rescue paths with an on-time arrival probability, α, under a stochastic network (SN).
Problem S3: The objective was to minimize the TTB of all rescue paths, as well as the maximum TTB of an individual rescue vehicle (Max-TTB) with an on-time arrival probability, α. This is a multiobjective optimization, performed to balance the time costs of different rescue paths.
As defined above, Problem S1 represents the traditional approach, which ignores travel time uncertainty. Problem S2 represents the optimal rescue routing plan under a stochastic network. Problem S3 aims to balance the time budgets of different rescue routes.
The upper-level VRP network was first built, before rescue route planning. The average travel times between the warehouse and the 10 flooded areas are shown in Table 3. The ID of the warehouse is 0, and the IDs of the flooded areas range from 1 to 10. In addition, the travel time budgets between the warehouse and flooded areas are presented in Table 4. The budgets were calculated by using the multicriteria label-setting algorithm mentioned in Section 4.2, with an on-time probability of α = 0.9, which is a high probability used to guarantee that rescue vehicles will arrive at the flooding points on time. As shown in Table 3 and Table 4, the average travel times were less than the travel time budgets for each VRP node pair, which implies that the fastest paths are not always reliable if the stochastic characteristics of the transportation network are considered.
There are several main parameters in the proposed ACO-TS: δ, β, ρ for ACO, and L (the length of the tabu list) for the TS algorithm. These can affect the algorithm’s ability to find optimization solutions and its convergence speed. Previous literature suggests some empirical values or value ranges for these parameters [35,38]. We looped through the ACO-TS with different parameter combinations to find the optimal value. In these iterations, the values of δ and β were increased from 0 to 2 by increments of 0.2. The value of ρ was increased from 0.6 to 0.9 by increments of 0.1. The value of L was increased from 1 to 10 by increments of 1. Table 5 lists the parameters used in the proposed ACO-TS. The capacity of each rescue vehicle, that is, C in Formula (20), was set to 4, which meant that, in this study, a maximum of 4 sets of rescue equipment were loaded onto each vehicle.
We first compared the routing results of the proposed ACO-TS with those of the VRP tool in the ArcGIS Network Analyst module to verify the efficiency of our proposed method. The VRP tool is based on tabu search metaheuristics. As a classical indicator, the total length of the routes was used for comparison. As shown in Table 6, the total length of the routes of the ACO-TS was 52.62 km, which was less than that of the classical VRP tool in the ArcGIS Network Analyst module. This comparison demonstrates the technical strength of the proposed ACO-TS.
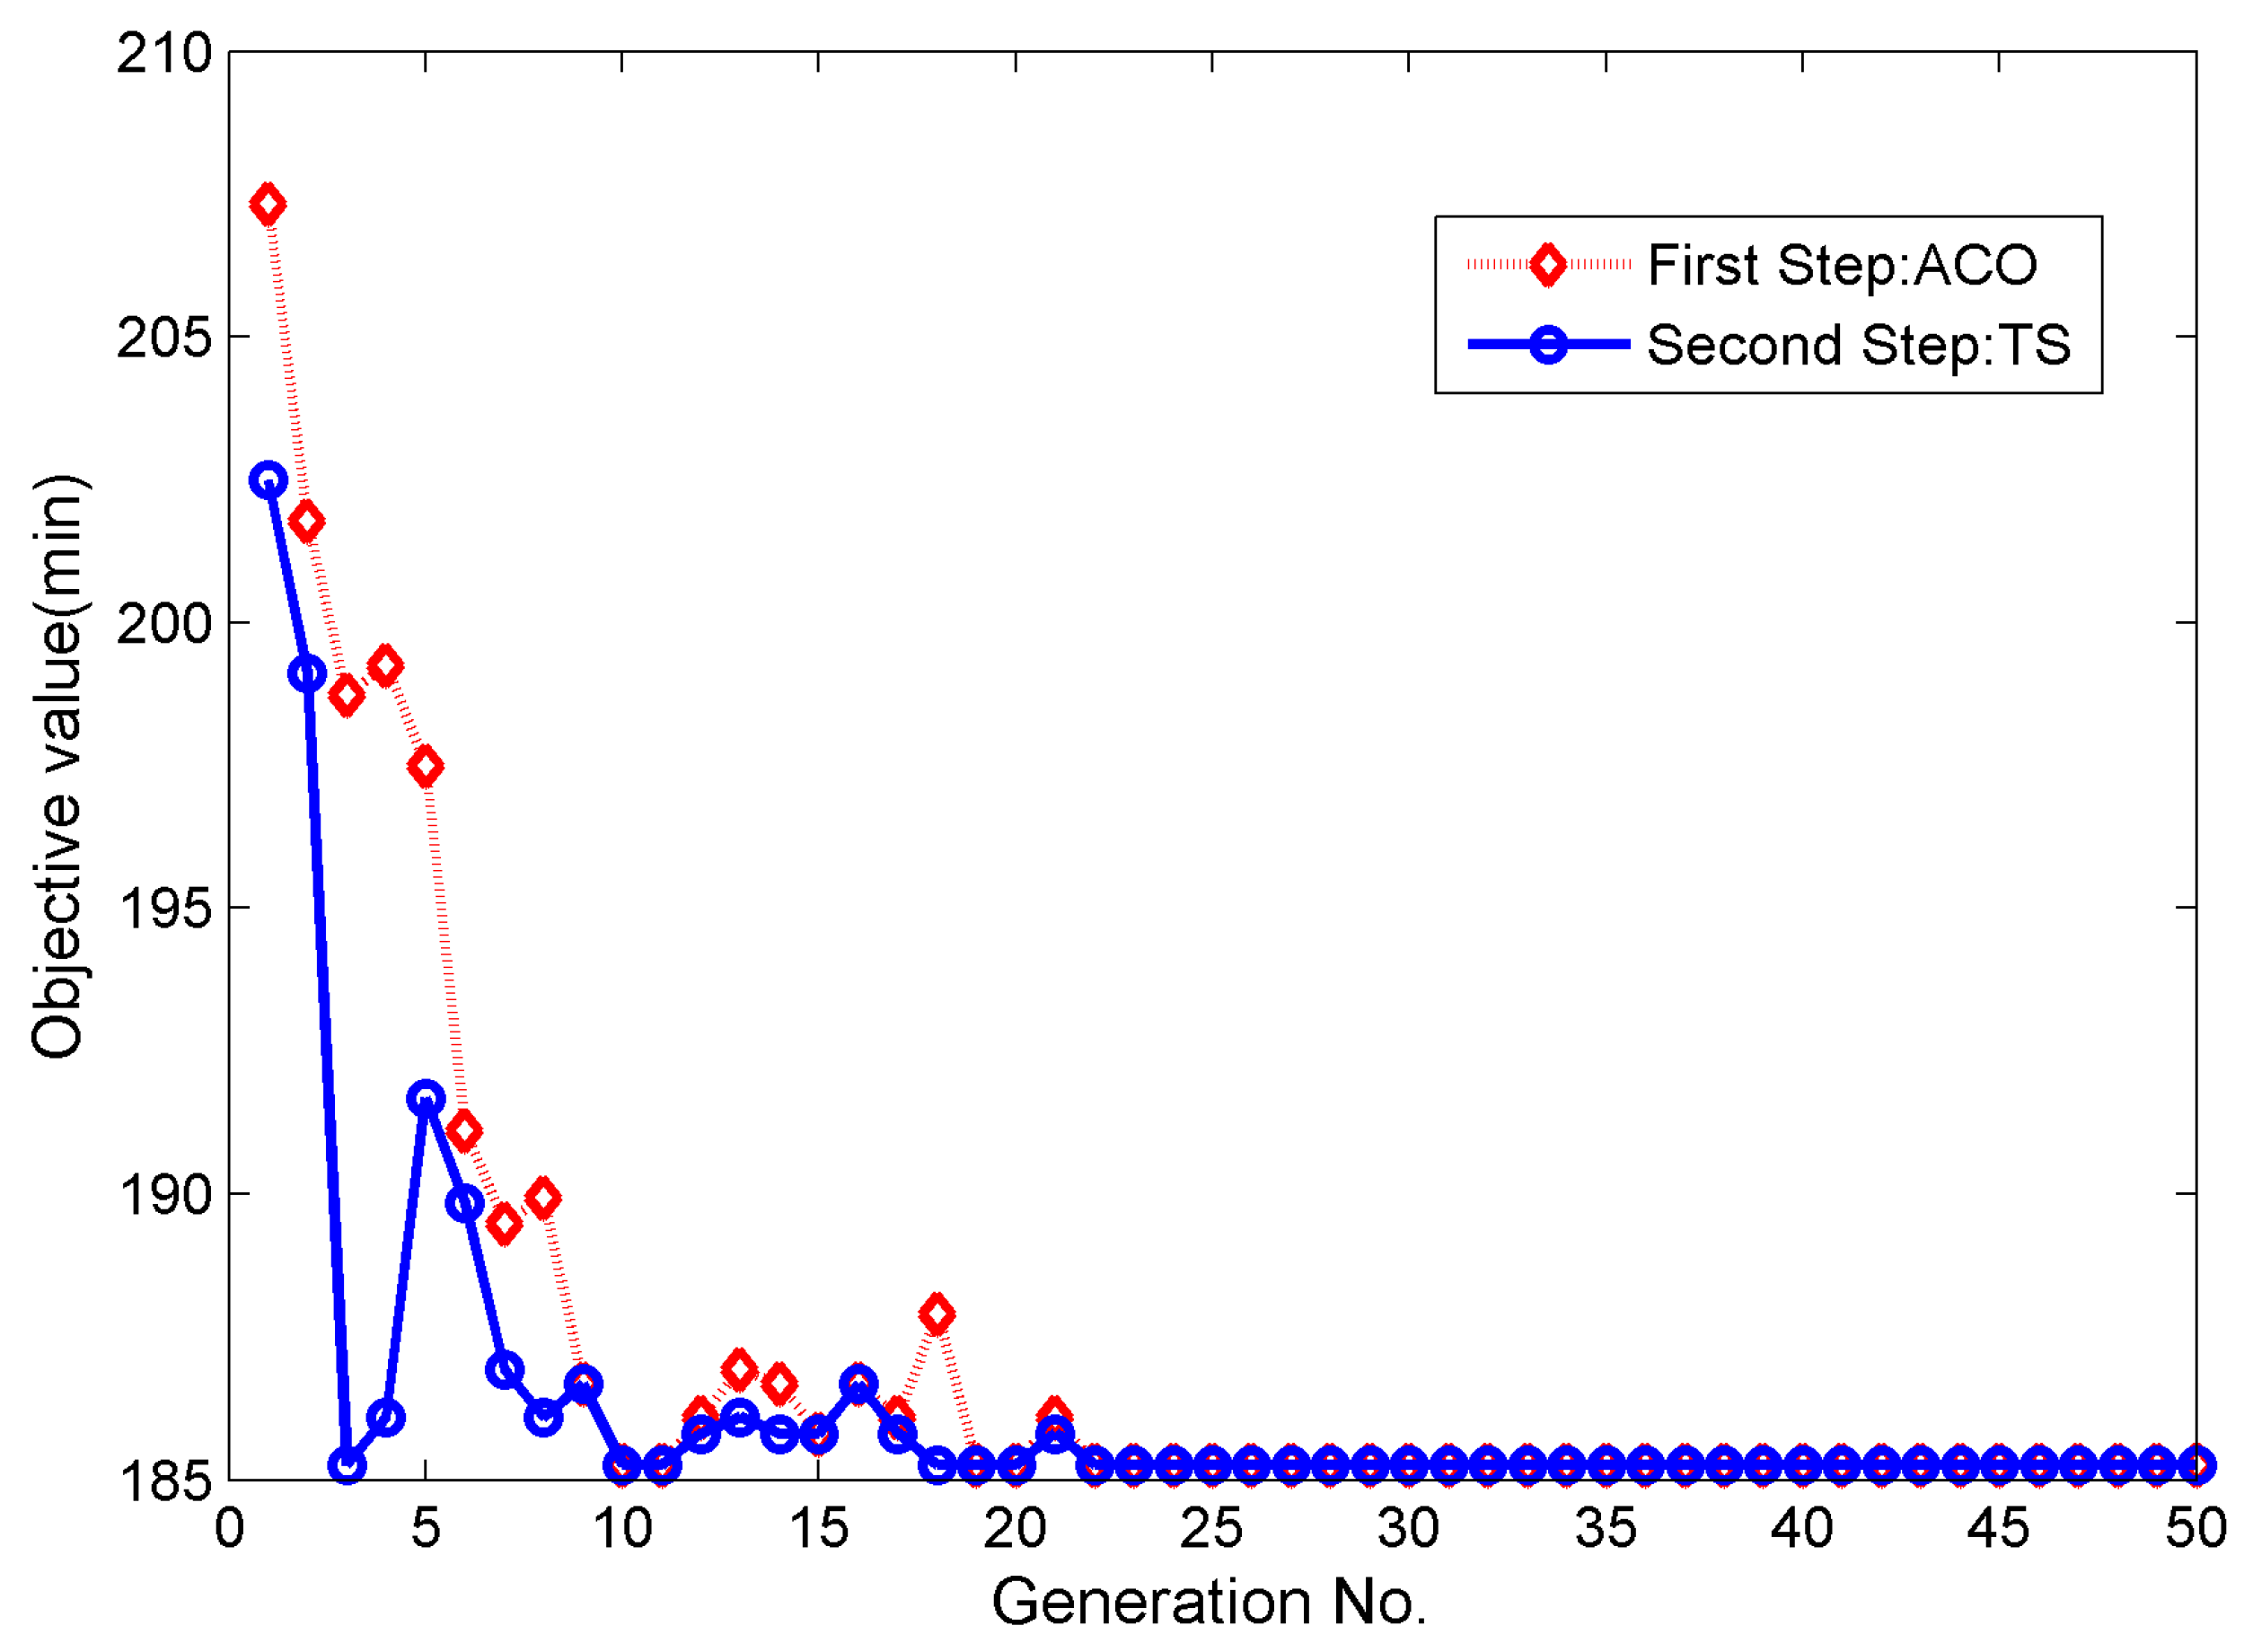
Figure 7 illustrates the optimization of R via the iteration process in problem S3. In each iteration, the objective value was optimized via ACO first, then the candidate solutions were optimized again using the tabu search strategy with neighbor search operators. The differences between the objective values obtained via ACO and TS indicated that the integration of ACO and TS improved the efficiency and capability of optimization.
The routing plans (and their performances) of the three problems (S1, S2, and S3) are compared in Table 7 to show the significance of considering travel time reliability when planning rescue routes. The details of the open routes, the length, the ATT, the TTB, and the mean and variance values of the open routes of S1, S2, and S3 are listed and compared. There were three open routes in each problem, and each open route was for a rescue team. We numbered the open route covering four flooded areas as 0 and the other two open routes covering three flooded areas as 1 and 2.
In Table 7, the ATTs of the three open routes of S1 are 64.84 min, 18.58 min, and 19.56 min. According to the mean, μ, and variance, δ, values of each open route, the actual on-time arrival probability of each open route can be calculated as 0.47, 0.13 and 0.14, respectively. On the other hand, the sum of the TTBs of these three open routes reached 137.36 min when the on-time arrival probability was 0.9, a value that was 34.38 min greater than the ATT value. The results quantitatively indicated that the planned routes in S1 were uncertain.
Regarding the values of the open route length, ATT and TTB, we found that the differences in sums of the open route length and ATT between S2 and S1 were very small, while the sum of the TTBs of S2 were reduced by 14.8% when compared to that of S1. This result shows that the proposed model can find rescue routes with a high on-time arrival probability that have the almost shortest route length and average travel time. Note that the differences in the TTBs among the open routes of S2 were still very large. In S2, the TTB of open route 1 was 71.28 min, while the TTBs of open routes 2 and 3 were only 21.80 min and 23.99 min, respectively. This result implies that flooded area 7 will wait at least 71.28 min before being visited. In S3, since the maximum TTB of the open routes was also minimized, the TTB of each open route was more balanced. The TTBs of open routes 0, 1, and 2 in S3 were 49.27 min, 56.41 min, and 23.99 min, respectively. The flooded area with the longest waiting time was also area 7, but its waiting time was reduced to 56.41 min.
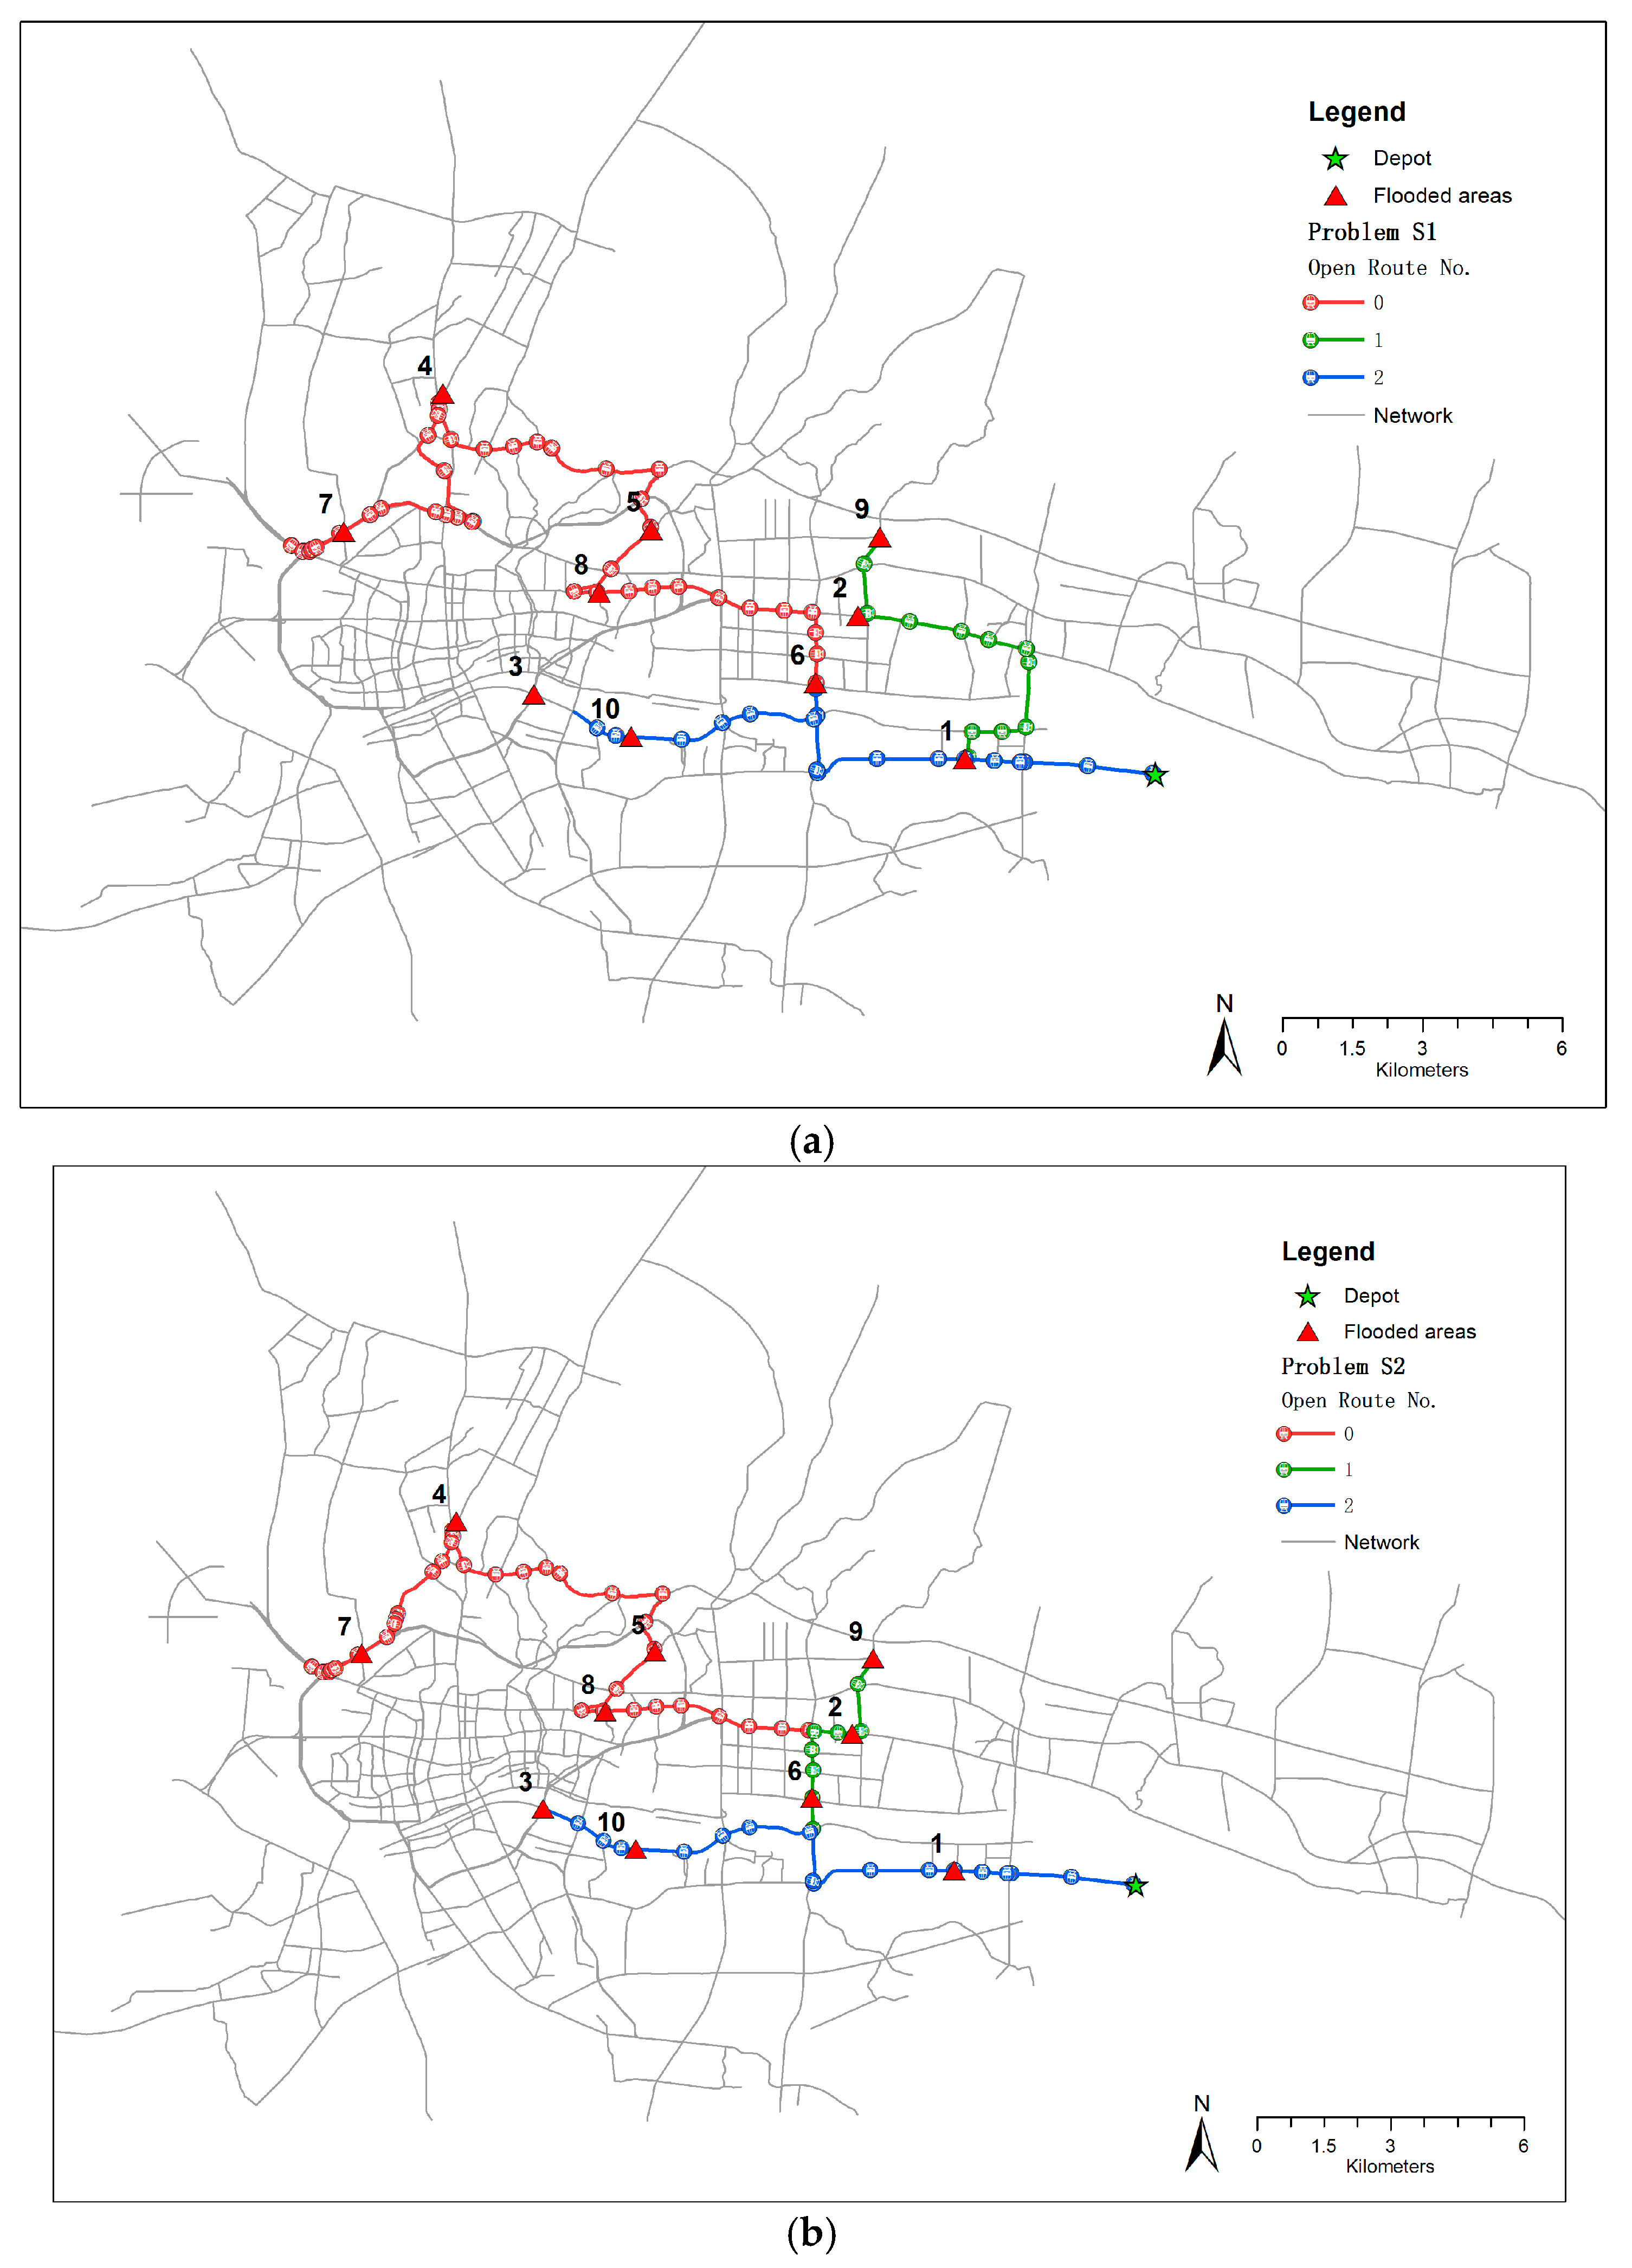
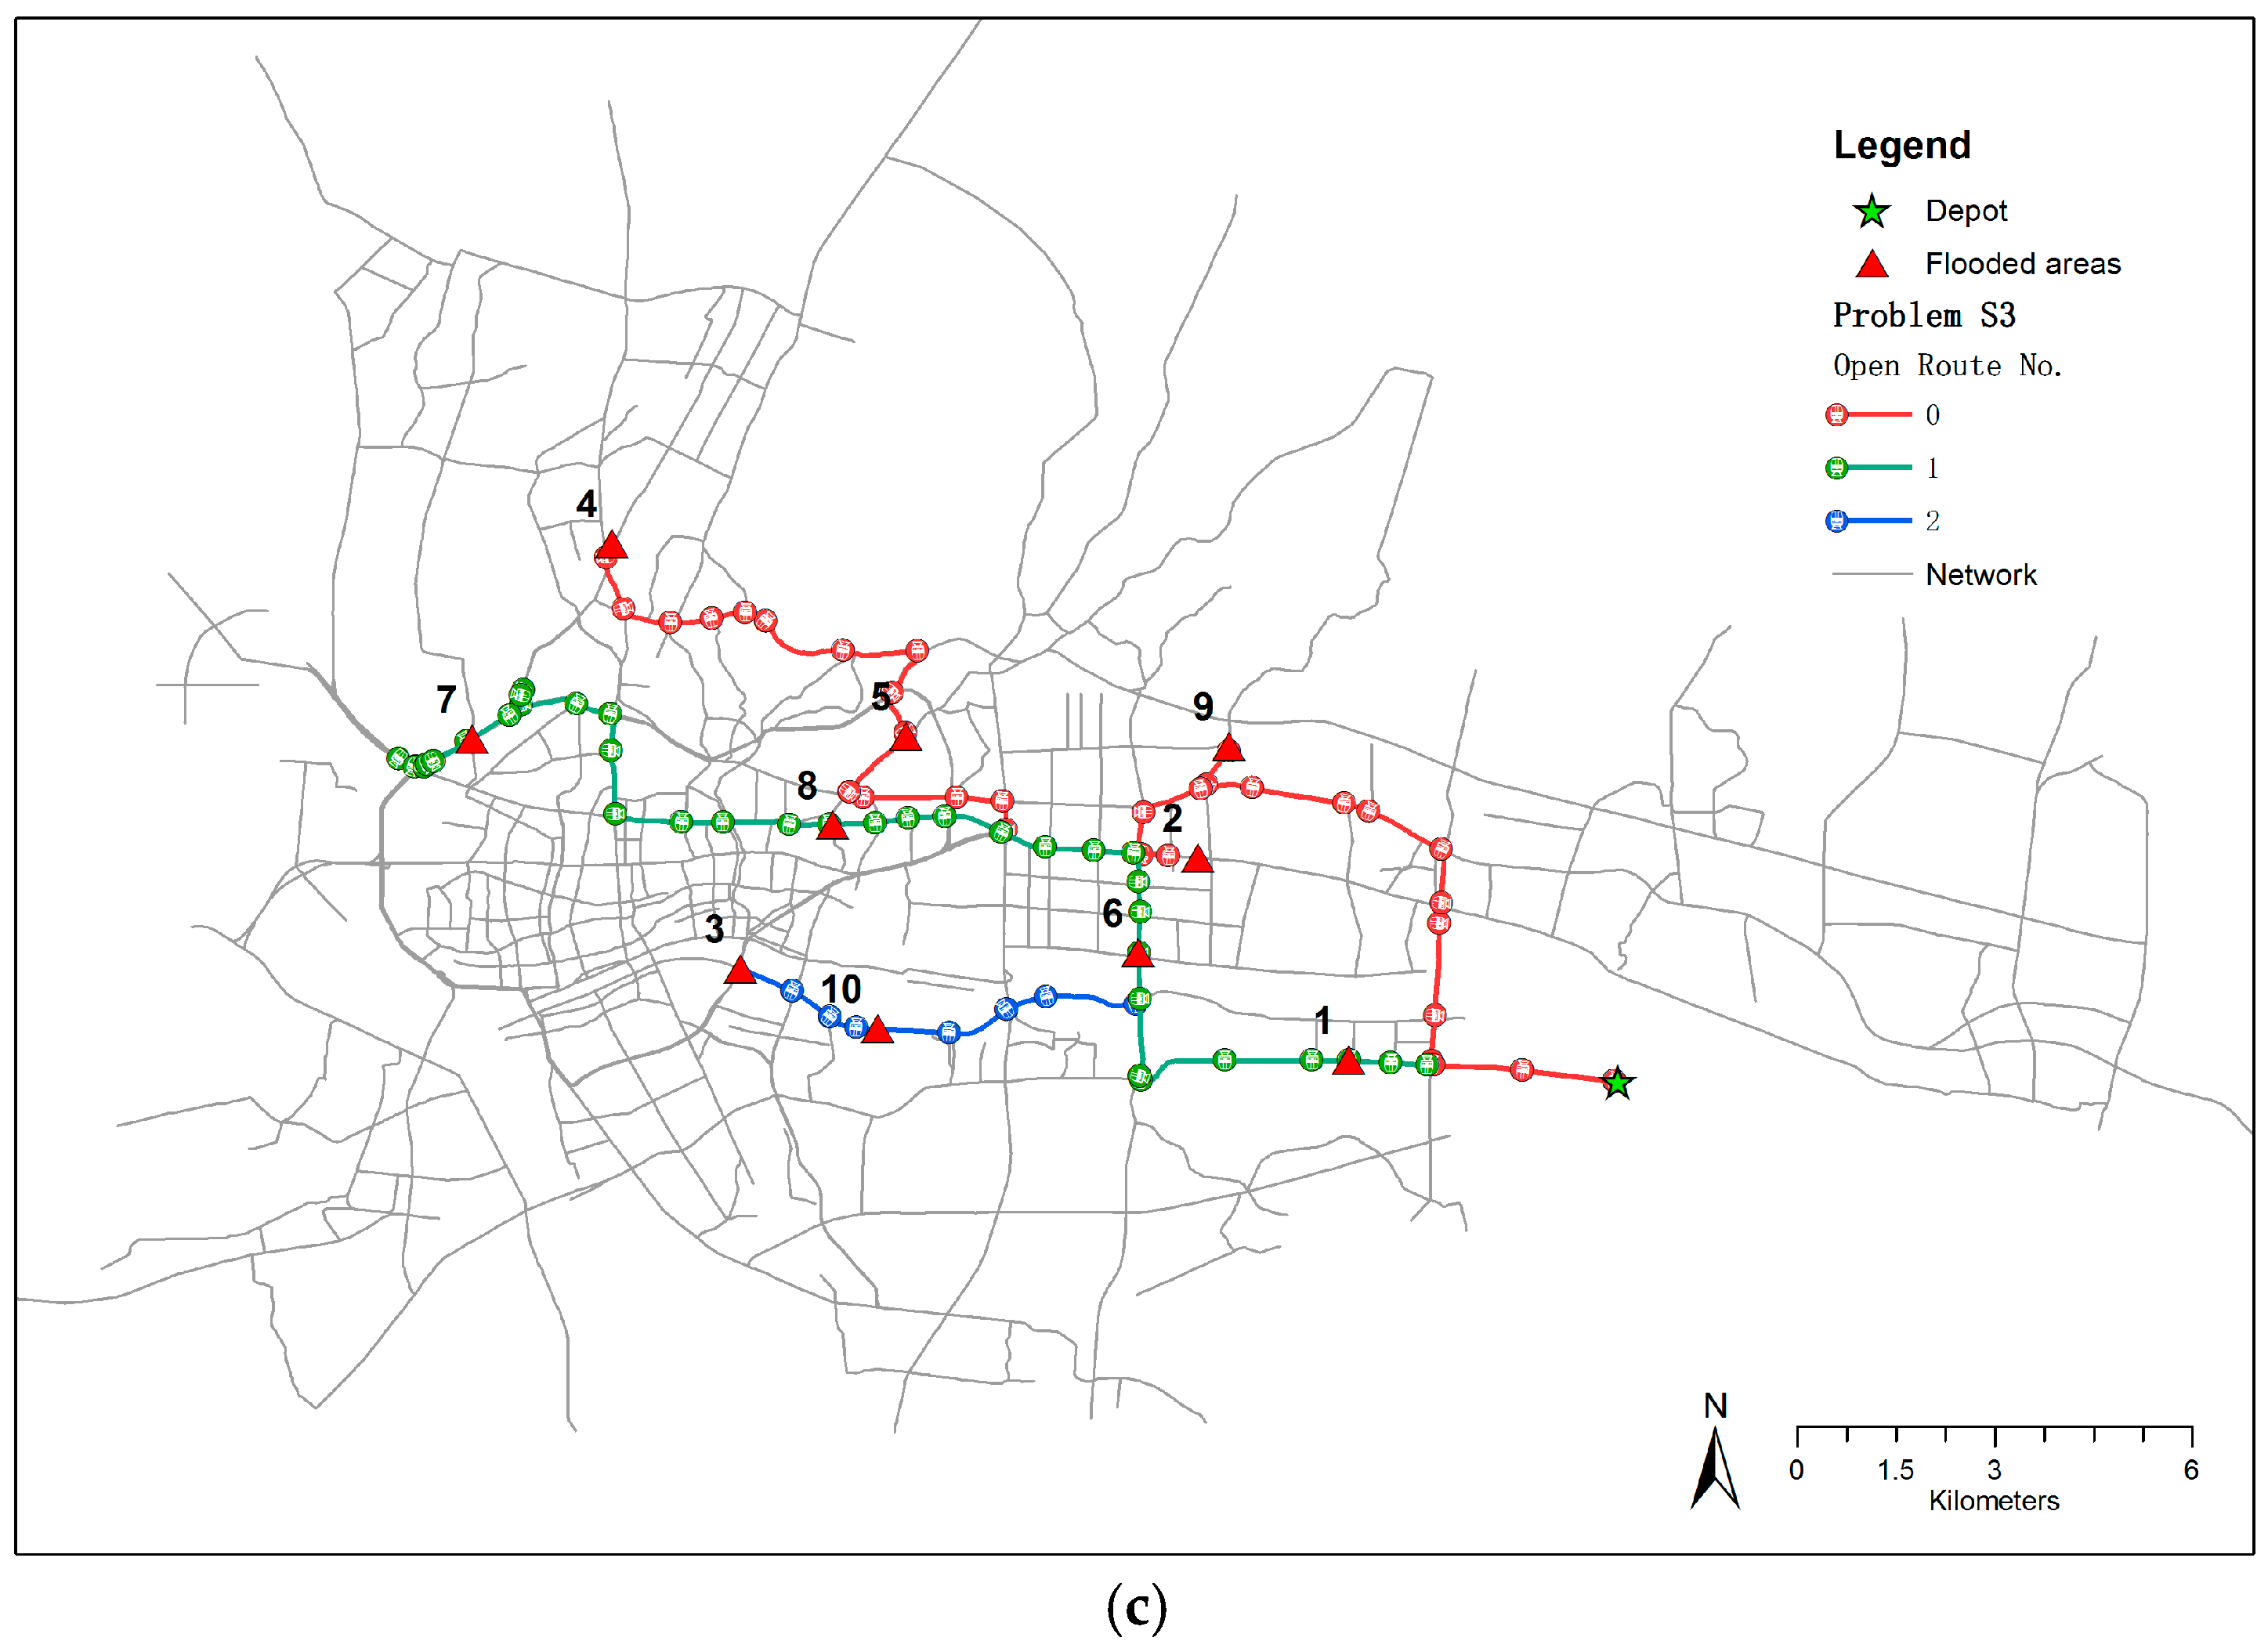
The rescue routes of S1 and S2 are displayed on the road networks in Figure 8a,b, respectively. The three open routes all started from the warehouse, then covered different flooded areas. For S1, the flooded area coverage sequence of open route 0 was 0→8→5→4→7, that of open route 1 was 0→1→2→9, and that of open route 2 was 0→6→10→3. For S2, the flooded area coverage sequence of open route 0 was also 0→8→5→4→7, that of open route 1 was 0→6→2→9, and that of open route 2 was 0→1→10→3. It should be noted that although the flooded area coverage sequence of the first open routes of S1 and S2 were the same, the path details were different between flooded areas 4 and 7. The routes of S2 serve as good guides for rescue vehicles transporting equipment along the fastest paths under a very high on-time arrival reliability (α = 0.9). For S3, the flooded area coverage sequence of open route 0 was 0→9→2→5→4, that of open route 1 was 0→6→8→7, and that of open route 2 was 0→1→10→3. The route details of S3 are displayed on the road network shown in Figure 8c.
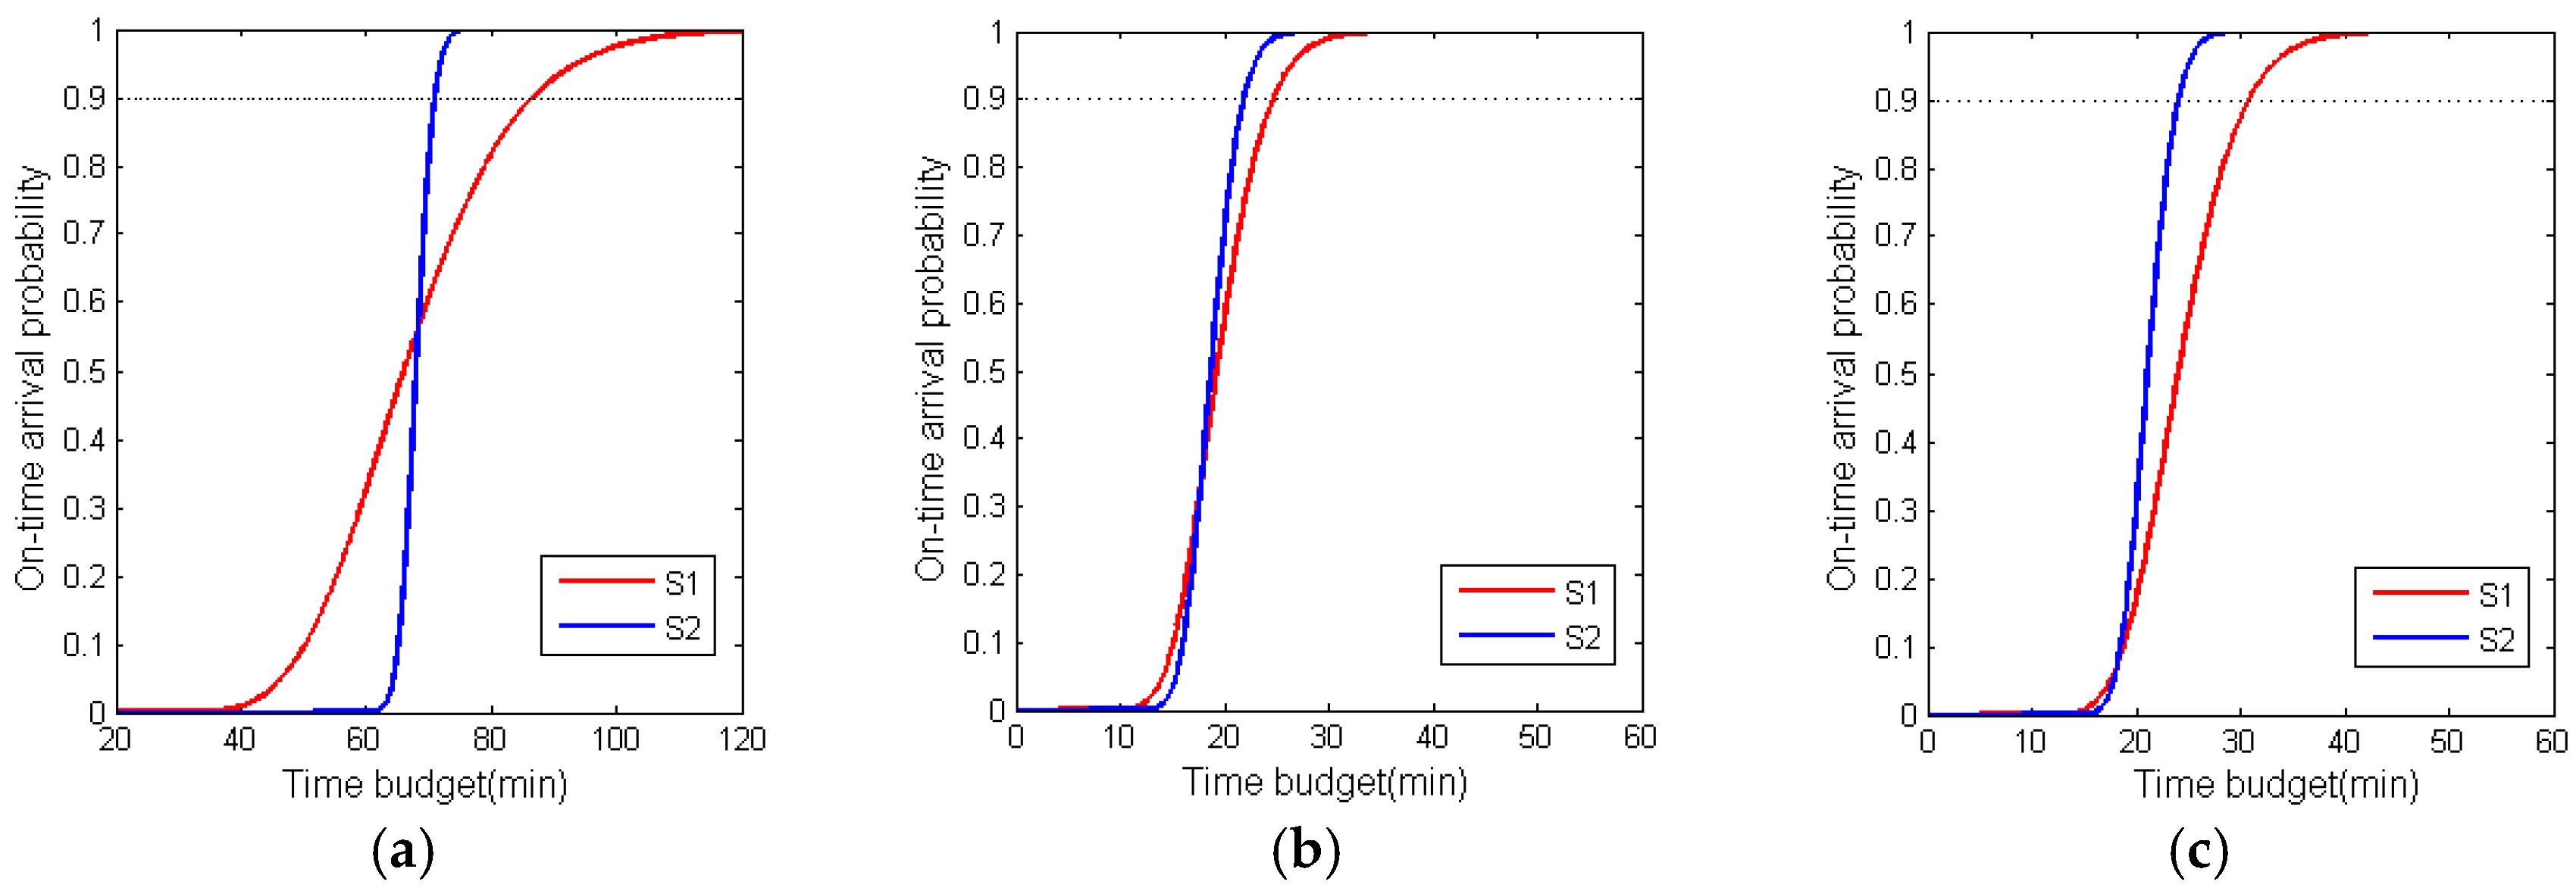
The above analyses and comparisons are all based on an on-time arrival probability of 0.9. The travel time budget of the optimized routes of S1, S2, and S3 may vary with the on-time arrival probability. To answer the question regarding whether the routes of S2 can always achieve a lower travel time budget than the routes of S1 for different on-time arrival probabilities, a comparison of the cumulative probability density curves of the open routes of S1 and S2 was conducted, as shown in Figure 9. For open route 0, when the on-time arrival probability was above 0.55, the travel time budget of S2 was less than that of S1. For open route 1, when the on-time arrival probability was above 0.3, the travel time budget of S2 was less than that of S1. For open route 2, when the on-time arrival probability was above 0.1, the travel time budget of S2 was less than that of S1. That is, if the on-time arrival probability is required to be larger than 0.55, the routes of S2 are better than those of S1. Therefore, the proposed model considering travel time reliability is important for the flood disaster rescue route planning discussed in this study, for which a high on-time arrival probability should be guaranteed.
Another question is whether the difference in travel time budget between S2 and S3 will change for different on-time arrival probabilities. S2 and S3 are both optimal routing plans derived using the proposed model, and the cumulative probability density curves of their open routes are illustrated in Figure 10. For open route 0, S3 outperformed S2 regardless of the on-time arrival probability, while for open route 1, S2 outperformed S3. For open route 2, the two curves overlapped. From the curve shapes of S2 and S3, it can be inferred that the difference in travel time budget between S2 and S3 does not seem to change with the variation in on-time arrival probability. Although the sum of the travel time budgets of all three open routes of S3 was larger than that of S2, in terms of balancing the waiting time of people trapped at each flooding point, S3 was better than S2 regardless of the on-time arrival probability.
7. Conclusions
The research presented in this paper introduced a multiobjective rescue routing (MORR) model based on travel time reliability in a stochastic network, for a case in which the road travel time is strongly influenced by urban storm flooding disasters. A hybrid metaheuristic integrating ACO and TS, named ACO-TS, was proposed to solve the MORR model. Experiments based on a real-world case were conducted to evaluate the proposed model and algorithm. The study area was the central urban district of Guangzhou city, which is located in southern China and experiences abundant rainfall during the summer. The objective was to plan routes for rescue vehicles, to guide them to flooding points as quickly as possible under a high on-time arrival probability.
Three problems (S1, S2, and S3) were defined to evaluate the rescue performance of the proposed model. S1 was the basic situation, without consideration of the traffic uncertainty, while the plans of S2 and S3 were derived using the proposed model. By comparing the travel time budgets of S1, S2, and S3, we were able to draw several conclusions. First, when traffic uncertainty was not considered, the on-time arrival probability of the planned routes was low if the rescue vehicles were expected to finish the routes within the average travel time. Second, when the on-time arrival probability was required to be larger than 0.55, the route plan of S2 was better than that of S1. Third, S2 and S3 were non-dominated route plans with different weight combinations of objective F1 and objective F2. In terms of balancing the waiting time at each flooding point, the routing plans of S3 were better than those of S2, regardless of the on-time arrival probability.
Our proposed model and algorithm can help decision makers design reliable and quick rescue routes, and they can also be applied to other emergency rescue events in which the travel time in the transportation network is stochastic. The on-time arrival probability was set to 0.9 for the case study, which is a high on-time arrival probability. Emergency management departments can set higher on-time arrival probabilities according to the urgency of the rescue task. We plan to improve our model and algorithm in the following ways. First, it would be better if the spatial correlation between neighboring road segments is taken into consideration when estimating the values of μ and σ of rescue paths. Second, it is assumed, in this study, that link travel times are stable during the rescue mission. It is necessary to extend the proposed model and the algorithm to a stochastic time-dependent network, in which link travel times vary with time. Third, it is necessary to extend the proposed model and algorithm to the case of multidepot rescue routing problems.
Acknowledgments
The authors would like to thank the valuable comments from anonymous reviewers. This study was jointly supported by the National Natural Science Foundation of China (Grant # 41501424, # 41401444, # 41371499), the Natural Science Foundation of Guangdong Province (Grant # 2016A030310168), the Open Research Fund of State Key Laboratory of Information Engineering in Surveying, Mapping and Remote sensing, Wuhan University (Grant # 16S02).
Author Contributions
This research was mainly formulated and designed by Qiuping Li and Wei Tu. Li Zhuo provided the dataset. Qiuping Li and Wei Tu performed the experiments and analyzed the data. Qiuping Li, Wei Tu, and Li Zhuo wrote the paper.
Conflicts of Interest
The authors declare no conflicts of interest.
References
- Berbeglia, G.; Cordeau, J.-F.; Laporte, G. Dynamic pickup and delivery problems. Eur. J. Oper. Res. 2010, 202, 8–15. [Google Scholar] [CrossRef]
- Tu, W.; Fang, Z.; Li, Q.; Shaw, S.-L.; Chen, B. A bi-level voronoi diagram-based metaheuristic for a large-scale multi-depot vehicle routing problem. Transp. Res. Part E Logist. Trans. Rev. 2014, 61, 84–97. [Google Scholar] [CrossRef]
- Repoussis, P.P.; Tarantilis, C.D.; Ioannou, G. Arc-guided evolutionary algorithm for the vehicle routing problem with time windows. IEEE Trans. Evol. Comput. 2009, 13, 624–647. [Google Scholar] [CrossRef]
- Tu, W.; Li, Q.; Chang, X.; Yue, Y.; Zhu, J. A spatio-temporal decision support framework for large scale logistics distribution in the metropolitan area. In Book Advances in Spatial Data Handling and Analysis; Harvey, F., Leung, Y., Eds.; Springer: Berlin, Germany, 2015; pp. 193–206. ISBN 978-3-319-19950-4. [Google Scholar]
- Tu, W.; Li, Q.; Fang, Z.; Zhou, B. A novel spatial-temporal voronoi diagram-based heuristic approach for large-scale vehicle routing optimization with time constraints. ISPRS Int. J. Geo-Inf. 2015, 4, 2019–2044. [Google Scholar] [CrossRef]
- Du, B.; Zhou, H. A Two-stage Robust Optimization Model for Emergency Facility Location Problems under Uncertainties. Ind. Eng. J. 2016, 19, 45–50. [Google Scholar]
- Fontem, B.; Melouk, S.H.; Keskin, B.B.; Bajwa, N. A decomposition-based heuristic for stochastic emergency routing problems. Expert Syst. Appl. 2016, 59, 47–59. [Google Scholar] [CrossRef]
- Caunhye, A.M.; Nie, X.; Pokharel, S. Optimization models in emergency logistics: A literature review. Soc. Econ. Plan. Sci. 2012, 46, 4–13. [Google Scholar] [CrossRef]
- Chen, B.Y.; Lam, W.H.K.; Sumalee, A.; Li, Q.; Shao, H.; Fang, Z. Finding reliable shortest paths in road networks under uncertainty. Netw. Spat. Econ. 2012, 13, 123–148. [Google Scholar] [CrossRef]
- Chen, A.; Ji, Z. Path finding under uncertainty. J. Adv. Transp. 2010, 39, 19–37. [Google Scholar] [CrossRef]
- Chen, B.Y.; Lam, W.H.K.; Sumalee, A.; Li, Z.-L. Reliable shortest path finding in stochastic networks with spatial correlated link travel times. Int. J. Geogr. Inf. Sci. 2012, 26, 365–386. [Google Scholar] [CrossRef]
- Sheu, J.B.; Pan, C. Relief Supply Collaboration for Emergency Logistics Responses to Large-Scale Disasters. Transp. A Transp. Sci. 2015, 11, 210–242. [Google Scholar] [CrossRef]
- Haghani, A.; Oh, S.C. Formulation and solution of a multi-commodity, multi-modal network flow model for disaster relief operations. Transp. Res. Part A Policy Pract. 1996, 30, 231–250. [Google Scholar] [CrossRef]
- Hsu, T.P.; Jung, W.S. The more reliable path for post great earthquake traffic management. In Proceedings of the IEEE International Conference on Networking, Sensing and Control, Taipei, Taiwan, 21–23 March 2004. [Google Scholar]
- Barbarosoğlu, G.; Arda, Y. A two-stage stochastic programming framework for transportation planning in disaster response. J. Oper. Res. Soc. 2004, 55, 43–53. [Google Scholar] [CrossRef]
- Chang, M.-S.; Tseng, Y.-L.; Chen, J.-W. A scenario planning approach for the flood emergency logistics preparation problem under uncertainty. Transp. Res. Part E Logist. Trans. Rev. 2007, 43, 737–754. [Google Scholar] [CrossRef]
- Lin, Y.-H.; Batta, R.; Rogerson, P.A.; Blatt, A.; Flanigan, M. A logistics model for emergency supply of critical items in the aftermath of a disaster. Soc. Econ. Plan. Sci. 2011, 45, 132–145. [Google Scholar] [CrossRef]
- Bozorgi-Amiri, A.; Jabalameli, M.S.; Mirzapour Al-e-Hashem, S.M.J. A multi-objective robust stochastic programming model for disaster relief logistics under uncertainty. OR Spectr. 2011, 35, 905–933. [Google Scholar] [CrossRef]
- Özdamar, L.; Demir, O. A hierarchical clustering and routing procedure for large scale disaster relief logistics planning. Transp. Res. Part E Logist. Trans. Rev. 2012, 48, 591–602. [Google Scholar] [CrossRef]
- Jotshi, A.; Gong, Q.; Batta, R. Dispatching and routing of emergency vehicles in disaster mitigation using data fusion. Soc. Econ. Plan. Sci. 2009, 43, 1–24. [Google Scholar] [CrossRef]
- Wang, H.; Du, L.; Ma, S. Multi-objective open location-routing model with split delivery for optimized relief distribution in post-earthquake. Transp. Res. Part E Logist. Trans. Rev. 2014, 69, 160–179. [Google Scholar] [CrossRef]
- Garrido, R.A.; Lamas, P.; Pino, F.J. A stochastic programming approach for floods emergency logistics. Transp. Res. Part E Logist. Trans. Rev. 2015, 75, 18–31. [Google Scholar] [CrossRef]
- Duque, P.A.M.; Dolinskaya, I.S.; Sörensen, K. Network repair crew scheduling and routing for emergency relief distribution problem. Eur. J. Oper. Res. 2015, 248, 272–285. [Google Scholar] [CrossRef]
- Jia, H.; Ordóñez, F.; Dessouky, M.M. Solution approaches for facility location of medical supplies for large-scale emergencies. Comput. Ind. Eng. 2007, 52, 257–276. [Google Scholar] [CrossRef]
- Mete, H.O.; Zabinsky, Z.B. Stochastic optimization of medical supply location and distribution in disaster management. Int. J. Prod. Econ. 2010, 126, 76–84. [Google Scholar] [CrossRef]
- Miao, C.; Wu, Q.D.; Xu, W.S. Model and algorithm of reliable path finding under sudden-onset disaster. Comput. Eng. Appl. 2007, 43, 1–4. [Google Scholar]
- Zhang, L.; Kong, Y.Y. Study on model for emergency rescue teams assignment after urban flooding disaster. China Saf. Sci. J. 2013, 23, 171–176. [Google Scholar]
- Lu, C.-C.; Sheu, J.-B. Robust vertex p-center model for locating urgent relief distribution centers. Comput. Oper. Res. 2013, 40, 2128–2137. [Google Scholar] [CrossRef]
- Szeto, W.Y.; Wang, A.B. Reliable network design under supply uncertainty with probabilistic guarantees. Transp. A Transp. Sci. 2016, 12, 504–532. [Google Scholar] [CrossRef] [Green Version]
- Li, X.; Tian, P.; Leung, S.C.H. Vehicle routing problems with time windows and stochastic travel and service times: Models and algorithm. Int. J. Prod. Econ. 2010, 125, 137–145. [Google Scholar] [CrossRef]
- Srinivasan, K.K.; Prakash, A.A.; Seshadri, R. Finding most reliable paths on networks with correlated and shifted log–normal travel times. Transp. Res. Part B Methodol. 2014, 66, 110–128. [Google Scholar] [CrossRef]
- Tu, W.; Li, Q.; Fang, Z.; Shaw, S.-L.; Zhou, B.; Chang, X. Optimizing the locations of electric taxi charging stations: A spatial–temporal demand coverage approach. Transp. Res. Part C Emerg. Technol. 2016, 65, 172–189. [Google Scholar] [CrossRef]
- Wang, X.; Choi, T.M.; Liu, H.; Yue, X. Novel ant colony optimization methods for simplifying solution construction in vehicle routing problems. IEEE Trans. Intell. Transp. Syst. 2016, 17, 3132–3141. [Google Scholar] [CrossRef]
- Beaulieu, N.C.; Abu-Dayya, A.A.; McLane, P.J. Estimating the Distribution of a Sum of Independent Lognormal Random Variables. IEEE Trans. Commun. 1995, 43, 2869–2873. [Google Scholar] [CrossRef]
- Fang, Z.; Zong, X.; Li, Q.; Li, Q.; Xiong, S. Hierarchical multi-objective evacuation routing in stadium using ant colony optimization approach. J. Transp. Geogr. 2011, 19, 443–451. [Google Scholar] [CrossRef]
- Tarantilis, C.D.; Zachariadis, E.E.; Kiranoudis, C.T. A guided tabu search for the heterogeneous vehicle routeing problem. J. Oper. Res. Soc. 2007, 59, 1659–1673. [Google Scholar] [CrossRef]
- Niu, Y.; Yang, Z.; Chen, P.; Xiao, J. Optimizing the green open vehicle routing problem with time windows by minimizing comprehensive routing cost. J. Clean. Prod. 2018, 171, 962–971. [Google Scholar] [CrossRef]
- Cruz, J.J.; Paternina-Arboleda, C.D.; Cantillo, V.; Montoya-Torres, J.R. A two-pheromone trail ant colony system-tabu search approach for the heterogeneous vehicle routing problem with time windows and multiple products. J. Heurist. 2013, 19, 233–252. [Google Scholar] [CrossRef]
- Rakha, H.; El-Shawarby, I.; Arafeh, M.; Dion, F. Estimating Path Travel-Time Reliability. In Proceedings of the Intelligent Transportation Systems Conference, Toronto, ON, Canada, 9 October 2006. [Google Scholar]
- Liu, Z.; Almhana, J.; McGorman, R. Approximating lognormal sum distributions with power lognormal distributions. IEEE Trans. Veh. Technol. 2008, 57, 2611–2617. [Google Scholar] [CrossRef]
- Fang, Z.; Li, Q.; Li, Q.; Han, L.D.; Shaw, S.-L. A space–time efficiency model for optimizing intra-intersection vehicle–pedestrian evacuation movements. Transp. Res. Part C Emerg. Technol. 2013, 31, 112–130. [Google Scholar] [CrossRef]
- Dorigo, M.; Gambardella, L.M. Ant Colonies for the Traveling Salesman Problem. BioSystems 1997, 43, 73–81. [Google Scholar] [CrossRef]
- Glover, F. Heuristics for integer programming using surrogate constraints. Decis. Sci. 1977, 8, 156–166. [Google Scholar] [CrossRef]
- Fang, Z.; Tu, W.; Li, Q.; Shaw, S.-L.; Chen, S.; Chen, B.Y. A voronoi neighborhood-based search heuristic for distance/capacity constrained very large vehicle routing problems. Int. J. Geogr. Inf. Sci. 2013, 27, 741–764. [Google Scholar] [CrossRef]
- Liu, L.; Liu, Y.; Wang, X.; Yu, D.; Liu, K.; Huang, H. Developing an effective 2-d urban flood inundation model for city emergency management based on cellular automata. Nat. Hazards Earth Syst. Sci. 2015, 2, 6173–6199. [Google Scholar] [CrossRef]
- Chen, P.; Zhang, J.; Zhang, L.; Sun, Y. Evaluation of Resident Evacuations in Urban Rainstorm Flooding Disasters Based on Scenario Simulation: Daoli District (Harbin, China) as an Example. Int. J. Environ. Res. Public Health 2014, 11, 9964–9980. [Google Scholar] [PubMed]
- Annual White Paper on Waters in Guangzhou in 2013. Available online: http://www.gzwater.gov.cn/portal/site/site/portal/gzswj/swyw_xx.portal?contentId=BVI71SJFN2GA2B5WYMSRYY8489K7RDGX&categoryId=DU2PVT4O72W2GHC0U0Y54QMYDYOPS8DO (accessed on 22 January 2018).
- Kamga, C.; Yazıcı, M.A. Temporal and weather related variation patterns of urban travel time: Considerations and caveats for value of travel time, value of variability, and mode choice studies. Transp. Res. Part C Emerg. Technol. 2014, 45, 4–16. [Google Scholar] [CrossRef]
Figure 1.
Example of bi-level rescue network.

Figure 2.
Example of α-reliable rescue routes from warehouse to affected areas.

Figure 3.
Overview of the hybrid optimization algorithm.

Figure 4.
Neighborhood operators.

Figure 5.
Experimental area, including the locations of 10 flooded areas and the equipment warehouse.
Figure 5.
Experimental area, including the locations of 10 flooded areas and the equipment warehouse.

Figure 6.
Distribution of road travel times.

Figure 7.
Objective value of R in the optimization process using the ACO-TS.

Figure 8.
Rescue routing plans of problems S1, S2, and S3. (a) The rescue routing plans of S1; (b) The rescue routing plans of S2; (c) The rescue routing plans of S3.
Figure 8.
Rescue routing plans of problems S1, S2, and S3. (a) The rescue routing plans of S1; (b) The rescue routing plans of S2; (c) The rescue routing plans of S3.


Figure 9.
Cumulative probability density curves of the open routes of S1 and S2. (a) Open route 0; (b) Open route 1; (c) Open route 2.
Figure 9.
Cumulative probability density curves of the open routes of S1 and S2. (a) Open route 0; (b) Open route 1; (c) Open route 2.

Figure 10.
Cumulative probability density curves of the open routes of S2 and S3. (a) Open route 0; (b) Open route 1; (c) Open route 2.
Figure 10.
Cumulative probability density curves of the open routes of S2 and S3. (a) Open route 0; (b) Open route 1; (c) Open route 2.


Table 1.
List of mathematical annotations used in the proposed model.
| Notation | Explanation | Notation | Explanation |
|---|---|---|---|
| R | objective function | travel time budget of rescue vehicle k from VRP node o to d under reliable arrival probability α | |
| F1 | sum of travel time budgets of all rescue vehicles | w1, w2 | weights of F1 and F2 |
| F2 | maximum travel time budget of an individual rescue vehicle | xrsk | decision variables; 1 indicates that vehicle k travels from VRP node r to s (0 otherwise) |
| F = {0, 1, 2,…, n} | set of numbered affected areas (VRP nodes); 0 denotes the warehouse | yrk | decision variables; 1 indicates that vehicle k visits VRP node r (0 otherwise) |
| P = {1, 2,…, m} | set of rescue vehicles | Ck | loading capacity of a rescue vehicle |
Table 2.
Definitions of the three problems.
| Problems | Network Conditions | Optimization Objectives | |||
|---|---|---|---|---|---|
| DN | SN | ATT | TTB | Max-TTB | |
| S1 | Y | N | Y | N | N |
| S2 | N | Y | N | Y | N |
| S3 | N | Y | N | Y | Y |
Table 3.
Average travel times between the warehouse and flooded areas (minute).
| ID | 0 | 1 | 2 | 3 | 4 | 5 | 6 | 7 | 8 | 9 | 10 |
|---|---|---|---|---|---|---|---|---|---|---|---|
| 0 | 0.00 | 3.54 | 8.19 | 19.44 | 30.70 | 21.65 | 8.23 | 51.41 | 18.17 | 13.12 | 16.33 |
| 1 | 3.95 | 0.00 | 8.40 | 15.90 | 27.16 | 18.10 | 4.69 | 47.87 | 14.62 | 12.62 | 12.79 |
| 2 | 8.18 | 7.99 | 0.00 | 16.99 | 23.39 | 14.34 | 5.54 | 44.10 | 10.86 | 6.64 | 15.00 |
| 3 | 20.02 | 16.07 | 17.25 | 0.00 | 21.33 | 14.25 | 12.57 | 42.03 | 8.79 | 19.25 | 3.11 |
| 4 | 32.30 | 28.35 | 24.80 | 22.00 | 0.00 | 13.31 | 23.48 | 31.18 | 13.93 | 25.82 | 21.58 |
| 5 | 21.83 | 17.88 | 14.33 | 13.14 | 13.08 | 0.00 | 13.01 | 35.66 | 5.06 | 15.35 | 12.72 |
| 6 | 8.82 | 4.87 | 5.93 | 13.05 | 22.47 | 13.42 | 0.00 | 43.18 | 9.94 | 7.93 | 9.46 |
| 7 | 42.33 | 38.37 | 34.83 | 32.03 | 17.84 | 25.62 | 33.51 | 0.00 | 23.95 | 35.84 | 31.61 |
| 8 | 18.39 | 14.44 | 10.89 | 8.08 | 12.54 | 5.46 | 9.57 | 33.24 | 0.00 | 12.89 | 7.66 |
| 9 | 11.86 | 11.68 | 8.20 | 18.33 | 23.90 | 14.07 | 6.88 | 44.61 | 12.20 | 0.00 | 16.34 |
| 10 | 16.92 | 12.97 | 15.40 | 3.58 | 21.38 | 14.31 | 9.46 | 42.09 | 8.85 | 17.40 | 0.00 |
Table 4.
Travel time budgets between the warehouse and flooded areas with on-time probability α = 0.9 (min).
Table 4.
Travel time budgets between the warehouse and flooded areas with on-time probability α = 0.9 (min).
| ID | 0 | 1 | 2 | 3 | 4 | 5 | 6 | 7 | 8 | 9 | 10 |
|---|---|---|---|---|---|---|---|---|---|---|---|
| 0 | 0.00 | 6.19 | 15.15 | 25.51 | 39.12 | 28.58 | 12.49 | 62.18 | 24.77 | 17.96 | 22.15 |
| 1 | 6.65 | 0.00 | 12.30 | 21.06 | 34.86 | 24.21 | 7.73 | 58.00 | 20.39 | 17.67 | 17.66 |
| 2 | 15.12 | 11.99 | 0.00 | 19.31 | 27.28 | 16.29 | 5.49 | 50.63 | 12.41 | 9.10 | 17.45 |
| 3 | 26.46 | 21.61 | 19.67 | 0.00 | 27.59 | 19.08 | 17.39 | 50.99 | 12.61 | 24.96 | 5.19 |
| 4 | 40.91 | 36.22 | 28.93 | 28.72 | 0.00 | 18.10 | 30.51 | 38.95 | 19.38 | 32.97 | 28.26 |
| 5 | 28.50 | 23.70 | 16.07 | 17.73 | 17.81 | 0.00 | 17.76 | 43.62 | 7.53 | 20.19 | 17.26 |
| 6 | 13.09 | 7.90 | 6.02 | 17.85 | 29.32 | 18.45 | 0.00 | 52.59 | 14.59 | 11.70 | 13.50 |
| 7 | 52.12 | 47.49 | 40.38 | 40.24 | 22.19 | 32.65 | 41.91 | 0.00 | 31.05 | 44.39 | 39.78 |
| 8 | 24.88 | 20.07 | 12.40 | 11.78 | 17.19 | 8.10 | 14.11 | 40.94 | 0.00 | 17.78 | 11.30 |
| 9 | 16.12 | 16.09 | 8.66 | 23.89 | 30.63 | 18.82 | 10.49 | 54.01 | 17.07 | 0.00 | 22.03 |
| 10 | 22.83 | 17.92 | 18.01 | 5.81 | 27.69 | 19.18 | 13.62 | 51.09 | 12.71 | 23.30 | 0.00 |
Table 5.
Parameters used in the proposed algorithms.
| Parameter | S1 | S2 | S3 |
|---|---|---|---|
| Iant | 100 | 50 | 50 |
| Itabu | 100 | 50 | 50 |
| Nant | 50 | 50 | 50 |
| δ | 1 | 1 | 1 |
| Β | 1 | 1 | 0.8 |
| Ρ | 0.9 | 0.9 | 0.9 |
| Q | 15 | 15 | 10 |
| L | 5 | 5 | 5 |
| w1 | — | 1 | 1 |
| w2 | — | 0 | 1 |
Table 6.
Rescue route performances of the ACO-TS and the ArcGIS VRP tool.
| Open Route No. | ACO-TS | ArcGIS VRP Tool | ||
|---|---|---|---|---|
| Open Routes | Length (km) | Open Routes | Length (km) | |
| 0 | 0-1-10-3 | 12.31 | 0-1-6-10-3 | 15.02 |
| 1 | 0-9-2-6 | 12.15 | 0-2-9 | 10.52 |
| 2 | 0-8-5-4-7 | 28.16 | 0-8-5-4-7 | 28.16 |
| Sum | —— | 52.62 | —— | 53.70 |
Table 7.
Rescue routing plan performance for S1, S2, and S3.
| Problem | Open Route No. | Open Routes | Length (km) | ATT (min) | TTB (α = 0.9) | μ (min/km) | σ |
|---|---|---|---|---|---|---|---|
| S1 | 0 | 0→8→5→4→7 | 31.57 | 64.84 | 86.58 | 4.19 | 0.212 |
| 1 | 0→1→2→9 | 10.68 | 18.58 | 24.72 | 2.96 | 0.191 | |
| 2 | 0→6→10→3 | 13.15 | 19.56 | 26.06 | 3.18 | 0.193 | |
| Sum | —— | 55.40 | 102.98 | 137.36 | —— | —— | |
| S2 | 0 | 0→8→5→4→7 | 29.03 | 67.33 | 71.28 | 4.22 | 0.033 |
| 1 | 0→6→2→9 | 11.49 | 17.76 | 21.80 | 2.93 | 0.120 | |
| 2 | 0→1→10→3 | 12.71 | 19.91 | 23.99 | 3.05 | 0.102 | |
| Sum | —— | 53.23 | 105.00 | 117.07 | —— | —— | |
| S3 | 0 | 0→2→9→5→4 | 23.71 | 44.08 | 49.27 | 3.83 | 0.050 |
| 1 | 0→6→8→7 | 24.26 | 51.40 | 56.41 | 3.98 | 0.039 | |
| 2 | 0→1→10→3 | 12.71 | 19.91 | 23.99 | 3.05 | 0.102 | |
| Sum | —— | 60.68 | 115.39 | 129.67 | —— | —— |
© 2018 by the authors. Licensee MDPI, Basel, Switzerland. This article is an open access article distributed under the terms and conditions of the Creative Commons Attribution (CC BY) license (http://creativecommons.org/licenses/by/4.0/).
Share and Cite
MDPI and ACS Style
Li, Q.; Tu, W.; Zhuo, L. Reliable Rescue Routing Optimization for Urban Emergency Logistics under Travel Time Uncertainty. ISPRS Int. J. Geo-Inf. 2018, 7, 77. https://doi.org/10.3390/ijgi7020077
AMA Style
Li Q, Tu W, Zhuo L. Reliable Rescue Routing Optimization for Urban Emergency Logistics under Travel Time Uncertainty. ISPRS International Journal of Geo-Information. 2018; 7(2):77. https://doi.org/10.3390/ijgi7020077
Chicago/Turabian StyleLi, Qiuping, Wei Tu, and Li Zhuo. 2018. "Reliable Rescue Routing Optimization for Urban Emergency Logistics under Travel Time Uncertainty" ISPRS International Journal of Geo-Information 7, no. 2: 77. https://doi.org/10.3390/ijgi7020077
Note that from the first issue of 2016, this journal uses article numbers instead of page numbers. See further details here.