Meteorological Differences Characterizing Tornado Outbreak Forecasts of Varying Quality

1
Department of Geosciences, Mississippi State University, 200B Hilbun Hall Mississippi State, MS 39762, USA
2
Cooperative Institute for Mesoscale Meteorological Studies, Norman, OK 73072, USA
*
Author to whom correspondence should be addressed.
Atmosphere 2019, 10(1), 16; https://doi.org/10.3390/atmos10010016
Submission received: 12 December 2018
/
Revised: 28 December 2018
/
Accepted: 4 January 2019
/
Published: 7 January 2019
(This article belongs to the Section Meteorology)
Abstract
:Tornado outbreaks (TOs) are a major hazard to life and property for locations east of the Rocky Mountains. Improving tornado outbreak (TO) forecasts will help minimize risks associated with these major events. In this study, we present a methodology for quantifying TO forecasts of varying quality, based on Storm Prediction Center convective outlook forecasts, and provide synoptic and mesoscale composite analyses to identify important features characterizing these events. Synoptic-scale composites from the North American Regional Reanalysis (NARR) are presented for TO forecasts at three forecast quality levels, H-class (high quality), M-class (medium quality), and L-class (low quality), as well as false alarm TO forecasts. H-class and false alarm TO forecasts share many meteorological similarities, particularly in the synoptic-scale, though false alarm events show less well-defined low-level synoptic-scale features. M- and L-class TOs present environments dominated by mesoscale thermodynamic processes (particularly dryline structures), contrasting H-class TOs which are clearly synoptically driven. Simulations of these composites reveal higher instability in M- and L-class TOs that lack key kinematic structures that characterize H-class TOs. The results presented offer important forecast feedback that can help inform future TO predictions and ultimately produce improved TO forecast quality.
1. Introduction
Major tornado outbreaks (TOs) have received considerable attention recently owing to several noteworthy events. The major TO of 27 April 2011 [1,2] ranked second in recorded history of outbreak intensity (based on an outbreak ranking index [3]). Other notable TO events have included the Joplin outbreak on 22 May 2011, the Super Tuesday outbreak in February 2008, and the May 2013 outbreaks in Oklahoma. These high-impact events have tremendous human impact, and it is imperative that forecast skill for TOs continues to improve.
Most post-event analyses (case studies) of major TO forecasts have centered around single events with poor numerical model forecasts or unexpected mesoscale or smaller-scale processes dominating the outbreak’s development [4]. Such analyses have tremendous benefit for diagnosing favorable TO synoptic-scale setups for specific events, but their results typically do not generalize to a broader understanding of forecast tendencies, given the wide variability in numerical model forecast quality. Such understanding is imperative if TO forecasts are to continue to improve. We address this deficiency by quantifying and contrasting synoptic-scale outbreak environments associated with TO forecasts with varying degrees of success.
The ambiguity in what defines a TO [3,5,6,7,8] has resulted in a paucity of formal TO forecasts issued by the National Oceanic and Atmospheric Administration’s (NOAA) Storm Prediction Center (SPC), the primary forecasting entity for major convective outbreaks. Additionally, the variety of underlying meteorological conditions characterizing TOs has led to a wide distribution of SPC forecast skill [9]. For example, numerical model inconsistency led to lower forecast skill in the major 3 May 1999 outbreak [4,10], despite the event’s classic synoptic-scale appearance. A large cirrus shield east of the surface dryline delayed the identification of the major tornado threat until the early afternoon of 3 May; SPC upgraded their outlook to the highest risk level 2 h before the first significant (>F2) tornado [4,10]. This would have been considered an event with low forecast accuracy based on the morning prognosis. Conversely, the outbreak of 5 February 2008 was synoptically apparent a week prior to its occurrence and was well forecast by SPC [11].
Recent work in [12] and [13] has revealed the importance of the synoptic-scale environment in identifying TO potential. Using the TO definition in [8] (6 or more tornadoes associated with a single synoptic-scale system), [13] found notable synoptic-scale differences between TOs and primarily non-tornadic outbreaks. These differences primarily centered around the depth and tilt of the upper-level geopotential height trough, the magnitude of quasigeostrophic forcing parameters (namely thermal advection and differential vorticity advection) and the shear profiles. They noted minimal thermodynamic importance in identifying TO environments.
Given the inherent predictability in the synoptic-scale wind pattern, interesting questions regarding outbreak predictability arise based on the results of [13]. First, is it possible to identify synoptic-scale features associated with missed TO forecasts that could help improve future forecast skill? Second, what are the commonalities at smaller scales among TO events that are not well forecast? This study seeks to answer these questions using synoptic-scale composite analysis following the methodology of [13].
Many previous studies have noted the utility of composite analysis in identifying atmospheric patterns associated with notable meteorological event types, including severe weather. Initial TO composite research utilized average composites [14,15], as did more recent, regional outbreak studies [16,17,18,19]. Simple averaging, however, has several limitations, most notably dampening relevant meridional wave structures in the upper-level flow, resulting in non-representative zonal wind fields in the composite. This issue was first addressed in [20], who used empirical orthogonal functions to reveal unique variability structures within a select sample TO events, yielding distinct synoptic-scale map types. More recently, rotated principal component analysis (RPCA) was utilized in tornadic and nontornadic composite research [13]. Additional work by [21] employed kernel PCA (which is an extension of RPCA using a kernel-based similarity matrix) to isolate relevant TO and non-tornadic outbreak synoptic-scale structures and offer improved representativeness to the composites. Despite these advances, no work has developed composite map types based on TO forecast quality, which would inform forecasters of important biases and limitations in TO forecasts.
The objectives of this study are two-fold. First, we present a methodology for isolating TO forecasts with varying degrees of success and derive synoptic-scale composite maps for each, which will reveal important structural differences in the events. Second, we utilize the Weather Research and Forecasting Model (WRF— [22]) to isolate relevant mesoscale features unique to each composite structure, which in turn will help inform forecasters regarding important meteorological fields for TO prediction. Section 2 outlines the datasets selected and the methodology, while Section 3 presents the composite and WRF simulation results. Section 4 summarizes the important outcomes of the study, while Section 5 presents conclusions.
2. Data and Methodology
2.1. Data
Composite map studies require a diverse set of cases from which dominant patterns may be derived. Further, a measure of forecast quality is required to discretize TO events based on forecast success, given this is the primary objective of the study. As the premier operational forecasting entity for United States convective outbreaks is the SPC, we elected to use their convective outlooks to diagnose prediction quality. An event was considered a TO-forecasted event if the SPC issued a 10% or higher categorical risk for tornadoes in their 1300 UTC Day 1 convective outlook. Note that 1300 UTC was selected as it was available more consistently than the 1200 UTC outlook time. General inspection of the outlooks also revealed few differences in forecaster thinking in this one-hour time window. Convective outlook forecast polygons were obtained from convective outlook shapefiles archived by the SPC from 2009 (the earliest available archive time) to 2017. Note that no assumptions were made regarding individual forecaster biases; instead we assumed all SPC convective outlook forecasts were representative of a similar global forecasting philosophy and that any significant biases were minimized by the large sample size. Tornado reports from the SPC storm report database [23] were also used for verification purposes (consistent with [12,13,14,15,16,17,18,19]).
The previously mentioned composite analyses and their WRF simulations require spatially and temporally continuous three-dimensional base-state atmospheric quantities. The North American Regional reanalysis (NARR) data [24] were selected as they provide sufficiently small grid spacing (a 32-km Lambert-conformal grid centered on North America) with 30 vertical levels and 3-hourly observations spanning the full study period. Geopotential height, air temperature, specific humidity (SH), and zonal and meridional wind components were retained at all levels including the surface, as was sea level pressure (SLP). All fields were retained on a 91 × 91 outbreak centered grid (as defined by the SPC convective outlook, described below), yielding a spatially expansive (roughly 3000 km × 3000 km) TO domain for composite analysis.
2.2. Methods
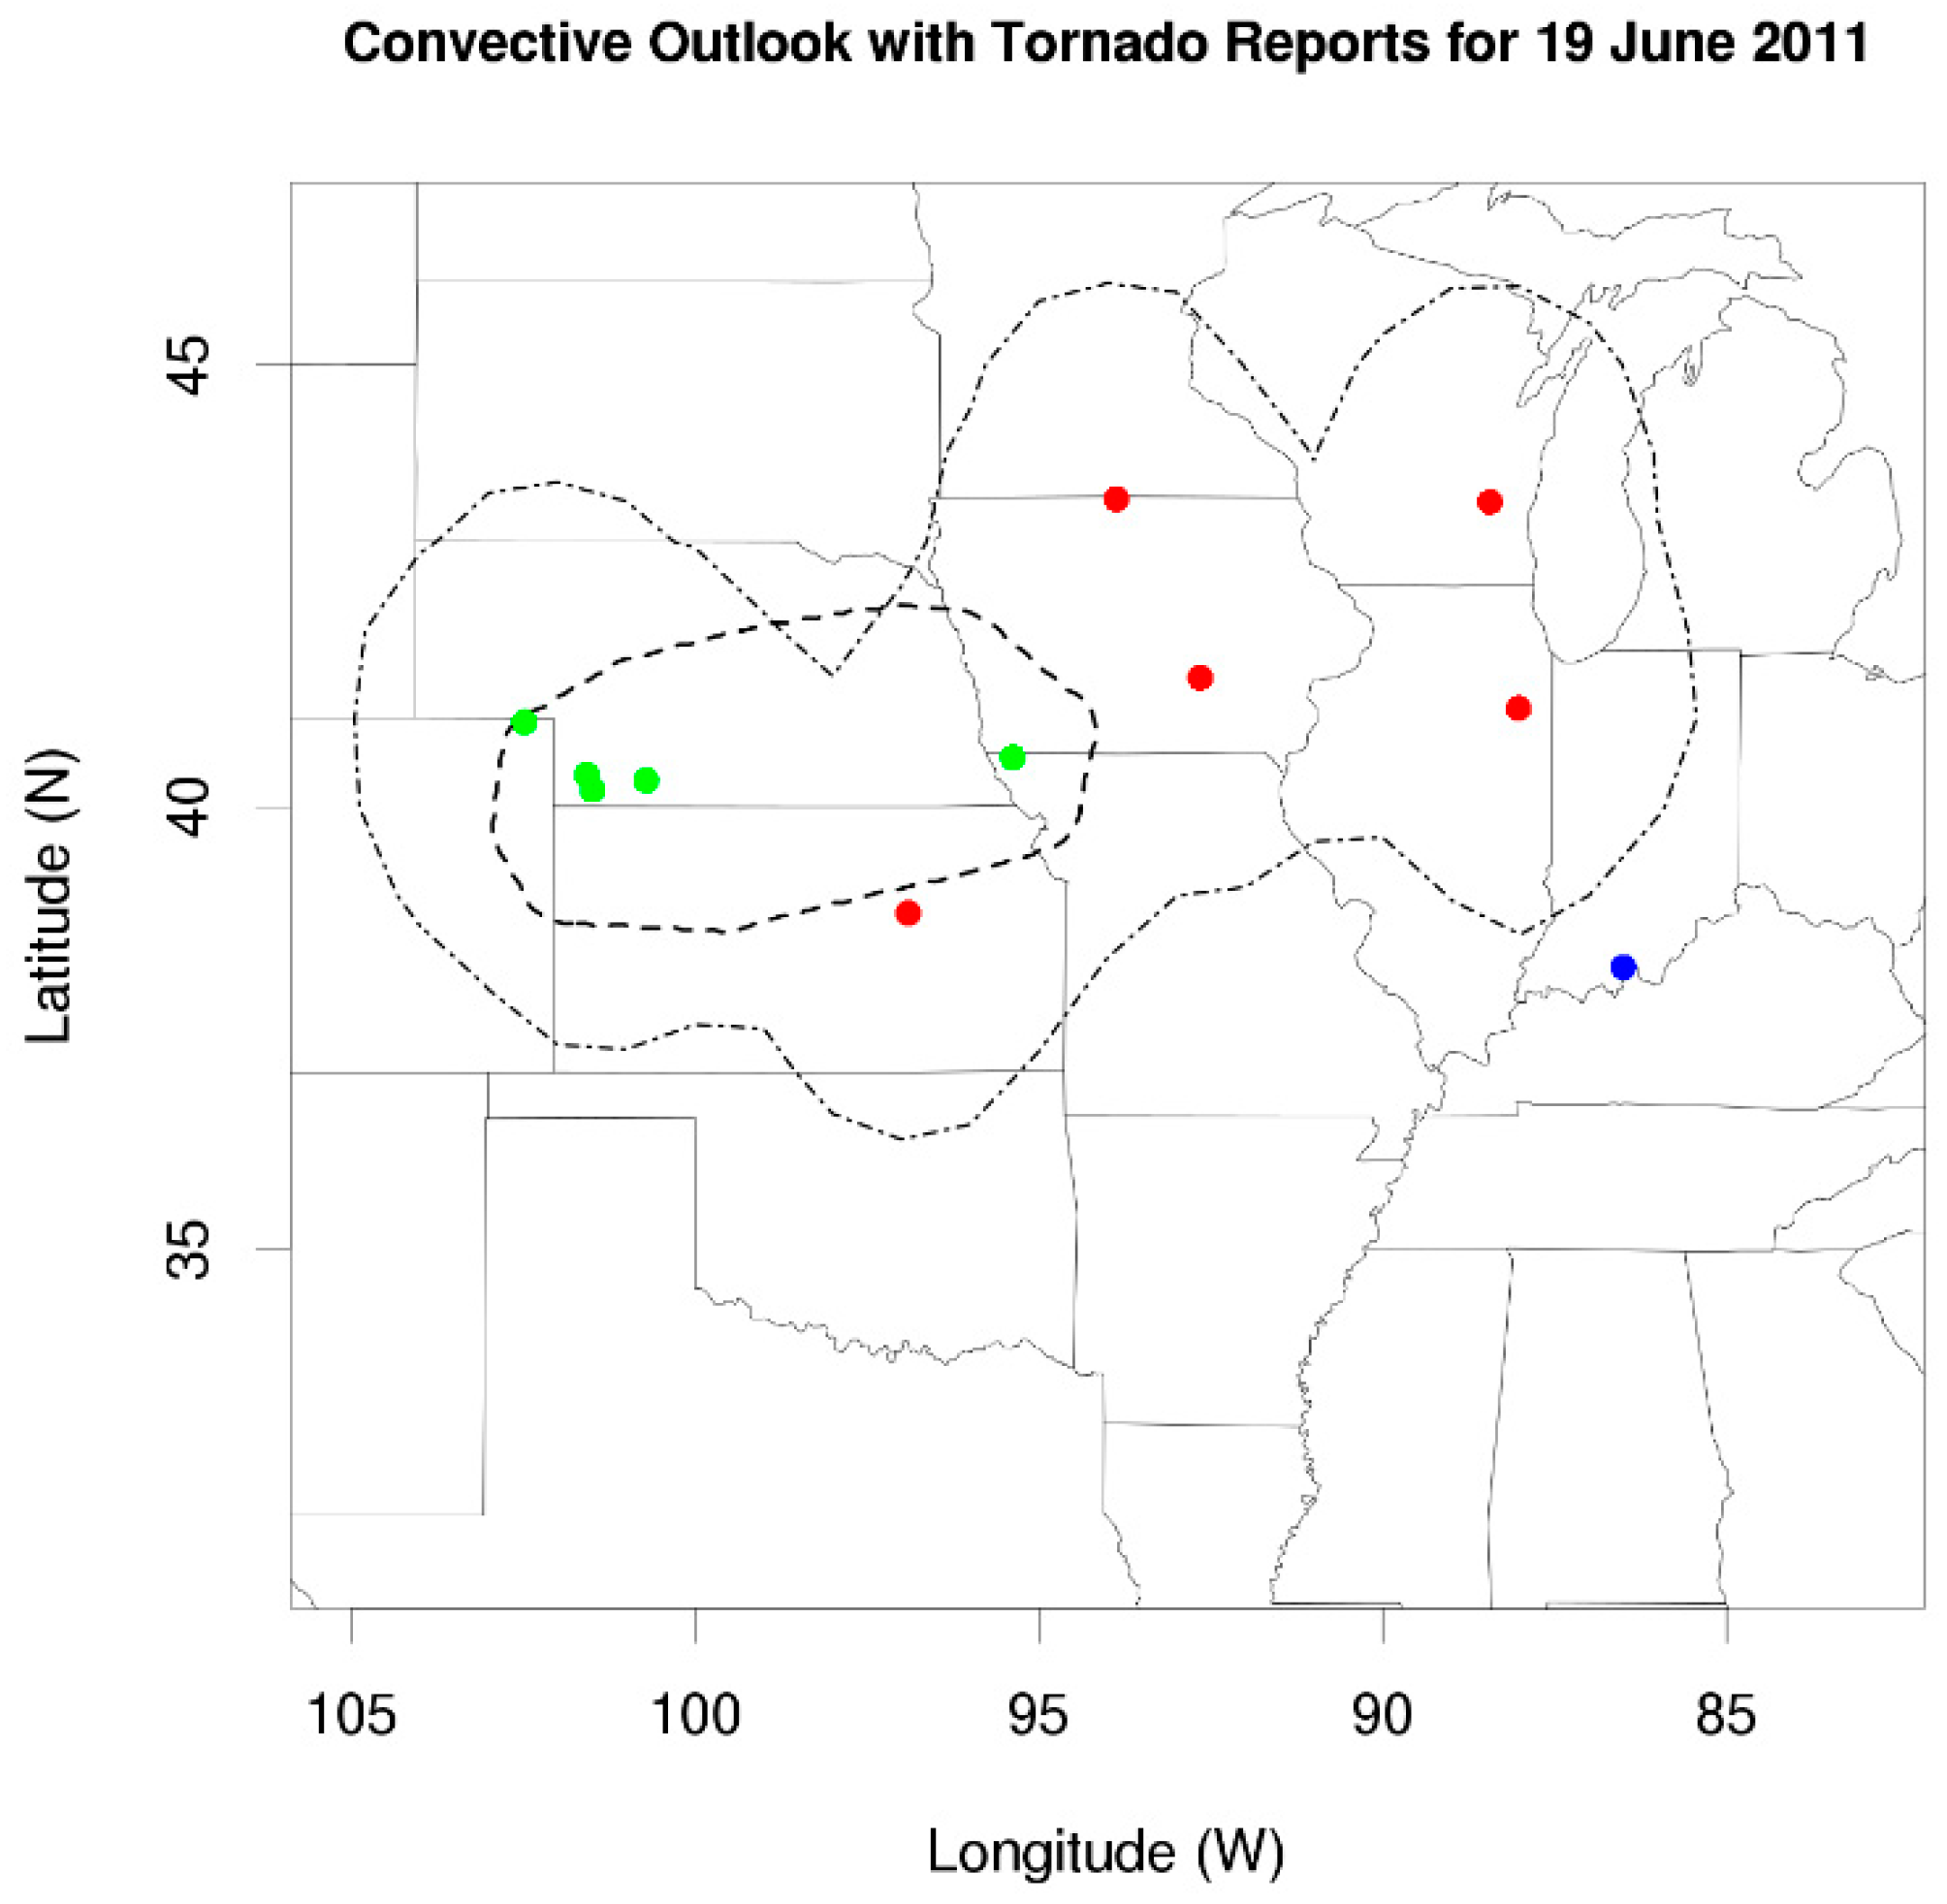
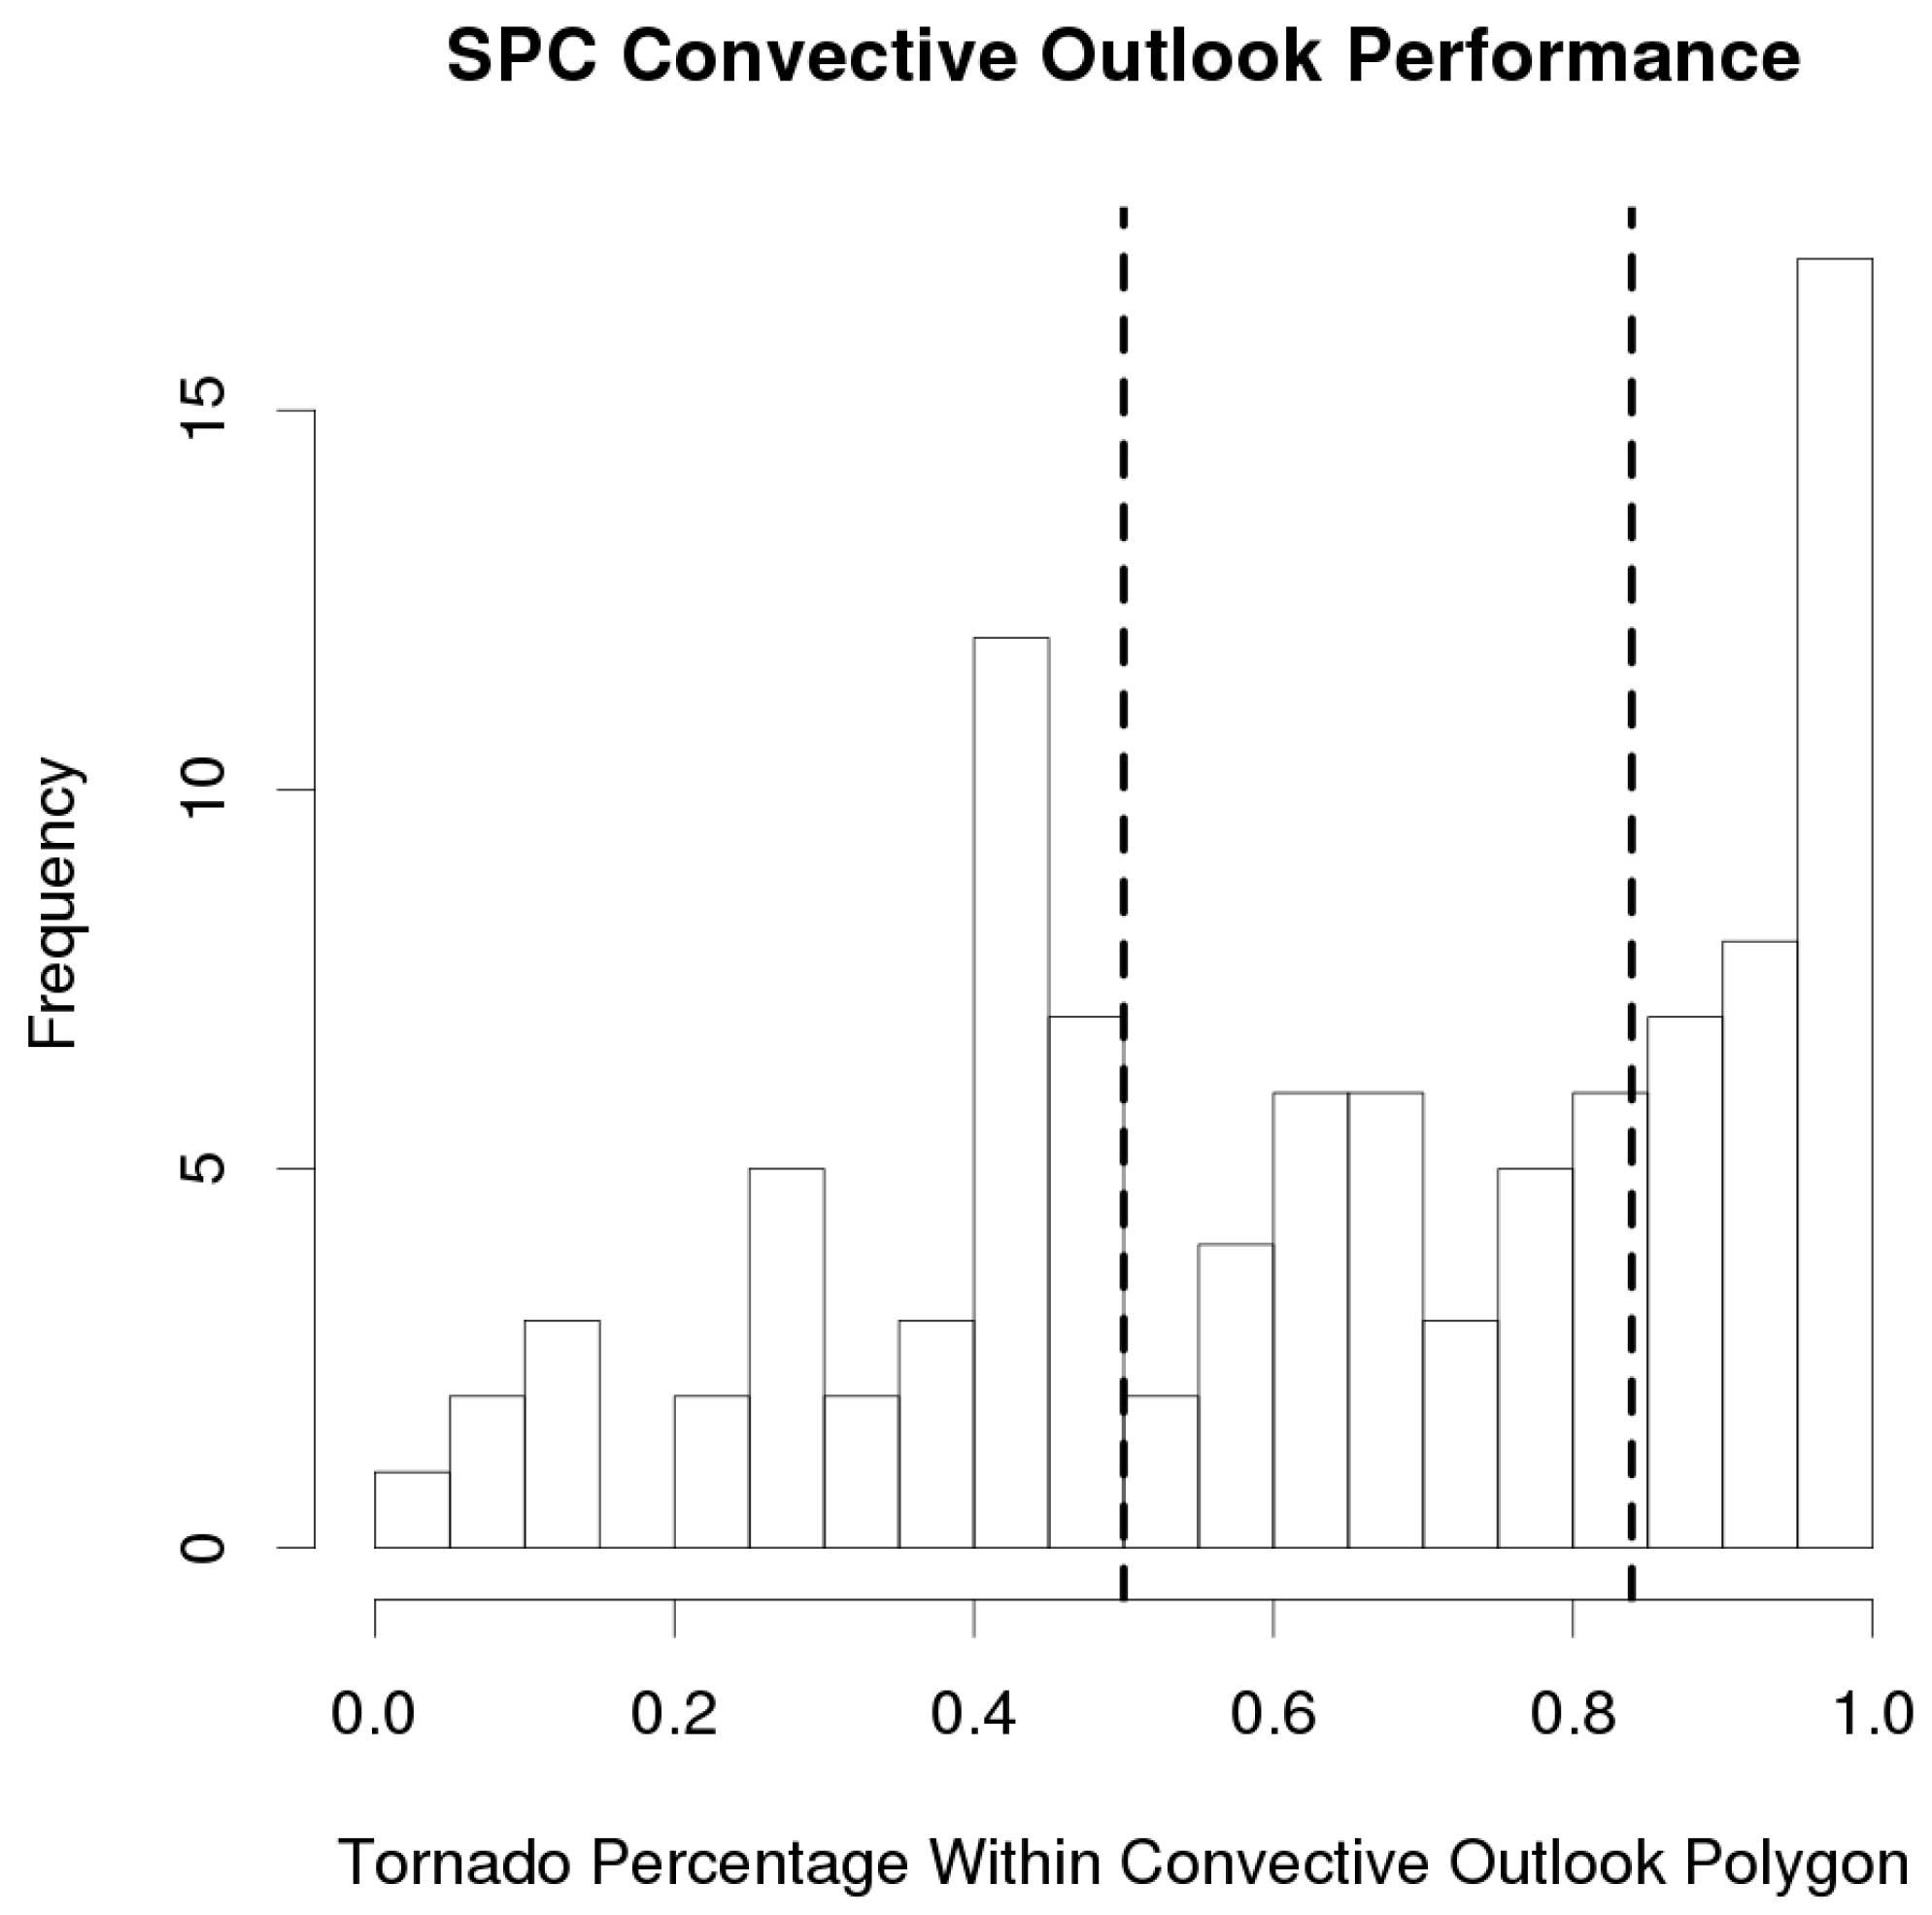
Prior to composite analysis, it was necessary to first obtain a distribution of convective outlook forecast performance to measure predictive success This distribution first required knowledge of which tornado reports were associated with given SPC convective outlook regions. Previous work [3,8,12,13] included a tornado report as part of an outbreak if it occurred between 1200 UTC on the outbreak day and 1159 UTC the subsequent day and was associated with a single synoptic-scale system. A similar time window was selected in this study, though tornadoes occurring between 1200–1259 UTC were excluded (which was only 0.8% of the database) as those events would have occurred prior to the selected 1300 UTC SPC convective outlook time. Given the ambiguity of the definition “associated with a single synoptic-scale system”, it was necessary to determine if a tornado’s spatial proximity was sufficiently close to be included as part of SPC’s convective forecast and thus part of the verification. In [25], kernel density estimation (KDE) was used to identify TO impact regions from SPC tornado reports. Their KDE was done using a Gaussian kernel function with a bandwidth of 1 and a probability density function threshold of 0.001 (which we used as well), providing a buffered outbreak region that revealed tornadoes associated with single synoptic-scale systems (e.g., the dot-dashed polygon in Figure 1). Tornadoes within the KDE-derived outbreak impact polygon that was nearest the SPC convective outlook center were considered part of the SPC forecasted TO (e.g., the green and red dots in Figure 1), while those outside the polygon were assumed separate. The number of tornadoes that fell within the SPC convective outlook region (buffered by 25-miles to align with SPC’s definition of “within 25-miles of a point” [23], were counted as hits. The percentages of tornadoes that were “hits” for each TO were retained as the measure of forecast success (Figure 2). After obtaining this distribution, it was discretized into three terciles of performance, a high-quality forecast (H-class, 82% or higher of hits of the distribution), a medium-quality forecast (M-class, 50–82% hit percentage), and a low-quality forecast (L-class, fewer than 50% of tornadoes were hits). It was also possible to obtain a subset of TOs that were deemed false alarms, as a 10% tornado probability region was issued by the SPC but fewer than 6 tornadoes [8] occurred for the entire event. In total, 34 H-class TOs, 36 M-class TOs, 31 L-class TOs, and 21 false alarm cases were retained for composite analysis.
Once forecast classes were established, a synoptic-scale representation of each class was constructed using compositing methods from [13]. K-means cluster analysis and hierarchical cluster analysis using Euclidean distance and Ward’s minimum variance method [26] were tested as possible methods to group TO events with similar spatial structures in their outbreak-centric NARR domains. As each forecast class contained fewer than 40 events, cluster sizes from 2 up to 8 were tested to ensure sufficiently large sample sizes in each group. NARR fields from the outbreak valid time (defined as the 3-h NARR time window during which the most tornado reports occurred) were used as input into the clustering algorithms, though NARR times spanning 24 h prior to the outbreak valid time and 6 h after the valid time were also retained for each event for WRF modeling purposes (see below). Before the final clustering was established, the silhouette coefficient [27] s was used to measure representativeness of the resulting clustering. The silhouette coefficient compares the average Euclidean distance between a cluster member and all events within the same cluster (called cluster cohesion) with the Euclidean distance between a member and the nearest adjacent cluster (called cluster separation). The most representative clusters minimize cohesion and maximize separation (a perfectly clustered event has s = 1), while negative s values suggest a member may be better represented by the neighboring cluster. Global representativeness was quantified by ranking each cluster analysis method by the number of misclustered (negative s) values and the average silhouette coefficient for all TOs in the cluster analysis. The smallest rank sum of those two measures was deemed the most representative clustering configuration (Table 1). Unlike [13] or [21], when preprocessed using rotated or kernel PCA, representativeness measures did not improve, likely a result of the smaller sample sizes in the forecast classes used herein. All clustered events were then averaged for each individual NARR time to retain a temporally consistent outbreak evolution for each TO composite (needed for the WRF simulations discussed below).
Once TO composites were obtained, mesoscale differences between the outbreak environments were assessed using 30-h WRF simulations. The WRF was configured with a 12-km Lambert-conformal outbreak-centric domain and a 45 s timestep and 45 vertical levels. Average latitude/longitude for the constituent cases for each cluster was used as the composite TO center (Figure 3). Each simulation domain was then extended so that the domain spanned the maximum spread in tornado reports (Figure 4), yielding a 200 × 175 domain.
WRF model parameterizations were selected to maintain consistency with [13]. In particular, the WRF single moment microphysics scheme [21], the Grell-Devenyi convective scheme [28], the Yonsei University planetary boundary layer scheme [29], the rapid radiative transfer longwave radiation model [30], the Dudhia shortwave radiation scheme [31], the MM5 similarity theory surface layer scheme [32], and the 5-layer thermal diffusion land surface model [22] were used. Commonly utilized severe weather diagnostics (e.g., convective available potential energy [CAPE] bulk shear, storm relative environmental helicity [SREH]) and composite indices (supercell composite parameter, significant tornado parameter) were computed from soundings retained from each WRF gridpoint.
3. Results
3.1. General Outbreak Characteristics
Prior to assessing synoptic-scale characteristics of the composites for each forecast class, general forecast performance characteristics were obtained. The average geographic position of the outbreak centers for each forecast class (Figure 3) revealed interesting biases in the TO forecasts. Notably, the H-class (best performing) outbreak forecasts tended to shift farther south and east (green points in Figure 3), with considerably limited H-class coverage over the Plains despite the greater point density in that region. This result is likely a consequence of the underlying characteristics of Southeastern U.S. TOs (they are more synoptically-driven [33,34]) which should increase their predictability. M-class outbreaks were generally centered over Oklahoma, Arkansas, and the Tennessee Valley, while the L-class outbreaks (worst performing) were almost exclusively west of the Mississippi River, with most of these events occurring in the southern and central Plains. False alarm cases showed no general geographic preference, though most were confined west of the Mississippi River as well. Interestingly, the only two New England TO forecasts met false alarm criteria. The geographic spread of all four forecast classes was similar (with a few geographic outliers being noted for the false alarm cases), suggesting these biases are not a consequence of higher spreads in different forecast classes but instead a result of underlying atmospheric or geographic features.
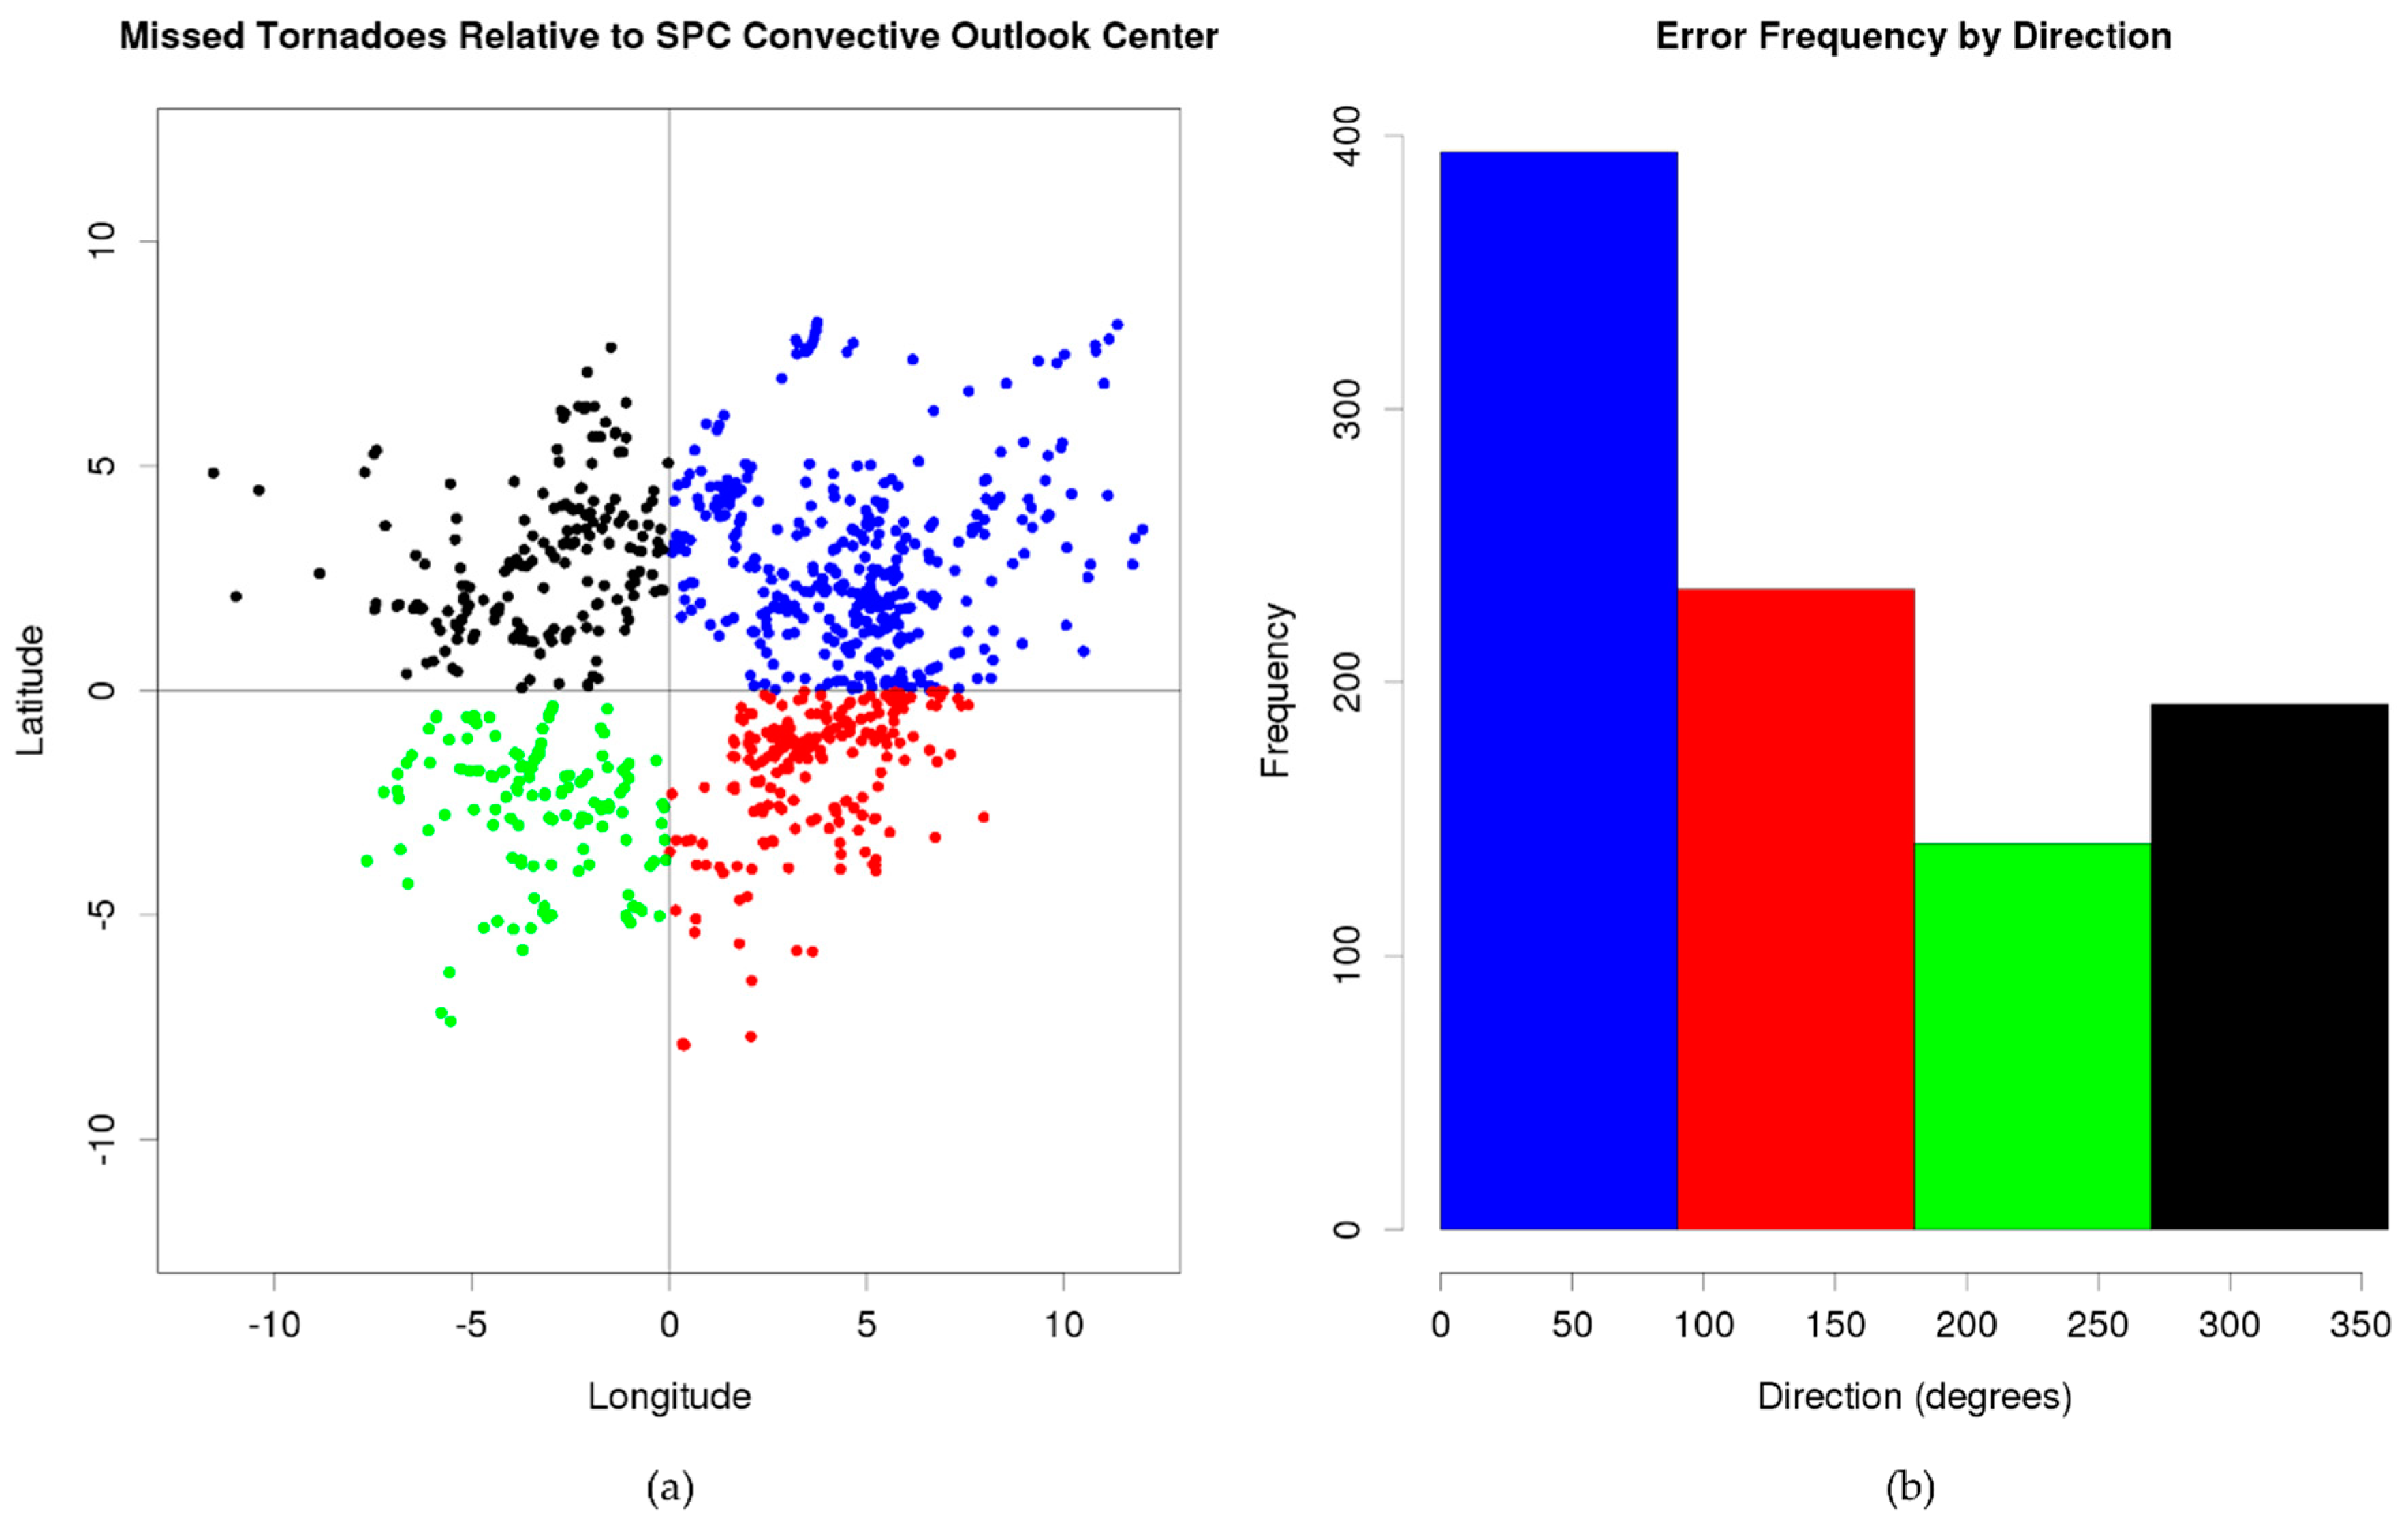
Next, we isolated outbreak-relative geographic tendencies of the TO forecasts (Figure 4). Here, all tornadoes that fell outside of a given SPC convective outlook polygon (misses) were georeferenced with the center of the convective outlook (the origin in Figure 4a) and divided into geographic quadrants. A frequency analysis revealed a strong bias towards missing tornadoes northeast of the given TO’s convective outlook (Figure 4b), which shows timing issues (likely the end of the outbreak) may be responsible for some of the observed forecast errors. Further, these results suggested that mesoscale and synoptic-scale conditions northeast of the SPC convective outlook should be investigated more thoroughly to ascertain the reasons for this forecasting tendency.
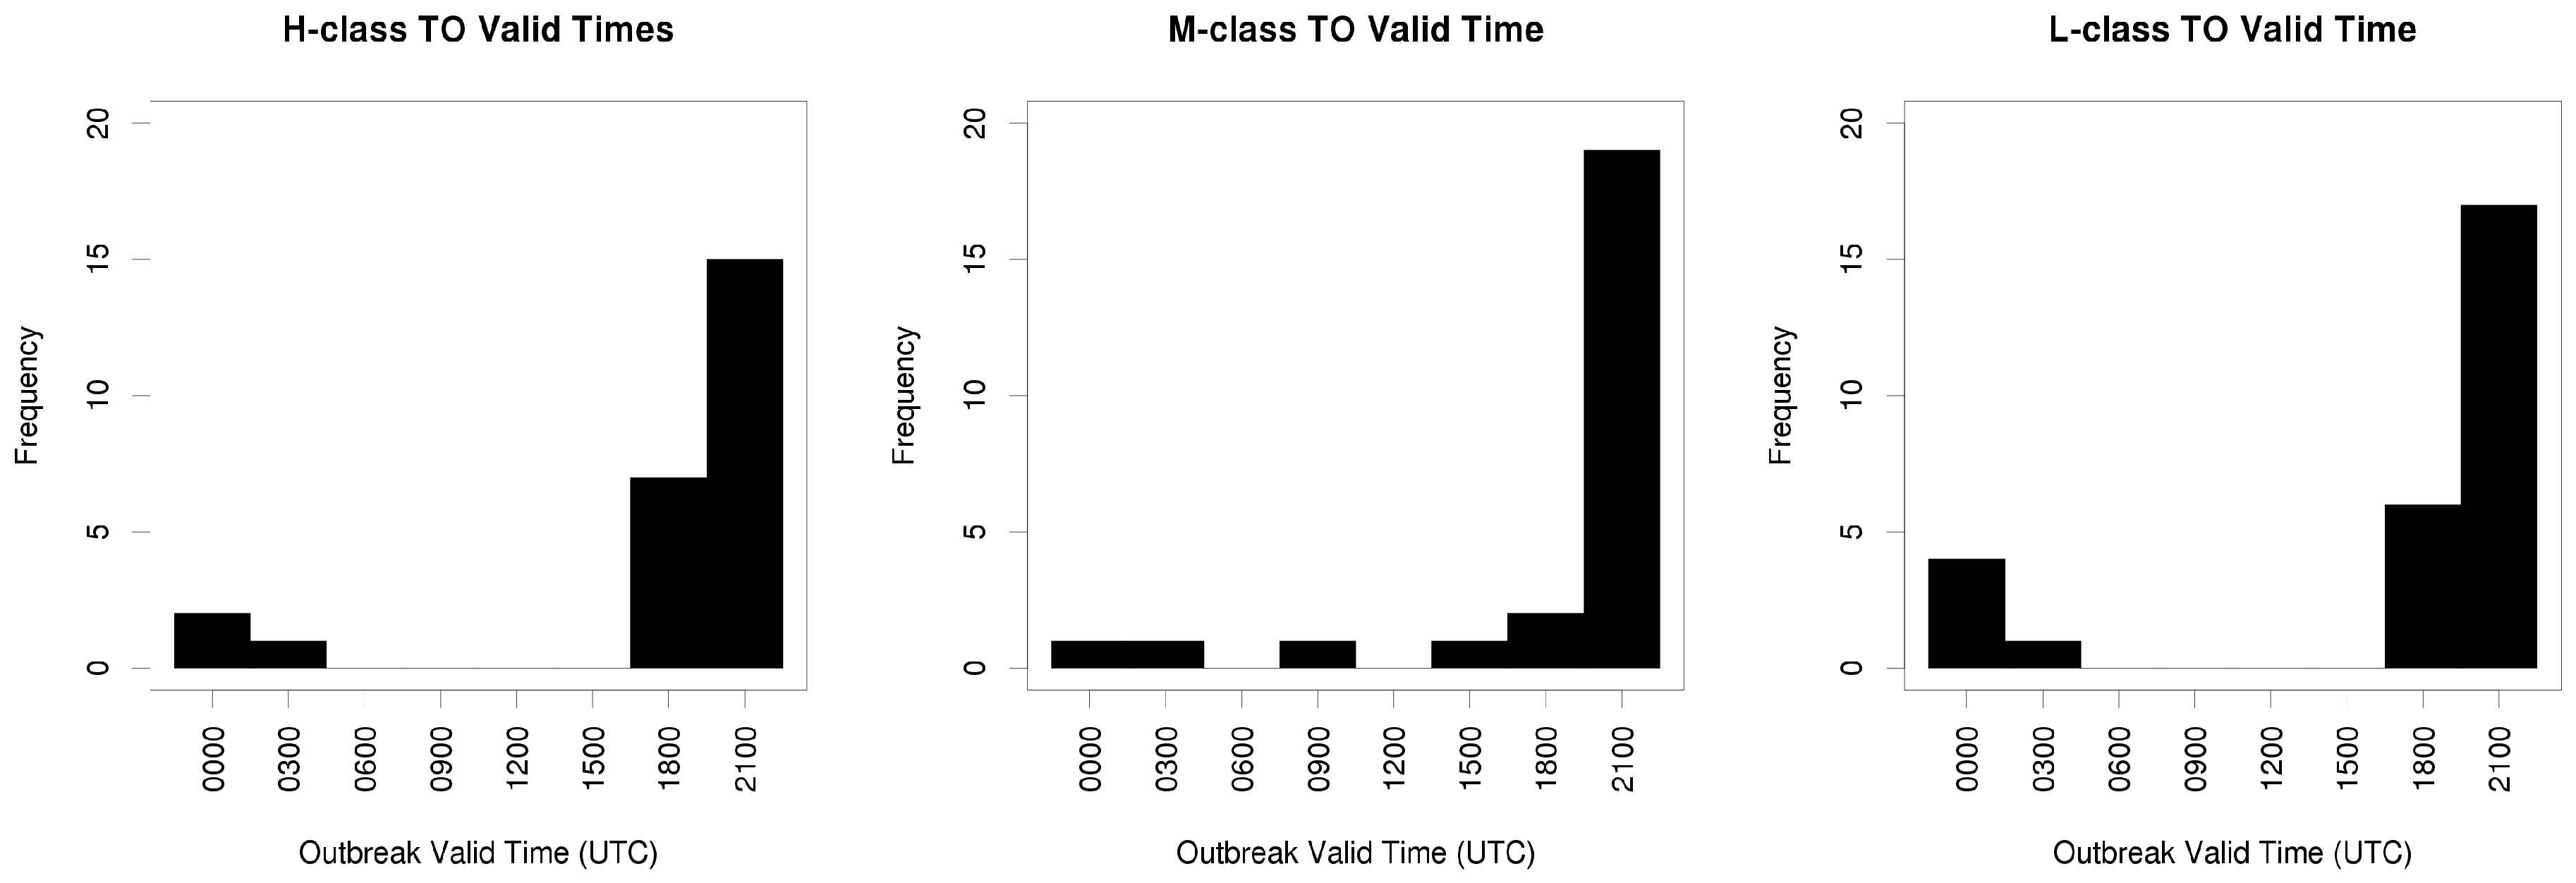
Finally, a brief temporal analysis was done for each of the four forecast groups to assess any biases in TO valid times by forecast class (Figure 5) and any seasonality in the results (Figure 6). The valid time analysis (Figure 5) revealed that the most frequent peak tornado activity time was consistently 2100 UTC for all classes, and 80% of all TO valid times spanned 1800 UTC to 0000 UTC the following day. H-class composites had the greatest number of 1800 UTC valid times and the smallest overall frequency of 2100 UTC times (though 2100 UTC was still the most active time). This temporal shift supports the idea that many H-class TOs were synoptically driven as they had sufficient synoptic-scale vertical forcing to overcome midday convective inhibition in the boundary layer. Late evening or early morning outbreaks were rare regardless of forecast class, though M-class outbreaks had peak activity after local midnight on one occasion.
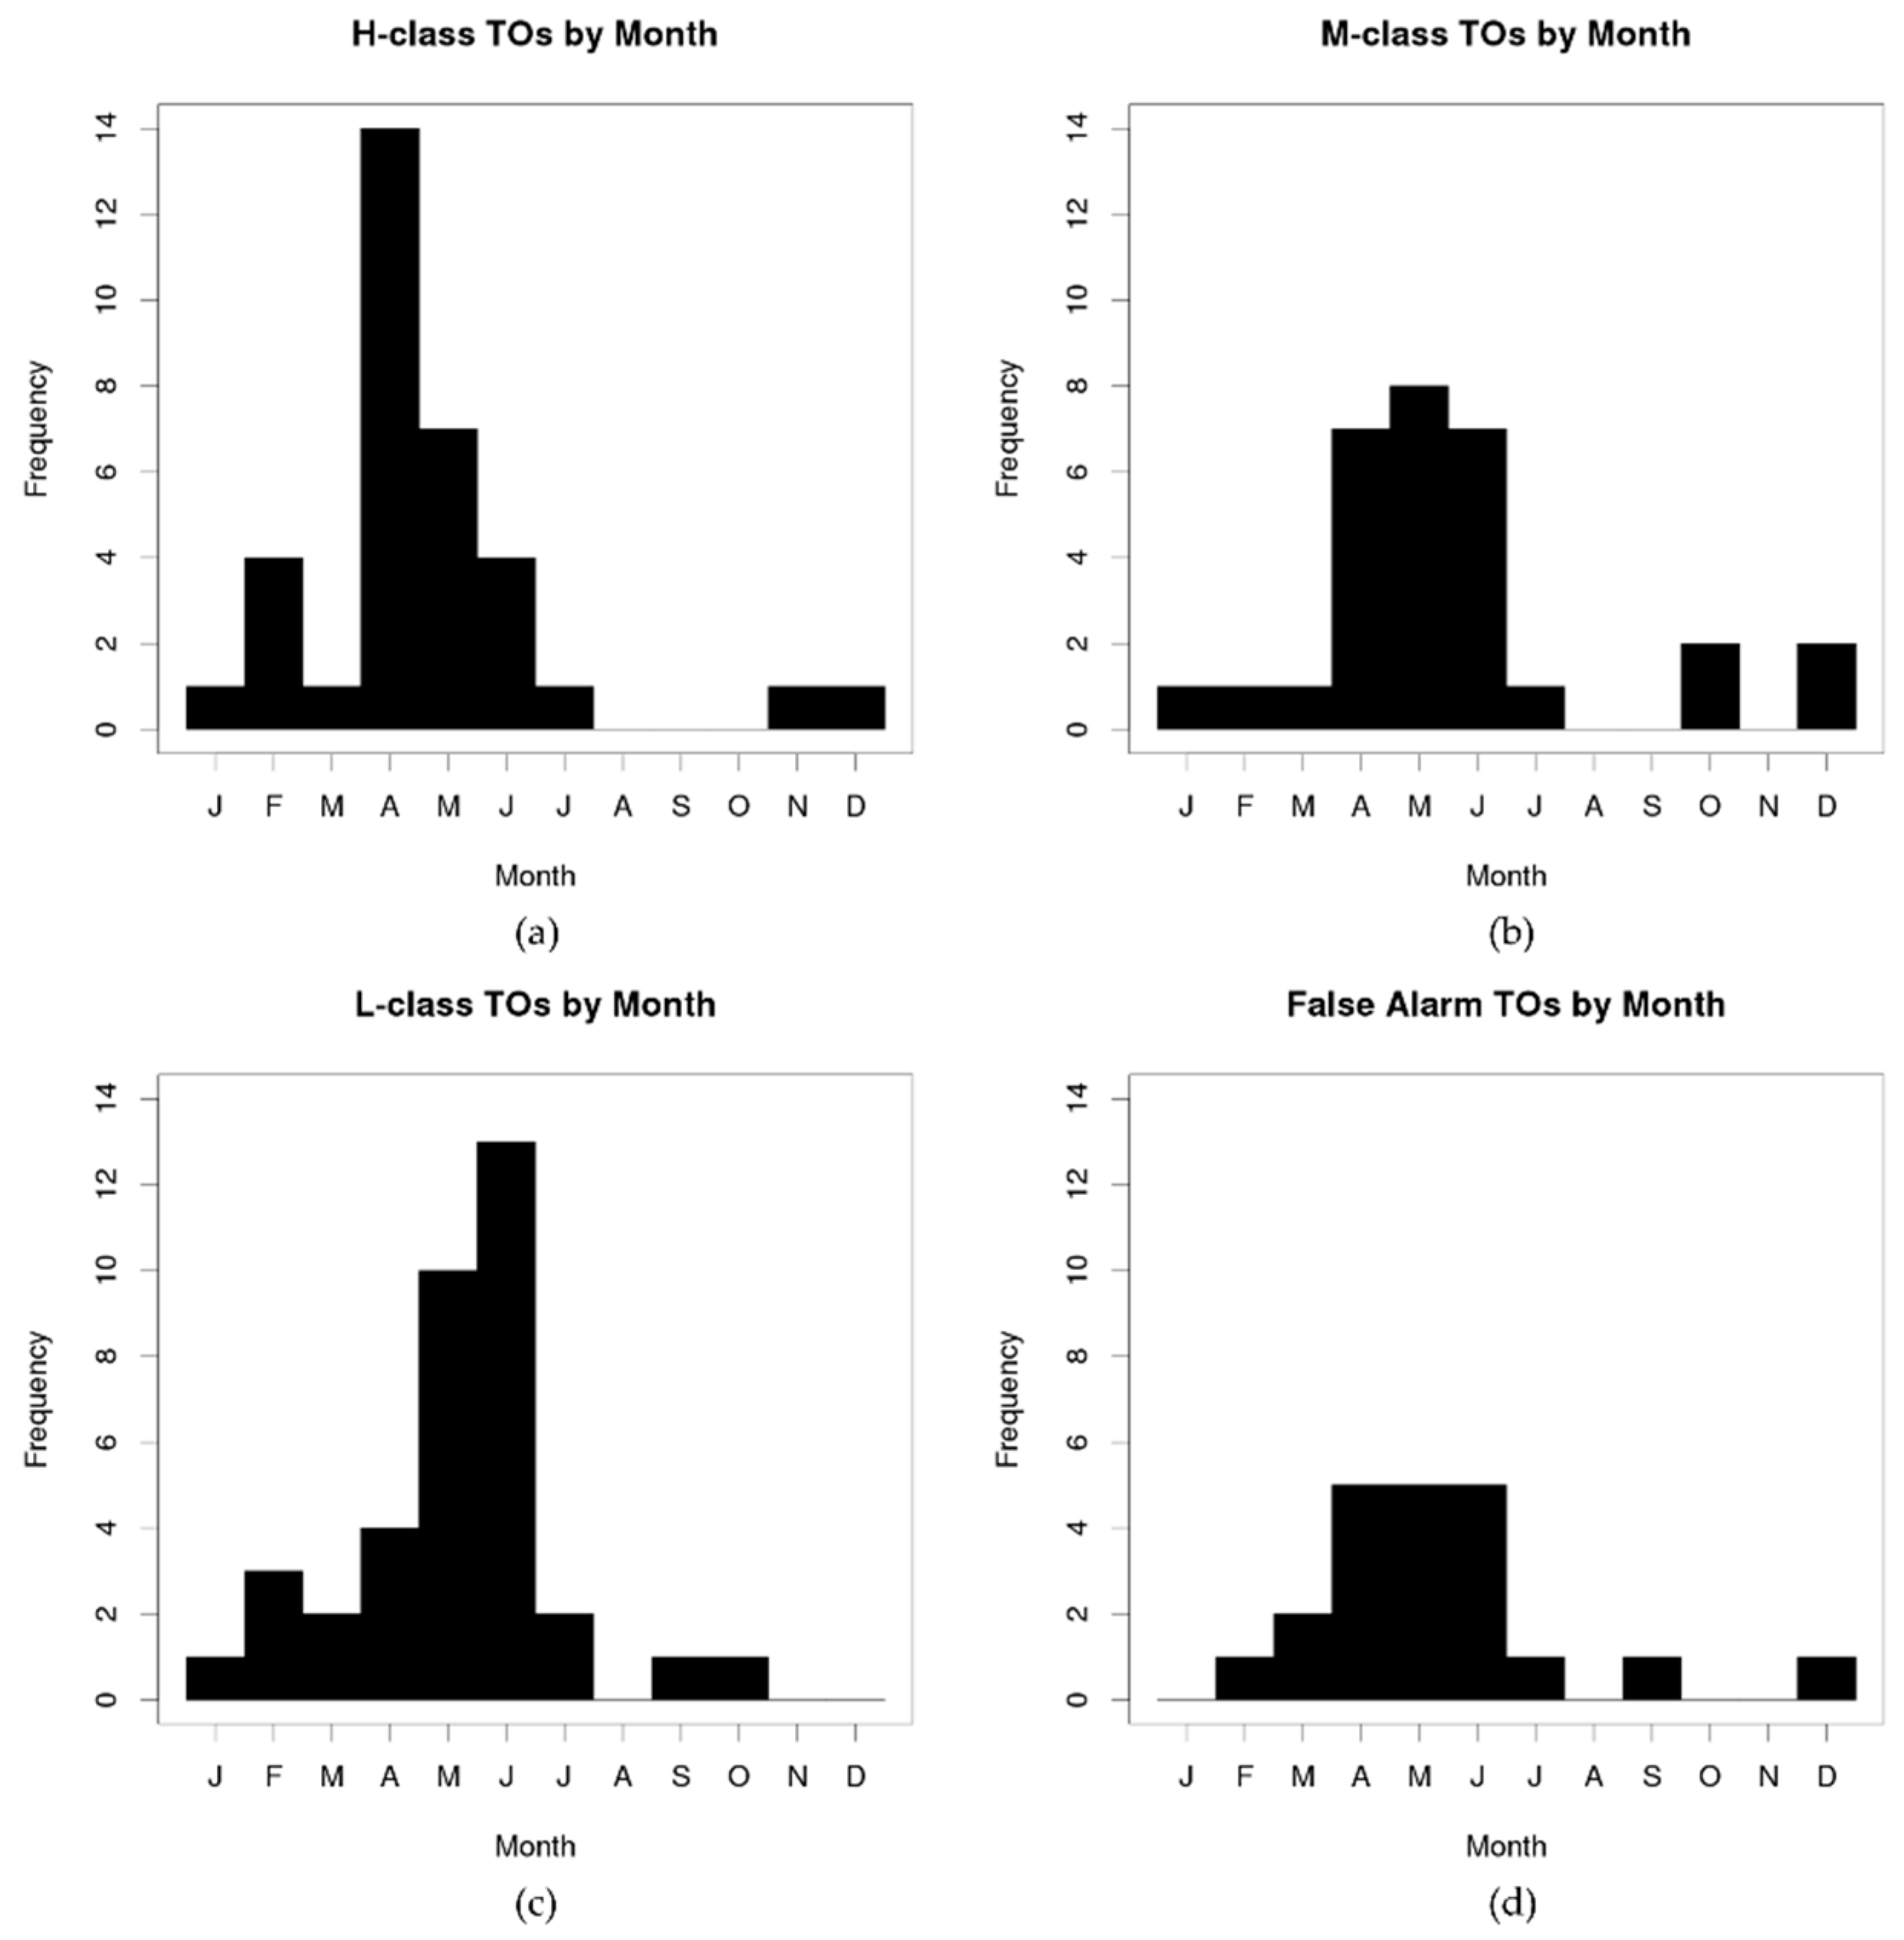
The monthly frequency analysis (Figure 6) revealed a higher tendency towards early summer in L-class TOs, while most TOs occurring in April were H-class (the peak TO activity time for Southeastern U.S. events [35]). False alarms showed no real preference towards a given month as their frequencies mirrored typical tornado frequency climatology as seen in [35]. Additionally, fall and winter TOs showed no favorability towards a given class, even though convective initiation in many cold season TOs requires enhanced synoptic-scale vertical forcing. We hypothesized that these general outbreak characteristics resulted from higher predictability of synoptically-evident TOs (that occur during the winter and early spring) versus those that are primarily dominated by mesoscale processes (a result we explore further in the upcoming sections).
3.2. Synoptic-Scale Composite Results
For brevity, results from H-class cluster 3 (N = 21), M-class cluster 2 (N = 22), L-class cluster 2 (N = 26), and false alarm cluster 2 (N = 11) are presented below as they were the most commonly observed patterns within each class and as such show the most prevalent biases in TO predictability. Composite fields valid 9-h prior to the TO valid time (assumed to be 2100 UTC based on the results in Figure 5) are shown as they represent meteorological conditions at approximately the same time as the SPC would issue its 1300 UTC convective outlook. Note that many composite fields were noisy owing to the small grid spacing in the NARR; we analyzed general tendencies in magnitudes and spatial locations in this section as opposed to local maxima/minima which were non-significant.
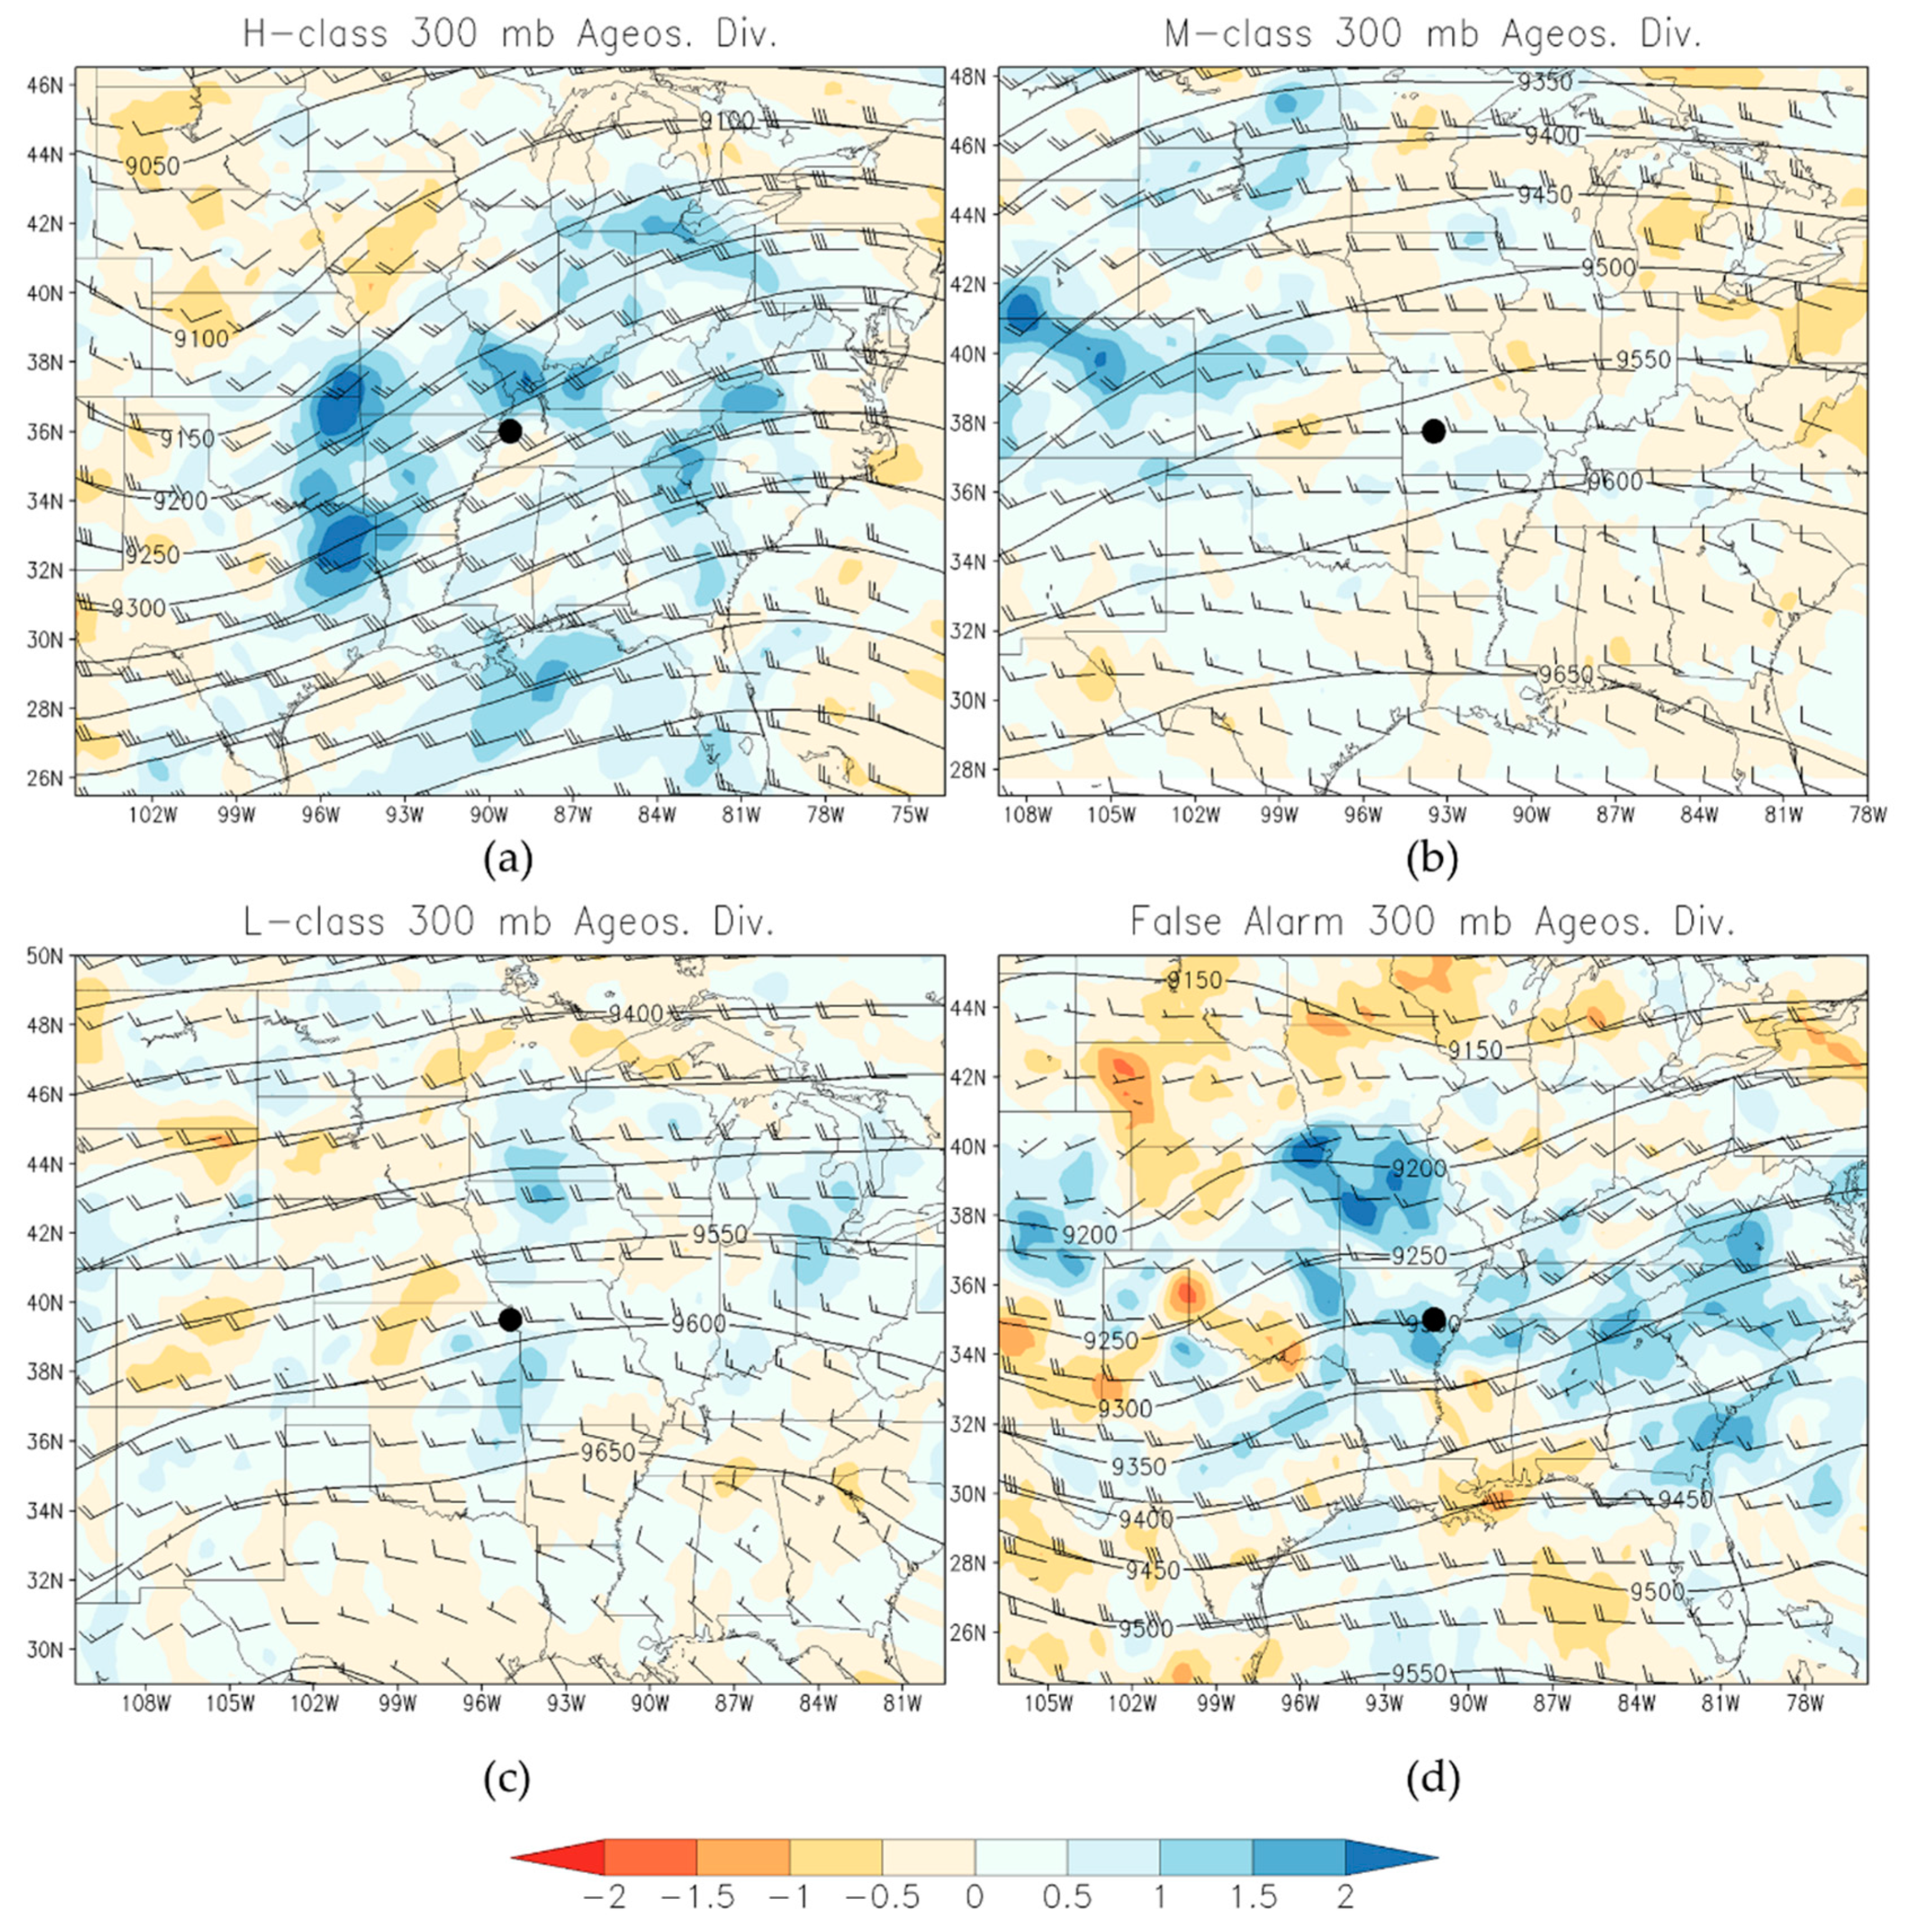
Ageostrophic divergence (typically observed in proximity to jet streaks within the polar jet stream and upper level divergence associated with gradient wind balance) was used to diagnose 300-mb synoptic-scale vertical forcing in the composites (Figure 7). H-class composite 300-mb ageostrophic divergence (Figure 7a) showed considerably higher (roughly 50%) magnitudes near the outbreak than the ageostrophic divergence in the M-class and L-class composites (Figure 7b,c). The false alarm composite ageostrophic divergence closely mirrored the H-class map (Figure 7d), though the highest magnitude ageostrophic divergence regions were not collocated with the outbreak center; instead they were shifted northwest. Upper level wind speeds were also notably southwesterly and faster in the H-class composite relative to the M- or L-classes. These faster winds coupled with the predominant southwesterly direction in the H-class maps revealed a speed-shear dominant environment in the H-class TOs more commonly associated with quasi-linear convective systems (QLCS). This result was consistent with the geographic tendencies of the H-class, as southeastern U.S. tornadoes are more frequently associated with QLCS processes than those observed in the Plains [33,34]. Areas of ageostrophic divergence were also present north and northeast of the TO center the L-class composites (though they were weaker than any other composite). The weaker magnitudes suggested TOs in the L-class had little upper-level synoptic-scale forcing, limiting their predictability.
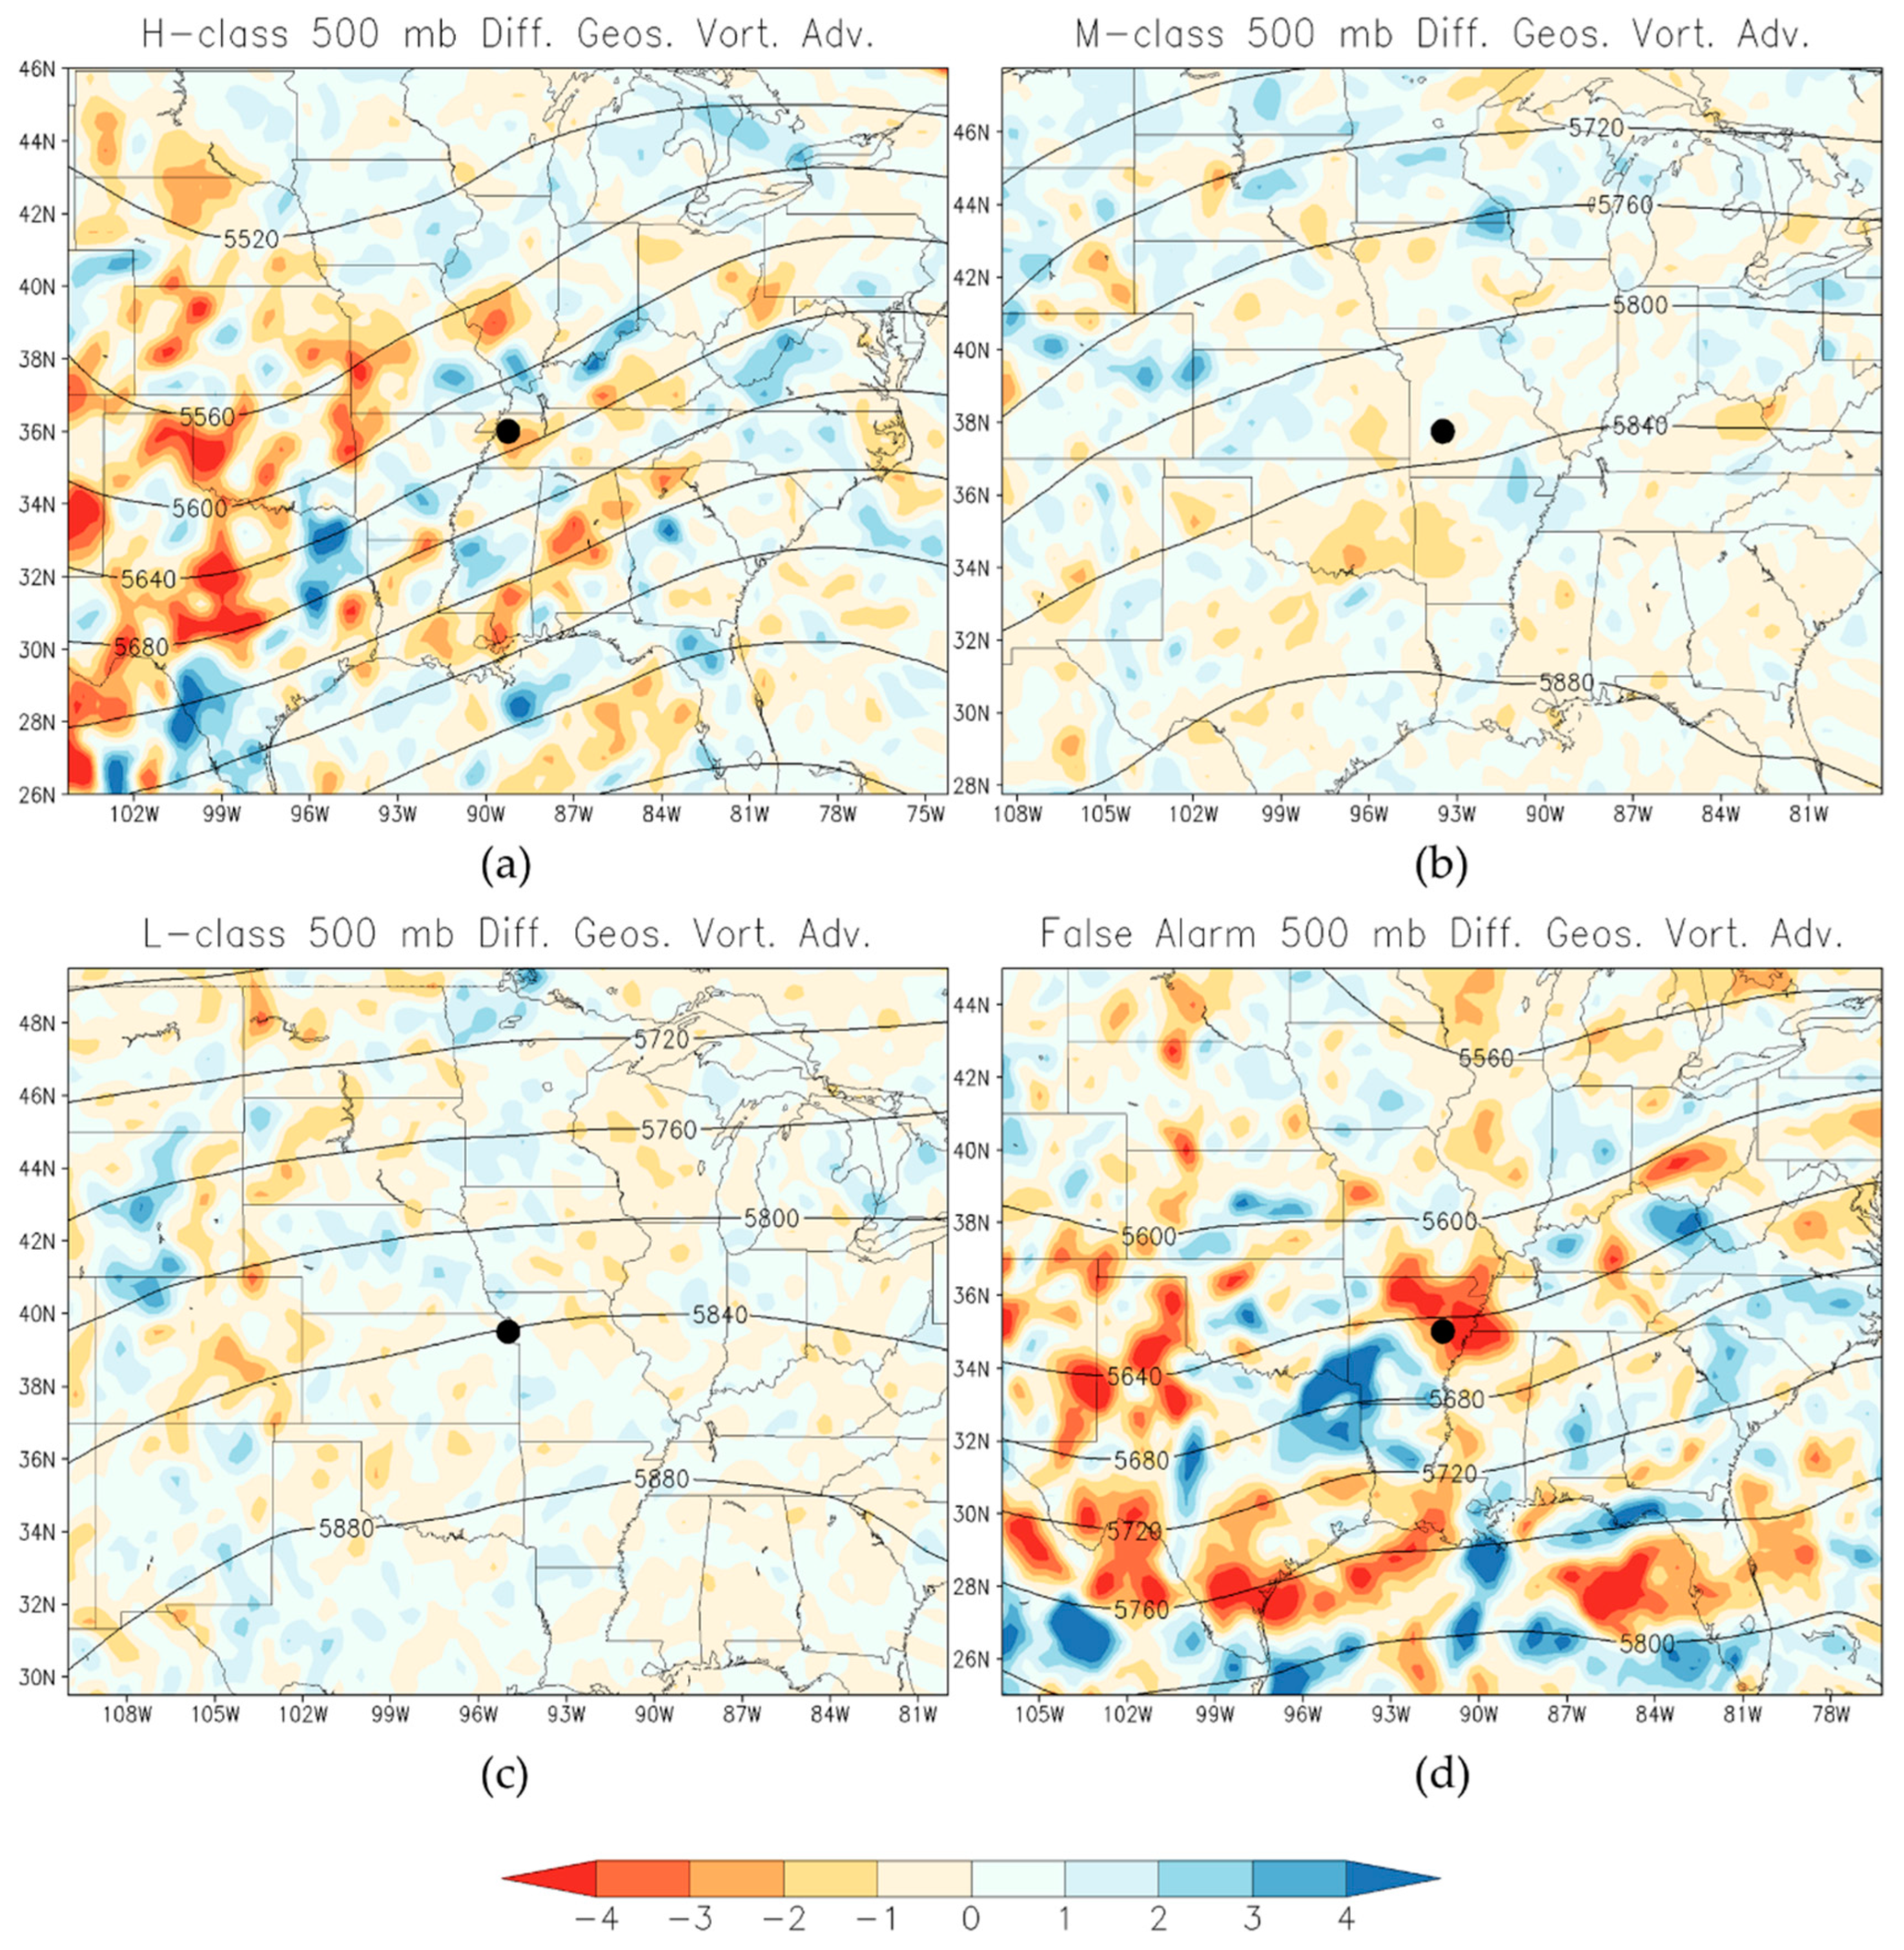
Synoptic-scale vertical motion is frequently described using mid and upper-level differential geostrophic vorticity advection in combination with low-level temperature advection via the quasigeostrophic omega equation [36]. We present differential vorticity advection at 500-mb computed using geostrophic vorticity advection profiles one NARR pressure level above and below the 500-mb level (Figure 8). Rising motion (positive differential vorticity advection, blue shading in Figure 8) was observed in proximity of and west of the TO center for the H-class composites. M- and L-class patterns had little in the way of differential geostrophic vorticity advection owing to the limited curvature and shear in their flow patterns. This lack of curvature or shear vorticity reinforced the notion that these TOs do not have the synoptic-scale structures typically observed with synoptically-evident TOs (which the H-class are). False alarms had similar forcing magnitudes and structures to the H-class, though the maximum in negative differential geostrophic vorticty advection over the TO center may have limited tornado production in those events. There was also a shortwave trough co-located and slightly east of the TO center in the false alarm composites that likely increased negative geostrophic vorticity advection near the TO center. This feature was useful in helping to isolate H-class TOs from false alarm events.
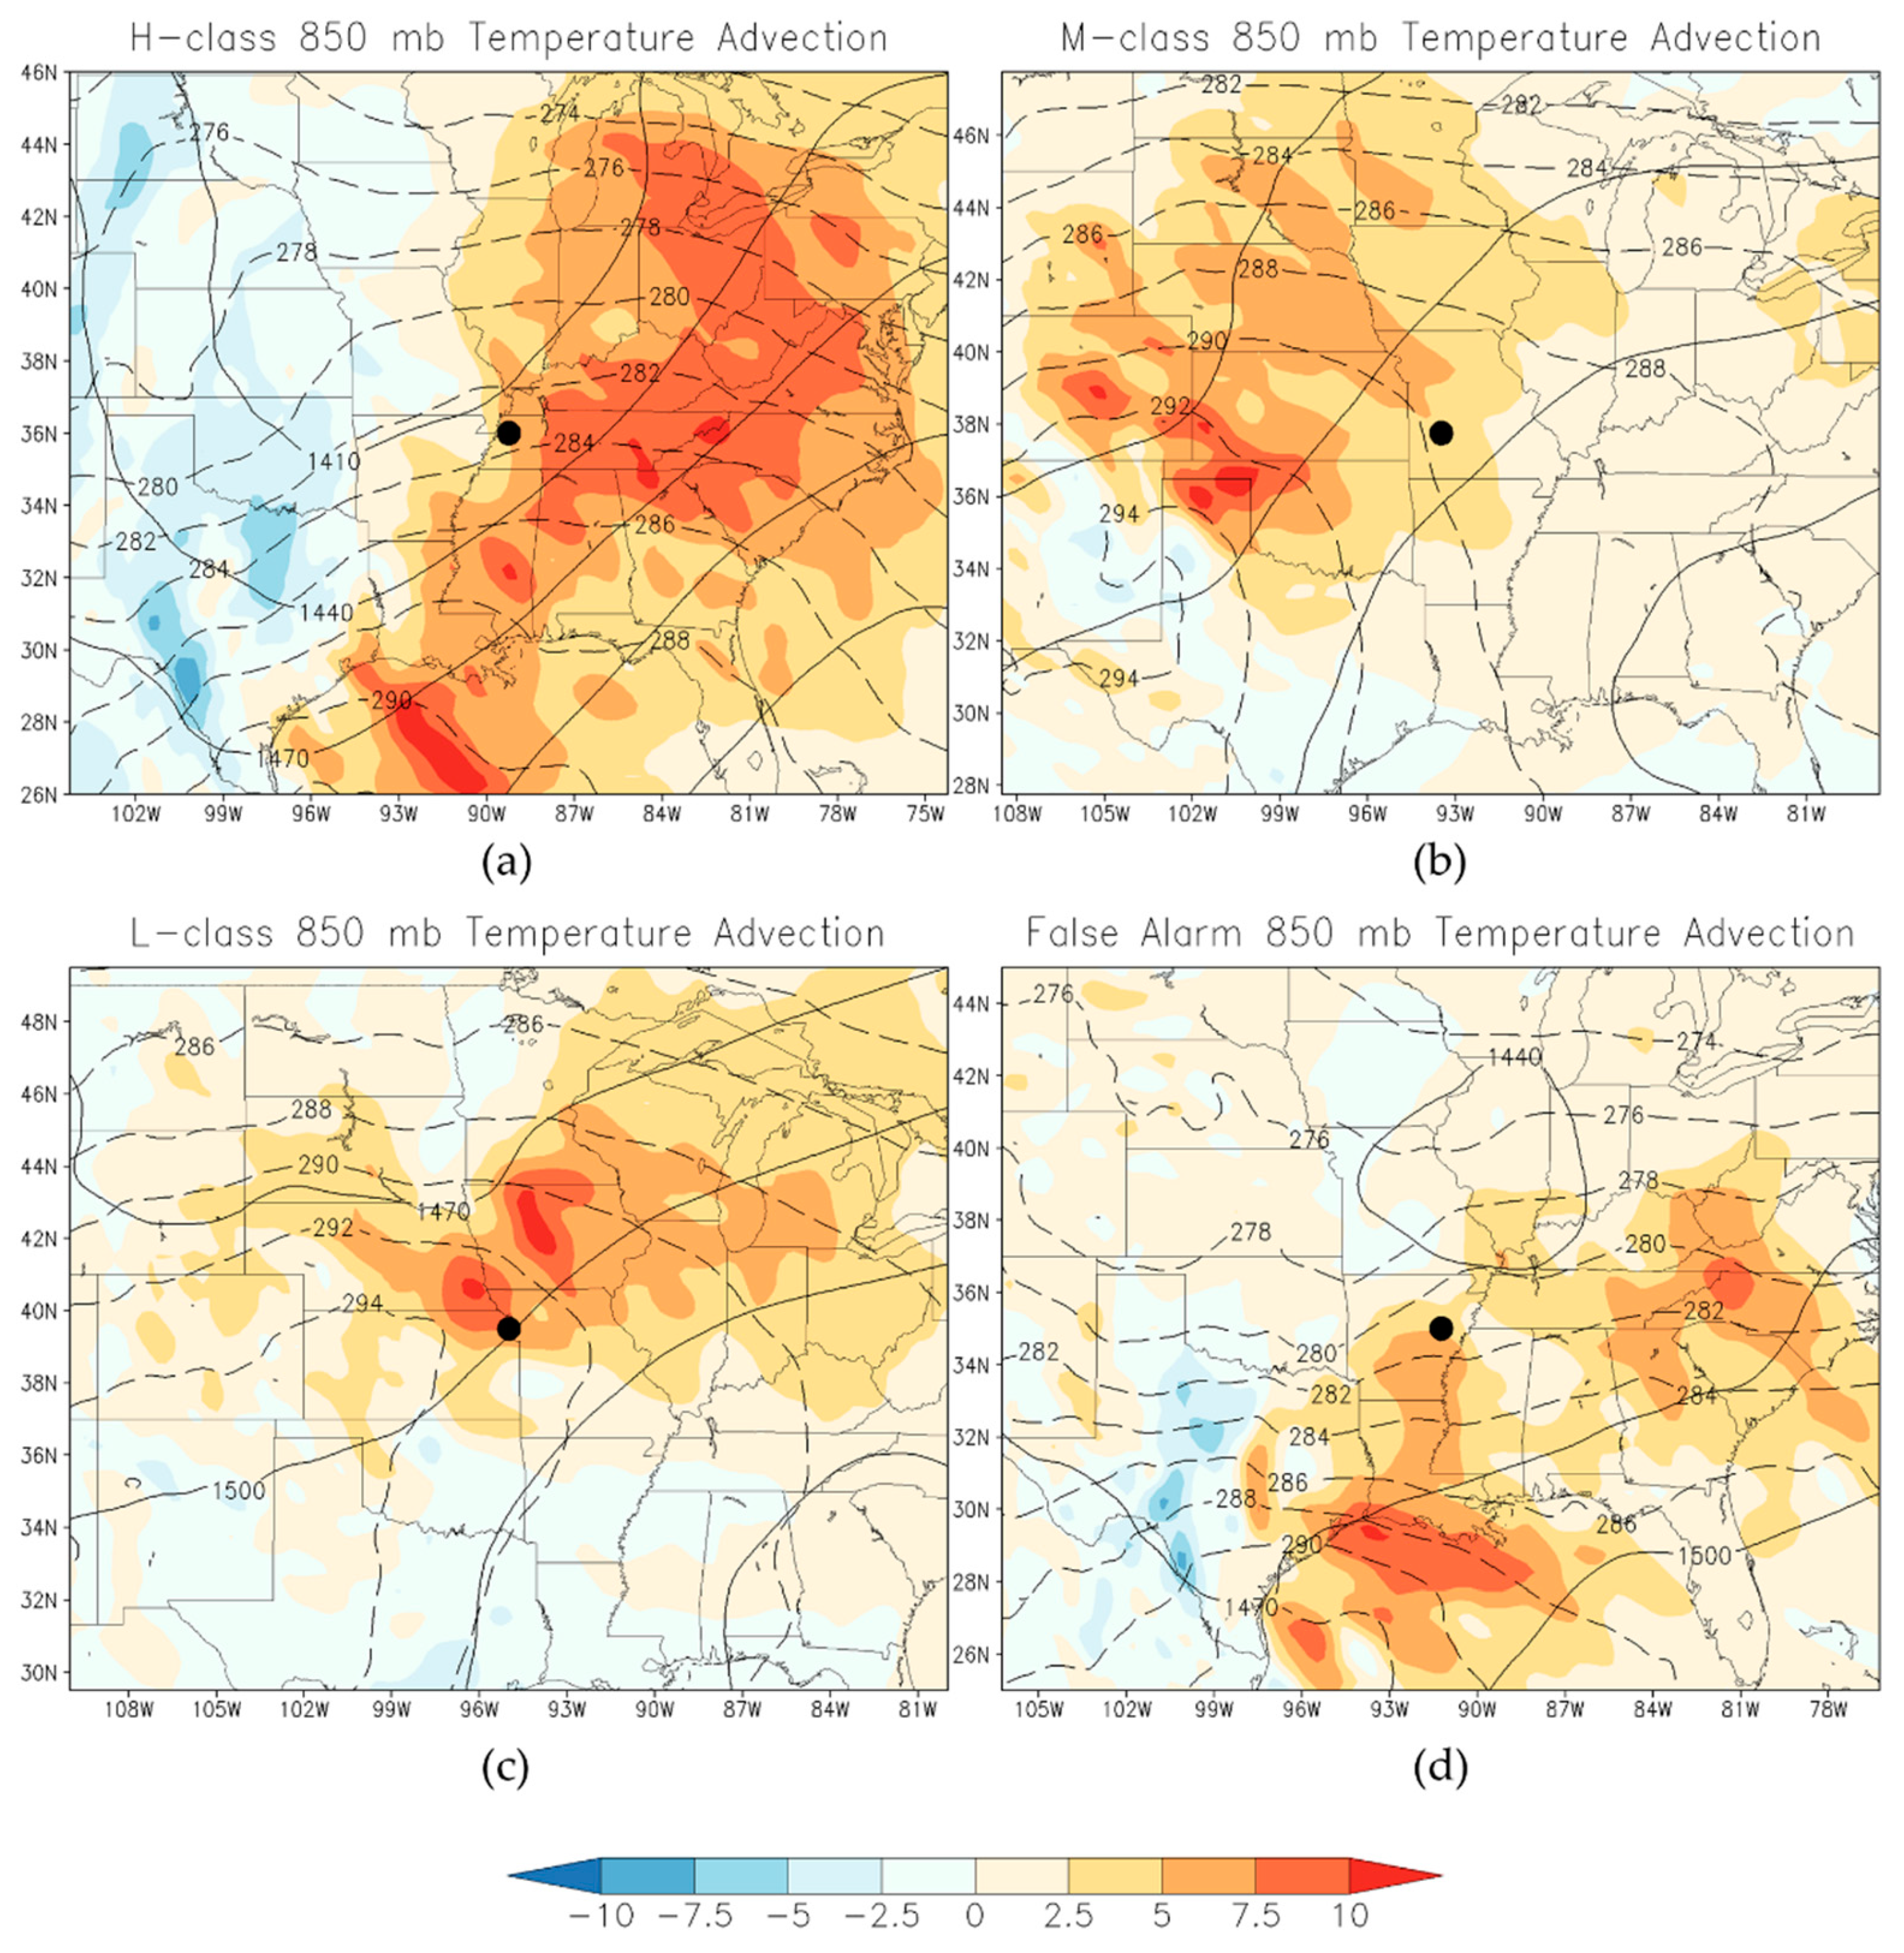
To complement the mid-level results, 850-mb temperature advection (Figure 9) patterns were also constructed from the composites. The H-class composite (Figure 9a) showed a clear maximum of warm air advection east and northeast of the TO center resulting from the strong north-to-south temperature gradient spanning the outbreak region. Temperature gradient structures in the M-class and L-class composites were oriented more east-to-west, generally directed towards hot and dry air over the Desert Southwest (and suggesting these forecast classes had increased frequency of dryline-based vertical forcing). Smaller warm air advection maxima were observed in the M-class and L-class composites as well, and these patterns were shifted north (for the L-class) and northwest (for the M-class) of the TO center (as opposed to east). These differences may be important in improving the convective outlook regions for the M-class and L-class events (further work would be needed to explore this) as these low-level patterns show the greatest distinctions between the groups. The false alarm composites showed little in the way of 850-mb geostrophic flow coupled with a strong thermal gradient that was confined southwest of the TO center. These false alarm patterns more closely matched M-class and L-class temperature advection magnitudes, suggesting the upper-level features were more responsible for false alarm TO forecasts.
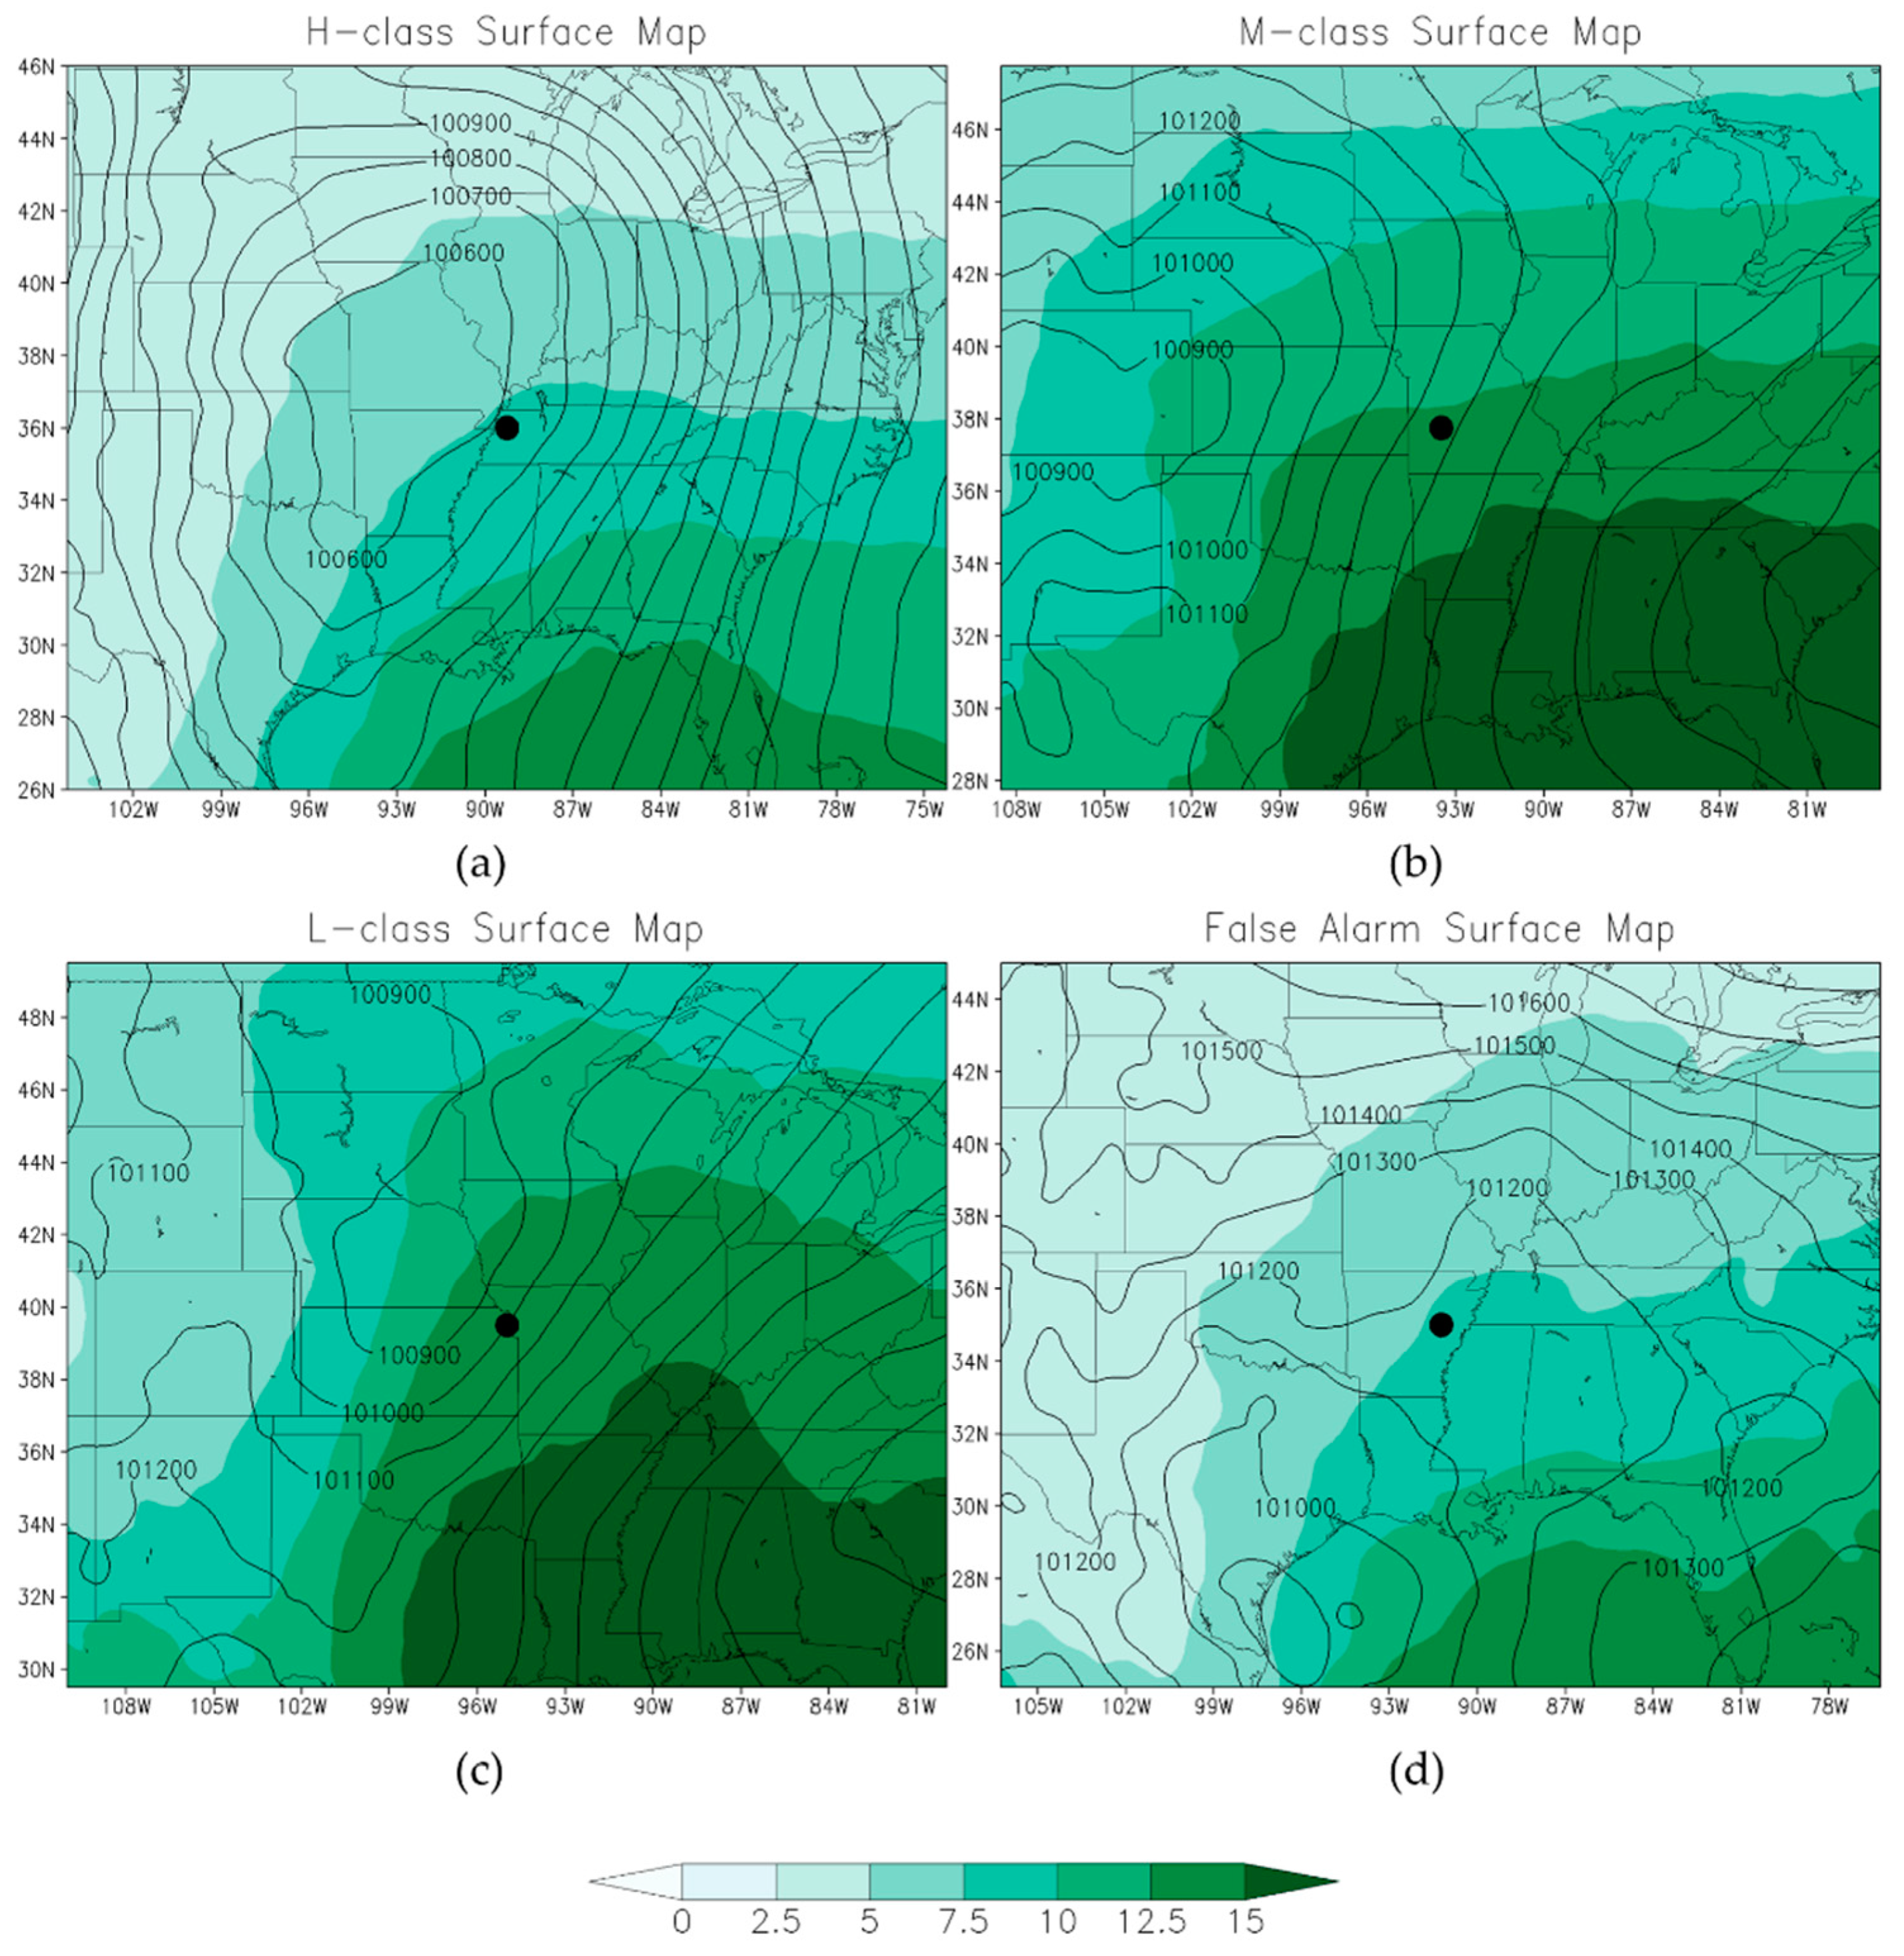
At the surface (Figure 10), a strong extratropical cyclone was clearly evident in the H-class composite, while a west-to-east moisture gradient (assumed to be a weak dryline) with an associated thermal low west of the boundary were notable in the M- and L-class patterns. These results support those in Figure 6, Figure 7 and Figure 8 that suggest mesoscale-dominant outbreaks (i.e., those driven by thermodynamic processes) have inherently lower predictability. Interestingly, the moisture content in the M- and L-class composites was also almost 50% higher than what was observed in the H-class composite and extended much farther north. This increased moisture and clear west-to-east moisture gradient characterized most M-class and L-class TOs. It is likely that these meteorological structures contributed to forecast errors as convective outlook domains may not have spanned all tornado-prone geographic regions (the mesoscale analyses presented below reinforce these ideas) and these thermodynamically-driven features are often poorly forecast by numerical weather prediction models. Finally, the false alarm composite revealed a similar moisture profile to the H-class (less moisture than both the M- and L-class composites), but lacked a well-established surface cyclone. Overall, the composite results showed the importance of the synoptic-scale processes in ensuring forecast success; those TOs driven by mesoscale processes were frequently not forecast well owing to the difficulties numerical weather prediction models have in rendering their underlying thermodynamics. Clearly, research devoted to improving the mesoscale rendering of TOs is paramount for improving forecast success.
3.3. Mesoscale Characteristics
WRF simulations were used to diagnose mesoscale structural differences in the composite fields. Specifically, SREH over the effective layer (ELSREH) [37], mixed-layer CAPE (MLCAPE) [36], and supercell composite parameter (SCP) [38] were computed from simulation output to measure tornado potential. These parameters were selected as they quantify the suitability of the kinematic fields (ELSREH) for tornadogenesis, the abundance of available convective instability (MLCAPE), and a global diagnostic that measures conditions suitable for supercell convection (SCP). We also computed the significant tornado parameter [38], though its magnitudes were too weak to discern meaningful structures in any composite. These limited magnitudes were likely a consequence of the smoothed boundary conditions (resulting from averaging TOs in each cluster) provided by the composites in the WRF simulations.
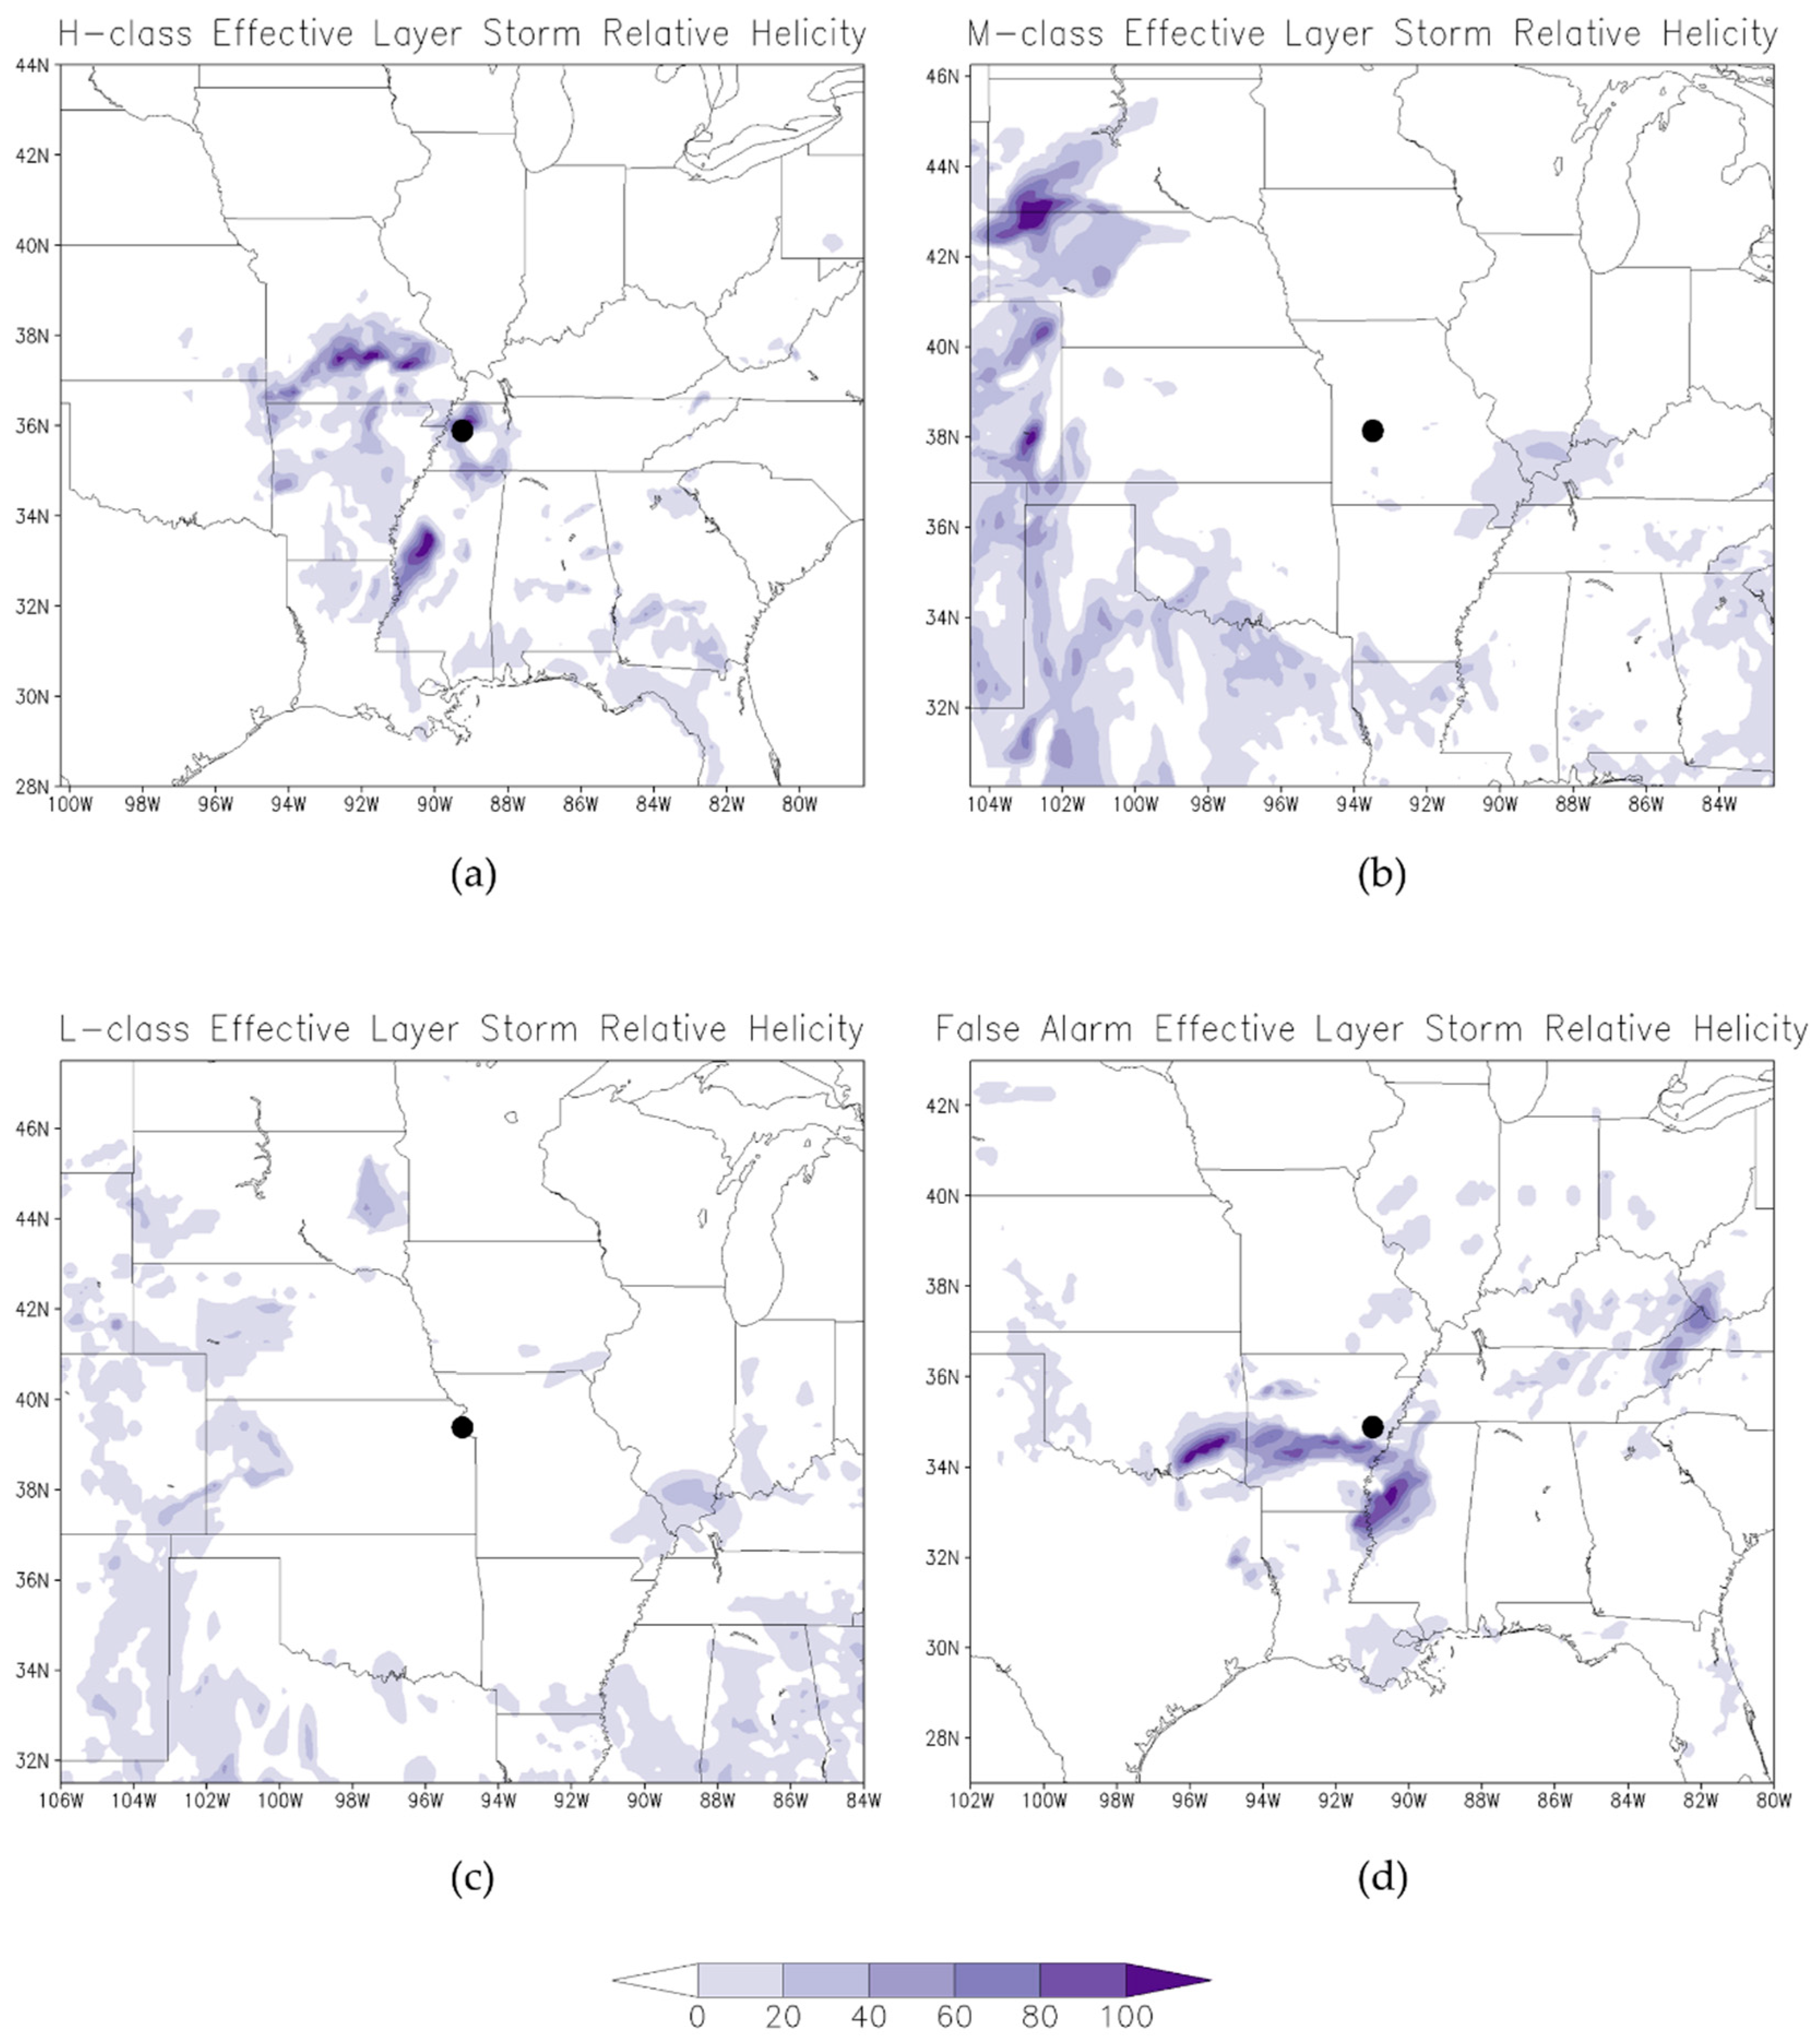
ELSREH fields (an important kinematic tornadogenesis parameter) are provided in Figure 11. H-class and false alarm simulations (Figure 11a,d) both showed maxima in ELSREH near the TO domain center, contrasting the M- and L-class ELSREH (Figure 11b,c) results. The available M-class and L-class ELSREH maxima were also located behind the dryline (Figure 10b,c) in those composites, limiting the utility of the available ELSREH in tornadogenesis owing to limited convective potential. These inconsistencies are largely responsible for the difficulties in identifying the tornado region in the M-class and L-class TOs. Heavy forecaster reliance on such parameters likely contributed to the forecast errors noted in Figure 4.
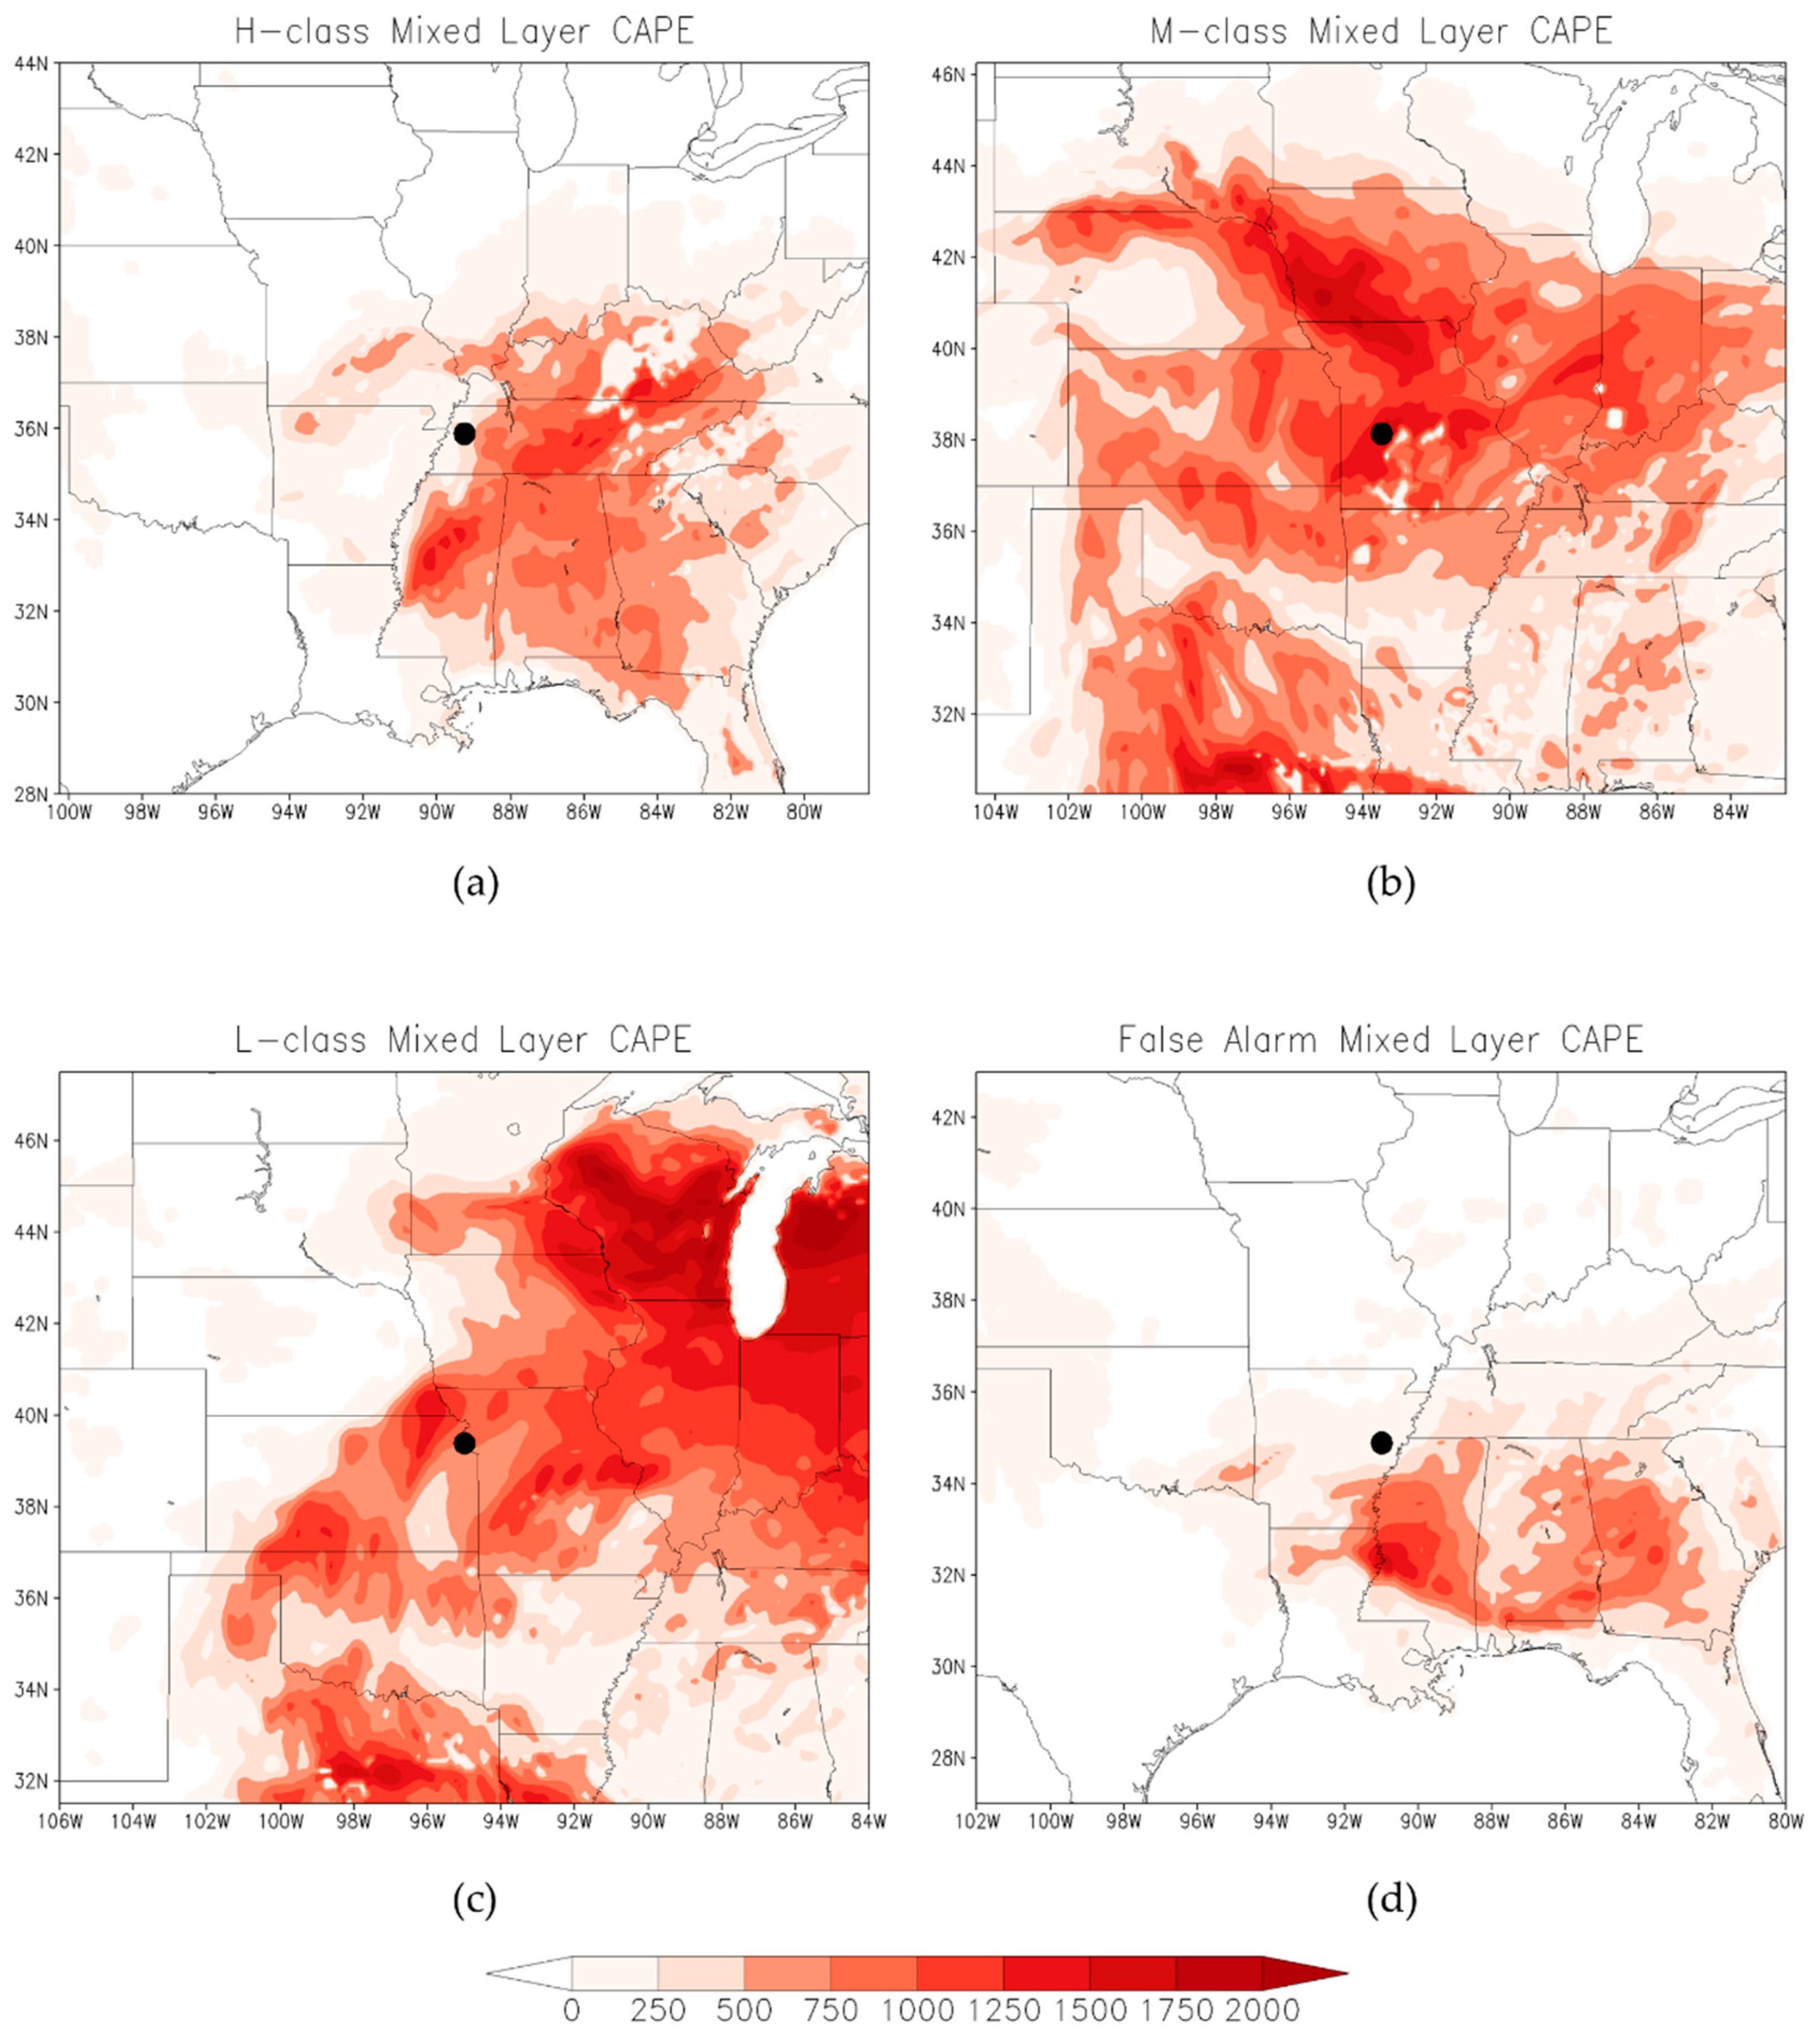
The MLCAPE fields (Figure 12) showed slightly lower mixed-layer instability in the H-class and false alarm groups, contrasting the higher instability seen in the M- and L-class composites. These patterns resulted from the greater surface moisture seen in Figure 10b,c east and north of the TO center, implying that many of the forecast errors seen in Figure 4 were associated with underestimating available instability north and east of the convective outlook region. Interestingly, as was the case with the ELSREH fields, the false alarm composite appeared very similarly to the H-class composite though with slightly lower MLCAPE magnitudes. Importantly, the MLCAPE maxima in the M- and L-class composites were spatially displaced from the optimal ELSREH regions; thus, tornadoes occurring in these classes lacked significant kinematic structures associated with classic TO events but instead were thermodynamically driven. This suggests lower predictability of thermodynamic processes within TOs was the primary driver of forecaster error in those cases.
The work in [37] offered a composite index, the SCP, to represent environments conducive for supercelluar convection typically responsible for most TOs. The SCP is heavily dependent on both MLCAPE and ELSREH, and that influence shows in the composite simulation results for this field (Figure 13). The highest SCP values were centered over the TO center in both the false alarm group and the H-class composites, while the M-class and L-class composites had simulated SCP values considerably displaced from the TO center (resulting from the displaced ELSREH maxima in those composite simulations). In fact, the SCP domains mirrored the ELSREH heavily as MLCAPE was available in all composites; the reduced SCP in the L-class was likely a consequence of the unfavorable ELSREH patterns in the L-class events. Despite appearing unfavorable for TOs, the L-class events produced TOs with at least 6 tornadoes, meaning additional research into diagnostic indices that represent such events more effectively is needed to help improve predictability. Such indices may also help isolate differences between the H-class and false alarm composites, as the similarities seen in Figure 11, Figure 12 and Figure 13 are likely contributing to currently observed false alarm TO forecast rates.
4. Discussion
While the maps presented herein revealed important mesoscale and synoptic-scale differences between TO forecasts of varying quality, it was important to also diagnose how well these patterns represented the constituent members within each cluster. To address this, Pearson correlation coefficients (Table 2, Table 3 and Table 4) between the 500-mb geopotential height fields (Figure 8) of the individual cases comprising each cluster and the overall cluster pattern were generated, and similar correlations were done for 850-mb temperature (Figure 9) and near-surface specific humidity (Figure 10) to assess thermodynamics. Bootstrap confidence intervals (1000-replicates) were generated by averaging the correlations of each constituent member (at all composite timesteps) with its composite field to obtain measures of statistical significance. We expected these correlations would be high, though the bootstrap analyses revealed important representativeness limitations of the composites that helped inform their reliability. Differences were deemed statistically significant if the 50th percentile of one composite’s results fell outside the confidence interval of another (as in [13,21]).
The H-class TO was characterized by a synoptically-evident environment with a distinct slightly positively tilted mid-level trough and elevated ageostrophic divergence and positive differential vorticity advection magnitudes. H-class TOs were also characterized by less low-level moisture relative to other forecast classes despite stronger low-level warm air advection. Clearly, strong synoptic-scale vertical forcing was present for H-class TOs, a fact that likely increased their predictability. H-class composites were also most representative of their constituent members, as both kinematic and thermodynamic structures within H-class cluster 3 had the statistically significantly highest correlations (Table 2, Table 3 and Table 4) of any composite shown in Section 3. Note that some smaller clusters had higher correlations as a result of their reduced sample sizes.
M-class forecast environments were less synoptically evident, instead being characterized by a modest west-to-east moisture gradient (Figure 10b) ahead of a poorly defined surface thermal low. These events were primarily thermodynamically driven as they had the highest moisture content and abundant instability throughout their composite domains (Figure 12b) that overcame the limited kinematic favorability. Simulated composite indices (such as the SCP—Figure 13b) were consequentially displaced from the eventual forecasted outbreak center by SPC, resulting in forecast errors in the convective outlook domain placement. The representativeness of M-class cluster 2 was also statistically significantly lower than H-class cluster 3 (particularly the thermodynamic fields, Table 3 and Table 4), suggesting that while these TOs were forced by mesoscale processes, the variability in those processes was likely responsible for their lower forecast success.
Many characteristics of the L-class TOs were indistinguishable from M-class events, particularly the reduced availability of synoptic-scale forcing mechanisms and generally unsuitable vertical wind profiles for TOs. L-class TOs were dominated by abundant moisture and low-level instability (like M-class TOs), though any associated drylines in the L-class were less pronounced. Importantly, the L-class composites had even lower representativeness in the 850-mb temperature field (which is strongly related to its MLCAPE) than either the M- or H-class TOs. Additionally, L-class TOs lacked a clear warm air advection maximum east of the TO center. The results help demonstrate the challenges associated with forecasting these less synoptically-evident events and offer some insight into the processes governing such outbreaks.
While the M-class and L-class composites revealed clear meteorological factors that increased their forecast complexity, the false alarm composites showed many similar structures to H-class cluster 3. Upper-level false alarm composite flow patterns largely resembled the H-class, with the only notable distinguishing characteristic a different trough depth west of the TO center (Figure 8). Similarly, low-level temperature advection magnitudes had similar magnitudes to H-class events, though 850-mb flow was weaker (the higher advection magnitudes resulted from a stronger temperature gradient southwest of the TO center). Another notable difference was the general absence of a pronounced extratropical surface cyclone in the false alarms (Figure 10d). Most mesoscale indices appeared similarly between the false alarms and H-class as well (notably SCP—Figure 13a,d and ELSREH, Figure 11a,d), suggesting additional research investigating the development of an index that incorporates both mesoscale and synoptic-scale outbreak characteristics could help reduce false alarm frequency. False alarm composites were also the least representative of any cluster (Table 2, Table 3 and Table 4) and had the lowest overall frequency in the outbreak database. While these composite fields helped reveal some potential forecast difficulties, more false alarm examples are needed to obtain more representative meteorological patterns, which in turn would help reduce false alarm forecasts.
5. Conclusions
Tornado outbreaks continue to be a major hazard for locations east of the Rocky Mountains in the United States. Improving TO predictability is of utmost importance to ensure minimal impacts on life and property. The SPC is NOAA’s premier tornado forecasting entity, responsible for issuing severe weather outlooks that encompass broad geographic regions in the U.S., the nearest proxy to TO forecasting that is currently done. While the SPC’s TO forecasting is state-of-the-art in operational meteorology [9], a better understanding of the physical characteristics underlying those TO forecasts with reduced success should help further improve forecast capability. The primary goal of this work was to identify atmospheric conditions associated with TO forecasts of varying quality, revealing important atmospheric features that affect forecaster performance. We expected that such information will help improve TO predictability and reduce false alarm TO forecasts.
TO forecast quality was computed on SPC convective outlooks spanning 2009-2017 where a 10% probability region for tornadoes (or higher) was present (122 total TOs). Tornado counts were obtained for each retained TO and percentages of tornado reports (based on a KDE-derived outbreak impact domain [24]) falling in the convective outlook polygon (hits) were used to develop a distribution of forecast quality (Figure 2). This distribution was broken into terciles, where 50% or lower was deemed a low-quality forecast (L-class), between 50% and 82% a medium quality forecast (M-class), and above 82% a high-quality forecast (H-class). False alarm cases were also retained if fewer than 6 tornadoes were reported for the given TO forecast, as this does not meet the definition of a TO according to [8,11,12,20]. In general, all TO forecast classes showed peak activity during traditional tornado season (April–June), and peak tornado activity occurred in over 80% of outbreaks between 1800 UTC and 0000 UTC the following day (over 50% occurred at 2100 UTC). TO forecast errors were also diagnosed by geographic position relative to the respective convective outlook center (Figure 4), revealing a bias towards errors northeast of the convective outlook region. Cluster analysis, optimized using silhouette coefficients, was used to combine TOs in each forecast class into synoptic-scale composites by averaging three-dimensional outbreak-centric NARR domains for all event in each cluster (Figure 7, Figure 8, Figure 9 and Figure 10). Finally, the WRF was used to obtain mesoscale features within these composites by simulating the composite fields themselves (Figure 11, Figure 12 and Figure 13).
The primary synoptic-scale results presented important distinctions in low-level temperature advection and near-surface moisture profiles. M-class and L-class TOs had larger moisture plumes east and north of the convective outlook center (and associated dryline structures west of the outbreak center), suggesting the tornado-prone environmental conditions may extend farther than originally forecast (a conclusion confirmed in Figure 4). M-class and L-class TOs also had much weaker 850-mb warm air advection displaced from the TO center, while advection profiles in H-class outbreaks were centered on the TO center. Few differences were seen in the upper levels, though southwesterly flow at 300-mb was commonly seen in the H-class composites, suggesting less turning with height and more speed shear contributing to the tornadoes within a H-class TO. These patterns suggested H-class TOs were synoptically evident and likely QLCS driven systems, possibly with supercell convection ahead of the main line. M-class and L-class events were found to be more thermodynamic in nature and more reliant on mesoscale processes for their formation, increasing their forecasting complexity. We expect more research into the tornado potential in such thermodynamically dominant environments will help further improve forecast performance.
Composite mesoscale simulations (Figure 11, Figure 12 and Figure 13) revealed ELSREH as the primary variable able to distinguish H-class events from M- and L-classes. M- and L-class composites were characterized by greater MLCAPE (consistent with their surface synoptic-scale structures) despite their reduced ELSREH magnitudes (evidenced by the lack of a well-defined upper-level synoptic-scale forcing mechanism), which resulted in lower SCP values near the outbreak center in those composites. These results reveal many forecast challenges; numerical weather prediction models utilize parameterizations to estimate thermodynamic processes within TO environments but can forecast kinematic fields directly, so outbreaks that are more thermodynamically driven (which M-class and L-class clearly are) require more research to understand their underlying processes more fully.
Overall, these results demonstrate the utility of composite analysis in identifying general atmospheric characteristics that could potentially improve forecasts. Most synoptic-scale results were consistent with previous work. However, the results presented herein suggest TO predictability can be further improved by deriving an atmospheric parameter that blends information at both the mesoscale and synoptic-scale. Future work will investigate the development of such a parameter and will quantify any potential benefits offered in TO forecasting. Ultimately, while previous work [9] has shown TO forecasting to be quite successful, further improvements may be achieved by carefully focusing on improving understanding of mesoscale processes within TOs.
Author Contributions
Conceptualization, A.M. and A.B.; methodology, A.M.; formal analysis, A.M. and A.B.; writing—original draft preparation, A.M.; writing—reviewing and editing, A.M. and A.B., visualization, A.M.
Funding
This research received no external funding.
Acknowledgments
We would like to thank Andy Dean from the Storm Prediction Center for his help accessing the convective outlook files.
Conflicts of Interest
The authors declare no conflict of interest.
References
- Hayes, J.L. The Historic Tornadoes of April 2011; U.S. Department of Commerce Service Assessment: Silver Spring, MD, USA, 2011; 76p. Available online: https://www.weather.gov/media/publications/assessments/historic_tornadoes.pdf (accessed on 12 December 2018).
- Blunden, J.; Arndt, D.S. State of the climate in 2011. Bull. Am. Meteorol. Soc. 2011, 93, S1–S282. [Google Scholar] [CrossRef]
- Shafer, C.M.; Doswell, C.A. A multivariate index for ranking and classifying severe weather outbreaks. Electron. J. Severe Storms Meteorol. 2011, 5, 1–39. [Google Scholar]
- Thompson, R.L.; Edwards, R. An overview of environmental conditions and forecast implications of the 3 May 1999 Tornado Outbreak. Weather Forecast. 2000, 15, 682–699. [Google Scholar] [CrossRef]
- Galway, J.G. Some climatological aspects of tornado outbreaks. Mon. Weather Rev. 1977, 105, 477–484. [Google Scholar] [CrossRef]
- Grazulis, T.P. Significant Tornadoes 1680–1991; Environmental Films: St. Johnsbury, VT, USA, 1993; 1326p, ISBN 978-1879362031. [Google Scholar]
- Fuhrmann, C.M.; Konrad, C., II; Kovach, M. Ranking of tornado outbreaks across the United States and their climatological characteristics. Weather Forecast. 2014, 29, 684–701. [Google Scholar] [CrossRef]
- Doswell, C.A.; Edwards, R.; Thompson, R.L.; Hart, J.A.; Crosbie, K.C. A simple and flexible method for ranking severe weather events. Weather Forecast. 2006, 21, 939–951. [Google Scholar] [CrossRef]
- Herman, G.R.; Nielsen, E.R.; Schumacher, R.S. Probabilistic verification of Storm Prediction Center convective outlooks. Weather Forecast. 2018, 33, 161–184. [Google Scholar] [CrossRef]
- Edwards, R.; Corfidi, S.F.; Thompson, R.L.; Evans, J.S.; Craven, J.P.; Racy, J.P.; McCarthy, D.W.; Vescio, M.D. Storm Prediction Center forecasting issues related to the 3 May 1999 Tornado Outbreak. Weather Forecast. 2002, 17, 544–558. [Google Scholar] [CrossRef]
- Evans, J.S.; Mead, C.M.; Weiss, S.J. Forecasting the Super Tuesday tornado outbreak at the Storm Prediction Center: Why forecast uncertainty does not necessarily decrease as you get closer to a high impact weather event. In Proceedings of the 24th Conference Severe Local Storms, Savannah, GA, USA, 27–31 October 2008. [Google Scholar]
- Shafer, C.M.; Mercer, A.E.; Richman, M.B.; Leslie, L.M.; Doswell, C.A. An assessment of areal coverage of severe weather parameters for severe weather outbreak diagnosis. Weather Forecast. 2012, 27, 809–831. [Google Scholar] [CrossRef]
- Mercer, A.E.; Shafer, C.M.; Doswell, C.A.; Leslie, L.M.; Richman, M.B. Synoptic composites of tornadic and nontornadic outbreaks. Mon. Weather Rev. 2012, 140, 2590–2608. [Google Scholar] [CrossRef]
- Beebe, R.G. Tornado composite charts. Mon. Weather Rev. 1956, 84, 127–142. [Google Scholar] [CrossRef]
- Lowe, A.B.; McKay, G.A. Tornado composite charts for the Canadian Prairies. J. Appl. Meteorol. 1962, 1, 157–162. [Google Scholar] [CrossRef]
- Hagemeyer, B. Peninsular Florida tornado outbreaks. Weather Forecast. 1997, 12, 399–427. [Google Scholar] [CrossRef]
- Gaffin, D.M.; Parker, S.S. A climatology of synoptic conditions associated with significant tornadoes over the southern Appalachian region. Weather Forecast. 2006, 21, 735–751. [Google Scholar] [CrossRef]
- Banacos, P.C.; Ekster, M.L. The association of the elevated mixed layer with significant severe weather events in the northeastern United States. Weather Forecast. 2010, 25, 1082–1102. [Google Scholar] [CrossRef]
- Wasula, A.C.; Bosart, L.F.; Schneider, R.; Weiss, S.J.; Johns, R.H.; Manikin, G.S.; Welsh, P. Mesoscale aspects of the rapid intensification of a tornadic convective line across central Florida: 22–23 February 1998. Weather Forecast. 2007, 22, 223–243. [Google Scholar] [CrossRef]
- Schaefer, J.T.; Doswell, C.A. Empirical orthogonal function expansion applied to progressive tornado outbreaks. J. Meteorol. Soc. Japan 1984, 62, 929–936. [Google Scholar] [CrossRef]
- Mercer, A.E.; Richman, M.B.; Leslie, L.M. Identification of severe weather outbreaks using kernel principal component analysis. Procedia Comp. Sci. 2011, 6, 231–236. [Google Scholar] [CrossRef] [Green Version]
- Skamarock, W.C.; Klemp, J.B.; Dudhia, J.; Gill, D.O.; Barker, D.M.; Duda, M.G.; Huang, X.; Wang, W.; Powers, J.G. A Description of the Advanced Research WRF Version 3; NCAR Technik Note; NCAR/TN-475+STR: Boulder, CO, USA, 2008; 125p. [Google Scholar]
- SPC Severe Weather Report Archive. Available online: https://www.spc.noaa.gov/archive (accessed on 20 November 2018).
- Mesinger, F.; DiMego, G.; Kalnay, E.; Mitchell, K.; Shafran, P.C.; Ebisuzaki, W.; Jović, D.; Woollen, J.; Rogers, E.; Berbery, E.H.; et al. North American Regional Reanalysis. Bull. Am. Meteorol. Soc. 2006, 87, 343–360. [Google Scholar] [CrossRef] [Green Version]
- Shafer, C.M.; Doswell, C.A. Using kernel density estimation to identify, rank, and classify severe weather outbreak events. E J. Severe Storms. Meteorol. 2011, 6, 1–28. [Google Scholar]
- Wilks, D.S. Statistical Methods in the Atmospheric Sciences; Academic Press: Ithaca, NY, USA, 2011; 704p. [Google Scholar]
- Rousseeuw, P. Silhouettes, a graphical aid for the interpretation and validation of cluster analysis. J. Comp. Appl. Math. 1987, 20, 53–65. [Google Scholar] [CrossRef]
- Grell, G.; Devenyi, D. A generalized approach to parameterizing convection combining ensemble and data assimilation techniques. Geophys. Res. Lett. 2002, 29, 1693. [Google Scholar] [CrossRef]
- Hong, S.; Pan, H. Nonlocal boundary layer vertical diffusion in a medium-range forecast model. Mon. Weather Rev. 1996, 124, 2322–2339. [Google Scholar] [CrossRef]
- Mlawer, E.; Taubman, S.; Brown, P.; Iacono, M.; Clough, S. Radiative transfer for inhomogeneous atmospheres: RRTM, a validated correlated-k model for the longwave. J. Geophys. Res. 1997, 102, 663–682. [Google Scholar] [CrossRef]
- Dudhia, J. Numerical study of convection observed during the Winter Monsoon Experiment using a mesoscale two-dimensional model. J. Atmos. Sci. 1989, 46, 3077–3107. [Google Scholar] [CrossRef]
- Fairall, C.; Bradley, E.; Hare, J.; Grachev, A.; Edson, J. Bulk parameterization of air-sea fluxes: Updates and verification for the COARE algorithm. J. Clim. 2003, 16, 571–591. [Google Scholar] [CrossRef]
- Smith, B.T.; Thompson, R.L.; Grams, J.S.; Broyles, C.; Brooks, H.E. Convective modes for significant severe thunderstorms in the contiguous United States. Part I: Storm classification and climatology. Weather Forecast. 2012, 27, 1114–1135. [Google Scholar] [CrossRef]
- Baggett, C.F.; Nardi, K.M.; Childs, S.J.; Zito, S.N.; Barnes, E.A.; Maloney, E.D. Skillful subseasonal forecasts of weekly tornado and hail activity using the Madden-Julian Oscillation. J. Geophys. Res. Atmos. 2018, 123, 661–675. [Google Scholar] [CrossRef]
- Brooks, H.E. Climatological estimates of local daily tornado probability for the United States. Weather Forecast. 2003, 18, 626–640. [Google Scholar] [CrossRef]
- Lackmann, G. Midlatitude Synoptic Meteorology: Dynamics, Analysis, and Forecasting; American Meteorological Society: Boston, MA, USA, 2011; 345p. [Google Scholar]
- Thompson, R.L.; Edwards, R.; Hart, J.A. Evaluation and interpretation of the supercell composite and significant tornado parameters at the Storm Prediction Center. In Proceedings of the 21st Conference Severe Local Storms, San Antonio, TX, USA, 11–16 August 2002. [Google Scholar]
- Thompson, R.L.; Edwards, R.; Hart, J.A.; Elmore, K.L.; Markowski, P. Close proximity soundings within supercell environments obtained from the rapid update cycle. Weather Forecast. 2003, 18, 1243–1261. [Google Scholar] [CrossRef]
Figure 1.
Example TO case in the L class forecast group (50% of reports within the domain). Here, the dashed polygon represents the 40-km buffered SPC convective outlook polygon, while the dot-dashed polygon represents the buffered TO region as defined in [3]. Green points represent correctly forecast tornado reports, while red points represent missed reports. The blue report in southern IN was not within buffered outbreak polygon and was not counted in the verification percentage calculations.

Figure 2.
Percentages of tornadoes within SPC-issued convective outlook 10% tornado probability regions for the given study period. The vertical dashed lines represent the 33rd and 66th percentiles (terciles) used to break the classes into the H-class, M-class, and L-class events described above.
Figure 2.
Percentages of tornadoes within SPC-issued convective outlook 10% tornado probability regions for the given study period. The vertical dashed lines represent the 33rd and 66th percentiles (terciles) used to break the classes into the H-class, M-class, and L-class events described above.

Figure 3.
Outbreak centers for each forecast class. The large filled circles represent the average geographic position for all outbreaks in each forecast class to assess geographic biases and tendencies within each group.
Figure 3.
Outbreak centers for each forecast class. The large filled circles represent the average geographic position for all outbreaks in each forecast class to assess geographic biases and tendencies within each group.

Figure 4.
Locations of missed tornado reports. (a): georeferenced to the centroid of the SPC convective outlook (center of the panel a); (b): shows the relative frequency of tornadoes in each quadrant to demonstrate forecaster error tendency based on the convective outlook polygon. Directions in panel b are relative to 0° as north, as is the case with meteorological wind direction.

Figure 5.
Outbreak valid times for each class. Outbreak valid times are based on the 3-h period of maximum tornado activity during the given outbreak.
Figure 5.
Outbreak valid times for each class. Outbreak valid times are based on the 3-h period of maximum tornado activity during the given outbreak.

Figure 6.
TO frequency by month for (a) H-class TOs; (b) M-class TOs; (c) L-class TOs and (d) False Alarm cases.
Figure 6.
TO frequency by month for (a) H-class TOs; (b) M-class TOs; (c) L-class TOs and (d) False Alarm cases.

Figure 7.
Composite 300-mb ageostrophic divergence (shaded, units are 10−4 s−1) with geopotential height (m) and winds (in m/s) for (a) H-class cluster 3; (b) M-class cluster 2; (c) L-class cluster 2; (d) false alarm cluster 2 TO forecasts. The composite is presented at the time the convective outlook was issued (roughly 9 h prior 2100 UTC, the assumed TO valid time for all composites). The black dot represents the composite outbreak center.

Figure 8.
500-mb differential geostrophic vorticity advection (as in QG theory) in 10−9 s−2 Pa−1 for (a) H-class TOs; (b) M-class TOs; (c) L-class TOs; (d) false alarms. According to QG theory, negative values are supportive of sinking motion (ω > 0) while positive values are supportive of rising motion (ω < 0).

Figure 9.
850-mb temperature advection (units of 10−4 K/s) with geopotential heights (solid lines) and isotherms (dashed lines) for (a) H-class TOs; (b) M-class TOs; (c) L-class TOs; (d) false alarms. Dashed lines are 850-mb isotherms.
Figure 9.
850-mb temperature advection (units of 10−4 K/s) with geopotential heights (solid lines) and isotherms (dashed lines) for (a) H-class TOs; (b) M-class TOs; (c) L-class TOs; (d) false alarms. Dashed lines are 850-mb isotherms.

Figure 10.
Surface composite characteristics for (a) the H-class TOs; (b) M-class TOs; (c) L-class TOs; (d) false alarms. Solid lines are isobars of mean sea level pressure and shading is specific humidity in g/kg.
Figure 10.
Surface composite characteristics for (a) the H-class TOs; (b) M-class TOs; (c) L-class TOs; (d) false alarms. Solid lines are isobars of mean sea level pressure and shading is specific humidity in g/kg.

Figure 11.
Simulated effective layer storm relative helicity (m2 s−2) for the most commonly observed composite for each forecast class (a) the H-class TOs; (b) M-class TOs; (c) L-class TOs; (d) false alarms. Note that this domain fully encompasses the error domain seen in Figure 4 so intercomparisons can be made. As in Figure 7, Figure 8, Figure 9 and Figure 10, outbreak centers are based on the average convective outlook center within constituent members of the given cluster. Simulations are valid at the assumed TO valid time (2100 UTC), based on the results in Figure 5.

Figure 12.
Same as Figure 11, but for mixed layer CAPE (J/kg) (a) the H-class TOs; (b) M-class TOs; (c) L-class TOs; (d) false alarms.
Figure 12.
Same as Figure 11, but for mixed layer CAPE (J/kg) (a) the H-class TOs; (b) M-class TOs; (c) L-class TOs; (d) false alarms.

Figure 13.
Same as Figure 12, but for supercell composite parameter (a) the H-class TOs; (b) M-class TOs; (c) L-class TOs; (d) false alarms.
Figure 13.
Same as Figure 12, but for supercell composite parameter (a) the H-class TOs; (b) M-class TOs; (c) L-class TOs; (d) false alarms.


Table 1.
Optimal clustering method for each forecasting class with performance statistics. Misclustered refers to the number of negative s values from the clustering method, while is the average silhouette coefficient for all clustered events. The number of clusters kept for each class is equal to the length of the cluster sizes.
| Forecast Class | Clustering Method | Misclustered | Clusters Kept | Cluster Sizes | |
|---|---|---|---|---|---|
| H-class | K-means | 0.181 | 0 | 3 | 9, 4, 21 |
| M-class | Ward’s Hierarchical | 0.220 | 1 | 2 | 8, 22 |
| L-class | Ward’s Hierarchical | 0.220 | 2 | 2 | 10, 26 |
| False Alarms | K-means | 0.183 | 1 | 2 | 10, 11 |
Table 2.
Bootstrap 95% confidence intervals for the average Pearson correlation between the composite fields for each forecast class and their constituent maps for each composite. All composite timesteps were used to compute the average. Values closer to 1 suggest the composite is more representative of its constituent members.
| Cluster Name | 500-mb Geopotential Height | |||
|---|---|---|---|---|
| N | 2.5th Percentile | 50th Percentile | 97.5th Percentile | |
| H-Class Cluster 1 | 9 | 0.878 | 0.895 | 0.910 |
| H-Class Cluster 2 | 4 | 0.915 | 0.926 | 0.935 |
| H-Class Cluster 3 | 21 | 0.906 | 0.914 | 0.920 |
| M-Class Cluster 1 | 8 | 0.920 | 0.932 | 0.942 |
| M-Class Cluster 2 | 22 | 0.852 | 0.865 | 0.877 |
| L-Class Cluster 1 | 11 | 0.898 | 0.907 | 0.916 |
| L-Class Cluster 2 | 26 | 0.847 | 0.862 | 0.877 |
| False Alarm Cluster 1 | 10 | 0.850 | 0.869 | 0.887 |
| False Alarm Cluster 2 | 11 | 0.800 | 0.817 | 0.834 |
Table 3.
Same as Table 2, but for 850-mb temperature.
Table 3.
Same as Table 2, but for 850-mb temperature.
| Cluster Name | 850-mb Temperature | |||
|---|---|---|---|---|
| N | 2.5th Percentile | 50th Percentile | 97.5th Percentile | |
| H-Class Cluster 1 | 9 | 0.800 | 0.827 | 0.849 |
| H-Class Cluster 2 | 4 | 0.896 | 0.907 | 0.917 |
| H-Class Cluster 3 | 21 | 0.857 | 0.868 | 0.878 |
| M-Class Cluster 1 | 8 | 0.847 | 0.871 | 0.891 |
| M-Class Cluster 2 | 22 | 0.784 | 0.800 | 0.816 |
| L-Class Cluster 1 | 11 | 0.821 | 0.844 | 0.865 |
| L-Class Cluster 2 | 26 | 0.766 | 0.782 | 0.796 |
| False Alarm Cluster 1 | 10 | 0.750 | 0.772 | 0.795 |
| False Alarm Cluster 2 | 11 | 0.789 | 0.819 | 0.845 |
Table 4.
Same as Table 2, but for near-surface specific humidity.
Table 4.
Same as Table 2, but for near-surface specific humidity.
| Cluster Name | 2-m Specific Humidity | |||
|---|---|---|---|---|
| N | 2.5th Percentile | 50th Percentile | 97.5th Percentile | |
| H-Class Cluster 1 | 9 | 0.828 | 0.839 | 0.850 |
| H-Class Cluster 2 | 4 | 0.852 | 0.869 | 0.885 |
| H-Class Cluster 3 | 21 | 0.853 | 0.861 | 0.871 |
| M-Class Cluster 1 | 8 | 0.886 | 0.896 | 0.905 |
| M-Class Cluster 2 | 22 | 0.792 | 0.801 | 0.809 |
| L-Class Cluster 1 | 11 | 0.841 | 0.853 | 0.865 |
| L-Class Cluster 2 | 26 | 0.791 | 0.806 | 0.820 |
| False Alarm Cluster 1 | 10 | 0.778 | 0.794 | 0.808 |
| False Alarm Cluster 2 | 11 | 0.826 | 0.841 | 0.856 |
© 2019 by the authors. Licensee MDPI, Basel, Switzerland. This article is an open access article distributed under the terms and conditions of the Creative Commons Attribution (CC BY) license (http://creativecommons.org/licenses/by/4.0/).
Share and Cite
MDPI and ACS Style
Mercer, A.; Bates, A. Meteorological Differences Characterizing Tornado Outbreak Forecasts of Varying Quality. Atmosphere 2019, 10, 16. https://doi.org/10.3390/atmos10010016
AMA Style
Mercer A, Bates A. Meteorological Differences Characterizing Tornado Outbreak Forecasts of Varying Quality. Atmosphere. 2019; 10(1):16. https://doi.org/10.3390/atmos10010016
Chicago/Turabian StyleMercer, Andrew, and Alyssa Bates. 2019. "Meteorological Differences Characterizing Tornado Outbreak Forecasts of Varying Quality" Atmosphere 10, no. 1: 16. https://doi.org/10.3390/atmos10010016
Note that from the first issue of 2016, this journal uses article numbers instead of page numbers. See further details here.