Crohn’s Disease Patients in Remission Display an Enhanced Intestinal IgM+ B Cell Count in Concert with a Strong Activation of the Intestinal Complement System


Abstract
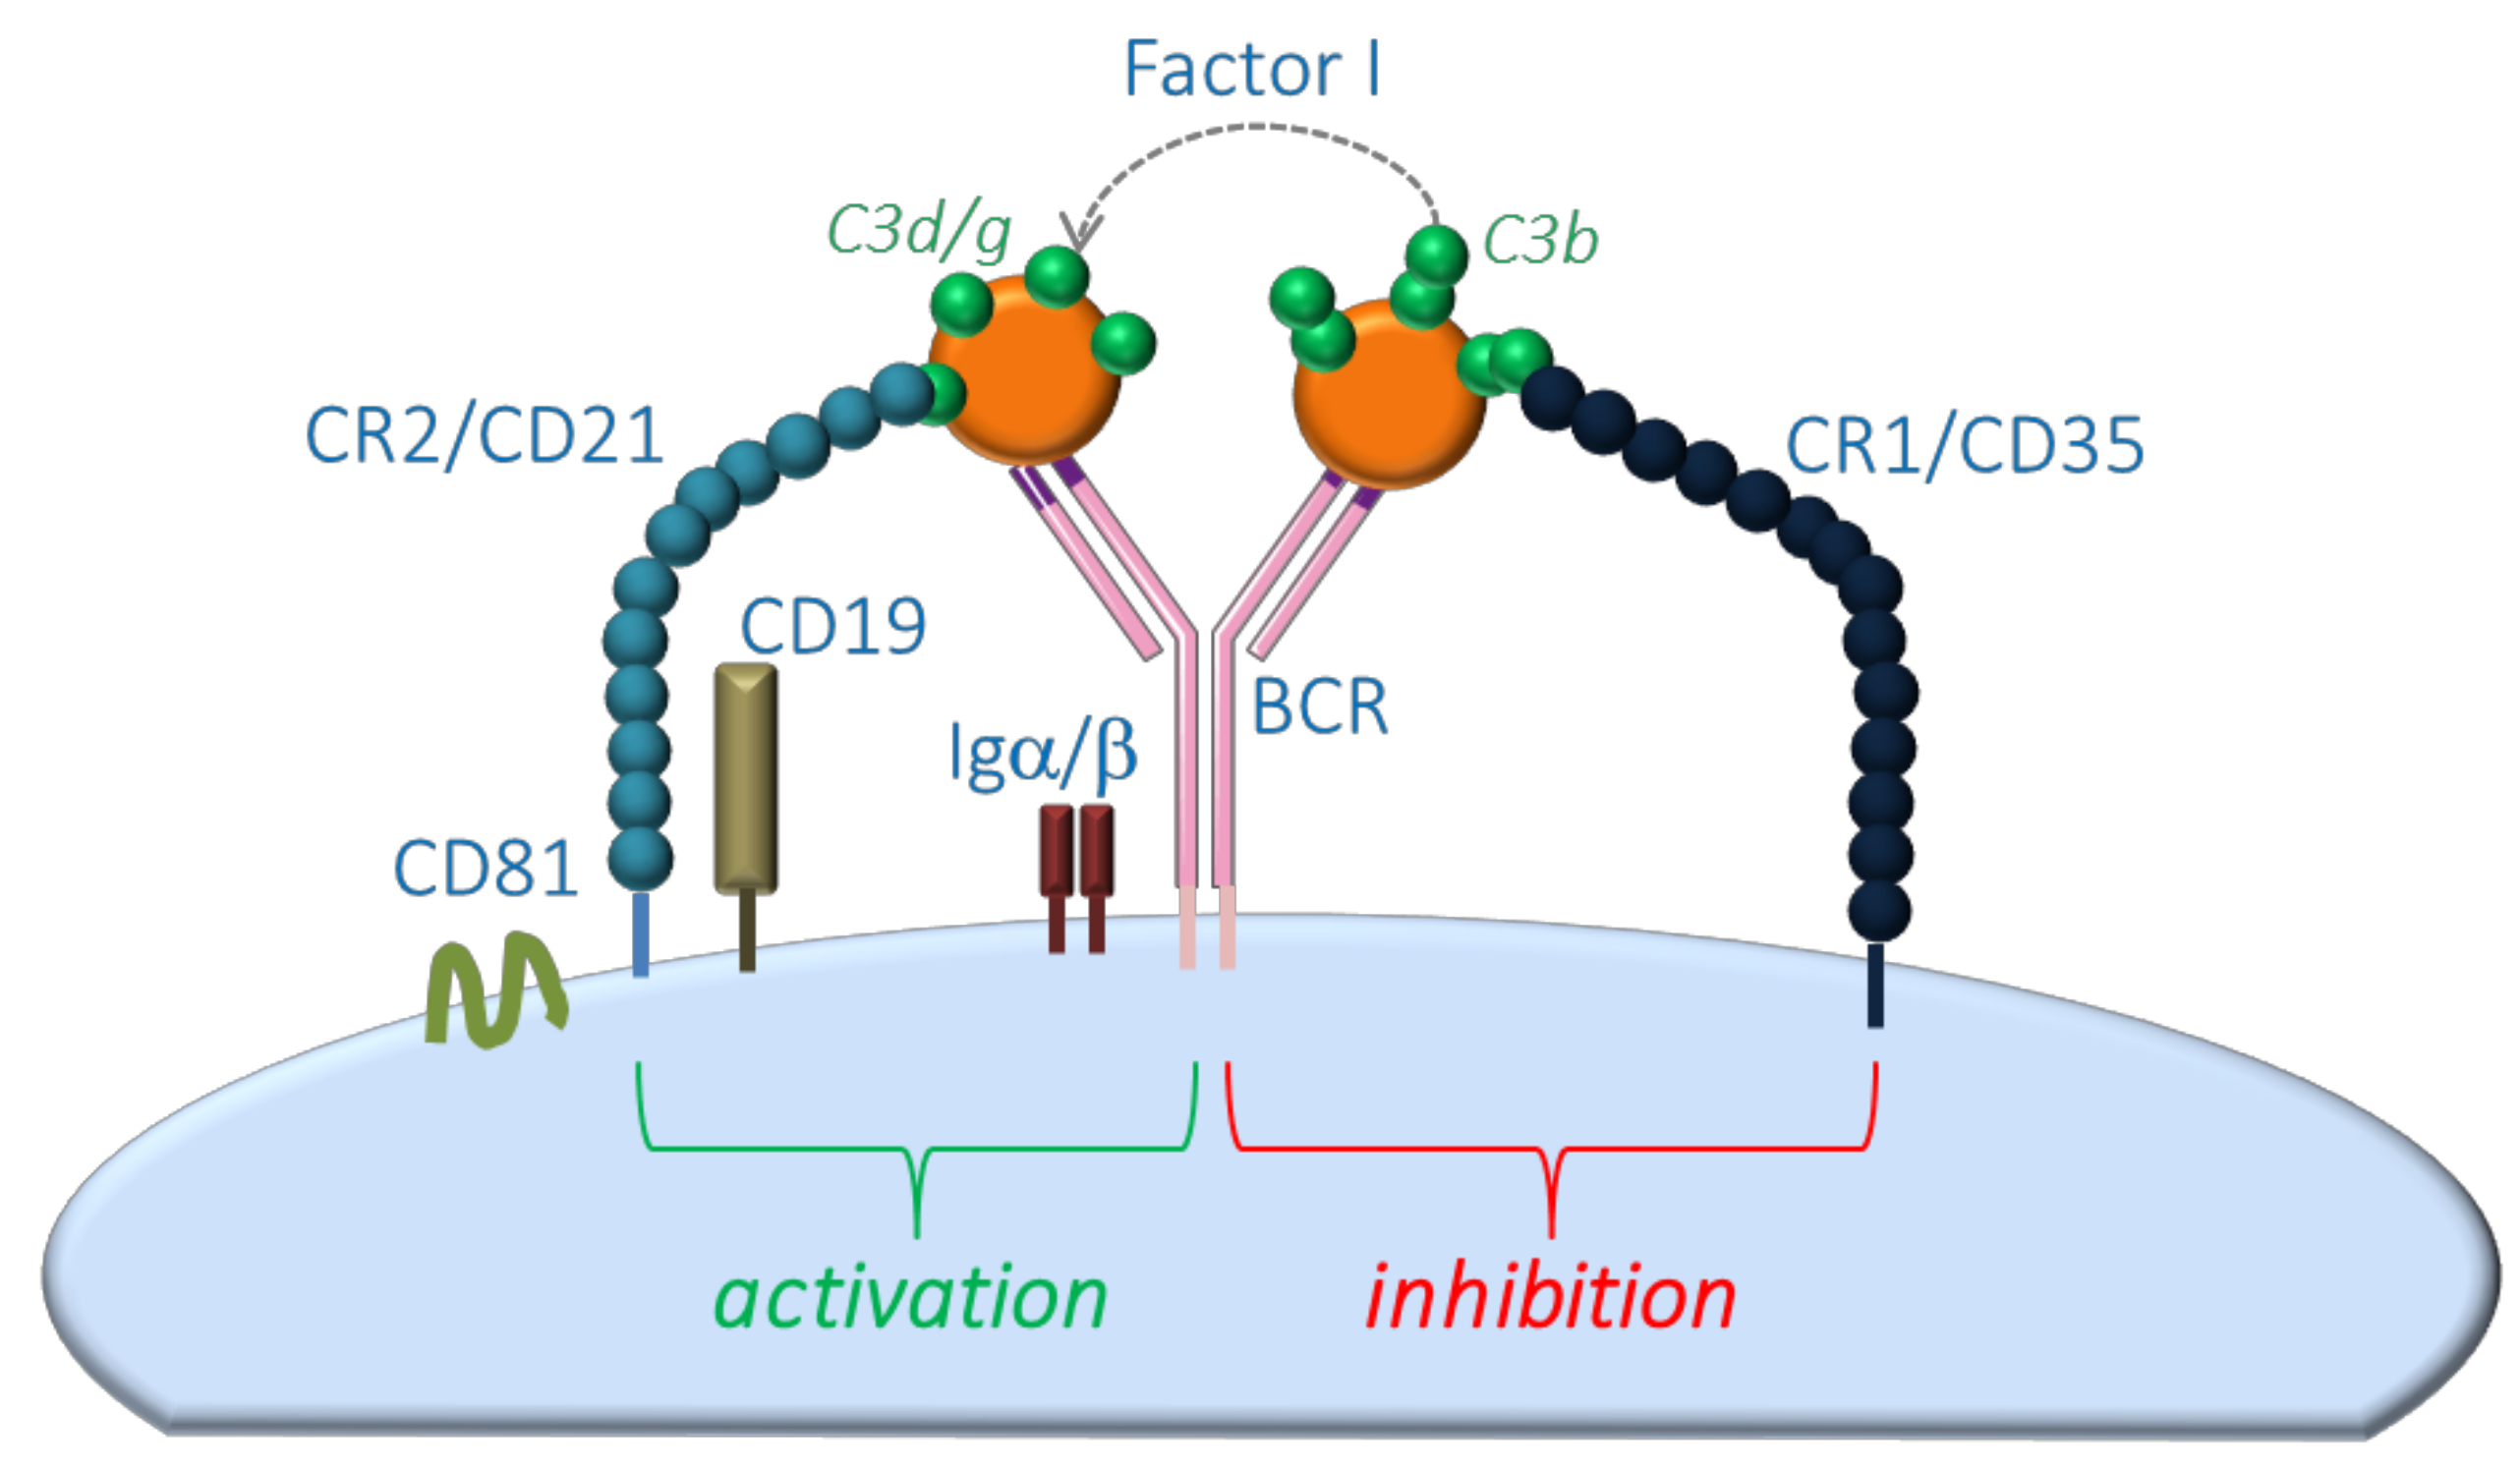
:1. Introduction
2. Materials and Methods
2.1. Study Population
2.2. RNA Extraction and Real-Time Quantitative PCR
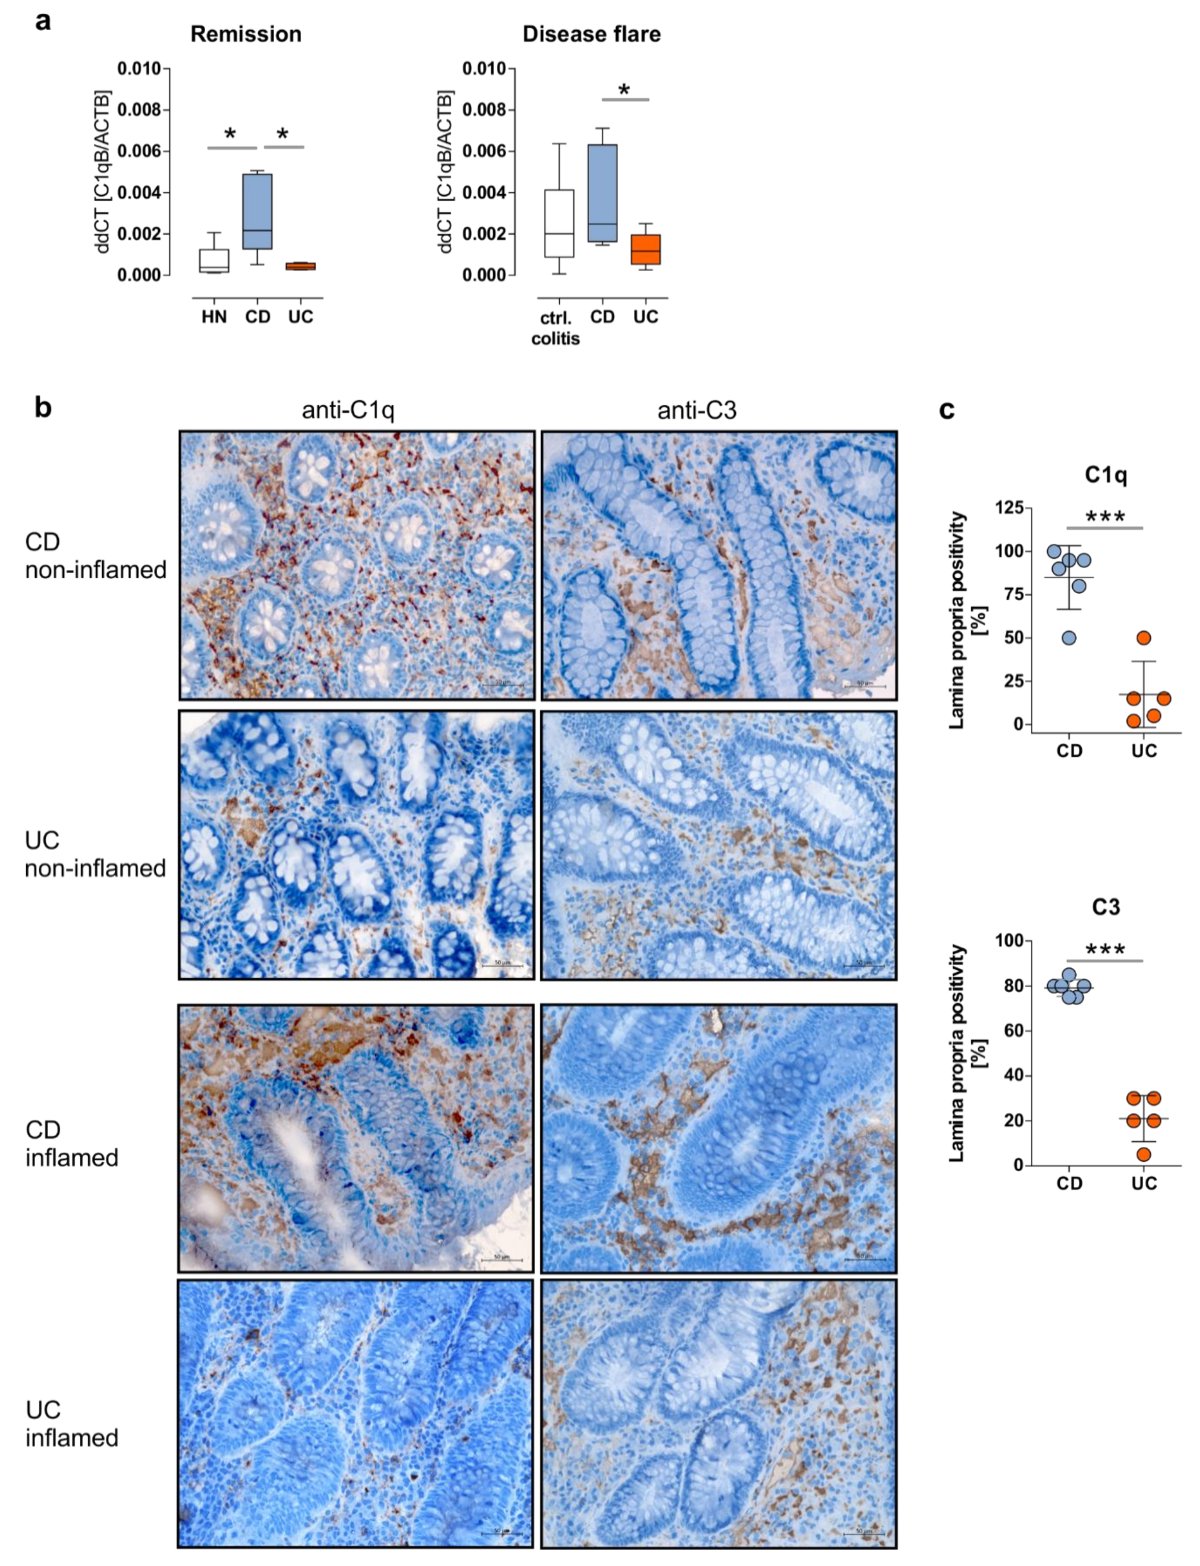
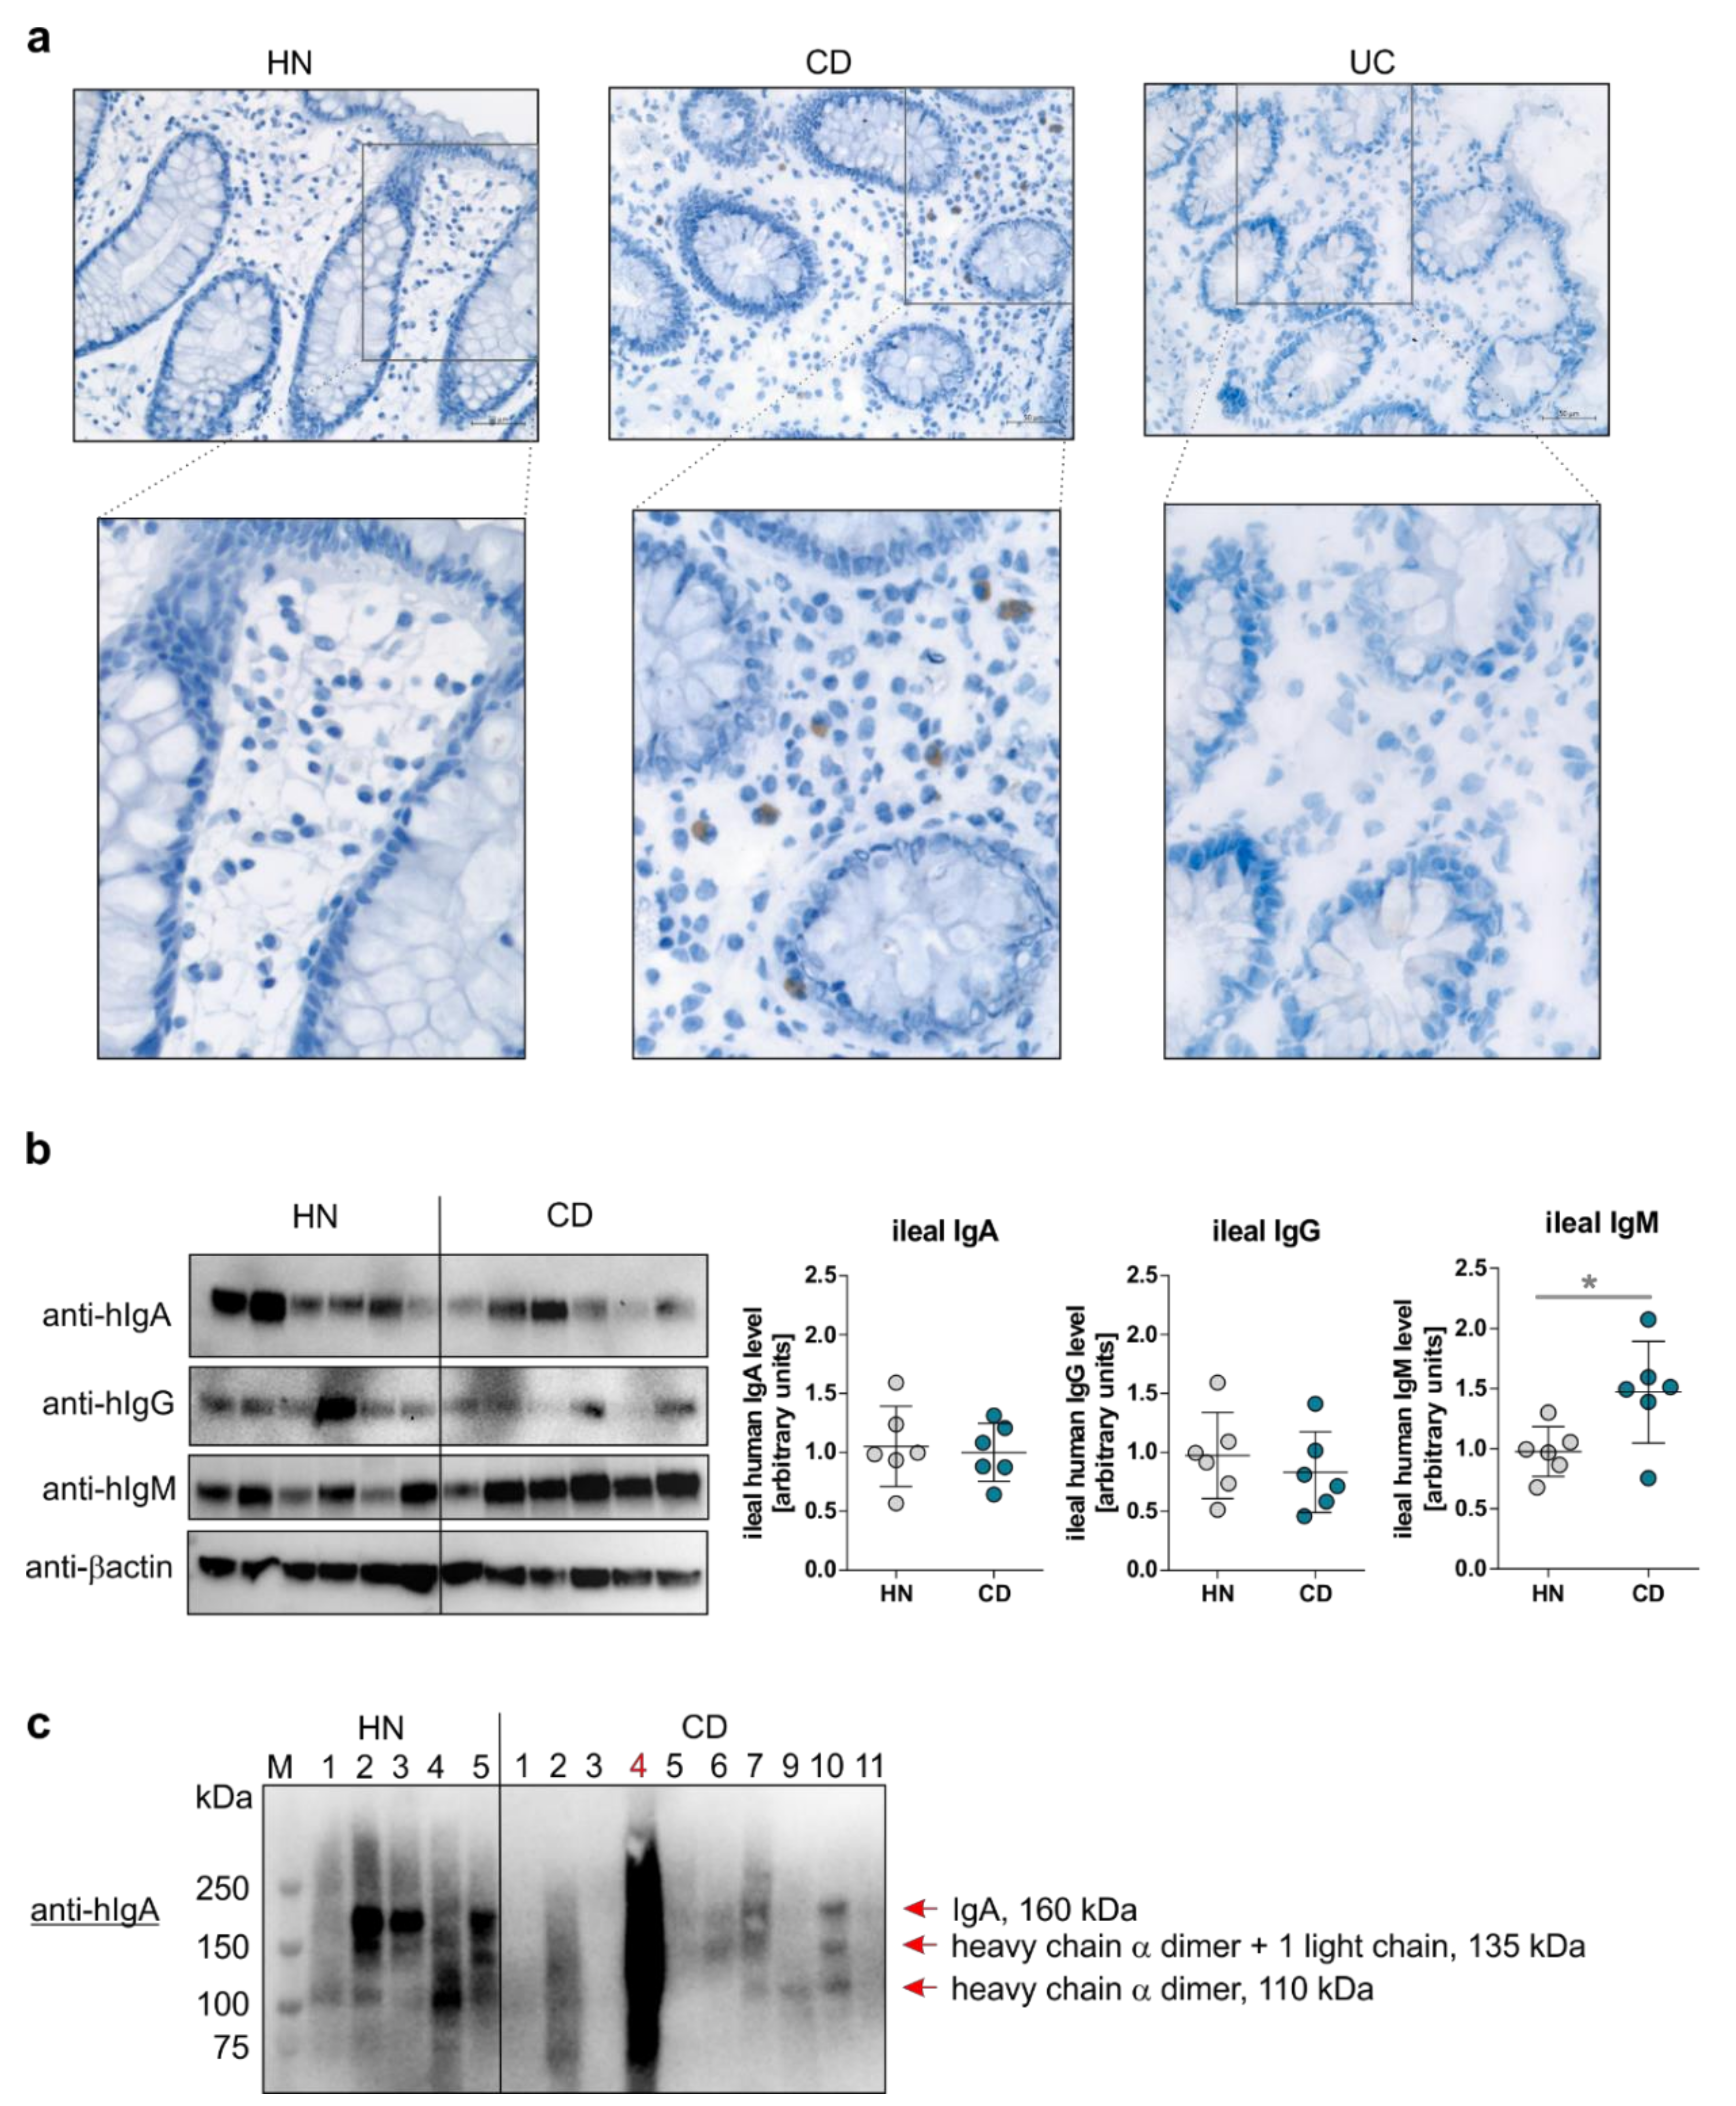
2.3. Immunohistochemistry
2.4. SDS-PAGE and Immunoblotting
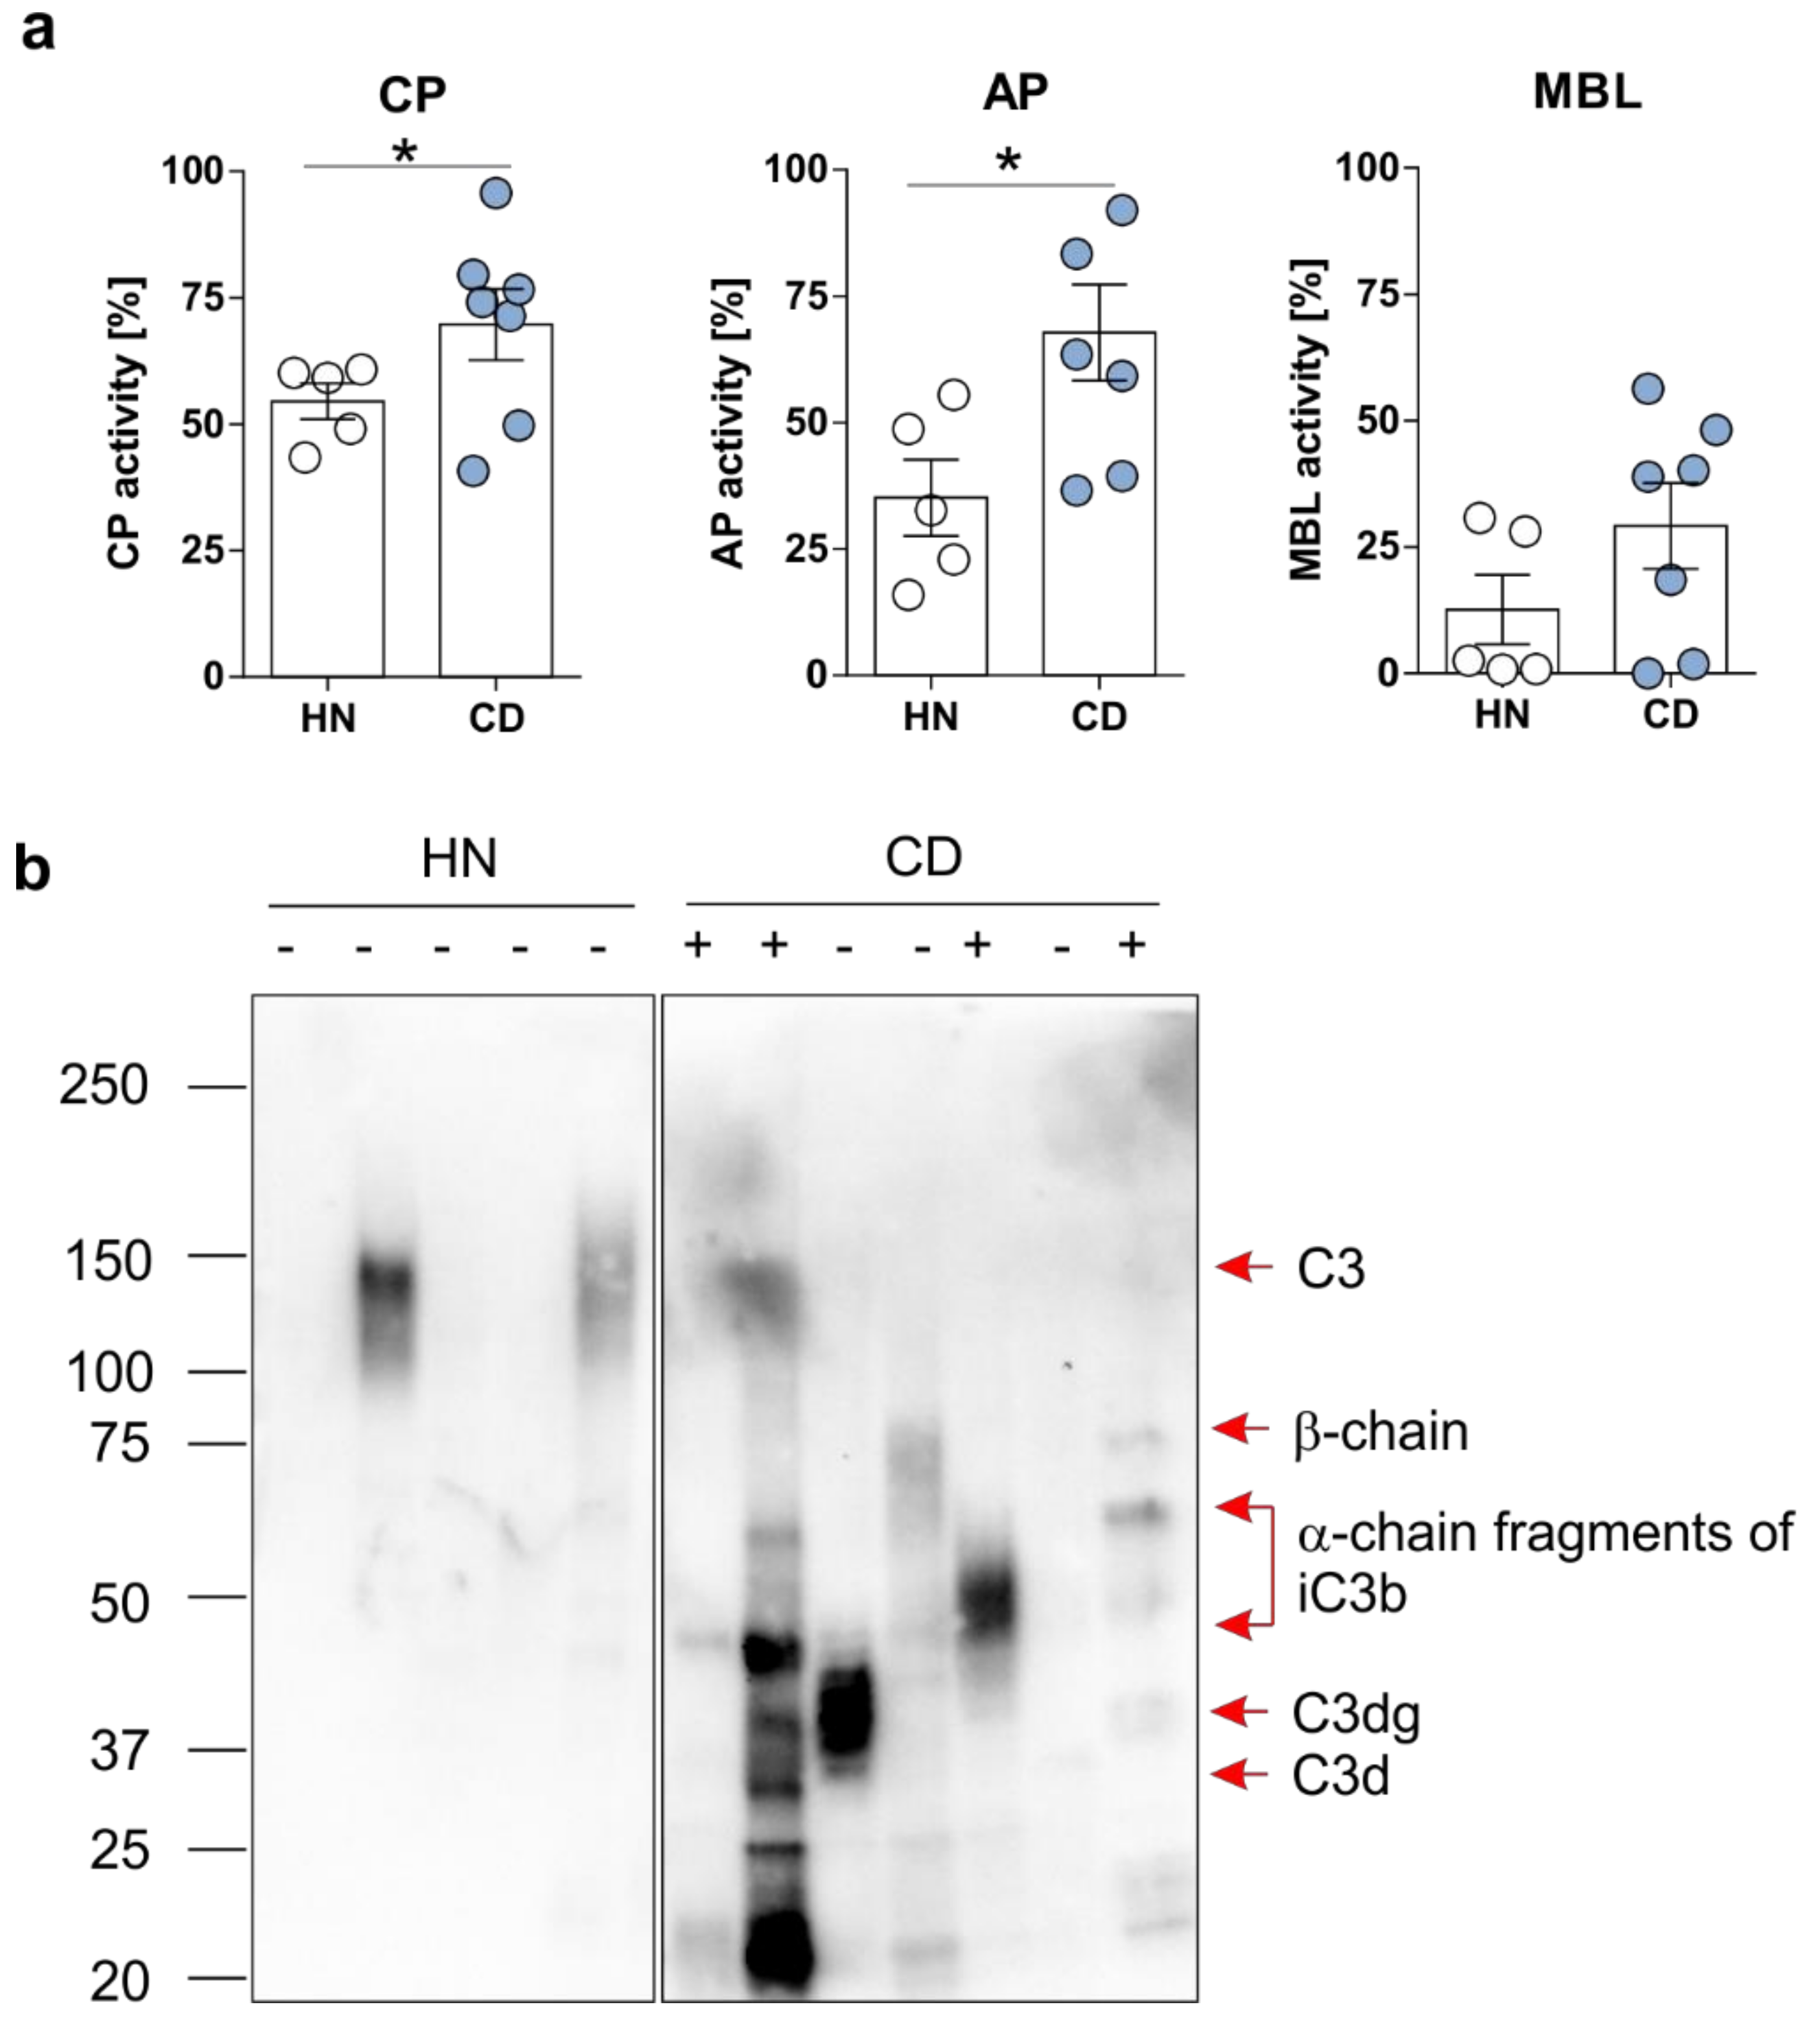
2.5. WIESLAB® Complement Screen Assay
2.6. Statistical Analysis
3. Results
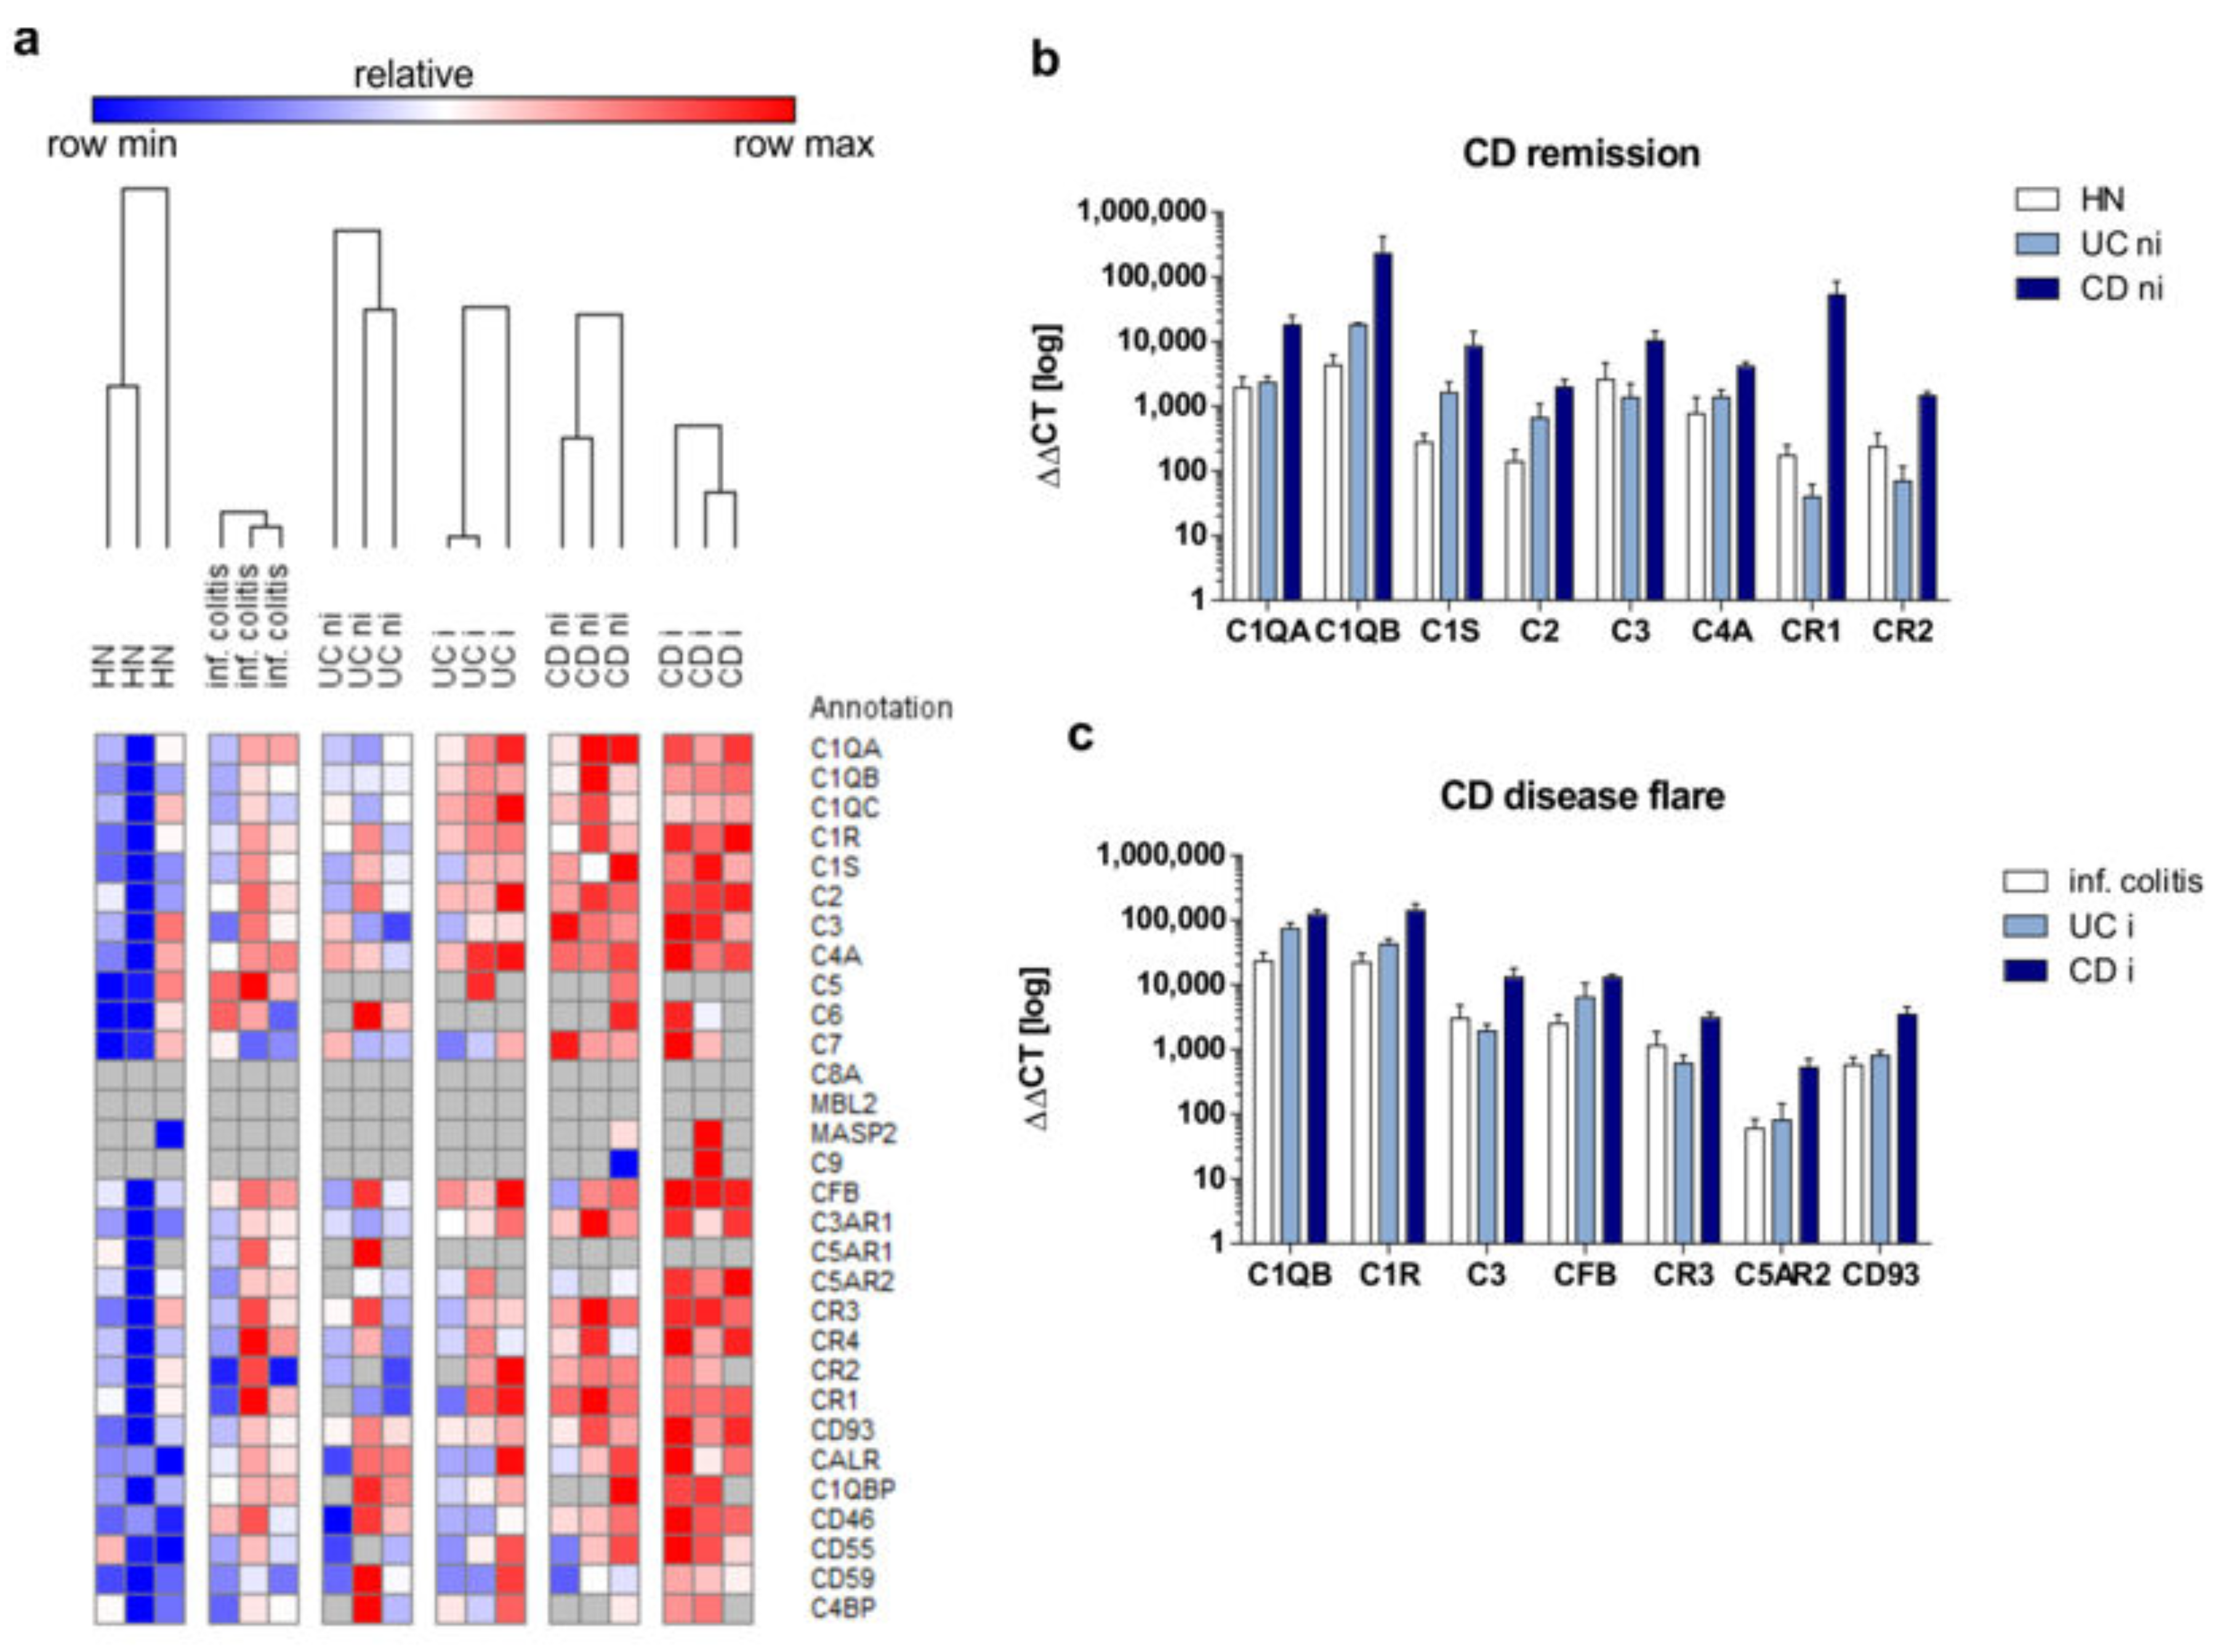
3.1. Crohn’s Disease Patients in Remission Display an Upregulation of the Intestinal Complement System
3.2. Enhanced Activation of the Complement System Can be Monitored in Serum and Feces Samples in CD Patients
3.3. The Mucosal B Cell Compartment is Overrepresented Exclusively in CD Patients in Remission
4. Discussion
Author Contributions
Funding
Acknowledgement
Conflicts of Interest
References
- Ricklin, D.; Hajishengallis, G.; Yang, K.; Lambris, J.D. Complement: A key system for immune surveillance and homeostasis. Nat. Immunol. 2010, 11, 785–797. [Google Scholar] [CrossRef] [PubMed]
- Sina, C.; Kemper, C.; Derer, S. The intestinal complement system in inflammatory bowel disease: Shaping intestinal barrier function. Semin. Immunol. 2018, 37, 66–73. [Google Scholar] [CrossRef] [PubMed]
- Jostins, L.; Ripke, S.; Weersma, R.K.; Duerr, R.H.; McGovern, D.P.; Hui, K.Y.; Lee, J.C.; Schumm, L.P.; Sharma, Y.; Anderson, C.A.; et al. Host-microbe interactions have shaped the genetic architecture of inflammatory bowel disease. Nature 2012, 491, 119–124. [Google Scholar] [CrossRef] [PubMed]
- Rosenstiel, P.; Sina, C.; Franke, A.; Schreiber, S. Towards a molecular risk map--recent advances on the etiology of inflammatory bowel disease. Semin. Immunol. 2009, 21, 334–345. [Google Scholar] [CrossRef]
- Michaels, M.A.; Jendrek, S.T.; Korf, T.; Nitzsche, T.; Teegen, B.; Komorowski, L.; Derer, S.; Schroder, T.; Baer, F.; Lehnert, H.; et al. Pancreatic Autoantibodies Against CUZD1 and GP2 Are Associated with Distinct Clinical Phenotypes of Crohn’s Disease. Inflamm. Bowel Dis. 2015, 21, 2864–2872. [Google Scholar] [CrossRef] [PubMed]
- Derer, S.; Beurskens, F.J.; Rosner, T.; Peipp, M.; Valerius, T. Complement in antibody-based tumor therapy. Crit. Rev. Immunol. 2014, 34, 199–214. [Google Scholar] [CrossRef] [PubMed]
- Halstensen, T.S.; Mollnes, T.E.; Garred, P.; Fausa, O.; Brandtzaeg, P. Surface epithelium related activation of complement differs in Crohn’s disease and ulcerative colitis. Gut 1992, 33, 902–908. [Google Scholar] [CrossRef]
- Hodgson, H.J.; Potter, B.J.; Jewell, D.P. C3 metabolism in ulcerative colitis and Crohn’s disease. Clin. Exp. Immunol. 1977, 28, 490–495. [Google Scholar]
- Johswich, K.; Martin, M.; Bleich, A.; Kracht, M.; Dittrich-Breiholz, O.; Gessner, J.E.; Suerbaum, S.; Wende, E.; Rheinheimer, C.; Klos, A. Role of the C5a receptor (C5aR) in acute and chronic dextran sulfate-induced models of inflammatory bowel disease. Inflamm. Bowel Dis. 2009, 15, 1812–1823. [Google Scholar] [CrossRef]
- Elvington, M.; Schepp-Berglind, J.; Tomlinson, S. Regulation of the alternative pathway of complement modulates injury and immunity in a chronic model of dextran sulphate sodium-induced colitis. Clin. Exp. Immunol. 2015, 179, 500–508. [Google Scholar] [CrossRef] [Green Version]
- Berstad, A.E.; Brandtzaeg, P. Expression of cell membrane complement regulatory glycoproteins along the normal and diseased human gastrointestinal tract. Gut 1998, 42, 522–529. [Google Scholar] [CrossRef] [PubMed] [Green Version]
- Inaba, T.; Mizuno, M.; Ohya, S.; Kawada, M.; Uesu, T.; Nasu, J.; Takeuchi, K.; Nakagawa, M.; Okada, H.; Fujita, T.; et al. Decay-accelerating factor (DAF) in stool specimens as a marker of disease activity in patients with ulcerative colitis (UC). Clin. Exp. Immunol. 1998, 112, 237–241. [Google Scholar] [CrossRef] [PubMed] [Green Version]
- Sünderhauf, A.; Skibbe, K.; Preisker, S.; Ebbert, K.; Verschoor, A.; Karsten, C.M.; Kemper, C.; Huber-Lang, M.; Basic, M.; Bleich, A.; et al. Regulation of epithelial cell expressed C3 in the intestine—Relevance for the pathophysiology of inflammatory bowel disease? Mol. Immunol. 2017, 90, 227–238. [Google Scholar] [CrossRef] [PubMed]
- Palmela, C.; Chevarin, C.; Xu, Z.; Torres, J.; Sevrin, G.; Hirten, R.; Barnich, N.; Ng, S.C.; Colombel, J.F. Adherent-invasive Escherichia coli in inflammatory bowel disease. Gut 2018, 67, 574–587. [Google Scholar] [CrossRef] [PubMed]
- Asgari, E.; Le Friec, G.; Yamamoto, H.; Perucha, E.; Sacks, S.S.; Kohl, J.; Cook, H.T.; Kemper, C. C3a modulates IL-1beta secretion in human monocytes by regulating ATP efflux and subsequent NLRP3 inflammasome activation. Blood 2013, 122, 3473–3481. [Google Scholar] [CrossRef] [PubMed]
- Ross, G.D.; Winchester, R.J.; Rabellino, E.M.; Hoffman, T. Surface markers of complement receptor lymphocytes. J. Clin. Investig. 1978, 62, 1086–1092. [Google Scholar] [CrossRef] [PubMed]
- Sieber, G.; Herrmann, F.; Zeitz, M.; Teichmann, H.; Ruhl, H. Abnormalities of B-cell activation and immunoregulation in patients with Crohn’s disease. Gut 1984, 25, 1255–1261. [Google Scholar] [CrossRef] [PubMed]
- Noronha, A.M.; Liang, Y.; Hetzel, J.T.; Hasturk, H.; Kantarci, A.; Stucchi, A.; Zhang, Y.; Nikolajczyk, B.S.; Farraye, F.A.; Ganley-Leal, L.M. Hyperactivated B cells in human inflammatory bowel disease. J. Leukoc. Biol. 2009, 86, 1007–1016. [Google Scholar] [CrossRef] [PubMed] [Green Version]
- Schreiber, S.; MacDermott, R.P.; Raedler, A.; Pinnau, R.; Bertovich, M.J.; Nash, G.S. Increased activation of isolated intestinal lamina propria mononuclear cells in inflammatory bowel disease. Gastroenterology 1991, 101, 1020–1030. [Google Scholar] [CrossRef]
- Timmermans, W.M.; van Laar, J.A.; van der Houwen, T.B.; Kamphuis, L.S.; Bartol, S.J.; Lam, K.H.; Ouwendijk, R.J.; Sparrow, M.P.; Gibson, P.R.; van Hagen, P.M.; et al. B-Cell Dysregulation in Crohn’s Disease Is Partially Restored with Infliximab Therapy. PLoS ONE 2016, 11, e0160103. [Google Scholar] [CrossRef] [PubMed]
- Croix, D.A.; Ahearn, J.M.; Rosengard, A.M.; Han, S.; Kelsoe, G.; Ma, M.; Carroll, M.C. Antibody response to a T-dependent antigen requires B cell expression of complement receptors. J. Exp. Med. 1996, 183, 1857–1864. [Google Scholar] [CrossRef] [PubMed] [Green Version]
- Fearon, D.T.; Carter, R.H. The CD19/CR2/TAPA-1 complex of B lymphocytes: Linking natural to acquired immunity. Annu. Rev. Immunol. 1995, 13, 127–149. [Google Scholar] [CrossRef] [PubMed]
- Jozsi, M.; Prechl, J.; Bajtay, Z.; Erdei, A. Complement receptor type 1 (CD35) mediates inhibitory signals in human B lymphocytes. J. Immunol. 2002, 168, 2782–2788. [Google Scholar] [CrossRef] [PubMed]
- Hivroz, C.; Fischer, E.; Kazatchkine, M.D.; Grillot-Courvalin, C. Differential effects of the stimulation of complement receptors CR1 (CD35) and CR2 (CD21) on cell proliferation and intracellular Ca2+ mobilization of chronic lymphocytic leukemia B cells. J. Immunol. 1991, 146, 1766–1772. [Google Scholar] [PubMed]
- Nielsen, C.H.; Pedersen, M.L.; Marquart, H.V.; Prodinger, W.M.; Leslie, R.G. The role of complement receptors type 1 (CR1, CD35) and 2 (CR2, CD21) in promoting C3 fragment deposition and membrane attack complex formation on normal peripheral human B cells. Eur. J. Immunol. 2002, 32, 1359–1367. [Google Scholar] [CrossRef] [Green Version]
- Molina, H.; Holers, V.M.; Li, B.; Fung, Y.; Mariathasan, S.; Goellner, J.; Strauss-Schoenberger, J.; Karr, R.W.; Chaplin, D.D. Markedly impaired humoral immune response in mice deficient in complement receptors 1 and 2. Proc. Natl. Acad. Sci. USA 1996, 93, 3357–3361. [Google Scholar] [CrossRef] [PubMed]
- Ahearn, J.M.; Fischer, M.B.; Croix, D.; Goerg, S.; Ma, M.; Xia, J.; Zhou, X.; Howard, R.G.; Rothstein, T.L.; Carroll, M.C. Disruption of the Cr2 locus results in a reduction in B-1a cells and in an impaired B cell response to T-dependent antigen. Immunity 1996, 4, 251–262. [Google Scholar] [CrossRef]
- Tenner, A.J.; Cooper, N.R. Identification of types of cells in human peripheral blood that bind C1q. J. Immunol. 1981, 126, 1174–1179. [Google Scholar] [PubMed]
- Daha, M.R.; Klar, N.; Hoekzema, R.; van Es, L.A. Enhanced Ig production by human peripheral lymphocytes induced by aggregated C1q. J. Immunol. 1990, 144, 1227–1232. [Google Scholar]
- Young, K.R., Jr.; Ambrus, J.L., Jr.; Malbran, A.; Fauci, A.S.; Tenner, A.J. Complement subcomponent C1q stimulates Ig production by human B lymphocytes. J. Immunol. 1991, 146, 3356–3364. [Google Scholar]
- Ohishi, K.; Kanoh, M.; Shinomiya, H.; Hitsumoto, Y.; Utsumi, S. Complement activation by cross-linked B cell-membrane IgM. J. Immunol. 1995, 154, 3173–3179. [Google Scholar] [PubMed]
- Engelberts, P.J.; Voorhorst, M.; Schuurman, J.; van Meerten, T.; Bakker, J.M.; Vink, T.; Mackus, W.J.; Breij, E.C.; Derer, S.; Valerius, T.; et al. Type I CD20 Antibodies Recruit the B Cell Receptor for Complement-Dependent Lysis of Malignant B Cells. J. Immunol. 2016, 197, 4829–4837. [Google Scholar] [CrossRef] [PubMed]
- Rossbacher, J.; Shlomchik, M.J. The B cell receptor itself can activate complement to provide the complement receptor 1/2 ligand required to enhance B cell immune responses in vivo. J. Exp. Med. 2003, 198, 591–602. [Google Scholar] [CrossRef] [PubMed]


| Male [n] | Female [n] | Disease Localization[n] | Biopsy Localization [n] | Medication [n] | ||
|---|---|---|---|---|---|---|
| qPCR TaqMan arrays [n = 18] | HN ctrl.Colitis | 2 2 | 1 1 | n.a. PC [2], PrC [1] | S [2], cd [1] S [3] | n.a. P [1], M [1] |
| CD_ni | 0 | 3 | PC [2], IC [1] | S [3] | P [2], Su [1], A [2], MD [1], CB [1] | |
| CD_i | 2 | 1 | PC [1], PrC [2] | S [3] | P [2], M [2], A [2], T [1] | |
| UC_ni | 1 | 2 | C [2], PrC [1] | S [3] | M [2], A [1] | |
| UC_i | 0 | 3 | PC [1], PrC [2] | S [3] | P [3], M [1], A [1], MD [2] | |
| qPCR C1qB [n = 38] | HN Ctrl. colitis CD_ni | 2 2 2 | 3 5 5 | n.a. C [7] IC [4], C [2], PC [1] | ct [2], cd [2], S [1] ce [1], ct [2], S [3], R [1] ca [2], ct [1], S [4] | CB [1] M [2], Su [1], MD [2], CB [2] P [3], B [1], M [4], Su [1], A [3], CP [1], MD [2], CB [1] |
| CD_i | 1 | 4 | IC [2], C [2], PC [1] | ce [1], ca [2], cd [1], S [1] | P [1], B [1], M [2], Su [1], A [3], Am [1], MD [2] | |
| UC_ni | 3 | 1 | C [2], PrC [2] | S [4] | P [1], M [2], A [3] | |
| UC_i | 5 | 5 | C [3], PC [6], PrC [1] | cd [2], S [7], R [1] | P [2], M [7], Su [1], A [4], MP [1] | |
| SDS- PAGE [n = 25] | HN CD_ni CD_i | 2 3 2 | 4 12 2 | n.a. I [2], IC [8], C [5] I [2], IC [2], PC [1] | ti [6], fe [5] ti [6], fe [9] fe [4] | n.a. P [3], B [1], M [7], Su [1], A [4], T [11], MD [1] B [1], M [1], T [1] |
| IHC [n = 25] | HN CD_ni CD_i UC_ni UC_i | n.a. 4 2 3 1 | n.a. 6 1 4 3 | n.a. I [1], IC [2], C [5], PC [2] C [1], PrC [1], PC [1] C [3], PrC [3], PC [1] C [1], PrC [1], PC [2] | S [1] ca [3], ct [2], S [4], R [1] ca [1], S [2] ti [1], ce [1], ca [1], cd [2], S [2] cd [2], S [2] | n.a. P [2], B [1], M [3], Su [2], A [3], MD [1], CB [1] P [1], M [2], Su [1], A [1] P [3], M [6], Su [1], A [4] P [2], M [3], Su [1], TL [1], MD [1], CB [1] |
| Complement ELISA [n = 13] | HN CD_ni | 3 5 | 3 2 | n.a. I [3], IC [3], C [1] | NHS [6] NHS [7] | n.a. P [1], B [1], M [4], A [2], T [7] |
© 2019 by the authors. Licensee MDPI, Basel, Switzerland. This article is an open access article distributed under the terms and conditions of the Creative Commons Attribution (CC BY) license (http://creativecommons.org/licenses/by/4.0/).
Share and Cite
Preisker, S.; Brethack, A.-K.; Bokemeyer, A.; Bettenworth, D.; Sina, C.; Derer, S. Crohn’s Disease Patients in Remission Display an Enhanced Intestinal IgM+ B Cell Count in Concert with a Strong Activation of the Intestinal Complement System. Cells 2019, 8, 78. https://doi.org/10.3390/cells8010078
Preisker S, Brethack A-K, Bokemeyer A, Bettenworth D, Sina C, Derer S. Crohn’s Disease Patients in Remission Display an Enhanced Intestinal IgM+ B Cell Count in Concert with a Strong Activation of the Intestinal Complement System. Cells. 2019; 8(1):78. https://doi.org/10.3390/cells8010078
Chicago/Turabian StylePreisker, Sophie, Ann-Kathrin Brethack, Arne Bokemeyer, Dominik Bettenworth, Christian Sina, and Stefanie Derer. 2019. "Crohn’s Disease Patients in Remission Display an Enhanced Intestinal IgM+ B Cell Count in Concert with a Strong Activation of the Intestinal Complement System" Cells 8, no. 1: 78. https://doi.org/10.3390/cells8010078