Copper Complexation by Dissolved Organic Matter in arid Soils: A Voltametric Study


Department of Chemistry and Biochemistry, University of Nevada Las Vegas, Las Vegas, NV 89154, USA
*
Author to whom correspondence should be addressed.
Environments 2018, 5(11), 125; https://doi.org/10.3390/environments5110125
Submission received: 24 October 2018
/
Revised: 15 November 2018
/
Accepted: 18 November 2018
/
Published: 20 November 2018
Abstract
:A voltammetric method was used to estimate the complexing capacity of water extracts from both desert soils sampled at the root zone of creosote and salt cedar plants, and in soils from interspace or background regions where no vegetative influence was apparent. The copper complexing capacity of water extracts of these desert soils was influenced by contact time and pH. In soils from the root zones of creosote and salt cedar plant, copper complexation capacities at pH 8 were from 5 µM to 60 µM after five min contact periods, while 18 h contact periods yielded copper complexation capacities of 40 µM–80 µM. Soils with no vegetative influence had copper complexing capacities of less the 2 µM. The copper complexing capacities of these soils are well correlated with the concentration of organic carbon in the water extract (r2 = 0.86). The abundance of soluble organic matter in the root zone of desert shrubs has the potential to control the solution speciation of Cu2+. The formation of soluble complexes should also have an important influence on the plant uptake and transport of copper, as well as other heavy metals in the root zones of desert shrubs and beyond.
1. Introduction
Considerable spatial heterogeneity in soil properties is apparent in many desert soils due to the accumulation of nutrients and organic matter in the surface soil under shrubs such as Larrea tridentate (creosote bush), Ambrosia dumosa (White bursage), and Lycium pallidum (pale desert-thorn). These structures are often referred to as fertile islands that tend to promote plant growth and retain water [1]. These fertile islands are common throughout southern Nevada and southern California. In addition to organic matter and nutrient retention, the macro pores formed by the root systems of woody shrubs may be an important conduit for downward water movement in desert soils [2]. Therefore, the structures of these fertile islands may be conducive to the mobilization and transport of heavy metals such as copper, lead, cadmium and zinc. The formation of fertile islands could have important implications for the management of contaminated soils in arid regions. The invasive species Tamarix ramosissima (saltcedar) can also be found throughout southern Nevada where sufficient water is constantly available. Salt cedar plants have also been reported to significantly alter soil properties forming islands of higher organic matter content, higher nutrient availability, and increased electrical conductivity [3,4].
The role of humic-like materials in the speciation of heavy metals has been examined for the last few decades using a variety of approaches. Humic materials have been proposed to provide chelating functionalities that impact the solubility and mobility of metals like copper, lead, cadmium, and zinc in natural waters, sediments, and soils [5,6]. Many publications have attested to the role of soluble and insoluble organic materials in the speciation and mobility of various metals [7,8,9]. The following work presents results that examine the influence of soluble organic matter in the root zones of desert shrubs such as the creosote bush and the saltceder on metal chemistry in arid soils. Previous studies have indicated that the creosote bush is capable of concentrating heavy metals and can therefore be used for phyto-remediation [10]. The solubilization of heavy metals in the root zone may play a role in the process of metal uptake.
Various experimental approaches have been developed to probe metal speciation, including dialysis, diffusion measurements, size exclusion chromatography, and potentiometry with ion specific electrodes [11,12,13,14,15]. One of the most utilized approaches for metal speciation in the environment is voltammetry (anodic stripping or competitive ligand cathodic stripping), because with voltammetry, metals such as lead and copper can be routinely measured at low concentrations, i.e., 10−8 M to 10−6 M and under [16,17,18]. This concentration range is close to what might reasonably be expected to be encountered in the environment. In addition to relatively low detection limits, voltammetric techniques can often be utilized to gain insight into metal speciation.
Anodic stripping voltammetry (ASV) is an analytical method whereby metal analytes are deposited on a cathode (at low potential) and then stripped off the electrode by programming the electrode (now the anode) from low to high potential. The current versus applied potential is recorded during the anodic scan. The oxidation of the previously deposited metals during the positive potential scan produces peaks on this voltammagram, the size of which (height or area) corresponds to the non-organically complexed concentration of the metal in the solution. With prolonged deposition and various stripping techniques (differential pulse or square wave), detection limits can be very low, and in general, may be limited by inherent blank concentrations due to low levels of metals in analytical reagents or laboratory dust. Various electrodes have been utilized for this type of analysis, including glassy carbon, gold, mercury thin film, and mercury drop. The static mercury drop electrode (SMDE) or hanging mercury drop electrode appears to be well suited for these experiments, as a new mercury drop can be used for each measurement. This helps to minimize the effect of electrode fouling on measurements [19]. With solid electrodes, fouling by deposition of humic material can be a major complication [20,21]. In addition, with the static mercury drop electrode, a very broad range of pH values can be examined.
Voltammetric techniques can be utilized for detection of a complexing agent (natural or contaminant) provided that the complexing agent impacts the reduction rate of the metal during the deposition phase of the experiment. Some complexes, for example, may be inert with respect to deposition (at a given potential), or have very low rates of dissociation. Some complexes may be of high molecular weight and have a significantly lower diffusion coefficient than the uncomplexed or inorganically-complexed metal species [22]. Because of the lower diffusion coefficient, the metal will experience an attenuated deposition rate, and therefore, have an attenuated voltammetry signal. Ligands are quantified by a titration of the sample with the metal of interest, with the “end point” detected by a distinct change in metal response for a given deposition time and deposition voltage. The impact of kinetics and diffusion on voltammetric titrations has been discussed in detail [23].
2. Materials and Methods
2.1. Chemicals and Soil Samples
Water was obtained from a Barnstead nanopure water system (model D4741). All reagents used were of ACS grade or better and employed without further purification. Copper standards were prepared by dilution of 1000 ppm atomic absorption standards purchased from VWR Scientific (Visalia, CA, USA). Disodium ethylenediaminetetraacetic acid (EDTA) was obtained from JT Baker Chemicals (Allentown, PA, USA). Histidine and aspartic acid were from Sigma-Aldrich (St. Louis, MO, USA). Humic acid was obtained from TeraVita (Lancaster, PA, USA). This commercially-available humic material was prepared from Leonardite and is marketed as a soil amendment (TeraVita product information). Dimethyldichlorosilane was obtained from Alpha Aesar (Haverhill, MA, USA).
HEPES (4-(2-hydroxyethyl)-1-piperazineethanesulfonic acid), MOPS (3-(N-morpholino) propanesulfonic acid), MES (2-(N-morpholino) ethanesulfonic acid), PIPES (Piperazine-N,N′-bis(2-ethanesulfonic acid)) were purchased from Sigma Aldrich. Acetic acid and hydrochloric acid were obtained from Baker. Buffer concentrations were 0.1 M with 1 M NaNO3 added as a background electrolyte. For example the HEPES pH 8 buffer was prepared by weighing out HEPES sodium salt to make a 0.100 M solution upon dilution. Similarly enough, NaNO3 was weighed out so that the final solution was 1.00 M in NaNO3. The buffer salt was titrated to pH 8 with 6 M HCl and then diluted to volume. MOPs pH 7, MES pH 6.15, and acetate (sodium acetate) were prepared the same way. Generally, 1.0 mL of the buffer was added to 15.0 mL of soil extract. The pH of the solution was verified be within 0.05 pH units of the buffer with a pH meter calibrated with NIST standard buffers.
Titration experiments were performed with a commercial humic acid that is almost completely water soluble. The product elemental composition was available from the manufacturer and is reported to be 56% carbon. A 100.0 mg of the material was dissolved in 50.0 mL of distilled water. The solution was centrifuged to remove insoluble material, filtered through a 1 µm glass fiber filter, and then diluted to 1.0 L.
Samples were retrieved from soil beneath plants growing at the Three Kids Mine in Henderson, NV, the Lake Mead National Recreation Area, and from a roadside location in Halloran Springs California. The Three Kids Mine is an abandoned manganese mine located on the eastern border of the City of Henderson [24]. This site has numerous tailings and ore processing facilities. The concentrations of metals in soil from this site have been investigated using x-ray fluorescence by Park et al., (2014) [24]. Results showed that tailings at the Three Kids Mine contain high levels of lead, arsenic, and manganese. Park et al. examined potential wind driven transport from the mine site to surrounding residential areas. Sims and Keller (2014) [25] have examined the leachability of various elements from soils sampled from the Three Kids Mine by water and water amended with chemical fertilizer. Their results indicate the potential for the partial mobilization for some elements; however, the influence of vegetation was not examined in this study. The Halloran Springs sampling site was located near a major highway linking the Las Vegas Nevada metropolitan area to the Southern California. To our knowledge, this site has never been investigated. The third sampling location in the Lake Mead National Recreation Area is not located near any potential anthropogenic sources of metals or metalloids, and has not been the subject of any previously-published investigation. The top 16 cm of soil was sampled with an 8.8 cm diameter soil auger. Samples were taken from under the plant canopy and as close to the tap root as possible. All soils samples were air dried before extraction.
Generally, water soluble organic matter in soil samples was extracted by adding 50.0 mL of water to 1.0 g of air dried soil in a polypropylene centrifuge tube. The tube was then placed in a Lab-line multi-wrist shaker for 18 h with the shake rate adjusted to ~300 rpm. After 18 h, the tubes were centrifuged at ~3000 rpm and the supernatant filtered through a 1 µ glass fiber filter. For some samples, 10.0 g of soil was extracted with 1000 mL of water by shaking for 18 h using the Lab-line multi-wrist shaker.
2.2. Instrumentation
A CHI (Austin, TX, USA) model 660A potentiostat in conjunction with a BASi MF-9058 Controlled Growth Mercury Electrode Cell stand with magnetic stirrer and gas purge utilities was used for all measurements. The Controlled Growth Mercury Electrode was equipped with 150 µm glass capillary and was used in the static mercury electrode mode. A platinum wire served as the auxiliary electrode and an Ag/AgCl reference electrode was employed for all measurements. The test solutions were stirred using a Teflon™ coated stir bar. All measurements were carried out using an MF-1084 glass cell manufactured by BASi. The glass cell was washed first with Alkonox™ and then exhaustively rinsed with distilled water. The vessels were then soaked in concentrated nitric acid and again rinsed with distilled water and oven dried at 110 °C. In order to minimize the adsorption of metals, the vessel was silanized by immersion in 5% dichlorodimethylsilane in toluene for approximately one hour. The vessel was then rinsed with methanol and dried at 40 °C. Silanization treatment was repeated before each titration.
2.3. Voltammetry
A 15.0 mL aliquot of sample was placed into the cleaned and silanized glass titration vessel. A 1.0 mL aliquot of 0.1 M buffer was added, and the sample was placed on the “cell stand” and purged for 15 min before staring the titration experiment. Copper stock solutions used for titration were generally in the concentration range of 10 ppm to 200 ppm. Addition of titrant was made with a calibrated micropipette.
After purging, a new mercury drop (size 14 on BASi console) was extruded from the cell stand, and deposition was initiated at a previously-designated deposition voltage (−0.25 V, −0.4 V or −0.70 V) for (generally) 4 min while stirring at 400 rpm. After a 10 s rest at the deposition potential, the deposited metal was stripped by scanning from −1.0 V to 0 V using the square wave technique. A variation on this stripping techniques was utilized for many of the titrations reported herein. This method is similar to the approach outlined by Stara and Kopanica (1993) [26]. After the four min deposition, the electrode (mercury drop) was allowed to rest for 10 s before the voltage was changed to 0 V. This voltage switch results in the oxidation of previously-deposited metal, which is now concentrated near the mercury drop surface. A square wave reductive scan was immediately performed to reduce the previously-deposited metals still located very close to the electrode surface. The reduction current was recorded to quantify the previously-concentrated metals. This approach has been referred to as reduction from a pre-enriched solution by Yarnistsky and Ariel (1965) [27]. The square wave reduction or oxidative scans were performed in 4 mV increments. The square wave amplitude was set to 30 mV and the square wave frequency to 60 Hz.
Two types of titrations were performed during the course of this study. These titrations differ principally by the contact time allowed after addition of copper or other metals added to the solution. Titrations were first performed by adding small increments of the 10 ppm to 200 ppm stock solutions of copper as Cu2+ to the sample. The copper addition was allowed to “equilibrate” for 5 min before voltammetry (anodic stripping or the alternative pre-enrichment method). The procedure was continued until the apparent binding capacity of the sample was exceeded, as evidenced by the change in the response (slope) of the titration curve after saturation of the complexing capacity of the sample. For a number of samples, the stripping method was repeated hourly for ~20 h after the last addition of copper. It was observed that the unbound copper signal decreased significantly over this time period. The copper sequestration generally stabilized by 6–12 h. This indicated that the five min contact was not sufficient for complete equilibration. Therefore, experiments were preformed where sufficient copper was added to the buffered samples so that the total copper concentration exceeded the 5 min contact time binding capacity by 10% to 50%. The samples were then allowed to equilibrate for ~18 h, and titrated with additional increments of copper solution. These titrations resulted in a single linear region where the response line intercepted the concentration axis at the apparent copper binding capacity of the sample (see figures in the results section).
Pseudo polarography experiments were also performed as a part of this investigation. In pseudo polarography, a series of deposition experiments using the conditions outlined above but at constant total metal concentrations are carried out at increasing negative deposition potentials. The resultant peak areas for a particular metal (such as copper) are then graphed against deposition potential and the data are combined to construct the pseudo-polarogram.
2.4. Organic Carbon Analysis
The total organic carbon (TOC) content of the soil water extracts was measured using a Hach DR3900 spectrophotometer and Hach colorimetric “test n tube” TOC kits. Two different Hach TOC kits were used and both yielded similar results. The first TOC kit corresponded to Hach Method 10173 [28]. Each extract sample is first acidified and sparged with nitrogen to remove inorganic carbon. The sample is then placed into a screw-cap test tube and mixed with sodium peroxydisulfate to oxidize the TOC. An inner test tube containing a colorimetric indicator is placed into the first tube with the sample and the sodium peroxydisulfate. The test tube was sealed, and the sample was then heated to 100 °C for two hours. The CO2 evolved is adsorbed into the colorimetric indicator (inner tube). The color change is measured by placing the combined inner and outer test tubes into the spectrophotometer. The absorbance is used to calculate the CO2 evolved. The second Hach TOC kit was the TNT plus 810 corresponding to Hach method 10267 [29]. This is a low concentration range method that uses the same principles as the 10173 kit. In this case, the sample is added to a vial containing acid and sodium peroxydisulfate. The inorganic carbon content is removed by agitating the samples in a Hach Model TOCX5 shaker. The sample vial is then mated with a second vial containing an indicator solution using a double cap with a membrane that allows CO2 to diffuse into the indicator, when the sample vial is heated to 100 °C for two hours. The two different colorimetric methods for organic carbon gave very similar results. Although, using the TNT plus method, many of the samples had to be diluted with distilled water before measurement.
We also measured weight loss on ignition for some of the soil samples. The sieved soil samples were weighed into aluminum pans. The soils were first dried at 105 °C for 24 h and then reweighed. The samples were then placed in a muffle furnace and heated for 15 h at 400 °C. After cooling, the samples were reweighed to determine the weight loss, which was ascribed to the loss of organic matter.
3. Results
Copper
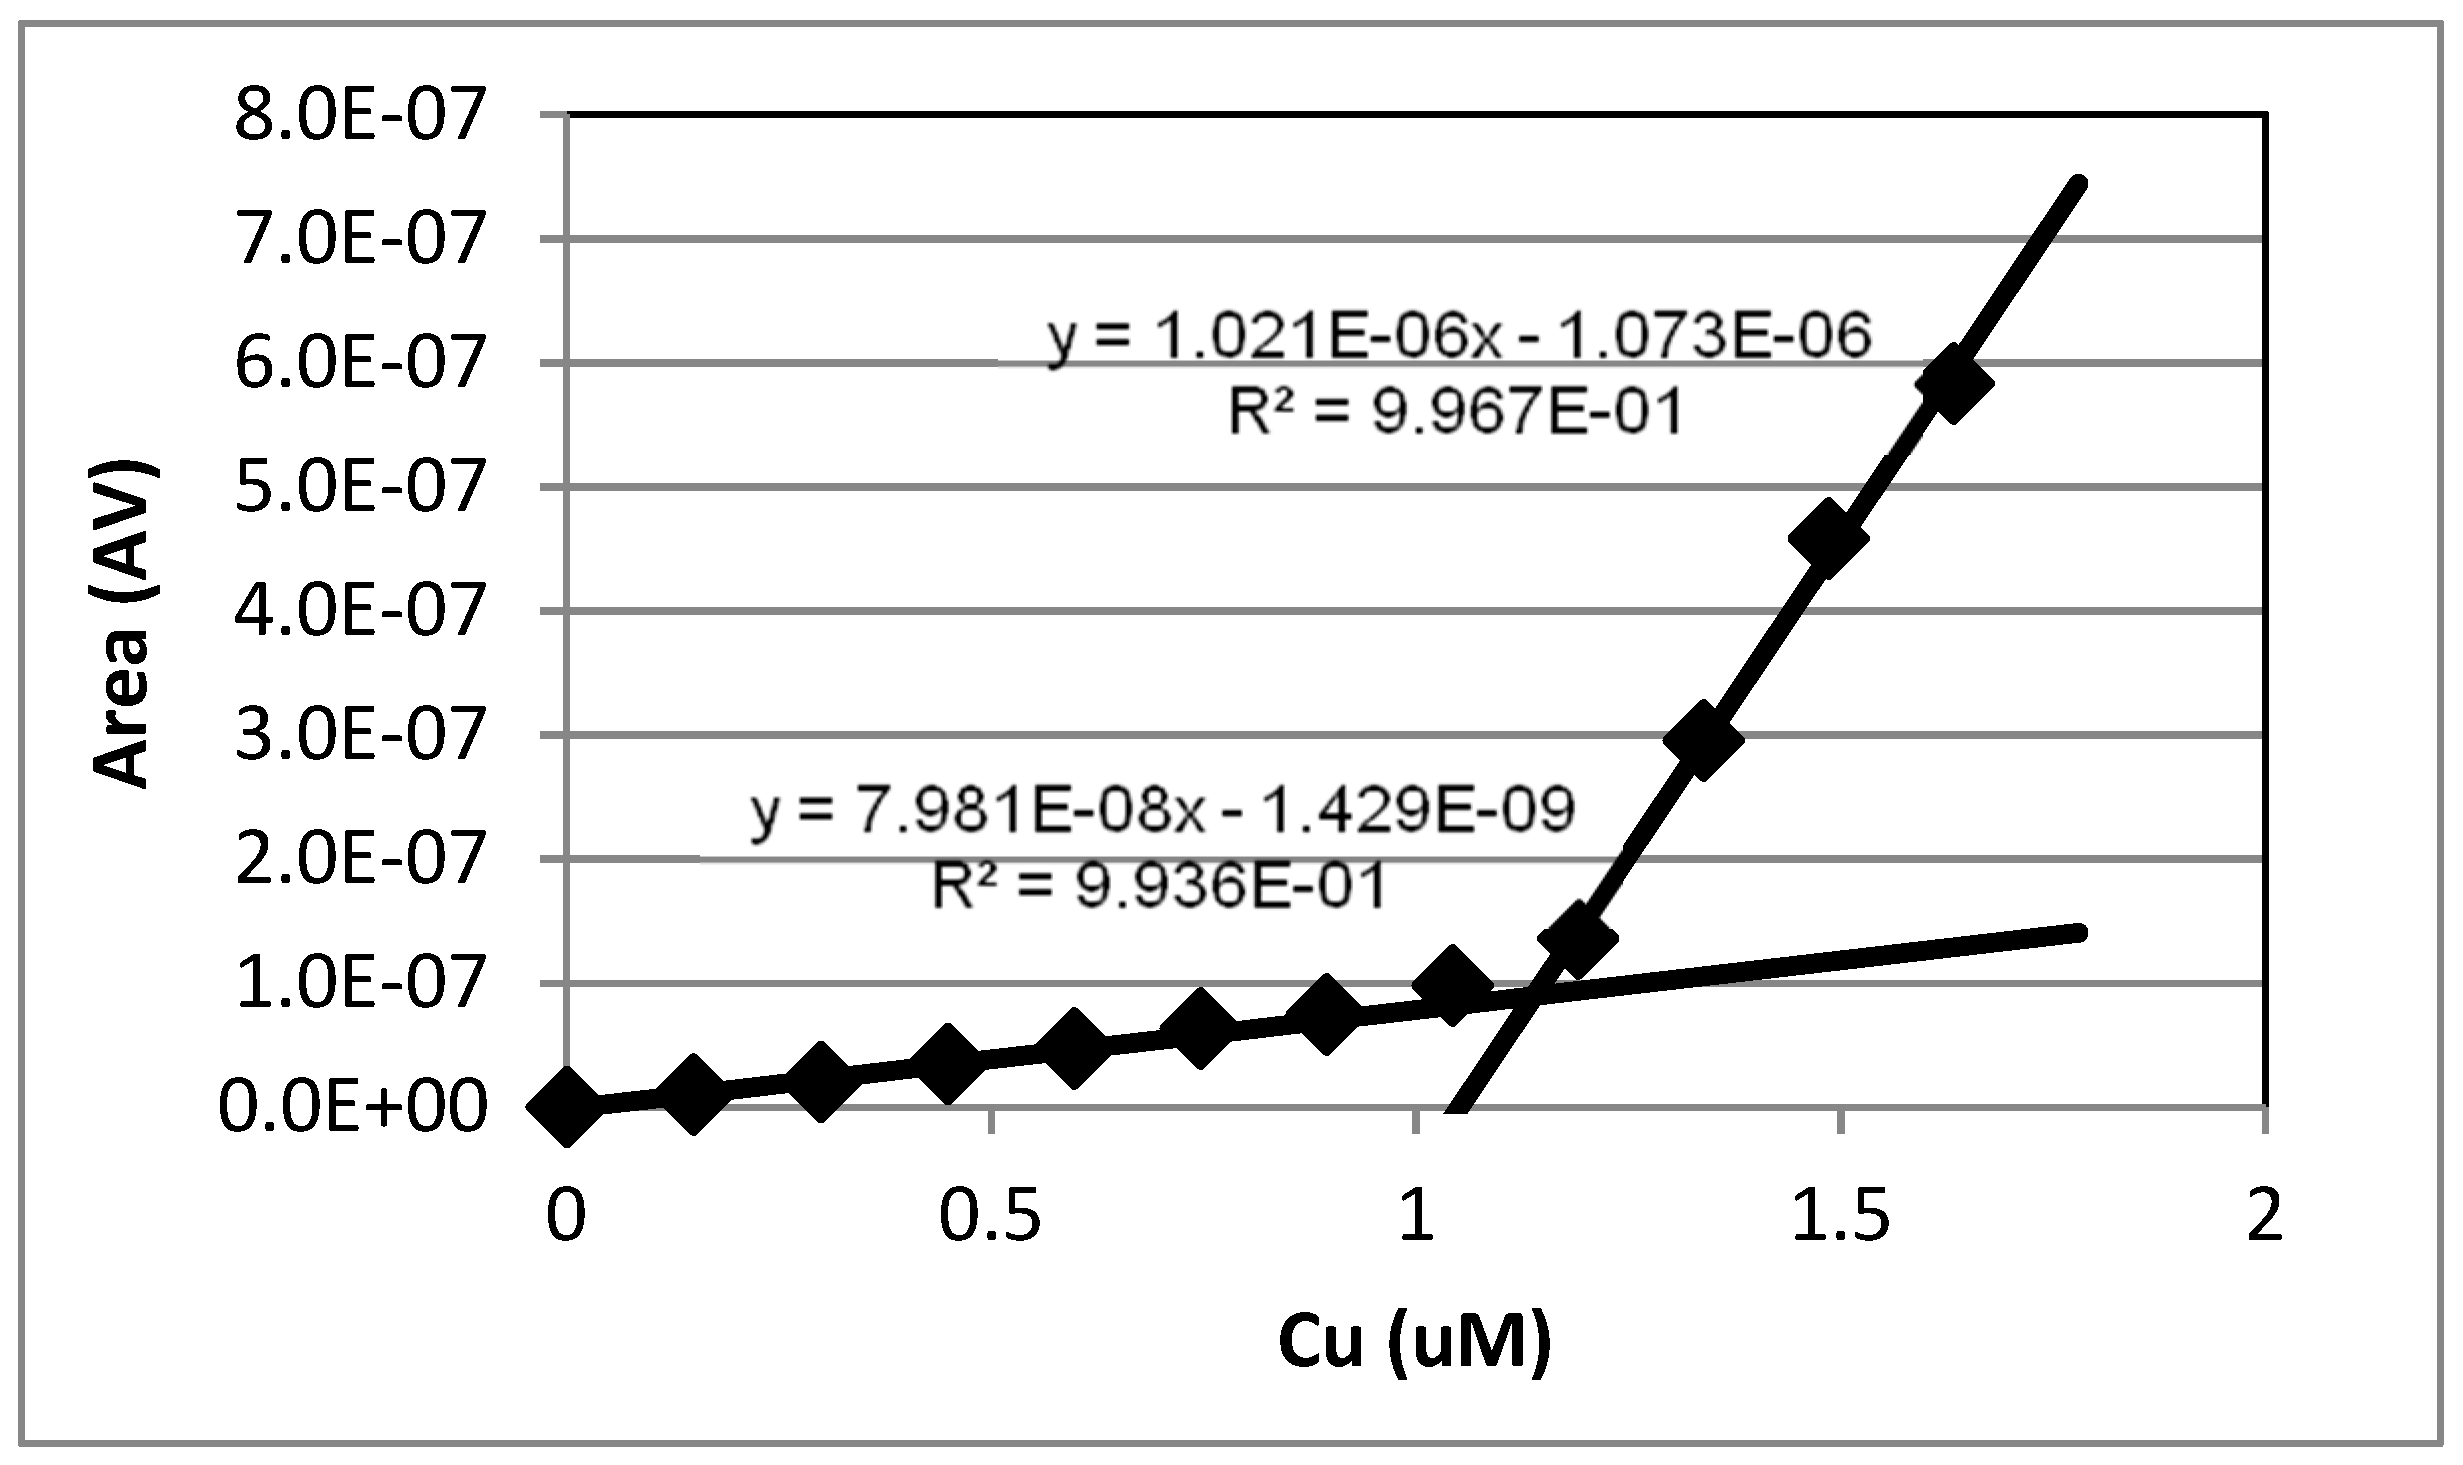
The Cu2+ voltammetry titration method utilized in this study was tested using with several known copper chelating agents. Results are shown for EDTA, histidine, and aspartic acid. The results shown below in Figure 1 illustrate the titrations of dilute EDTA solutions with a copper solution. The area of the copper ASV peak is plotted against the total concentration of copper (Cu(II)) in solution.
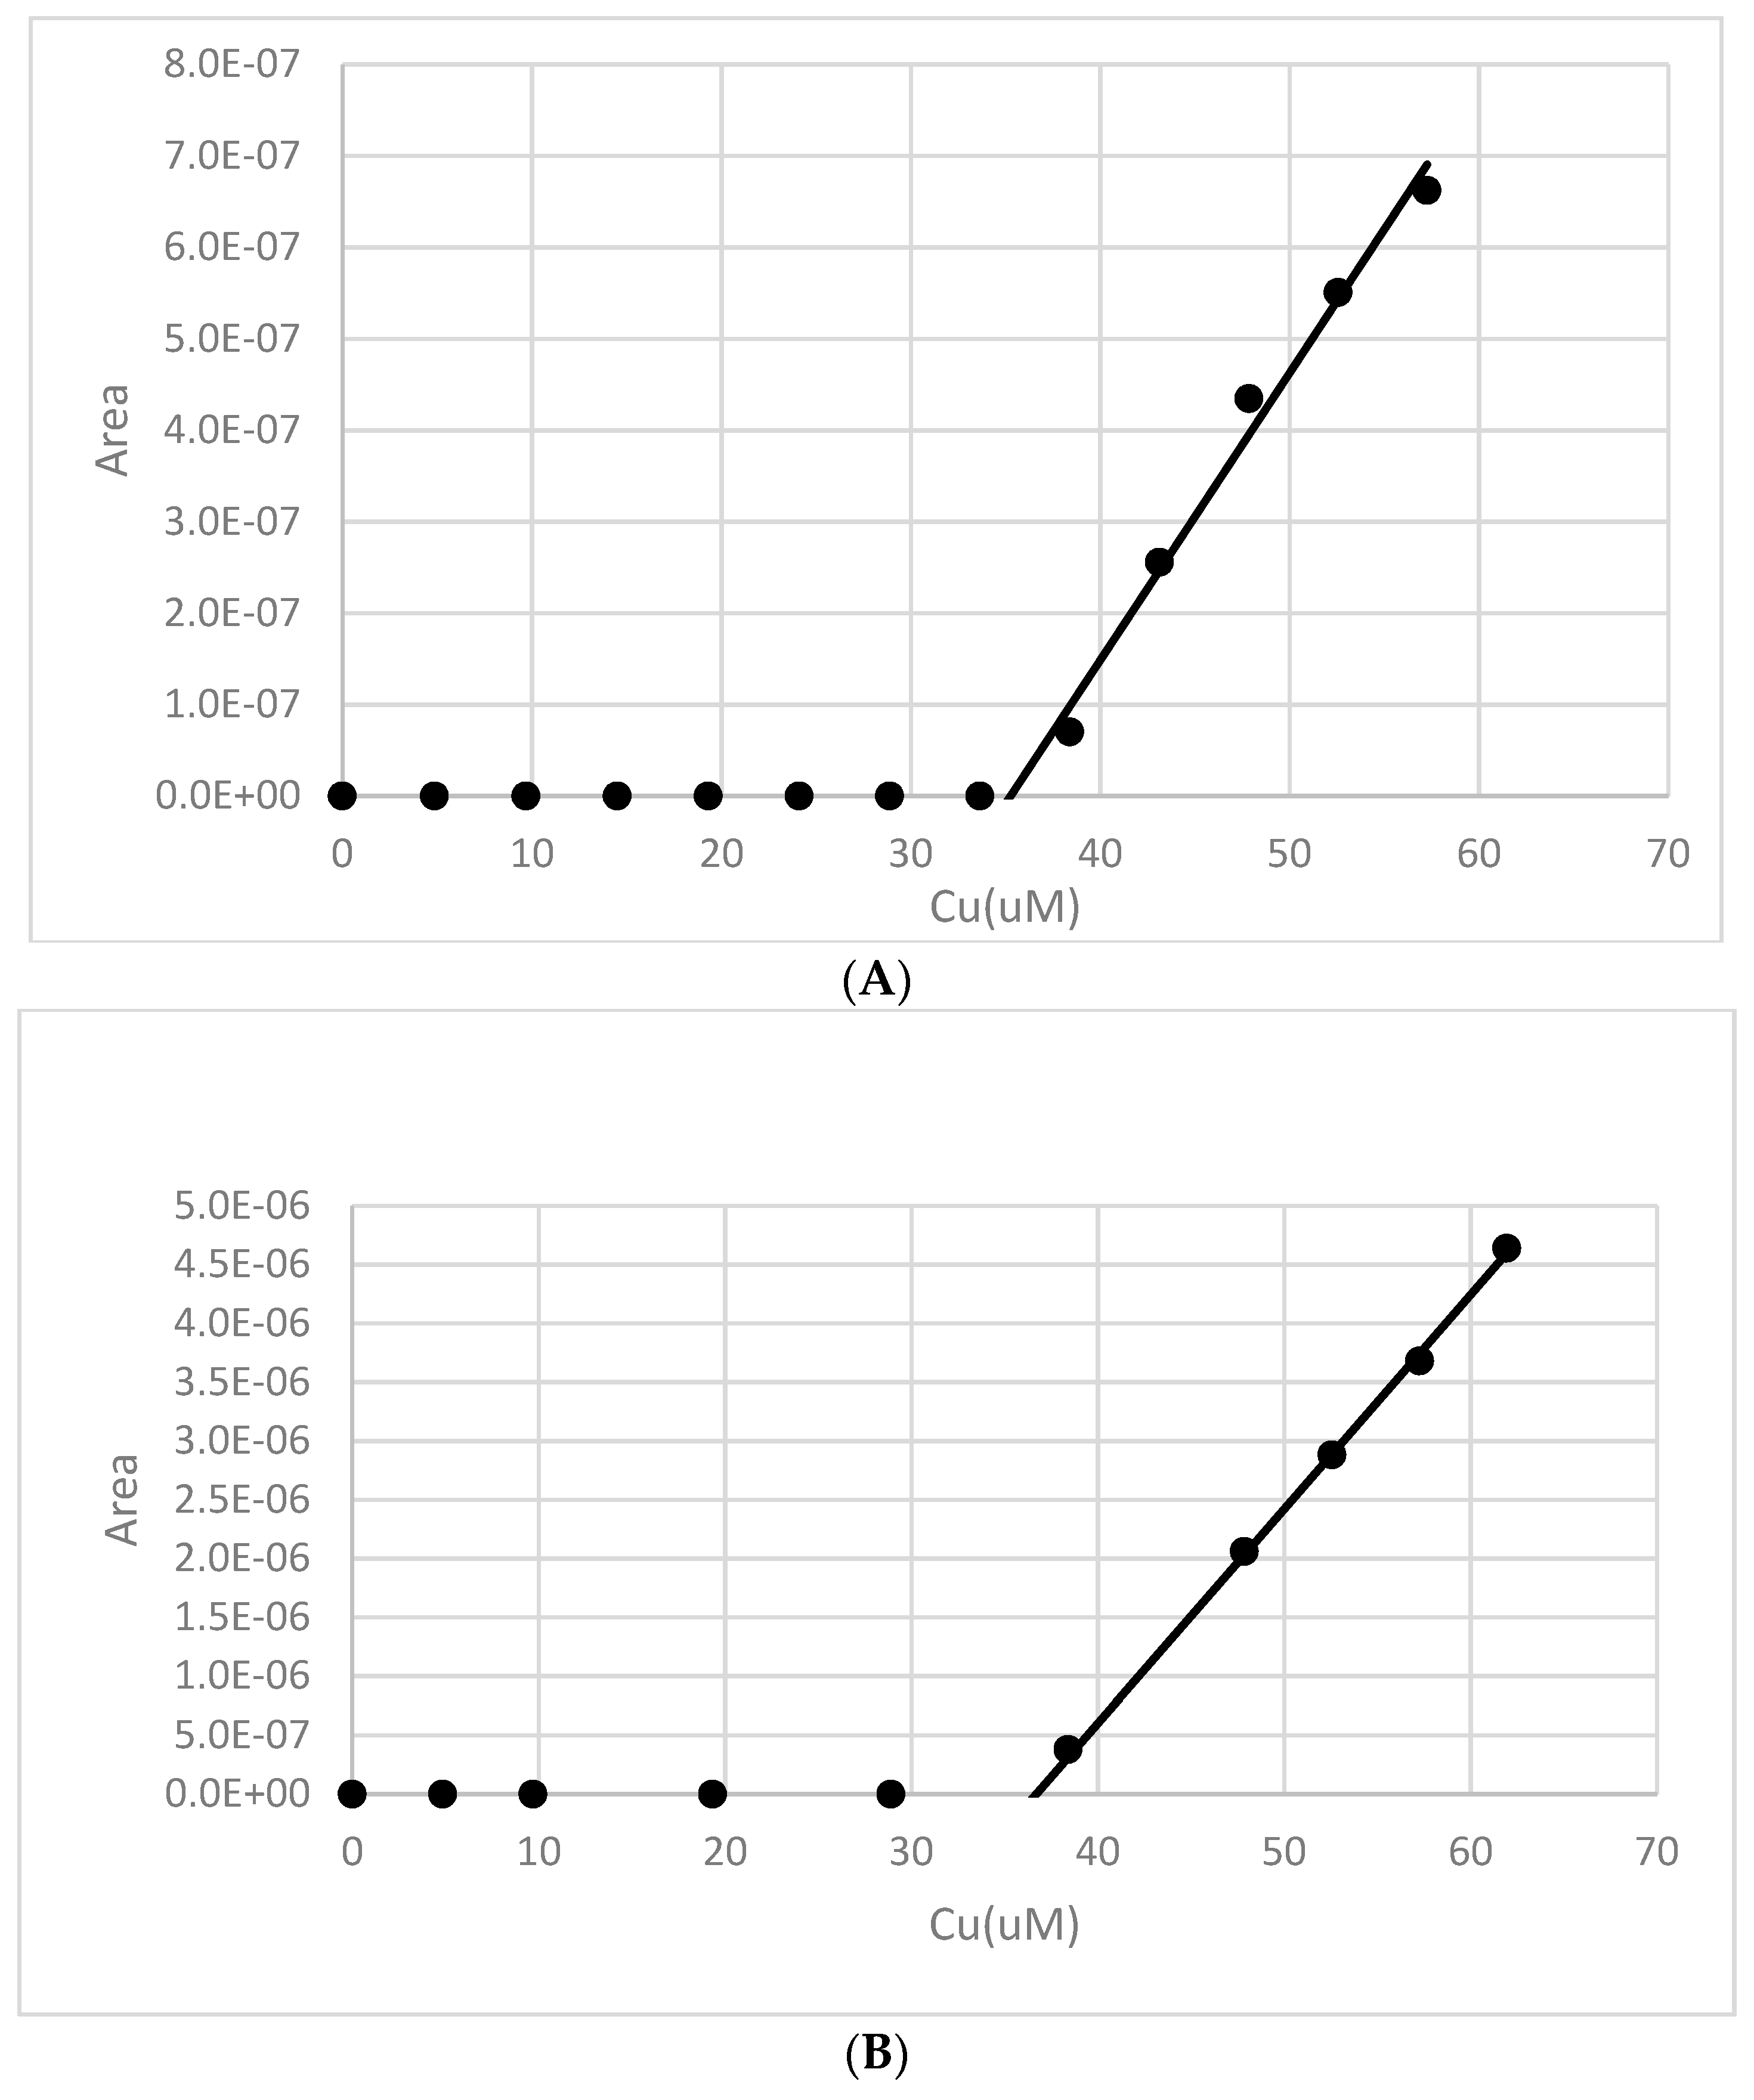
In this example, the titration was performed using ASV with deposited copper detected with an anodic scan. The deposition voltage was −500 mV, and there is a large change in the slope of the electrochemical titration curve when the Cu2+ concentration exceeds the concentration of EDTA. The second linear titration region intercepts first linear region at a concentration that was (after corrected for buffer dilution) very close to the EDTA concentration of 1.14 µM (1.28 µM measured), indicating the formation of a 1:1 Cu2+-EDTA complex. In other examples, 80 µM histidine at pH 8 and 87 µM aspartic acid were titrated with copper. The results of these titrations are shown in Figure 2A,B. Chelation of the copper was only detected when the deposition voltage was limited to −250 mV. These results indicate that amino acids interact with copper in a ~2:1 ratio. At reduction potentials lower than −250 mV, the copper amino acid complexes were also reduced and could not be differentiated from free copper. In addition, there was clear evidence at −250 mV deposition that the copper-histidine complex was also absorbing to the mercury drop. Upon scanning the in the cathodic direction after the deposition period, the adsorbed complex was reduced at a significantly lower potential than free copper. This type of observation has also been made with humic acids. Whitby and van der Berg (2015) [30] presented evidence for the reduction of adsorbed copper humic complex on a mercury drop.
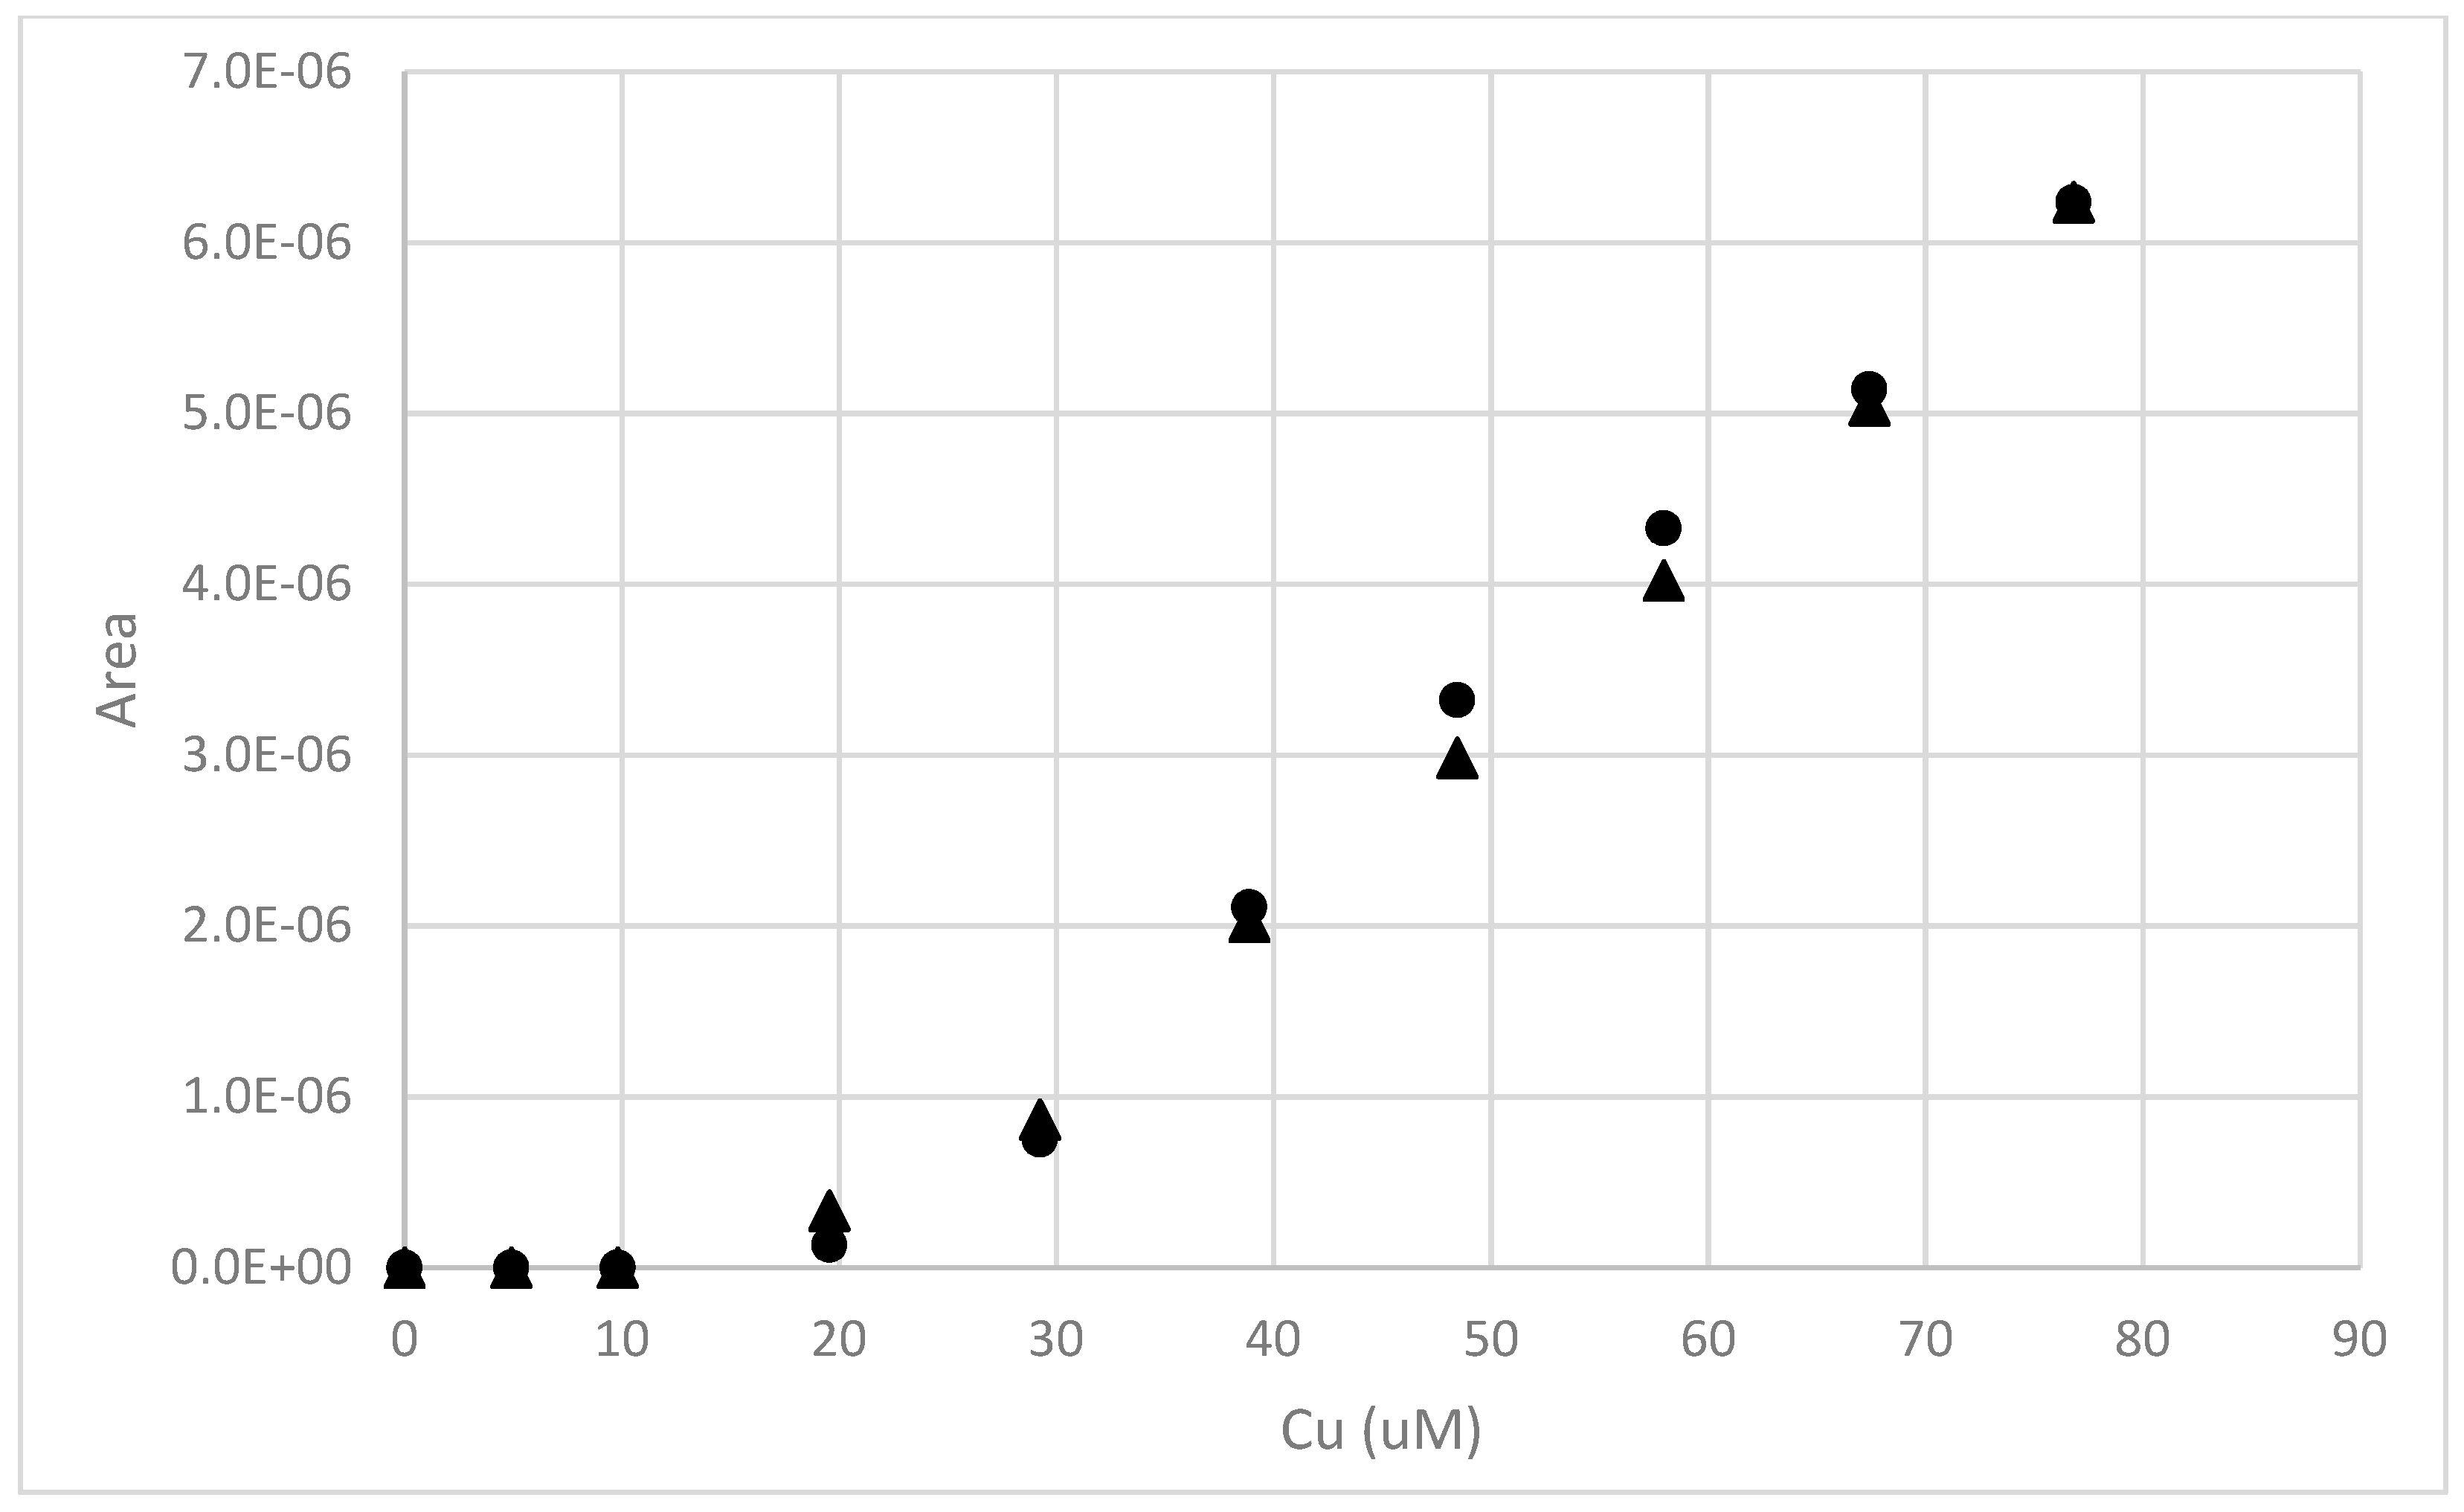
We have examined the use of this method to estimate the chelating capacity of a 100.0 mg/L solution of the TeraVita humic acid. A 15 mL aliquot of the stock solution was mixed 1 mL of HEPES pH 8 buffer. A period of 5 min was allowed for contact between additions of copper. Deposition was for 4 min at −250 mV, −400 mV, and −700 mV. After 4 min, the mercury drop electrode was allowed to “rest” at the deposition voltage for 10 s. The mercury drop then immediately changed to 0 V, and then scanned (square wave) to −1000 mV using the square wave procedure outline above.
The −250 mV deposition data indicate ~35 µM of copper chelating ligands. The results for −400 mV and −700 mV indicate ~20 µM of copper complexing capacity in the 100 mg/L solution. The apparent copper complexing capacity was a function of deposition voltage. This result was observed for other samples as well. The results are illustrated in Figure 3.
As noted, the focus of this study is the impact of soluble organic matter on the behavior of metals in desert soil. Organic matter from decaying plant remains or root exudates will increase the concentration of soluble and insoluble soil organic matter in soil. Previous studies of arid fertile island have indicated soil organic matter is significantly higher in the regions directly below woody shrubs. In order to gauge the impact of desert shrubs on dissolved organic matter, some experiments were performed with a water extract from a soil sampled from the root zone of a creosote bush. The soil samples from under creosote or salt cedar plants had sandy textures which were consistent with arid soil, and contained numerous plant fragments (litter). The soils were considerably darker than the surrounding interspace (30 m from creosote) that was not impacted by plant growth.
Weight loss upon ignition results indicate that soils taken from beneath the creosote bush on the Three Kids mine had 5.82% ± 0.49% organic matter. The interspace sample by comparison was 1.12 ± 0.03% organic matter. The Lake Mead creosote soil was 2.64% ± 0.25% organic matter, compared to the corresponding interspace soil which was 0.47% ± 0.05%. Analysis of the Halloran Springs sample indicted that the saltcedar soil was 13.11% ± 1.11% and the creosote soil was 14.77% ± 1.02%. The soil sample retrieved from 16 cm to 32 cm below the surface of the Halloran Springs creosote bush was 2.91% ± 0.43% organic matter.
As noted above, in the conventional approach to ASV, the metals are cathodically deposited on the mercury drop. After deposition the voltage is scanned from the deposition voltage to a high voltage while monitoring the current. The anodic current peak is then quantified to determine the quantity of metal deposited. In the variant employed in this study, the deposited metals (i.e., copper) are re-oxidized by changing the drop potential to 0 V. The pre-enriched copper is then detected by a cathodic square wave scan from 0 mV to −1000 mV, and current from the re-deposition of Cu2+ is recorded. Both the conventional ASV method and this pre-enrichment variant have been tested, and both approaches yield similar results. In the judgment of the authors, the pre-enrichment approach gave superior results during the early stage of the titration. The two different methods are compared in Figure 4 with an extract of the Halloran Springs Road salt cedar surface soil. Both approaches used a −400 mV deposition scan and indicated similar Cu complexing capacities of ~20 µM.
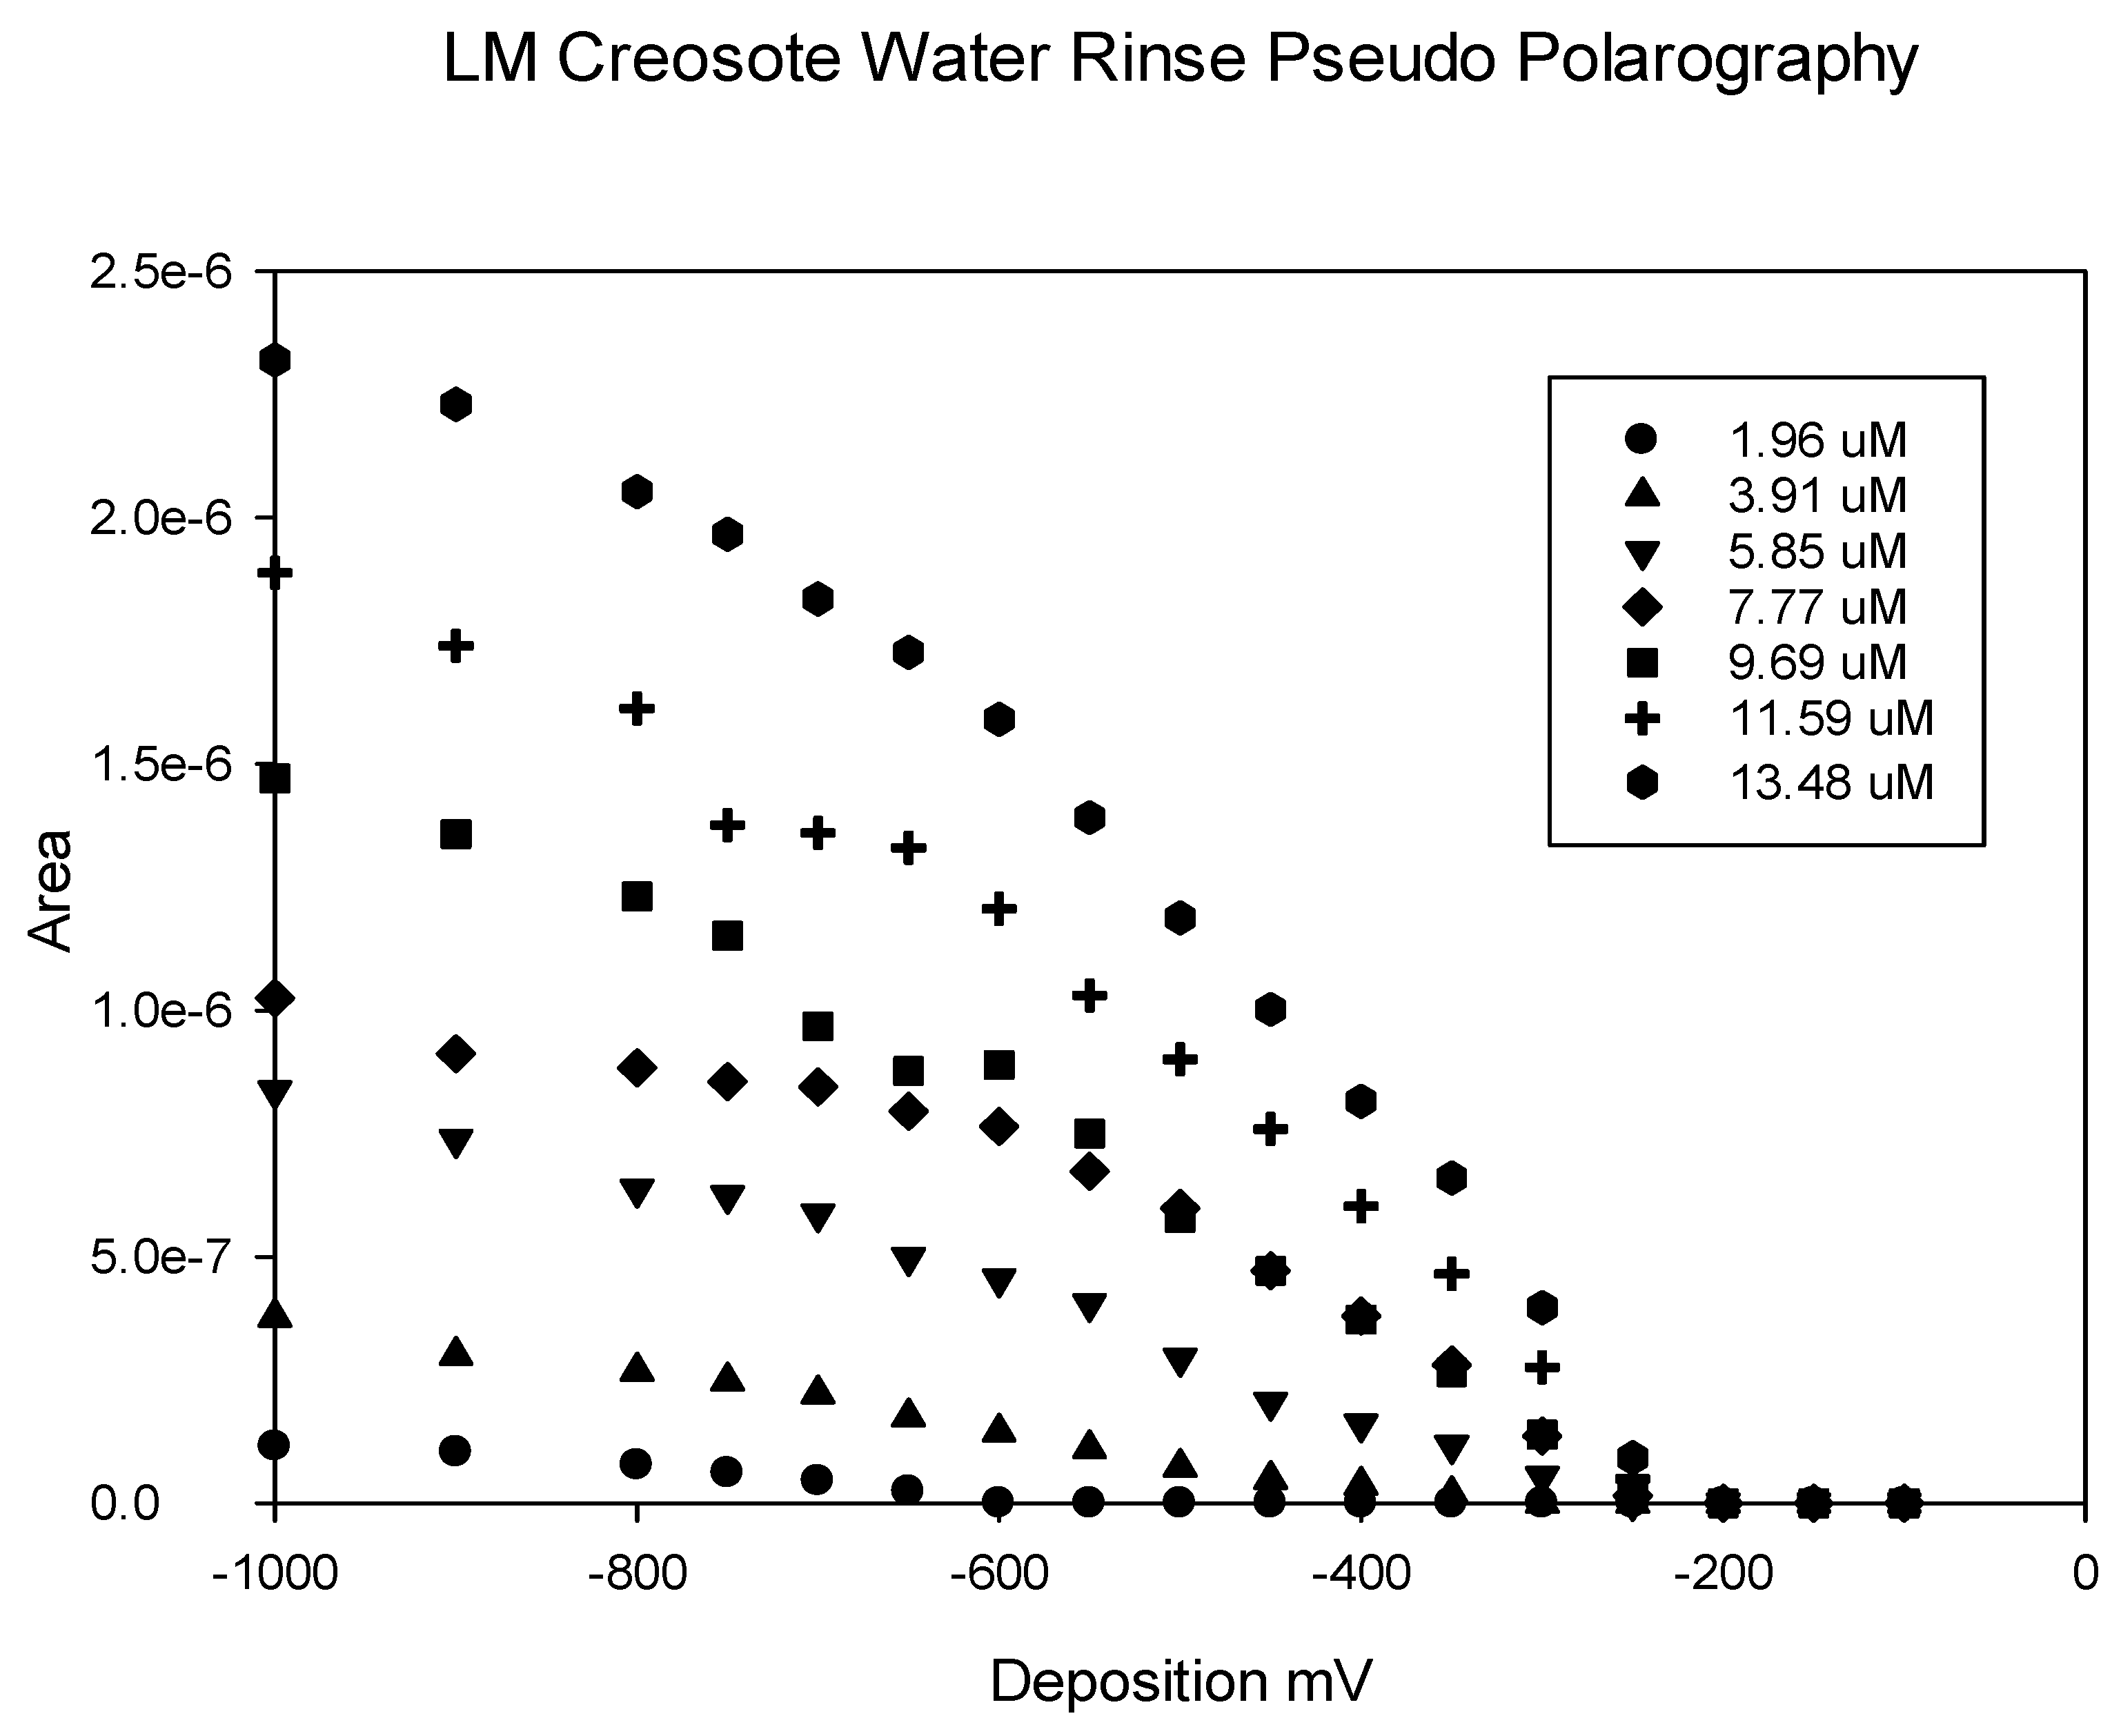
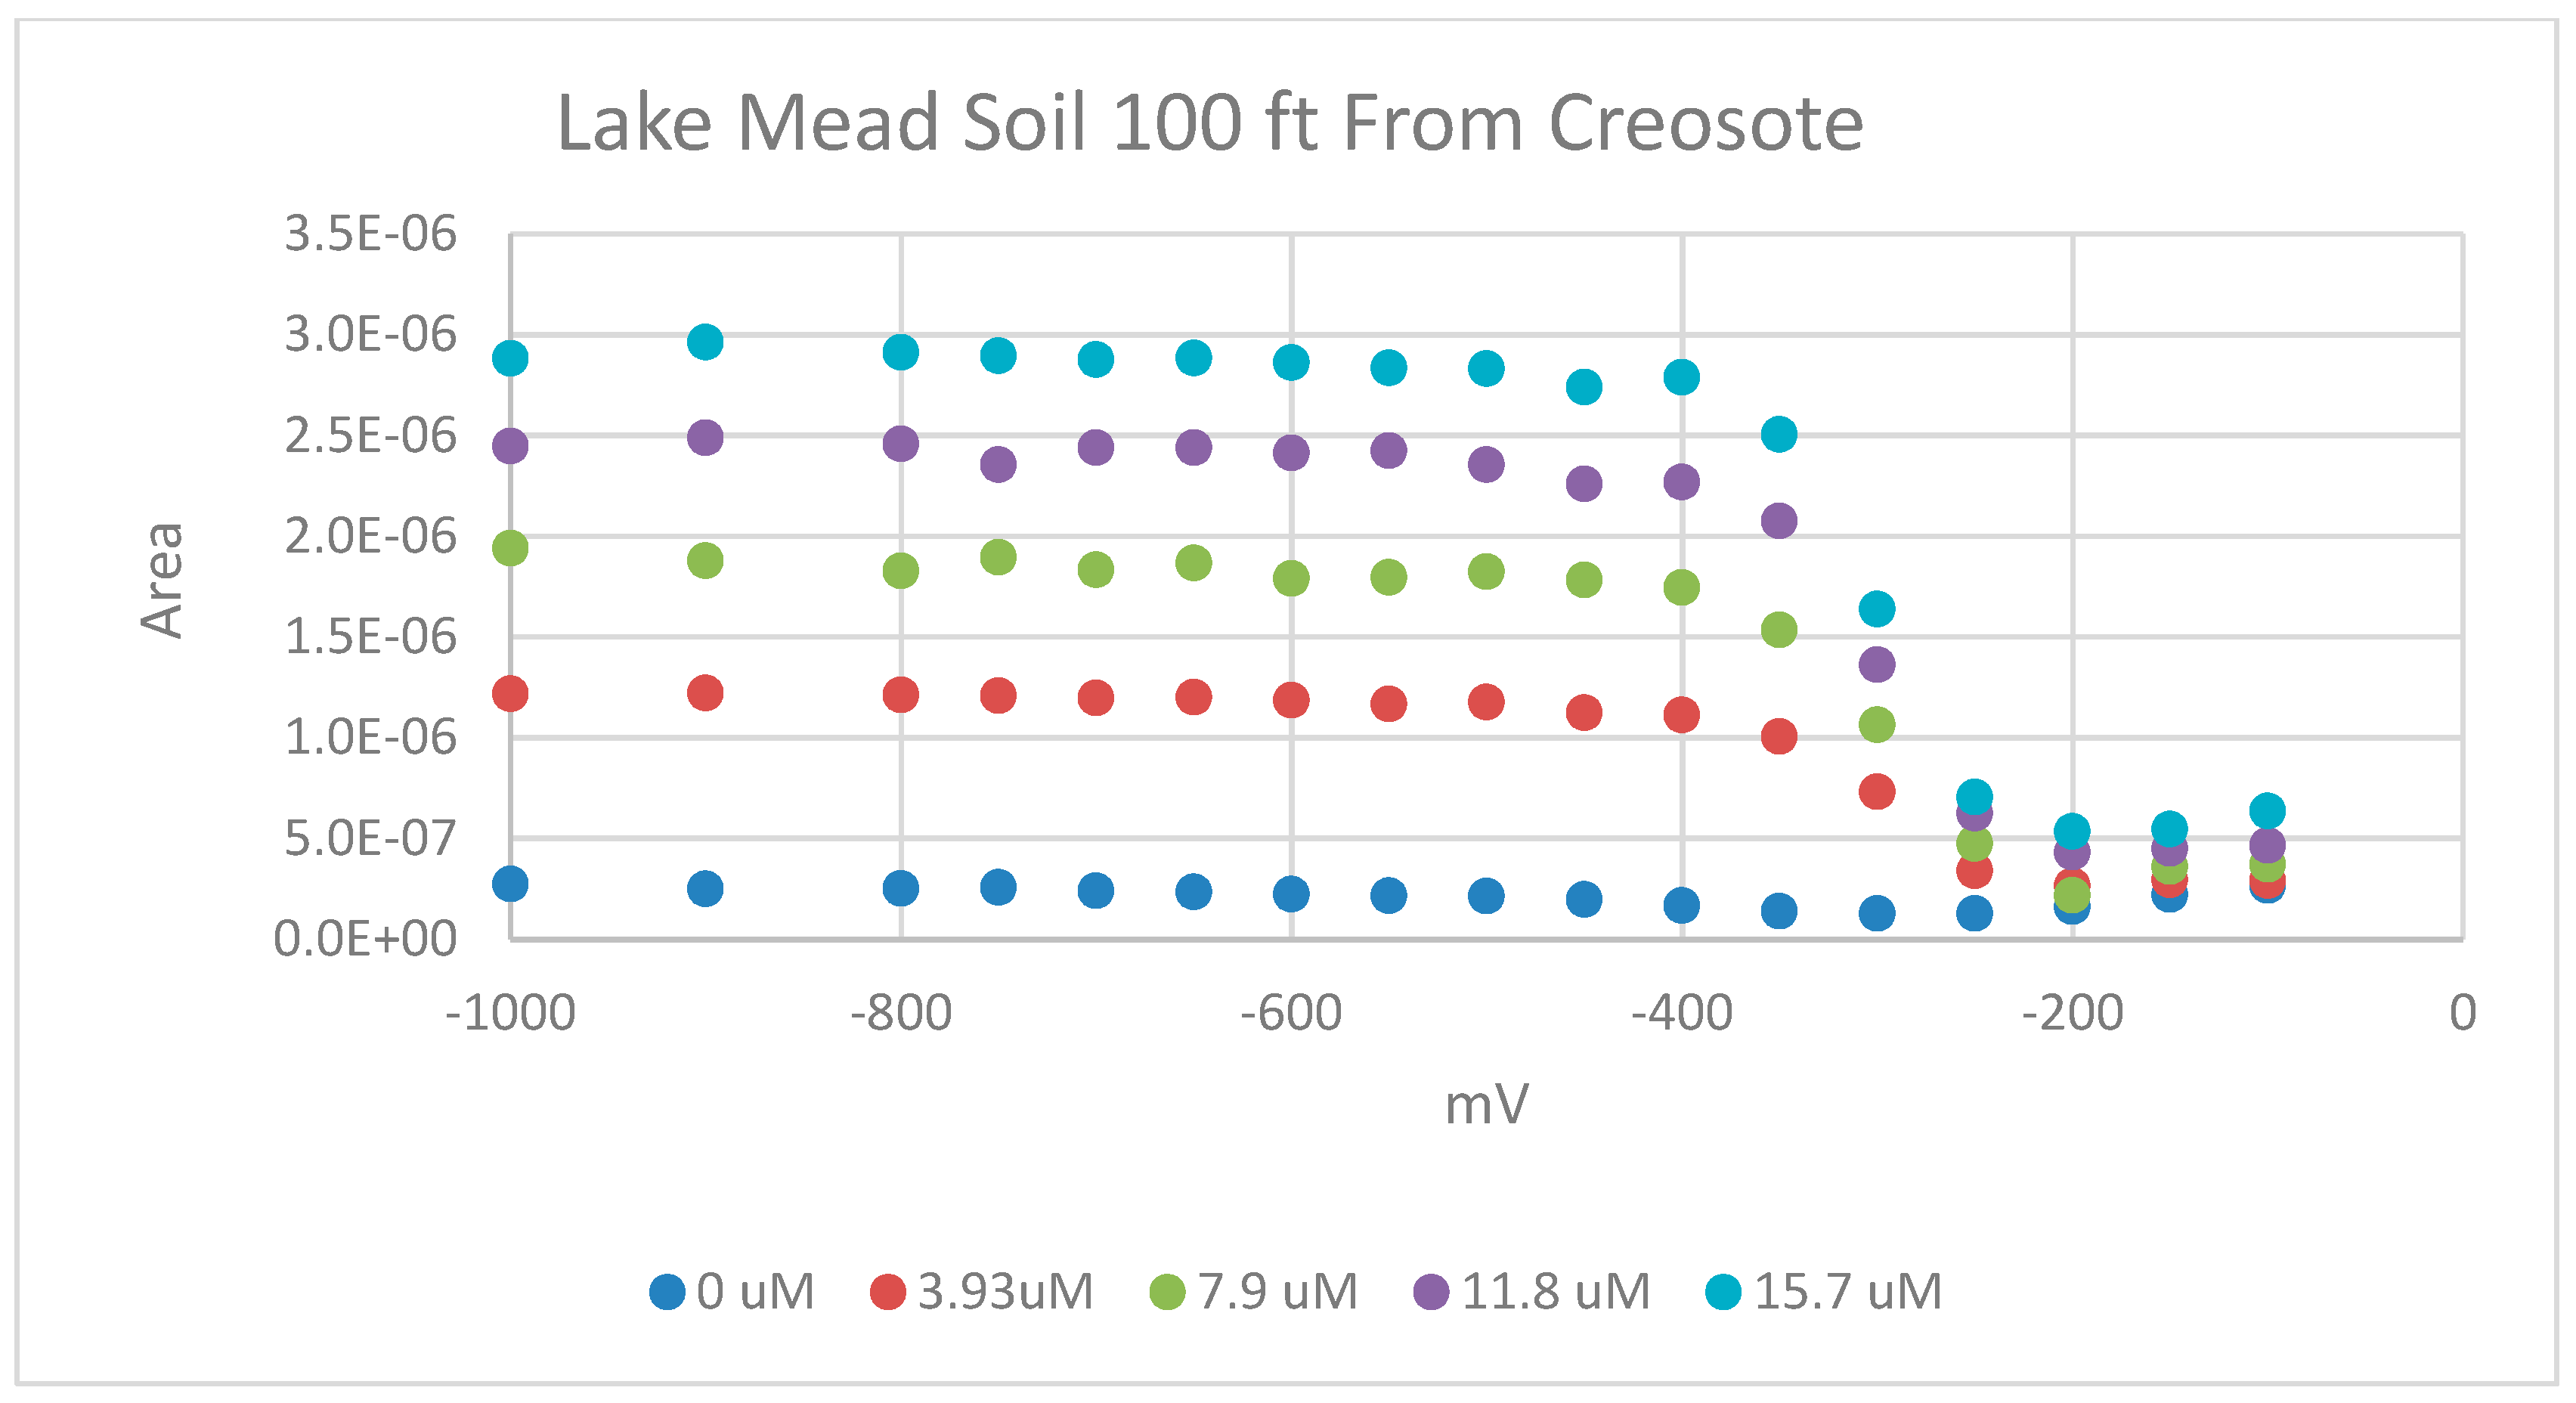
Pseudo-polarography experiments with the water extractions from a surface soil collected from beneath a creosote bush located in the Lake Mead National Recreation Area are presented in Figure 5, for various concentrations of added copper. In contrast, the results for a surface soil recovered ~30 m from any desert shrubs or other plant growth show a reasonably well-defined plateau region and a reasonably well-defined reduction potential for Cu2+ of around −250 mV to −300 mV (Figure 6).
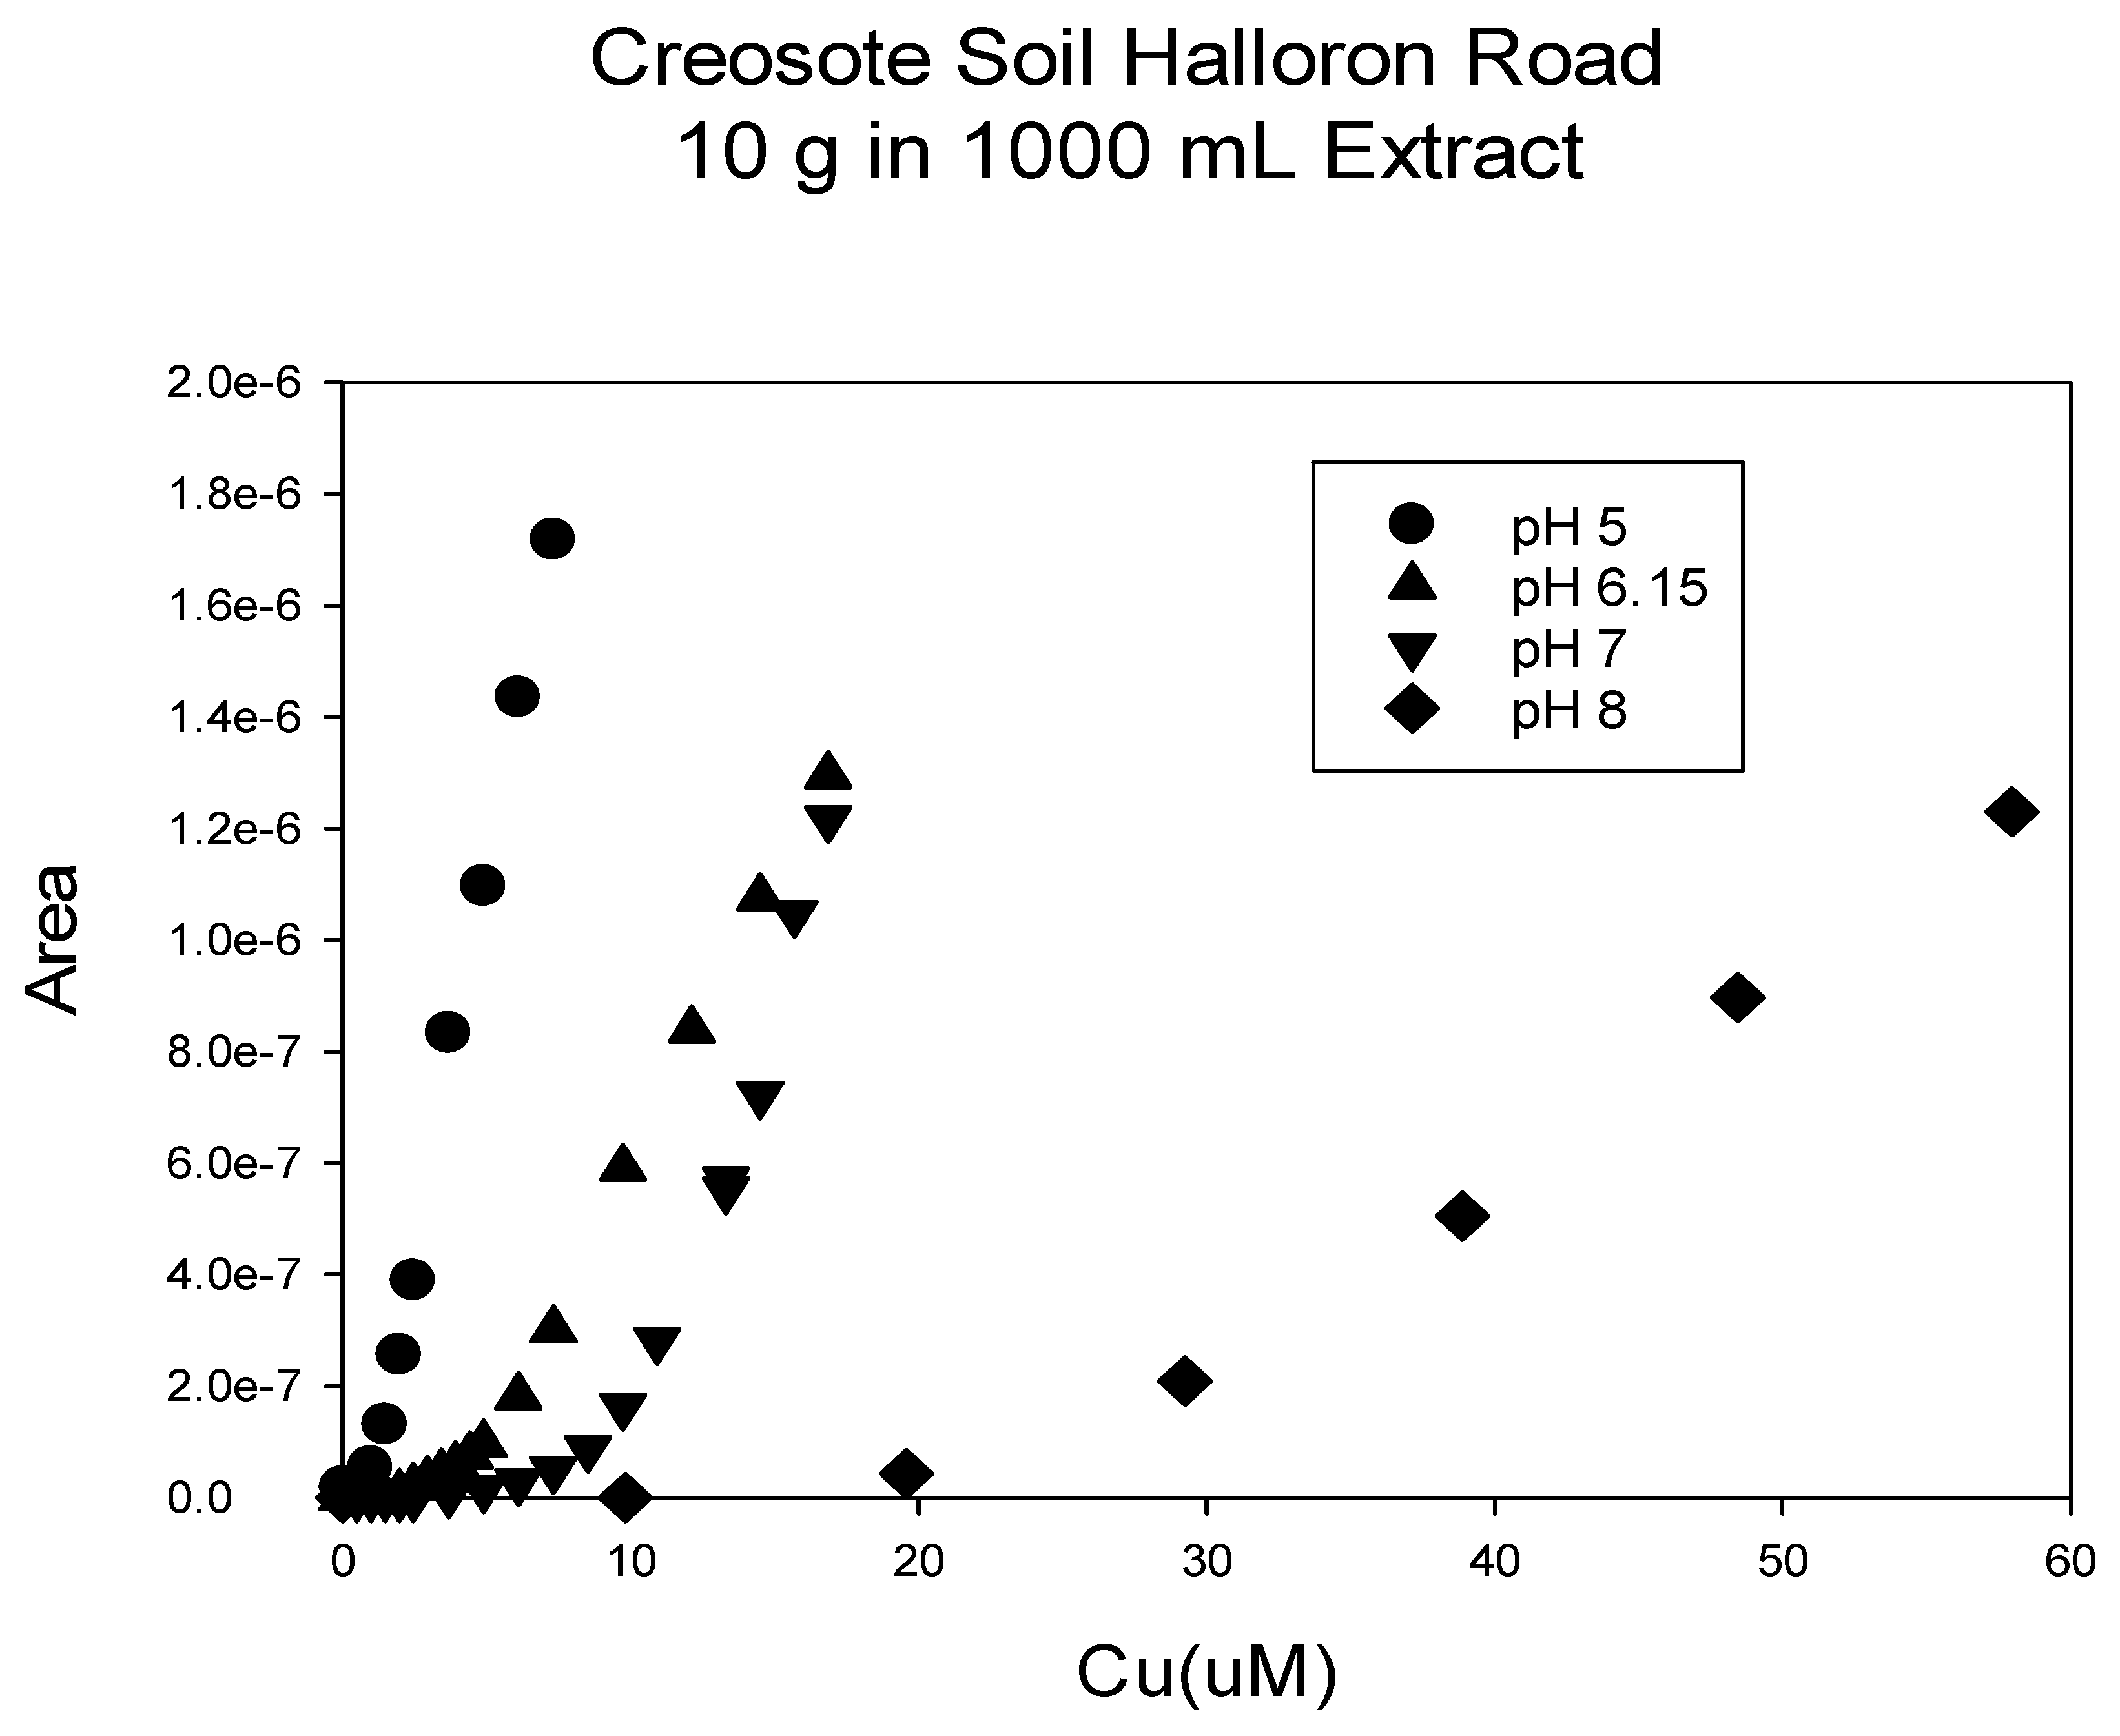
Titration data for the Halloran Springs surface creosote soil are presented for several different pH values in Figure 7. These results are for titrations conducted with 5 min contact times between copper additions. The sample results are for 5.0 grams of soil that was extracted with 500 mL of water to recover dissolved organic material for the titrations. The deposition voltage for these results was −250 mV. These titrations show initial low copper (stripping) signals until the apparent complexing capacity of the sample is exceeded. The second linear titration region was extrapolated to the x-axis as a measurement of copper complexing capacity.
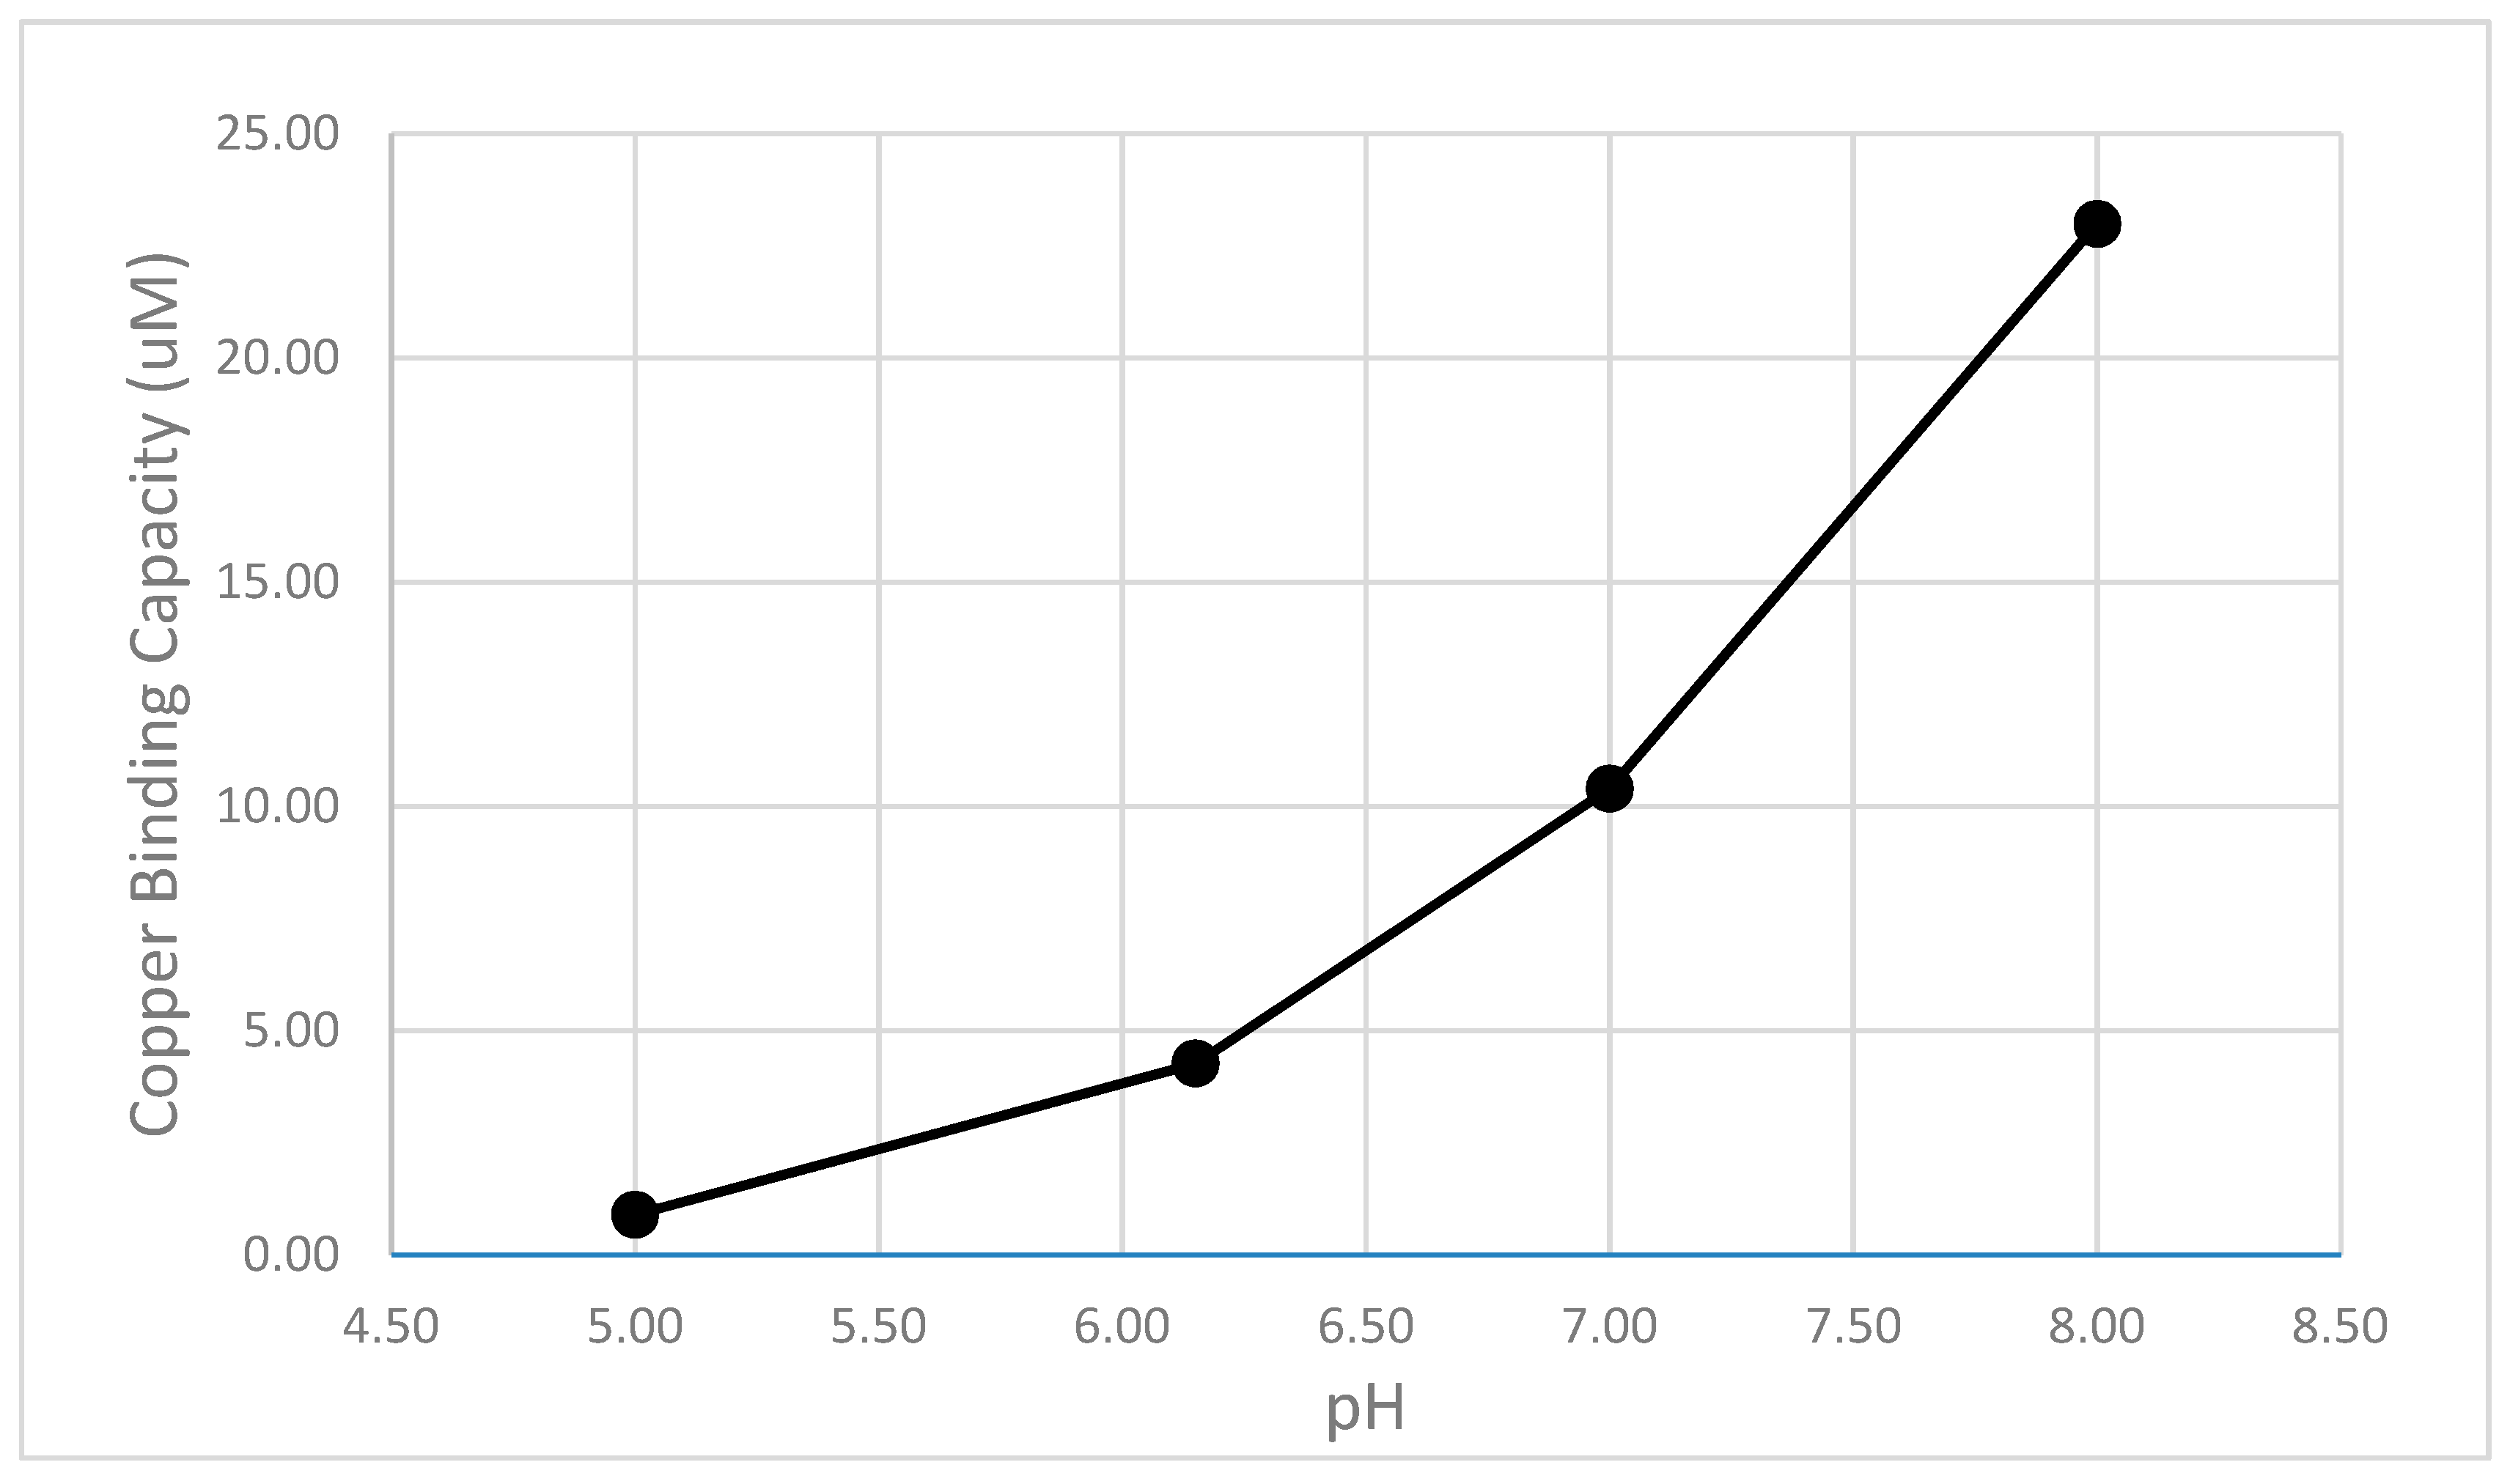
These results show a monotonic increase copper complexing capacity in the extract when the pH is increased from pH 5 to pH 8 (Figure 8). This pH trend was observed for other root zone samples as well, and could correspond to the increasing favorable ionization of carboxylic acid and phenolic functional groups that are responsible for binding copper.
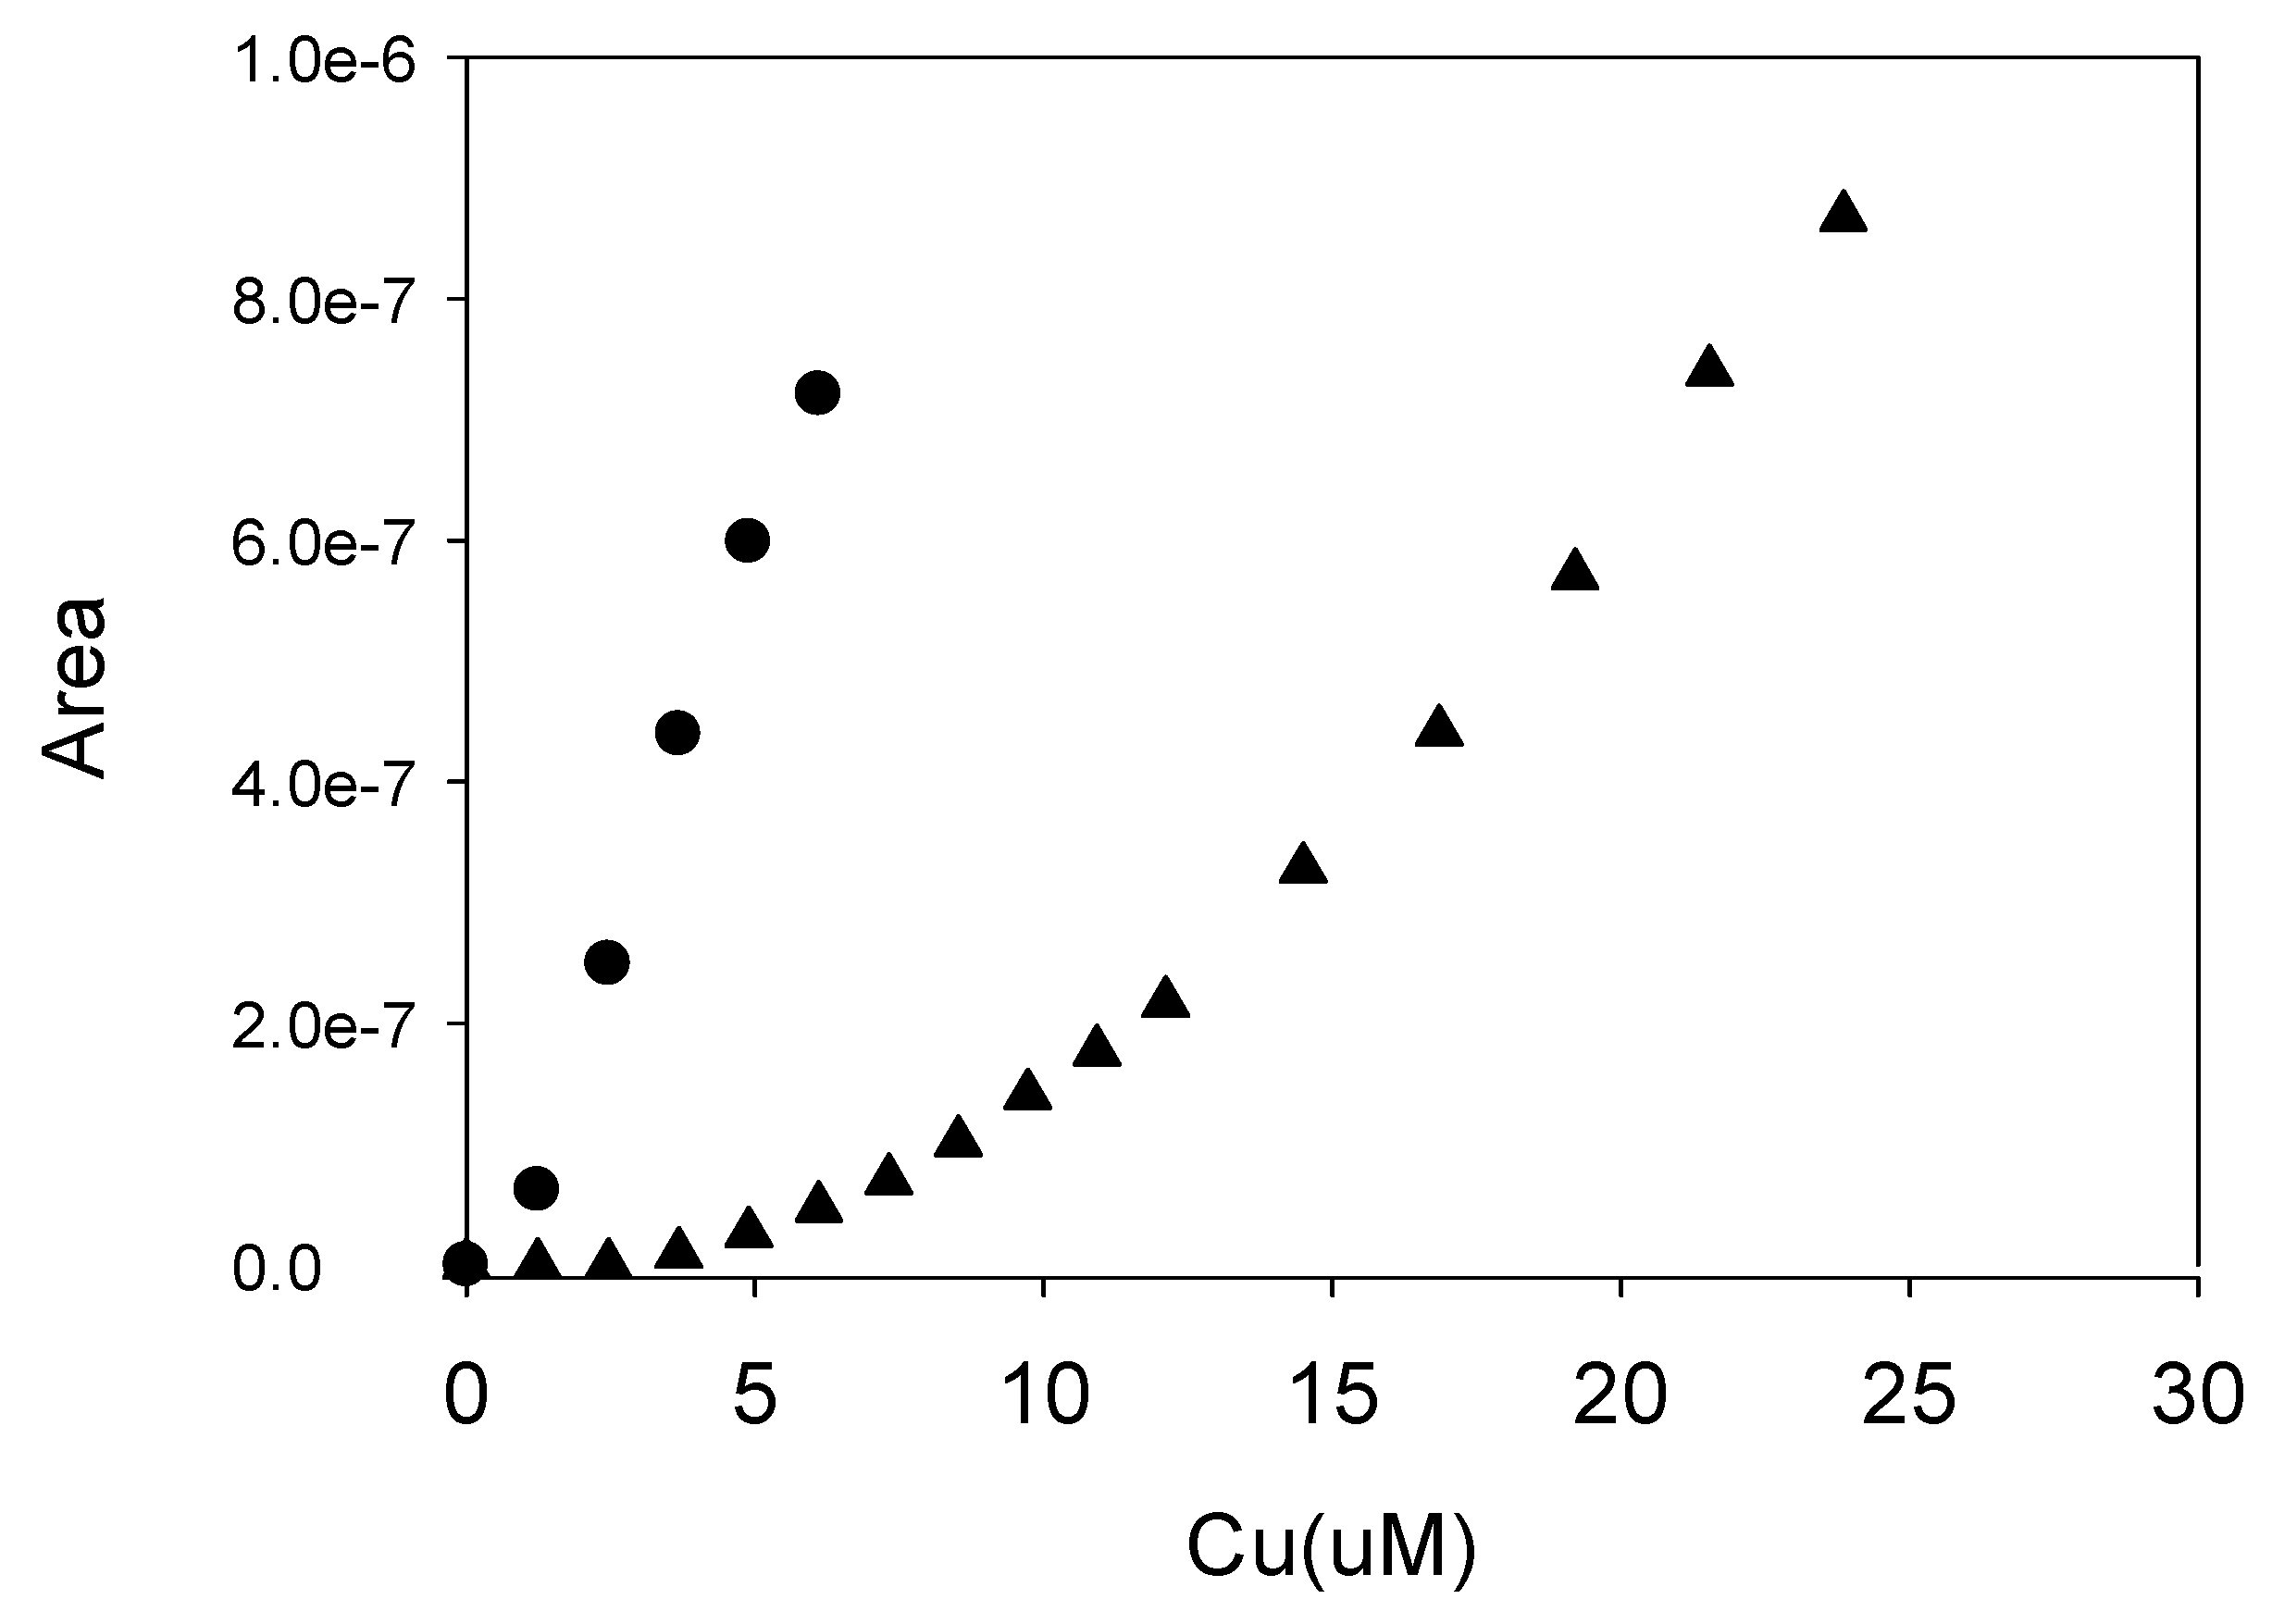
In Figure 9, the pH 8 titration results (5 min contact time) from two different soils from the Three Kids Mine are graphically compared. One soil was recovered from the root zone of a creosote bush, while the other was located in the same vicinity, but well away from creosote bushes or other vegetation. For both of these samples, 1.0 g of soil was extracted with 50 mL of water for ~18 h. The vegetation free sample did not show any visual evidence of copper complexation under the conditions of these experiments. The results indicate that the water extract from the creosote root zone soil sample has significant complexing capacity (~10 µM), which is absent from the other samples recovered from outside of the fertile island.
The data for all of the 5 min contact time titrations has been summarized in Table 1. The copper binding capacities tabulated demonstrates the influence of the plant litter on the copper speciation (~6 µM–60 µM). Results for creosote and salt cedar were qualitatively similar. However, the salt cedar extract from Halloran road showed the highest capacity for copper binding for the soil samples examined: ~60 µM for 10.0 g of soil extracted with 1000 mL of water.
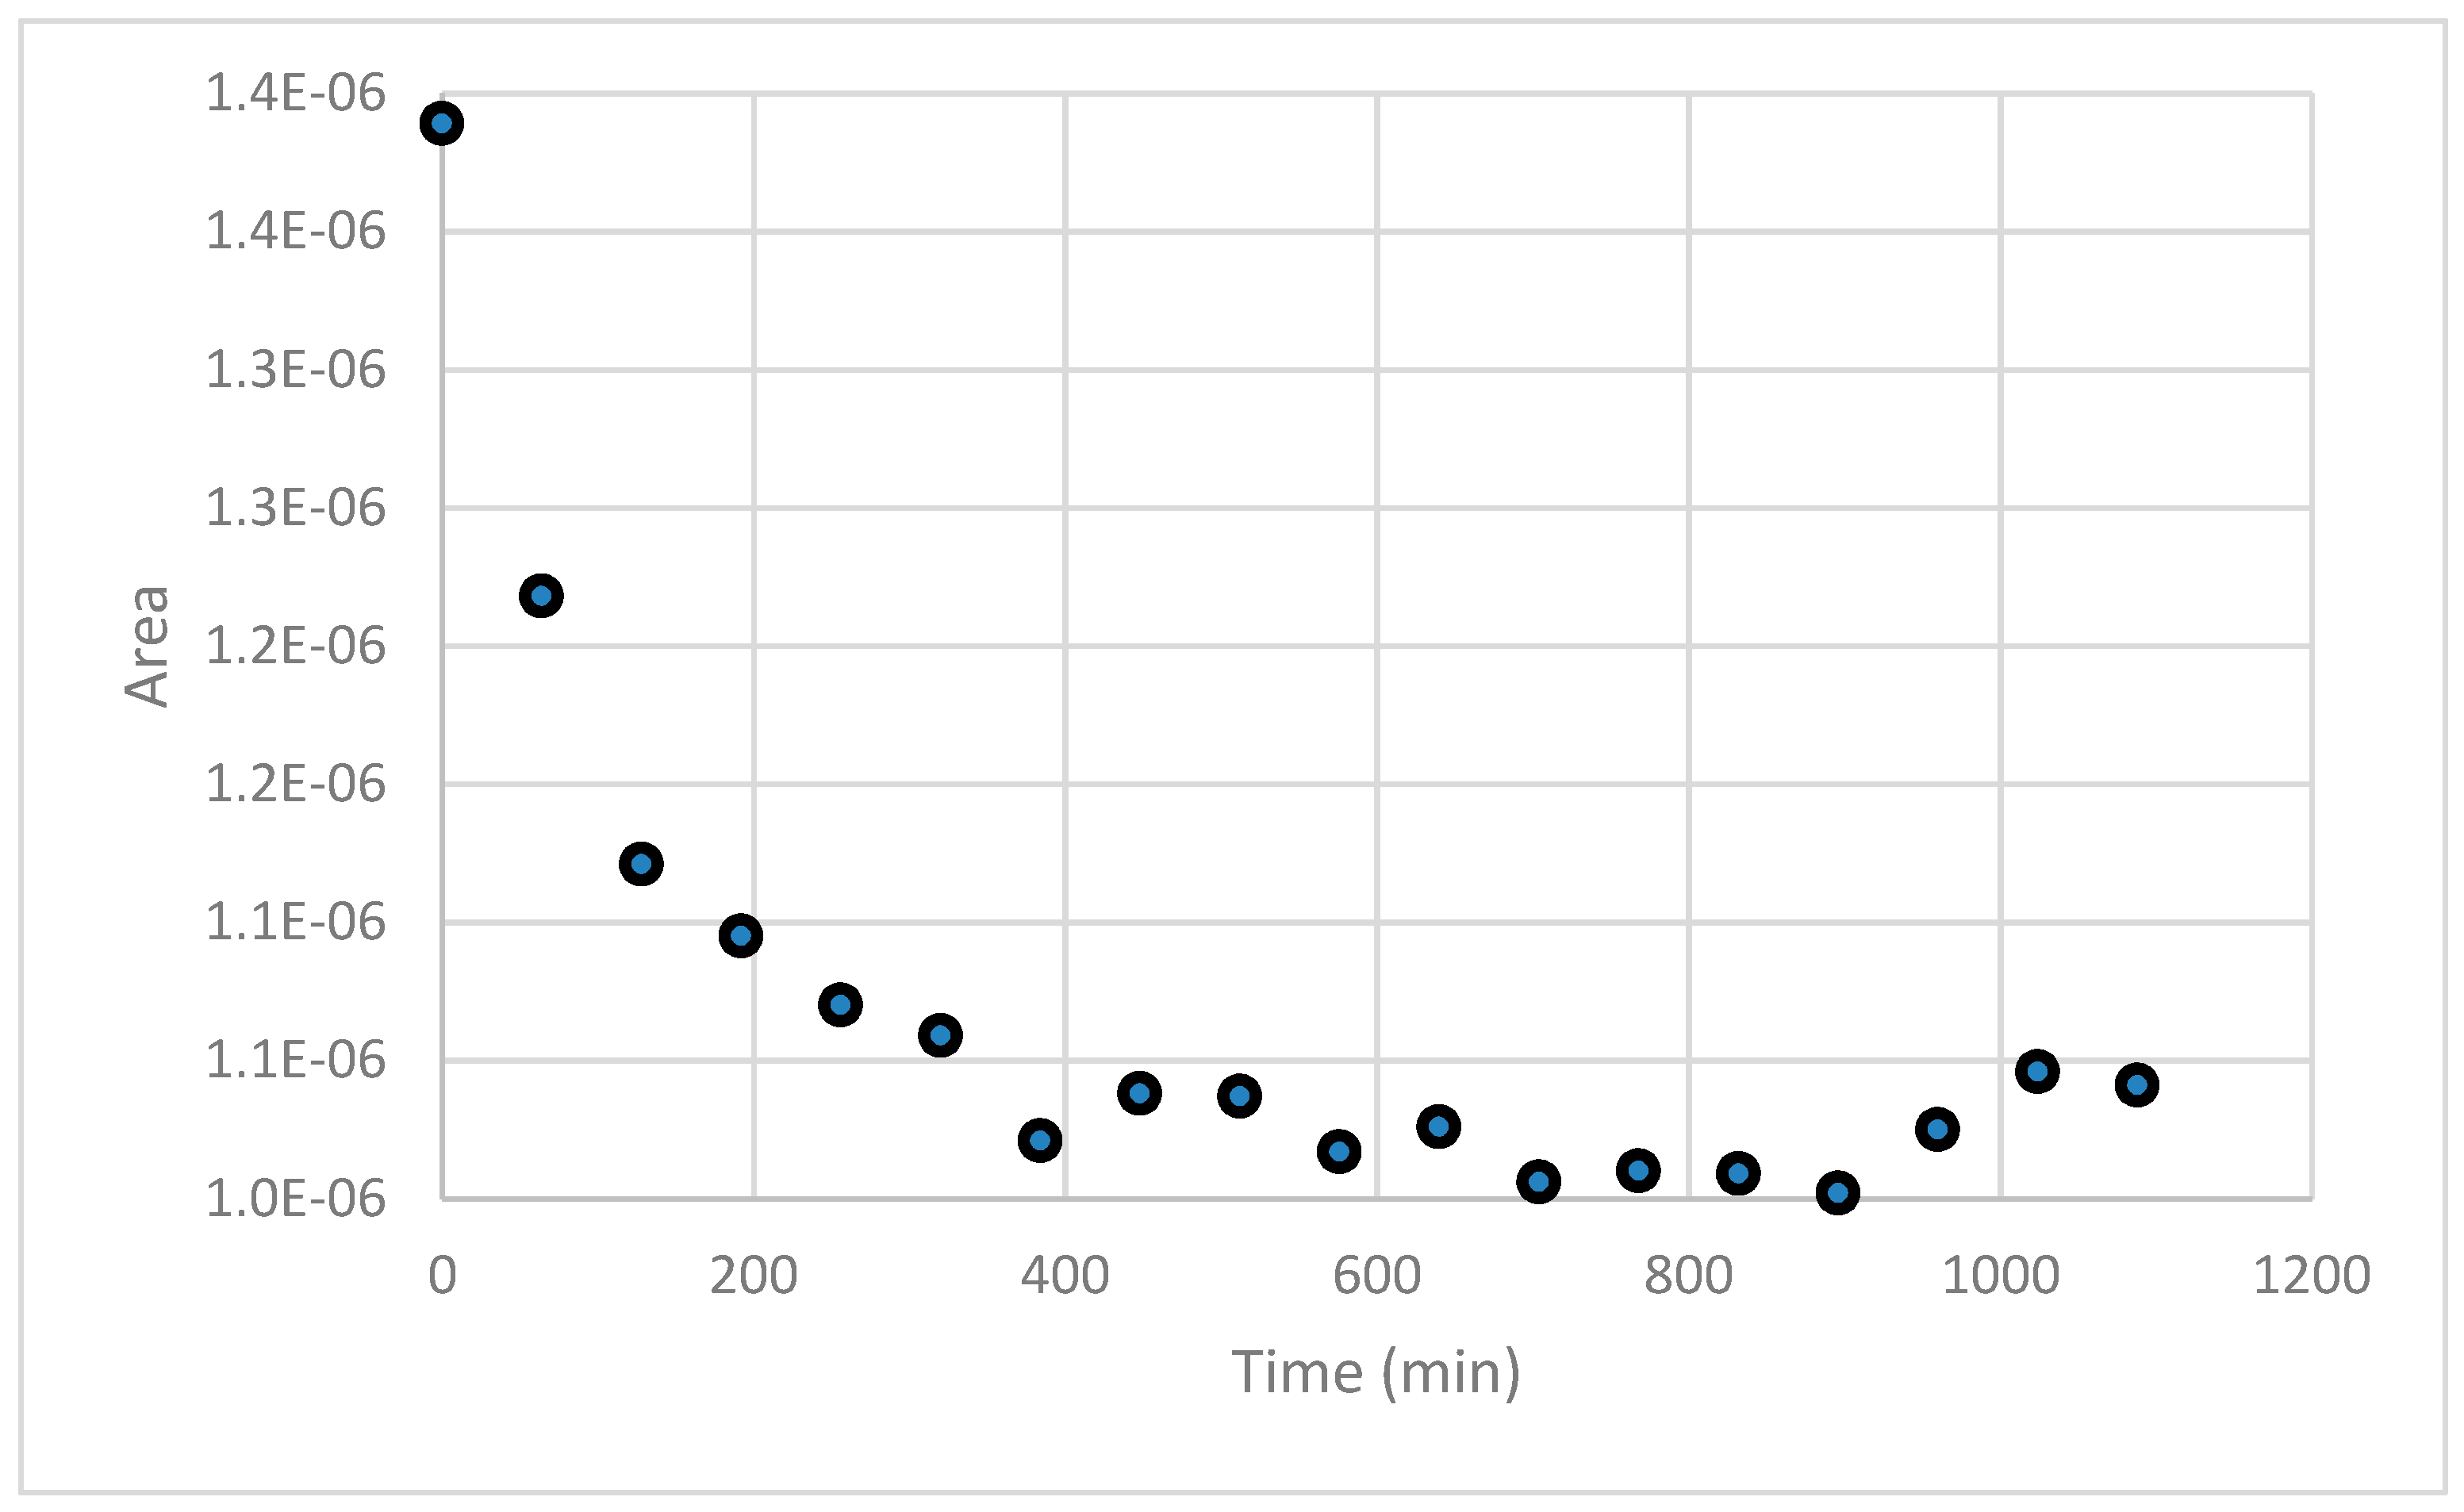
For the salt cedar soil extract (1.0 g with 50 mL water), the −250 mV deposition indicated that the “5 min” copper complexing capacity of the extract corresponds to ~50 µM. At the end of this titration experiment, deposition and stripping runs were continued in order to monitor the Cu signal for an additional 18 h in order to determine if the copper signal had stabilized. The results showed that the signal continued to decrease over an approximate 7 h period. This result indicated the occurrence of slow copper binding kinetics, and demonstrated that the 5 min contact time only presented a portion of the copper binding capacity of the soils extract. The results for the repeated scans are presented in Figure 10.
After stabilization of the copper signal, the titration experiment was continued, with additional Cu2+, in order to estimate the copper binding capacity of the sample after an 18 h contact time. The potentiostat was programmed to perform three successive depositions and detection scans at −250 mV, −400 mV, and −700 mV for each successive copper addition. The results of this analysis are shown in Figure 11. The results indicate that the copper complexing capacity increased to ~60 µM from ~50 µM for the −250 mV deposition.
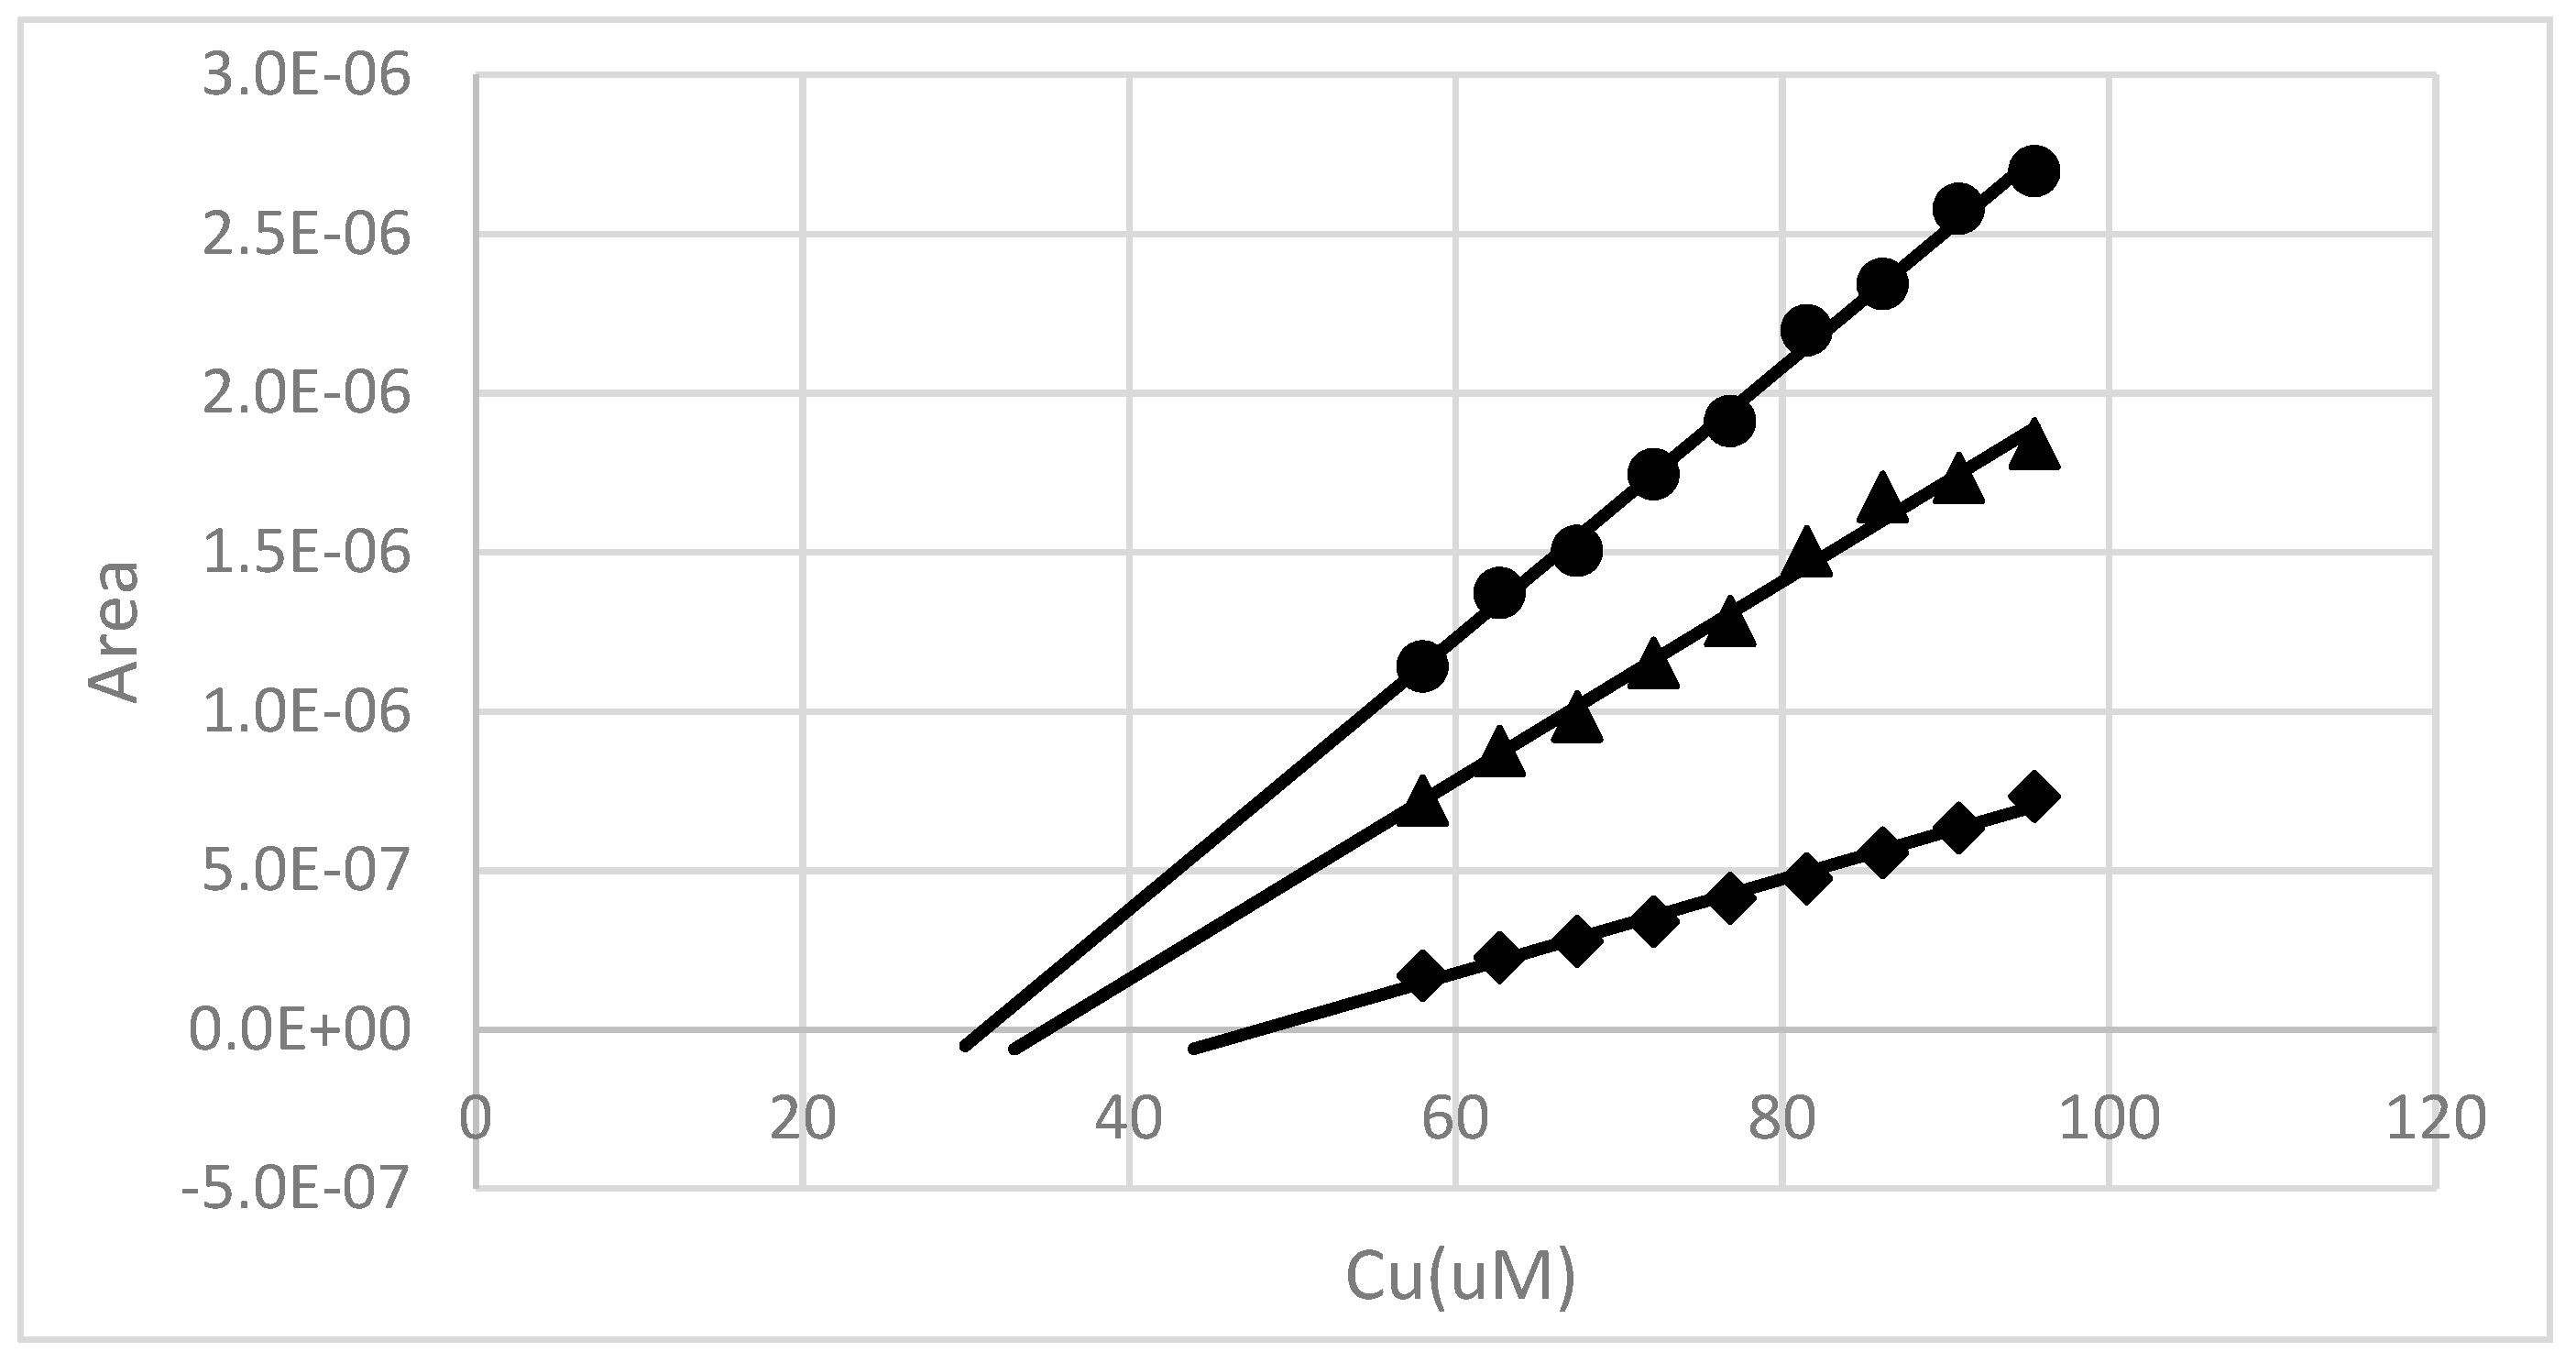
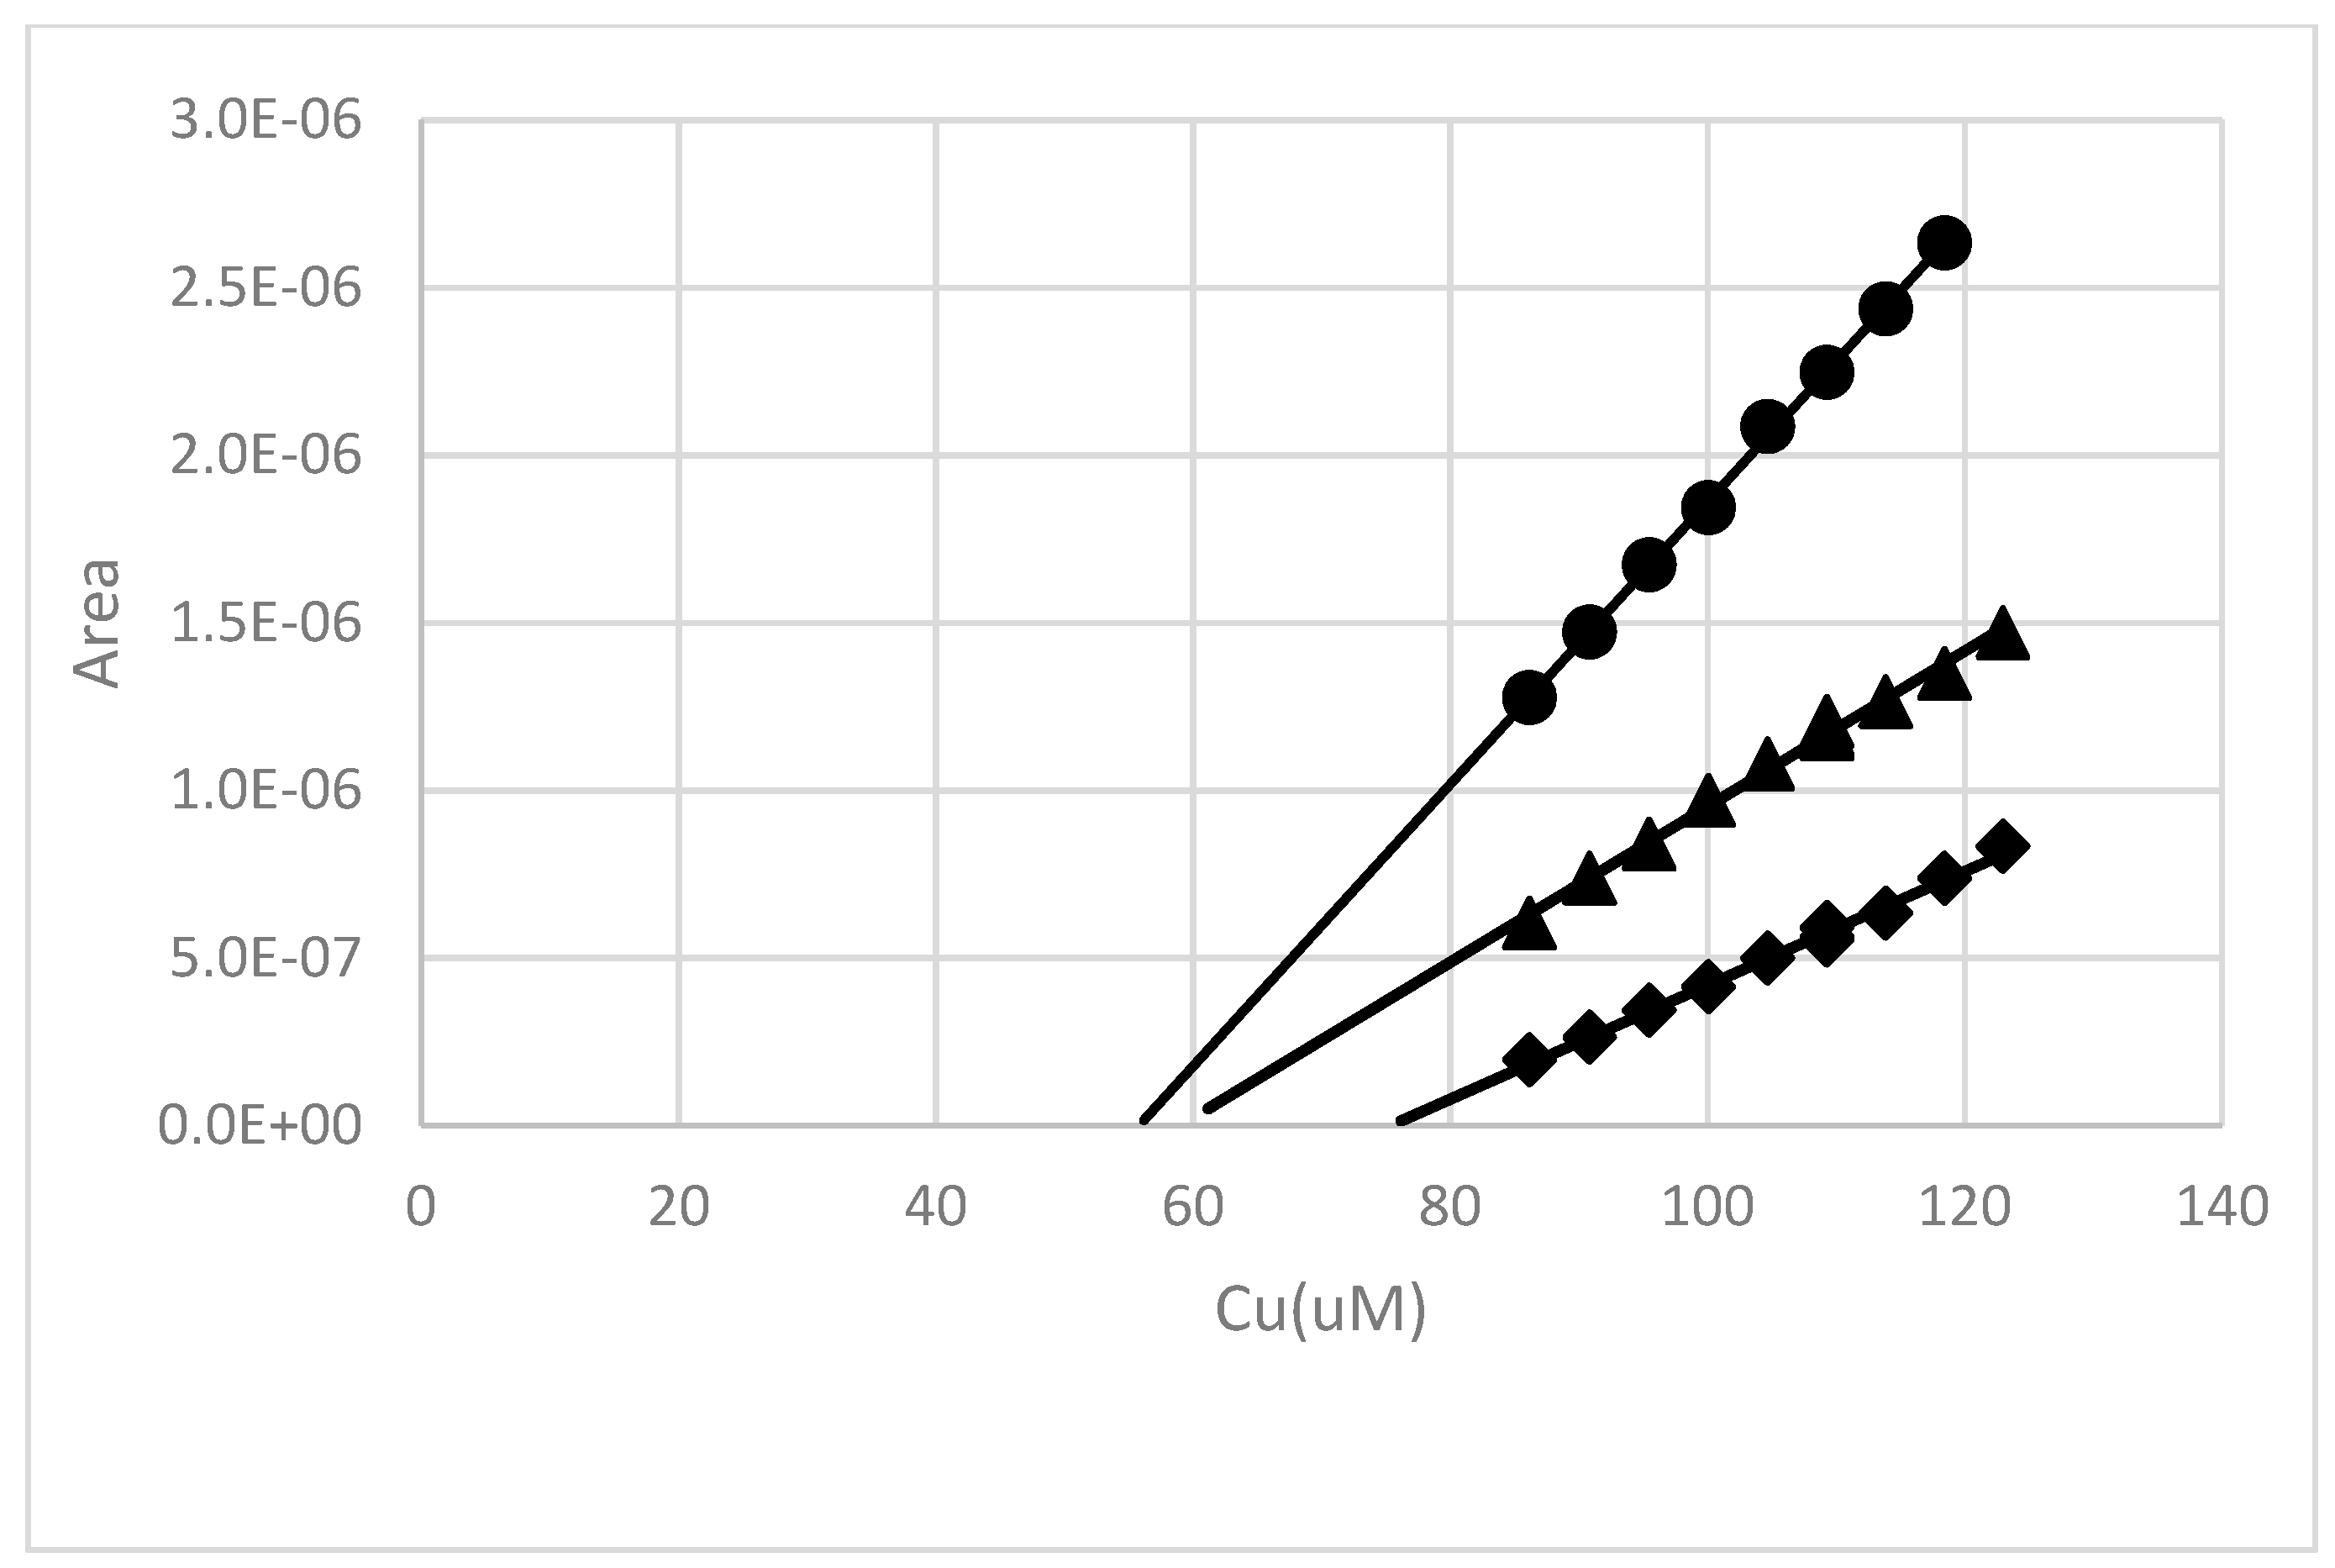
Eighteen hours’ contact time experiments were performed with water extracts from the surface soil sampled from under a creosote bush located at Halloran Springs road. For this set of experiments, 1.0 g aliquots of the Halloran Springs Road surface creosote soils were extracted with 50 mL of water over an 18 h period. Fifteen mL aliquots of the sample were then mixed with 1.0 mL of buffer solution (pH 6.15, pH 7, and pH 8). A 300 µL aliquot of 200 ppm Cu was added giving the samples a ~59 µM total copper concentration. The sample was allowed to equilibrate overnight (18 h) after which a Cu2+ titration was performed. For each copper addition, the copper analysis was conducted using three different deposition voltages (−250 mV, −400 mV, −700 mV). The results are presented in Figure 12, where a copper complexing capacities of 46 µM was observed for a −250 mV deposition. The −400 mV and −700 mV deposition results indicated ~22 µM and 19 µM copper complexing capacities. As shown in Table 2, the experiment for a different 18 h extraction of the same soil indicated the copper complexing capacities of ~56 µM, 37 µM and 33 µM for −250 mV, −400 mV, and −700 mV deposition experiments. The difference in these results can likely be explained by variability in the organic carbon content of the water extract.
The results for the 18 h contact times are summarized in Table 2. The copper binding capacities for soil extracts from the root zones of creosote or salt cedar shrubs all showed significant increases in copper binding capacity with 18 h of contact time when compared to 5 min contact time.
In Figure 13, the salt cedar surface soil was extracted at the 50 mL of water to 1.0 g of soil ratio for 43 h. The complexing capacity of the extract was higher (~80 µM at −250 mV deposition) when compared to the 18 h extraction (~60 µM for the −250 mV deposition).
4. Discussion
In these titration experiments, copper added as Cu2+ may remain unbound or become associated with an inorganic ligand such as hydroxide or carbonate, or become complexed by humic-like organic material. The deposition potential used to elucidate association with organic matter should ideally be adjusted so that only the copper that is not associated with the dissolved organic carbon is deposited on the electrode. Ideally, the organically-bound metal would be electrochemically inert, and thus, easily differentiated from other forms of dissolved copper. In practice, these conditions are rarely fulfilled, and observations indicate that metals are associated with a broad spectrum of complexes of variable strength.
Polarography is often performed in order to estimate reduction potentials for metals and other substances in experimental solutions. A plot of the observed current against the applied voltage would show steps in the observed reduction current that correspond to the deposition of particular chemical species. The observed current would be proportional to species concentration. Thus, polarography could show separate reduction potentials for complexed and uncomplexed copper in these experiments. Generally, these experiments are done at concentrations in the mM range. Because this concentration range is not possible with these soil extracts, we utilized pseudo polarography as an alternative [31,32].
Our observations were similar for all of the soil samples recovered from the root zone of creosote or saltcedar, and do not indicate a clearly-defined reduction potential for the copper complex, but imply a heterogeneous mixture of copper complexing functionalities in these samples. This type of result has been observed by other investigators [33]. The observed pseudo polarography (Figure 5 and Figure 6) is consistent with our observation that the observed complexing capacity of organic ligands in the water extracts are dependent on deposition voltage used. The failure of the metal signal to plateau, with increasingly negative deposition voltage in our pseudo polarography experiments implies that copper, in these water extracts, forms complexes with a broad spectrum of stabilities.
We observed that copper complexation increased with pH in the pH range of 5 to 8. This observation is consistent with previous studies of metal complexation by fulvic and humic acids [34,35]. The pH effect is often ascribed to the increased ionization of carboxlic and phenol functional groups of soluble organic matter. The participation of sulfhydrl and amine groups may also be important, and should be further investigated.
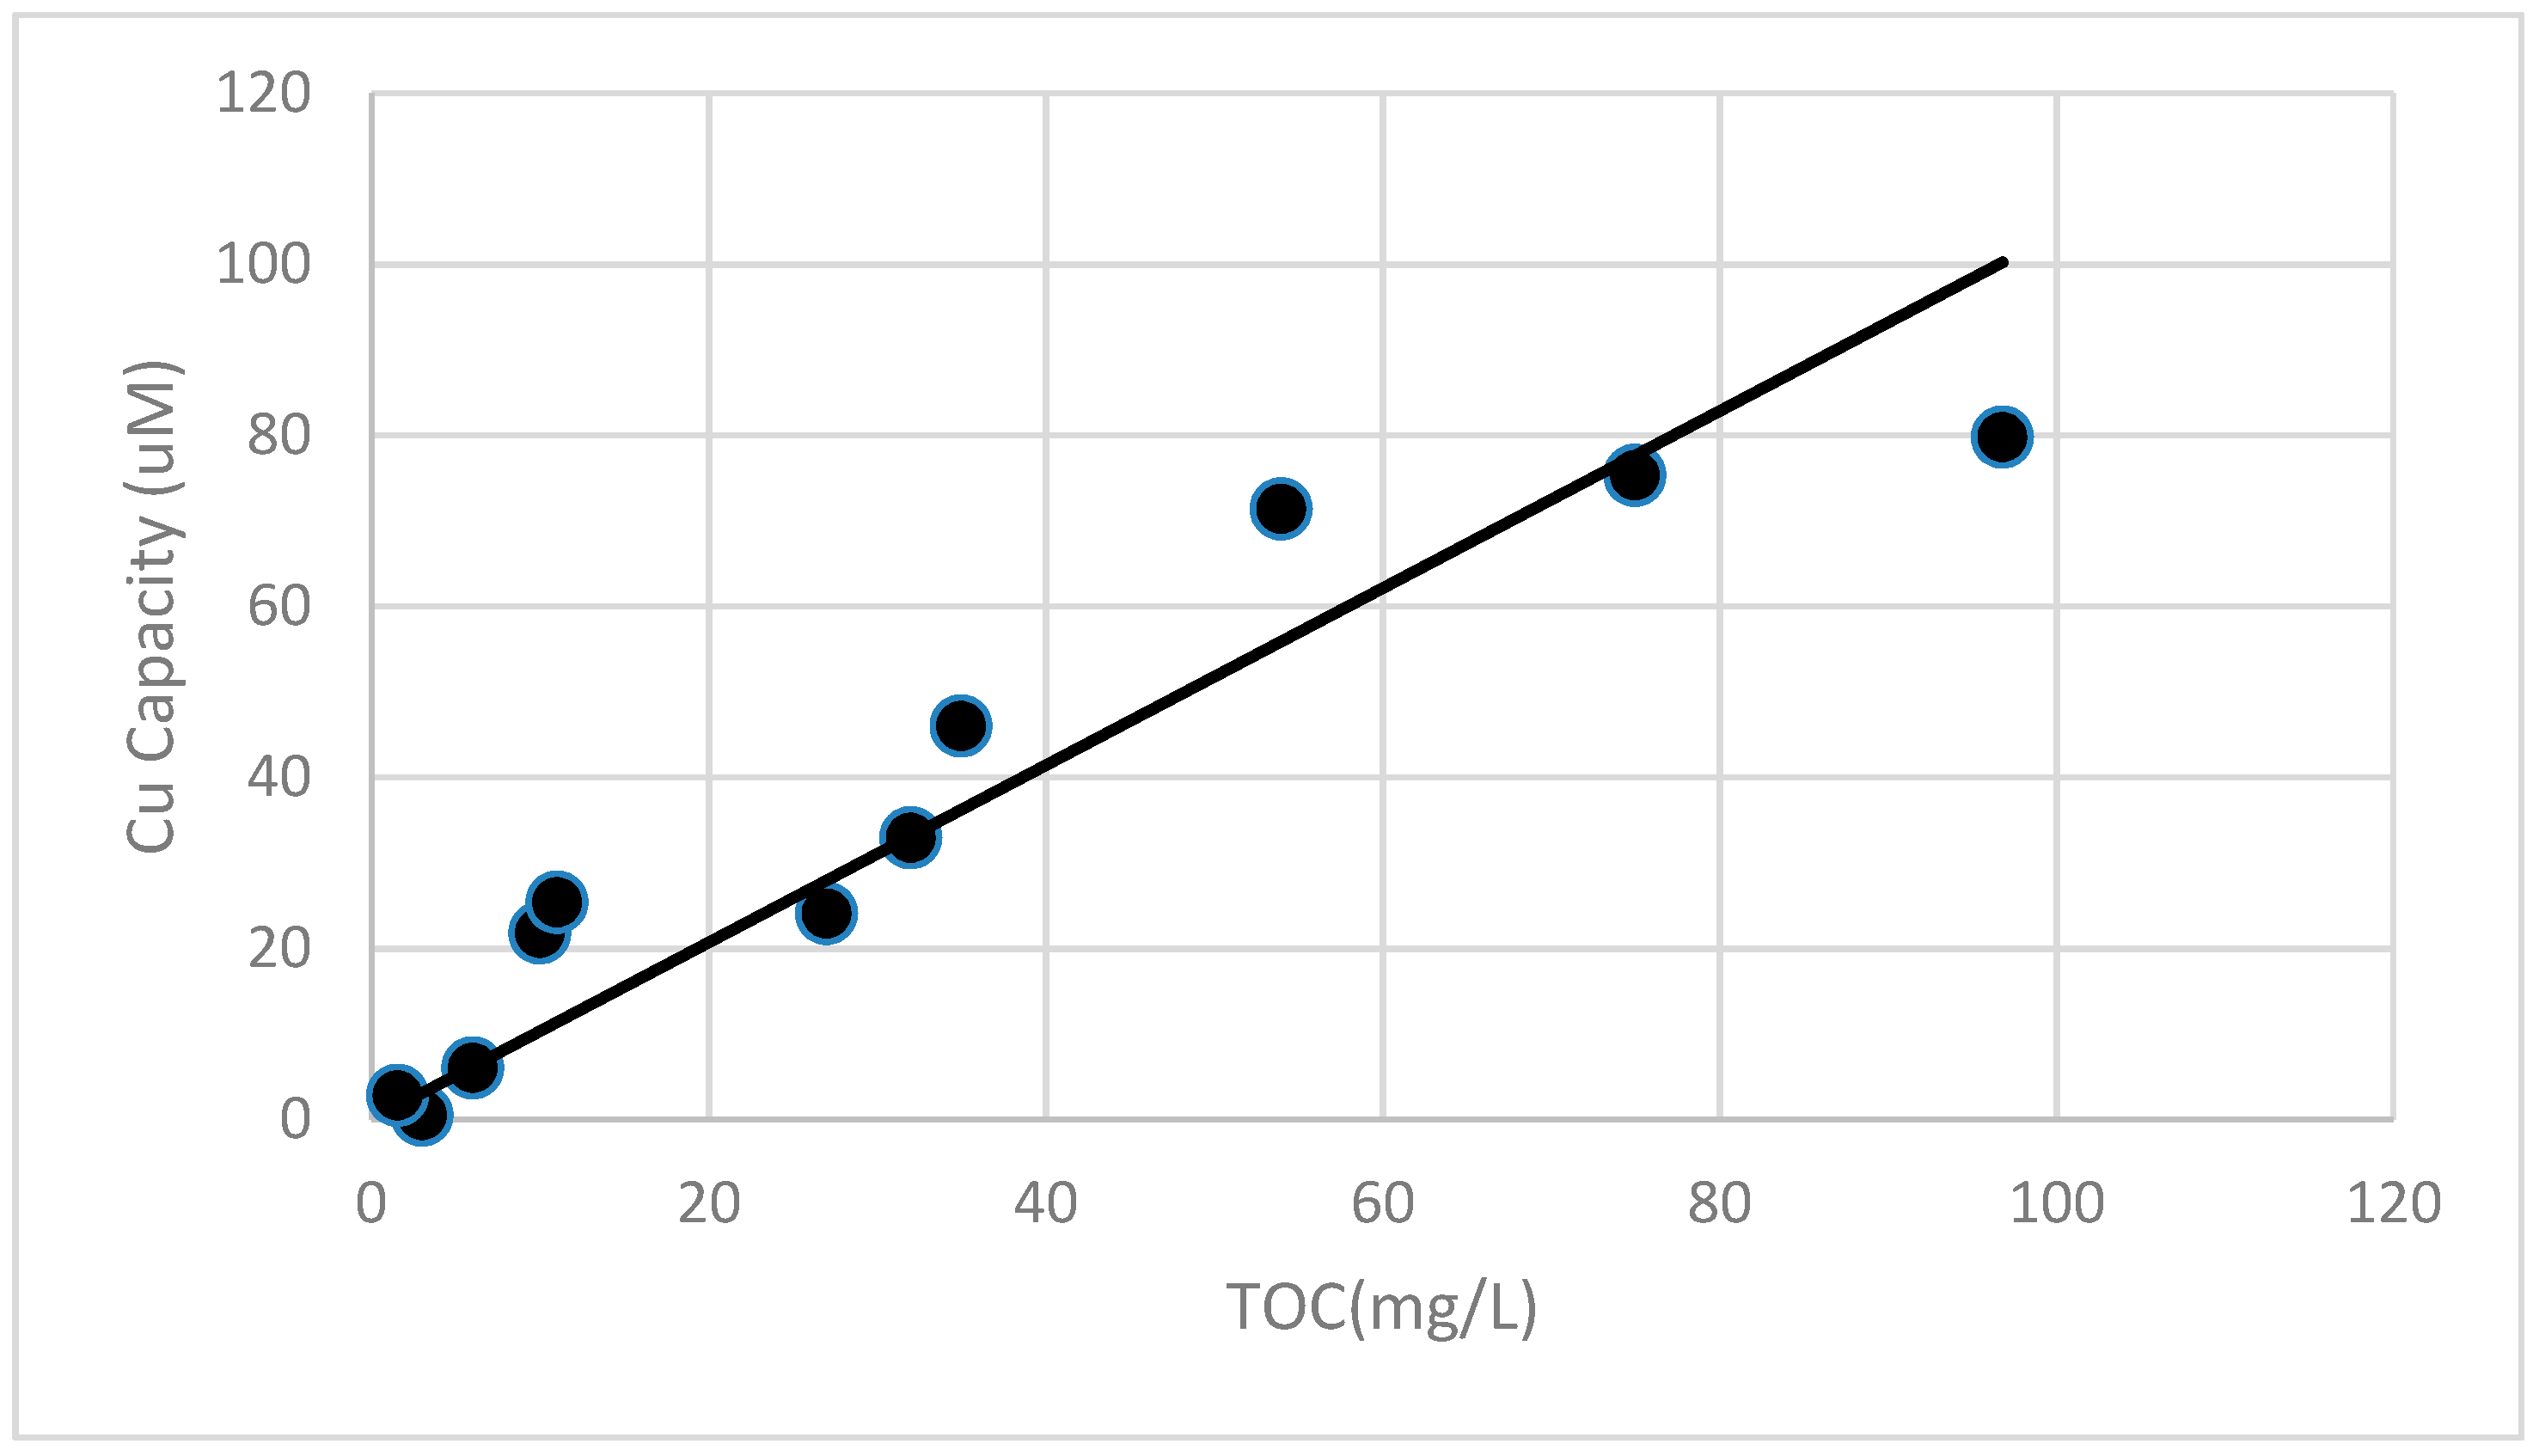
With this data set, there is a significant correlation of copper complexing capacity of an extract with the TOC concentration. This is illustrated in Figure 14 where the TOC content of the various water extracts is plotted against the ~18 h copper complexing capacity observed for the samples. The correlation provides evidence that dissolved organic carbon is the dominant complexing agent in these extracts. Admittedly, submicron inorganic and organic particulates may contribute as well.
5. Conclusions
Water extracts from soil sampled near the base of two types of woody shrubs (creosote and salt cedar) that are common in southern Nevada and southern California contained constituents that are able to significantly complex copper in the pH range of 5 to 8. Copper binding capacities were dependent upon contact time, pH, and the deposition voltage used during stripping analysis. The highest capacities were observed at pH 8, and ranged from ~50 µM to 80 µM for −250 mV deposition. At constant pH and deposition voltage, copper binding capacity was well correlated to the concentration of dissolved organic carbon in the extract. Copper binding was significantly higher with the 18 h copper–soil contact times when compared to 5 min contact times. These water soluble constituents in the soil extracts are a product of decomposing litter beneath these plants. This soluble organic matter will compete with insoluble constituents, and mineral surfaces for copper should influence its transport in these environments.
The implications of these observations are that metals in soils beneath the fertile islands may be associated with soluble organic material that may prevent or retard sorption onto soil, and thereby increase mobility for toxic metals in this environment. On the other hand, the solubilization of copper and other metals may make a metal more available for plant uptake and for removal by phyto-remediation or other soil cleaning process. These metal complexes under fertile islands clearly exhibit a broad range of stability, with complex formation being significantly time dependent.
We are presently collecting additional arid soil samples at various depths for additional analysis with the intent of gaining additional insight into the kinetics of metal binding by soluble and insoluble organic matter. Future measurement will include molecular characterization of soil organic matter using both pyrolysis gas chromatography mass spectrometry and conventional chemical characterization of the soil organic matter.
Author Contributions
S.M.S.: Conceptualization, methodology, experimental measurements, writing—original draft preparation. V.F.H.: Sampling, writing—review and editing.
Funding
This research received no external funding.
Conflicts of Interest
The authors declare no conflict of interest.
References
- Bolling, J.D.; Walker, L.R. Fertile island development around perennial shrubs across a Mojave Desert Chronosequence. West. N. Am. Naturalist 2002, 62, 88–100. [Google Scholar]
- Devitt, D.A.; Smith, S.D. Root channel macropores enhance downward movement of water in a Mojave Desert ecosystem. J. Arid Environ. 2002, 50, 99–108. [Google Scholar] [CrossRef]
- Lesica, P.; DeLuca, T.H. Is tamarisk allelopathic. Plant Soil 2004, 267, 357–365. [Google Scholar] [CrossRef]
- Liu, J.; Rong, Q.; Zhao, Y. Variations in soil nutrients and salinity caused by tamarisk in the coastal wetland of the Laizhou Bay, China. Ecosphere 2017, 8, 2–13. [Google Scholar] [CrossRef]
- Sposito, G.; Weber, J.H. Sorption of trace metals by humic materials in soils and natural waters. Crit. Rev. Environ. Control 1986, 16, 193–229. [Google Scholar] [CrossRef]
- Liu, A.; Gonzalez, R.D. Modeling adsorption of Copper (II), Cadmium (II) and Lead (II) on Purified Humic Acid. Langmuir 2000, 16, 3902–3909. [Google Scholar] [CrossRef]
- Weng, L.; Temminghoff, E.J.M.; Lofts, S.; Tipping, E.; Van Riemsdijk, W.H. Complexation with dissolved organic matter and solubility control of heavy metals in a sandy soil. Environ. Sci. Technol. 2002, 36, 4804–4810. [Google Scholar] [CrossRef] [PubMed]
- Davis, J.A. Complexation of trace metals by absorbed natural organic matter. Geochim. Cosmochim. Acta 1984, 48, 679–691. [Google Scholar] [CrossRef]
- Alvim Farraz, M.C.M.; Lourenco, J.C.N. The influence of organic matter content of contaminated soils on the leaching rate of heavy metals. Environ. Prog. 2000, 19, 53–58. [Google Scholar] [CrossRef]
- Gardea-Torresdey, J.L.; Arteaga, S.; Tiemann, K.J.; Chianelli, R.; Pingitore, N.; Mackay, W. Absorption of Copper (II) BY Creosote Bush (Larrea tridentata): Use of atomic and X-ray absorption spectroscopy. Environ. Toxicol. Chem. 2001, 20, 2572–2579. [Google Scholar] [CrossRef]
- Twiss, M.R.; Moffett, J.W. Comparison of copper speciation in coastal marine waters measured using analytical voltammetry and diffusion gradient in Thin-Film. Environ. Sci. Technol. 2002, 36, 1061–1068. [Google Scholar] [CrossRef] [PubMed]
- Apte, S.C.; Gardner, M.J.; Hunt, D.T.E. Copper (II) titration of fulvic acid ligand sites with theoretical, potentiometric, and spectrophotometric analysis. Environ. Technol. 1989, 10, 201–212. [Google Scholar] [CrossRef]
- Hart, B.T.; Davies, S.H.R. Trace metal speciation in the Freshwater and Estuarine Regions of the Yarra River, Victoria. Estuar. Coast. Shelf Sci. 1981, 12, 353–374. [Google Scholar] [CrossRef]
- Laborda, F.; Ruiz-Beguería, S.; Bolea, E.; Castillo, J.R. Functional speciation of metal-dissolved organic matter complexes by size exclusion chromatography coupled to inductively coupled plasma mass spectrometry and deconvolution analysis. Spectrochim. Acta B 2009, 392, 392–398. [Google Scholar] [CrossRef]
- Swallow, K.C.; Westall, J.C.; McKnight, D.M.; Morel, N.M.L.; Morel, F.M.M. Potentiometric determination of copper complexation by phytoplankton exudates. Limnol. Oceanogr. 1978, 23, 538–542. [Google Scholar] [CrossRef] [Green Version]
- Buffle, J.; Vuilleumier, J.J.; Tercier, M.L.; Parthasarathy, M. Voltammetric study of humic and fulvic substances V. interpretation of metal ion complexation measured by anodic stripping voltammetric methods. Sci. Total Environ. 1987, 60, 75–96. [Google Scholar] [CrossRef]
- Davison, W.; De Mora, S.J.; Harrisons, R.M.; Wilson, S. PH and ionic strength dependence of the ASV response of Cadmium, lead and Zinc in solutions which simulate natural waters. Sci. Total Environ. 1987, 60, 35–44. [Google Scholar] [CrossRef]
- Witter, A.E.; Mabury, S.A.; Jones, A.D. Copper (II) complexation in northern California rice field waters: An investigation using differential pulse anodic and cathodic stripping voltammetry. Sci. Total Environ. 1998, 212, 21–37. [Google Scholar] [CrossRef]
- Batley, G.E.; Florence, T.M. An evaluation and comparison of some techniques of anodic stripping voltammetry. J. Electroanal. Chem. Interfacial Electrochem. 1974, 55, 23–43. [Google Scholar] [CrossRef]
- Hoyer, B.; Florence, T.M.; Batley, G.E. Application of polymer-coated glassy carbon electrodes in anodic stripping voltammetry. Anal. Chem. 1987, 59, 1608–1614. [Google Scholar] [CrossRef]
- Hurst, M.P.; Bruland, K.W. The use of Nafion-coated thin mercury film electrodes for the determination of the dissolved copper speciation in estuarine water. Anal. Chim. Acta 2005, 546, 68–78. [Google Scholar] [CrossRef] [PubMed]
- Esteban, M.; De Jong, H.G.; Van Leeuwen, H.P. Metal speciation in polyelectrolyte systems by differential pulse anodic stripping voltammetry. Intern. J. Environ. Anal. Chem. 1990, 38, 75–83. [Google Scholar] [CrossRef]
- Van Leeuwen, H.P. Voltammetric titrations involving metal complexes: Effects of kinetics and diffusion coefficients. Sci. Total Environ. 1987, 60, 45–55. [Google Scholar] [CrossRef]
- Park, J.H.; Hodge, V.; Gerstenberger, S.; Stave, K. Mobilization of toxic elements from an abandoned manganese mine in the arid metropolitan Las Vegas (NV, USA) area. Appl. Sci. 2014, 4, 240–254. [Google Scholar] [CrossRef]
- Sims, D.B.; Keller, J.E. Risk of Metal Mobilization from redevelopment activities in hyperarid climates: A laboratory experiment and discussion. Mine Water Environ. 2014, 33, 307–316. [Google Scholar] [CrossRef]
- Stara, V.; Kopanica, M. Determination of manganese using the method of electrochemical enrichment. Electroanalysis 1993, 5, 595–598. [Google Scholar] [CrossRef]
- Yarnistsky, C.; Ariel, M. Reductions from a pre-enriched solution of amalgam-forming metals: A new electrochemical method. J. Electroanal. Chem. 1965, 10, 110–118. [Google Scholar]
- Hach Total Organic Carbon Method 10173. Hach Company. Available online: https://www.hach.com/asset-get.download.jsa?id=7639983637 (accessed on 19 November 2018).
- Hach Total Organic Carbon Method 10267. Hach Company. Available online: https://www.hach.com/asset-get.download.jsa?id=18722914801 (accessed on 19 November 2018).
- Whitby, H.; van den Berg, C.M.G. Evidence for copper-binding humic substances in seawater. Mar. Chem. 2015, 173, 282–290. [Google Scholar] [CrossRef]
- Croot, P.L.; Moffett, J.W.; Luther, G.W., III. Polarographic determination of half-wave potentials for copper-organic complexes in seawater. Mar. Chem. 1999, 67, 219–232. [Google Scholar] [CrossRef] [Green Version]
- Chakraborty, P.; Fasfoubatbs, I.I.; Murimboh, J.; Chakrabarti, C.L. Simultaneous determination of speciation parameters of Cu, Pb, Cd, Zn in model solutions of Suwannee River fulvic acid by pseudopolarography. Anal. Bioanal. Chem. 2007, 388, 463–474. [Google Scholar] [CrossRef] [PubMed]
- Filella, M.; Buffle, J.; Van Leeuwen, H.P. Effect of physico-chemical heterogeneity of natural complexants. Part I. Voltammetry of labile metal-fulvic complexes. Anal. Chem. Acta 1990, 232, 209–223. [Google Scholar] [CrossRef]
- Cabiniss, S.E.; Shuman, M.S. Copper binding by dissolved organic matter: I Suwannee River fulvic acid equilibria. Geochim. Cosmochim. Acta 1988, 52, 185–193. [Google Scholar] [CrossRef]
- Buffle, J.; Greter, F.-L.; Haerdi, W. Measurement of complexation properties of humic and fulvic acids in natural waters with lead and Copper Ion-Selective Electrodes. Anal. Chem. 1977, 49, 216–222. [Google Scholar] [CrossRef] [PubMed]
Figure 1.
Example of a copper titration of 15 mL of 1.14 µM EDTA (Disodium ethylenediaminetetraacetic acid) buffered to pH 7. Deposition was −500 mV for 20 min. The lines intersect at 1.28 µM.
Figure 1.
Example of a copper titration of 15 mL of 1.14 µM EDTA (Disodium ethylenediaminetetraacetic acid) buffered to pH 7. Deposition was −500 mV for 20 min. The lines intersect at 1.28 µM.

Figure 2.
Examples of titrations of 15 mL solutions of (A): histidine (80 µM) and (B): aspartic acid (87 µM) buffered to pH 8 with 1 mL of a HEPES buffer. Deposition was at −250 mV for 4 min.
Figure 2.
Examples of titrations of 15 mL solutions of (A): histidine (80 µM) and (B): aspartic acid (87 µM) buffered to pH 8 with 1 mL of a HEPES buffer. Deposition was at −250 mV for 4 min.

Figure 3.
An example titration of 25 mL of Teravita Leonardite humic acid (100 mg/L) buffered to pH 8 with HEPES. Three different deposition voltages (A). −700 mV, (B). −400 mV and (C). −250 mV were examined.
Figure 3.
An example titration of 25 mL of Teravita Leonardite humic acid (100 mg/L) buffered to pH 8 with HEPES. Three different deposition voltages (A). −700 mV, (B). −400 mV and (C). −250 mV were examined.

Figure 4.
A comparison of the ASV (▲) and the cathodic pre-enrichment (●) titration procedures outlined in the text. This sample was extracted from the surface soil from a salt cedar root zone. The deposition voltage was −400 mV for 4 min. The sample was buffered at pH 8, and a contact time of 5 min was allowed between Cu2+ additions.

Figure 5.
Pseudo polarography of soil from the root zone of a creosote plant located on the Lake Mead National Recreation Area. The pseudo polarography was performed with 4 min depositions from −100 mV to −1000 mV and at various concentrations. The solutions were buffered at pH 8.
Figure 5.
Pseudo polarography of soil from the root zone of a creosote plant located on the Lake Mead National Recreation Area. The pseudo polarography was performed with 4 min depositions from −100 mV to −1000 mV and at various concentrations. The solutions were buffered at pH 8.

Figure 6.
Pseudo polarography of a surface soil from the Lake Mead National Recreation Area. The soil was located at least 30 m from any shrubs or grass. The pseudo polarography was performed with 4 min depositions from −100 mV to −1000 mV and at various concentrations. The solutions were buffered at pH 8.

Figure 7.
Soil from the root zone of a Creosote plant located at the Halloran Springs Road location was titrated with copper at various pH values. The deposition voltage was −250 mV and the deposition time was 4 min. The sample solution was allowed to equilibrate for 5 min in between copper additions.

Figure 8.
The 5 min copper binding capacity of the creosote soil extract (10 g soil with 1000 mL water) is plotted as a function of the pH.
Figure 8.
The 5 min copper binding capacity of the creosote soil extract (10 g soil with 1000 mL water) is plotted as a function of the pH.

Figure 9.
Comparison of titration data for surface soils from the Three Kids Mine. The soil extract from the root zone of a creosote plant (▲) is compared to the soil extract from a vegetation free soil sample (●). Deposition was for 4 min at −250 mV. The sample solution was allowed to equilibrate for 5 min in between copper additions.

Figure 10.
A Salt Cedar root zone soil extract was adjusted to an initial 95 µM Cu2+ concentration at pH 8. The copper signal (pre-enrichment method) is monitored over ~18 h. The results illustrate that copper binding increased over a period of approximately 7 h.
Figure 10.
A Salt Cedar root zone soil extract was adjusted to an initial 95 µM Cu2+ concentration at pH 8. The copper signal (pre-enrichment method) is monitored over ~18 h. The results illustrate that copper binding increased over a period of approximately 7 h.

Figure 11.
An example of a pH 8 copper binding measurement made after an 18 h contact time with a 50:1 18 h water extract from soil near the root zone of a salt cedar. The Cu concentration was adjusted to 58 µM and then allowed to equilibrate for ~18 h. A Cu2+ titration was then performed at three different deposition potentials: −250 mV (♦), −400 mV (▲) and −700 mV (●).

Figure 12.
An example of a pH 8 copper binding measurement made after an 18 h contact time with a 50:1 18 h water extract from soil near the root zone of a creosote bush. The Cu concentration was adjusted to 58 µM, and then allowed to equilibrate for ~18 h. A Cu2+ titration was then performed at three different deposition potentials: −250 mV (♦), −400 mV (▲), and −700 mV (●).

Figure 13.
An example of a pH 8 copper binding measurement made after an 18 h contact time with a 50:1 43 h water extract from soil near the root zone of a salt cedar. The Cu concentration was adjusted to 85 µM, and then allowed to equilibrate for ~18 h. A Cu2+ titration was then performed at three different deposition potentials: −250 mV (♦), −400 mV (▲) and −700 mV (●).

Figure 14.
The TOC content of the various water extracts is correlated with the ~18 h copper complexing capacity observed for the samples (r2 = 0.86).
Figure 14.
The TOC content of the various water extracts is correlated with the ~18 h copper complexing capacity observed for the samples (r2 = 0.86).


Table 1.
Copper complexing capacity results for titrations with 5 min contact times.
| Location | Extraction Date | Water:Soil | Plant | pH | Equil Time | Dep Pot (mV) | Cu Capacity (µM) |
|---|---|---|---|---|---|---|---|
| 3 Kids | 8/31/2016 | 120 mL to 5 g column | Creosote | 8 | 5 min | −400 | 5.63 |
| 3 Kids | 8/31/2016 | 120 mL to 5 g column | Creosote | 8 | 5 min | −250 | 9.33 |
| 3 Kids | 1/23/2017 | 50 mL to 1 g 18 h | Creosote | 8 | 5 min | −250 | 9.19 |
| 3 Kids | 1/31/2017 | 50 mL to 1 g 18 h | None | 8 | 5 min | −250 | 0.69 |
| 3 Kids | 5/23/2017 | 50 mL to 1 g 18 h | None | 8 | 5 min | −400 | 0.04 |
| 3 Kids | 5/23/2017 | 50 mL to 1 g 18 h | None | 8 | 5 min | −250 | 0.45 |
| Halloran | 3/2/2017 | 50 mL to 1 g 18 h | Creosote Deep | 8 | 5 min | −250 | 13.2 |
| Halloran | 3/2/2017 | 50 mL to 1 g 18 h | Creosote | 8 | 5 min | −250 | 42.2 |
| Halloran | 3/13/2017 | 1000 mL to 10 g 18 h | Creosote | 8 | 5 min | −400 | 6.66 |
| Halloran | 3/13/2017 | 1000 mL to 10 g 18 h | Creosote | 8 | 5 min | −250 | 24.5 |
| Halloran | 3/15/2017 | 50 mL to 1 g 43 h | Salt Cedar | 8 | 5 min | −250 | 59.7 |
| Halloran | 3/21/2017 | 1000 mL to 10 g 18 h | Creosote | 7 | 5 min | −250 | 11.1 |
| Halloran | 3/24/2017 | 1000 mL to 10 g 18 h | Creosote | 5 | 5 min | −250 | 0.96 |
| Halloran | 4/4/2017 | 50 mL to 1 g 18 h | Salt Cedar | 8 | 5 min | −250 | 53.9 |
| Halloran | 5/12/2017 | 1000 mL to 10 g 18 h | Creosote | 8 | 5 min | −250 | 23.1 |
| Halloran | 9/21/2017 | 50 mL to 1 g 18 h | Salt Cedar | 8 | 5 min | −700 | 2.12 |
| Halloran | 9/26/2017 | 50 mL to 1 g 18 h | Salt Cedar | 8 | 5 min | −400 | 22.6 |
| Halloran | 3/23/2018 | 1000 L to 10 g 18 h | Creosote | 6.15 | 5 min | −250 | 4.56 |
| Lake Mead | 11/17/2016 | 50 mL to 1 g 18 h | None | 8 | 5 min | −250 | 1.42 |
| Lake Mead | 4/21/2017 | 50 mL to 1 g 18 h | Creosote | 8 | 5 min | −250 | 9.62 |
| Lake Mead | 5/9/2017 | 50 mL to 1 g 18 h | Creosote | 8 | 5 min | −250 | 6.95 |
Table 2.
Copper complexing capacity results for titrations with 18 h contact times.
| Location | Extraction Date | Water: Soil | Plant | pH | Equil Time (h) | Dep Pot (mV) | Cu Capacity (µM) |
|---|---|---|---|---|---|---|---|
| Halloran | 6/20/2017 | 50 mL to 1 g 18 h | Creosote | 8 | 18 | −250 | 55.7 |
| Halloran | 6/20/2017 | 50 mL to 1 g 18 h | Creosote | 8 | 18 | −400 | 37.2 |
| Halloran | 6/20/2017 | 50 mL to 1 g 18 h | Creosote | 8 | 18 | −700 | 33.3 |
| Halloran | 6/20/2017 | 50 mL to 1 g 18 h | Creosote | 7 | 18 | −250 | 48.5 |
| Halloran | 6/20/2017 | 50 mL to 1 g 18 h | Creosote | 7 | 18 | −400 | 41.9 |
| Halloran | 6/20/2017 | 50 mL to 1 g 18 h | Creosote | 7 | 18 | −700 | 45.8 |
| Halloran | 6/20/2017 | 50 mL to 1 g 18 h | Creosote | 6.15 | 18 | −250 | 40.4 |
| Halloran | 6/20/2017 | 50 mL to 1 g 18 h | Creosote | 6.15 | 18 | −400 | 31.9 |
| Halloran | 6/20/2017 | 50 mL to 1 g 18 h | Creosote | 6.15 | 18 | −700 | 29.4 |
| Halloran | 6/2/2017 | 50 mL to 1 g 18 h | Creosote | 8 | 18 | −250 | 46.3 |
| Halloran | 6/2/2017 | 50 mL to 1 g 18 h | Creosote | 8 | 18 | −400 | 21.5 |
| Halloran | 6/2/2017 | 50 mL to 1 g 18 h | Creosote | 8 | 18 | −700 | 19.0 |
| Halloran | 6/2/2017 | 50 mL to 1 g 18 h | Creosote | 7 | 18 | −250 | 43.0 |
| Halloran | 6/2/2017 | 50 mL to 1 g 18 h | Creosote | 7 | 18 | −400 | 32.2 |
| Halloran | 6/2/2017 | 50 mL to 1 g 18 h | Creosote | 7 | 18 | −700 | 32.7 |
| Halloran | 6/2/2017 | 50 mL to 1 g 18 h | Creosote | 6.15 | 18 | −250 | 27.0 |
| Halloran | 6/2/2017 | 50 mL to 1 g 18 h | Creosote | 6.15 | 18 | −400 | 4.64 |
| Halloran | 6/2/2017 | 50 mL to 1 g 18 h | Creosote | 6.15 | 18 | −700 | 13.3 |
| Halloran | 6/13/2017 | 50 mL to 1 g 18 h | Salt Cedar | 8 | 18 | −250 | 60.6 |
| Halloran | 6/13/2017 | 50 mL to 1 g 18 h | Salt Cedar | 8 | 18 | −400 | 47.8 |
| Halloran | 6/13/2017 | 50 mL to 1 g 18 h | Salt Cedar | 8 | 18 | −700 | 38.0 |
| Halloran | 6/13/2017 | 50 mL to 1 g 18 h | Salt Cedar | 7 | 18 | −250 | 58.7 |
| Halloran | 6/13/2017 | 50 mL to 1 g 18 h | Salt Cedar | 7 | 18 | −400 | 50.6 |
| Halloran | 6/13/2017 | 50 mL to 1 g 18 h | Salt Cedar | 7 | 18 | −700 | 42.6 |
| Halloran | 6/13/2017 | 50 mL to 1 g 18 h | Salt Cedar | 6.15 | 18 | −250 | 39.9 |
| Halloran | 6/13/2017 | 50 mL to 1 g 18 h | Salt Cedar | 6.15 | 18 | −400 | 33.5 |
| Halloran | 6/13/2017 | 50 mL to 1 g 18 h | Salt Cedar | 6.15 | 18 | −700 | 31.3 |
| Halloran | 6/13/2017 | 50 mL to 1 g 43 h | Salt Cedar | 8 | 18 | −250 | 80.3 |
| Halloran | 6/13/2017 | 50 mL to 1 g 43 h | Salt Cedar | 8 | 18 | −400 | 63.0 |
| Halloran | 6/13/2017 | 50 mL to 1 g 43 h | Salt Cedar | 8 | 18 | −700 | 59.5 |
© 2018 by the authors. Licensee MDPI, Basel, Switzerland. This article is an open access article distributed under the terms and conditions of the Creative Commons Attribution (CC BY) license (http://creativecommons.org/licenses/by/4.0/).
Share and Cite
MDPI and ACS Style
Steinberg, S.M.; Hodge, V.F. Copper Complexation by Dissolved Organic Matter in arid Soils: A Voltametric Study. Environments 2018, 5, 125. https://doi.org/10.3390/environments5110125
AMA Style
Steinberg SM, Hodge VF. Copper Complexation by Dissolved Organic Matter in arid Soils: A Voltametric Study. Environments. 2018; 5(11):125. https://doi.org/10.3390/environments5110125
Chicago/Turabian StyleSteinberg, Spencer M., and Vernon F. Hodge. 2018. "Copper Complexation by Dissolved Organic Matter in arid Soils: A Voltametric Study" Environments 5, no. 11: 125. https://doi.org/10.3390/environments5110125
Note that from the first issue of 2016, this journal uses article numbers instead of page numbers. See further details here.