
The Role of Technology Spillovers in the Process of Water Pollution Abatement for Large International Firms


1
Department of Business and Economic studies, University of Naples Parthenope, Naples 80132, Italy
2
Department of Economic and Statistic Sciences, University of Salerno, Fisciano 84084, Italy
*
Author to whom correspondence should be addressed.
Sustainability 2017, 9(5), 868; https://doi.org/10.3390/su9050868
Submission received: 20 March 2017
/
Revised: 10 May 2017
/
Accepted: 17 May 2017
/
Published: 21 May 2017
(This article belongs to the Special Issue Sustainability of Economic and Management Systems: Perspectives of Uncertainty and Data Driven Optimization)
Abstract
:The objective of this paper is to analyze the effects of technology externalities stemming from different technological sectors for international firms engaged both in water pollution abatement and in dirty activities. We present a theoretical framework and an empirical analysis based upon a dataset composed of worldwide R&D-intensive firms. In order to identify the technological proximity between the firms, we construct an original Mahalanobis environmental industry weight matrix, based on the construction of technological vectors for each firm, with European ecological patents distributed across more technology classes. Opportune econometric techniques that deal with the firms’ unobserved heterogeneity and the weak exogeneity of the explanatory variables are implemented. The findings show significant spillover effects on the productivity and environmental performance of the firms.
1. Introduction
In advanced economies, successful modernization has brought forth new concerns about the long-term ecological viability of an advanced industrial society and renewed questions about the relation between material success and more fundamental human values, as discussed in Nelson and Winter [1]. Indeed, the roles of information, the formation of expectations by economic actors, the analysis of markets due to various imperfections, and issues relative to the efficiency of market systems have been identified as key elements of theoretical economics [1]. Many countries devote their efforts to foster economic growth, but this activity is often accompanied by the excessive use of natural resources. Thus, the sustainability issue assumes a key role in firms’ economic achievement. In the past, technological innovation in dirty production, characterized by continuous changes related to progress along a trajectory defined by a paradigm [2], has guaranteed continuous economic growth. The endogenous nature of market structures associated with the dynamics of innovation, the asymmetries among firms in technological capabilities, and the nature of diffusion processes have been deeply investigated [3], but now the attention paid to environmental issues requires a stronger complementarity with more sustainable production, based on new, cleaner alternatives [4]. Environmental innovations represent a fundamental role in the process of integration between competitiveness and sustainability [5,6,7,8].
Literature about innovation frameworks has paid attention to the complementarity between dirty innovations and environmental ones [9,10,11,12]. Based on the background provided here, the overall aim of this paper is to analyze the effects of technological externalities in a particular natural resource sector: the environmental goal of water pollution abatement. The relevance and innovative nature of this study are based on the gap between empirical research and comparative studies investigating the effects of external sustainable innovation on firms’ productivity and environmental performance.
Since the analysis of sectoral patterns of technical change leads to relevant taxonomy based on firms, which has implications for the understanding of the sources and directions of technical change, firms’ diversification behavior, and the dynamic relationship between technology and industrial structure [13], in this paper we focus our attention on the analysis of integration processes between ecological activities. To this end, we identify technological patent classes of water pollution abatement for 240 large international firms located in the USA, Japan, and Europe, and we evaluate their Mahalanobis proximities. Since Jaffe’s proximity assumes flows only occur within the same technology class, Marshall-Arrow-Romer (MAR), intra-industry, or specialized externalities [14,15,16,17], but rule out spillovers between different classes, Jacobian, inter-industry, or diversified externalities [18], we use the Mahalanobis index [19,20] based on the frequency that patents are taken out in different classes by the same firm, and the co-location [21]. On the basis of the environmental technology matrix based on the Mahalanobis approach, we evaluate the effects of MAR and Jacobian environmental spillovers on firms’ productivity and environmental performance.
The paper is structured as follows: Section 2 introduces a theoretical framework of firms’ activities; Section 3 describes the data used in the empirical analysis; Section 4 presents the empirical analysis of three environmental targets including water pollution abatement, waste management efficiency, and energy production efficiency by economic area; and Section 5 concludes the paper.
2. Theoretical Framework
In the hope of deepening our empirical analysis, this section will provide a basic theoretical economic framework, with different sectors whose production will follow suitable abatement technologies for aquifer pollution, and be the result of the combination of a variety of technology classes, with physical, human, and knowledge capital. Inspired by Bretschger et al. [22], the final output of a sector, , may be taken as the arrangement of two different output techniques: the water pollution target () and the market target (), written as:
with: ,
with: , and
with: .
and , and stand, respectively, for physical and human capital according the two different techniques; the innovation technology effects are captured by the knowledge capital levels denoted by and , and patents denoted by , depending on , a variable which measures the effects of a variety of technological fields . Finally, stand, respectively, for patents, and the variable catching the special effects of the three different technological fields from abroad. We may easily derive that:
The short-run impacts of innovation on and may be written, respectively, as:
From the inspection of Equations (11) and (12), we can test the two following research hypotheses:
H1: The integration process between environmental technology fields (water pollution abatement) is relevant in the computation of spillover components of firms; and
H2: The effect of spillovers due to specialized water pollution abatement technology fields (MAR externalities) on firms’ productivity is positive.
3. Data
As in Aldieri et al. [23], we use information from the OECD REGPAT database, February 2016 [24] (See Maraut et al. [25] for the methodology used for the construction of REGPAT. Please contact [email protected] to download REGPAT database). This dataset covers firms’ patent applications to the European Patent Office (EPO), including patents published up to December 2015. The dataset covers regional information for most OECD and EU27 countries, plus BRICS countries. In particular, we match the name of the same 240 firms to the applicant’s name from the 2013 EU Industrial R&D Investment Scoreboard and the JRC Scientific and Technical Research series (http://iri.jrc.ec.europa.eu/scoreboard.html [26]), as in Aldieri [20].
The matching between the firms and their counterparts in the OECD REGPAT database, February 2016 [24], is not easy and leads to one difficulty: many large firms have several R&D-performing subsidiaries in several countries and, thus, it is hard to link the patents applied by these subsidiaries to the parent company. Unfortunately, we cannot prepare an accurate mapping because of changes through mergers and acquisitions processes. We follow two steps: patents are assigned to firms on the basis of their generic name, and this procedure is repeated for each firm of our sample [20]. The third source of data is the World Input Output Database (WIOD), which is made up of four different accounts (world tables, national tables, socioeconomic accounts and environmental accounts). For the purposes of this paper, we use the environmental accounts providing CO2 emission variables by country and by year.
As in Marin and Lotti [27], environmental innovations are identified through appropriate indicators on patent data, according to their technological class [28]. In Table 1, we report those patents with IPC codes belonging to the groups selected by the OECD or the World Intellectual Property Organization (WIPO).
As we can see from Table 1, we focus our attention on the water pollution abatement environmental goals of firms. In particular, we analyze the integration process degree between environmental technology classes, as discussed in the previous sections.
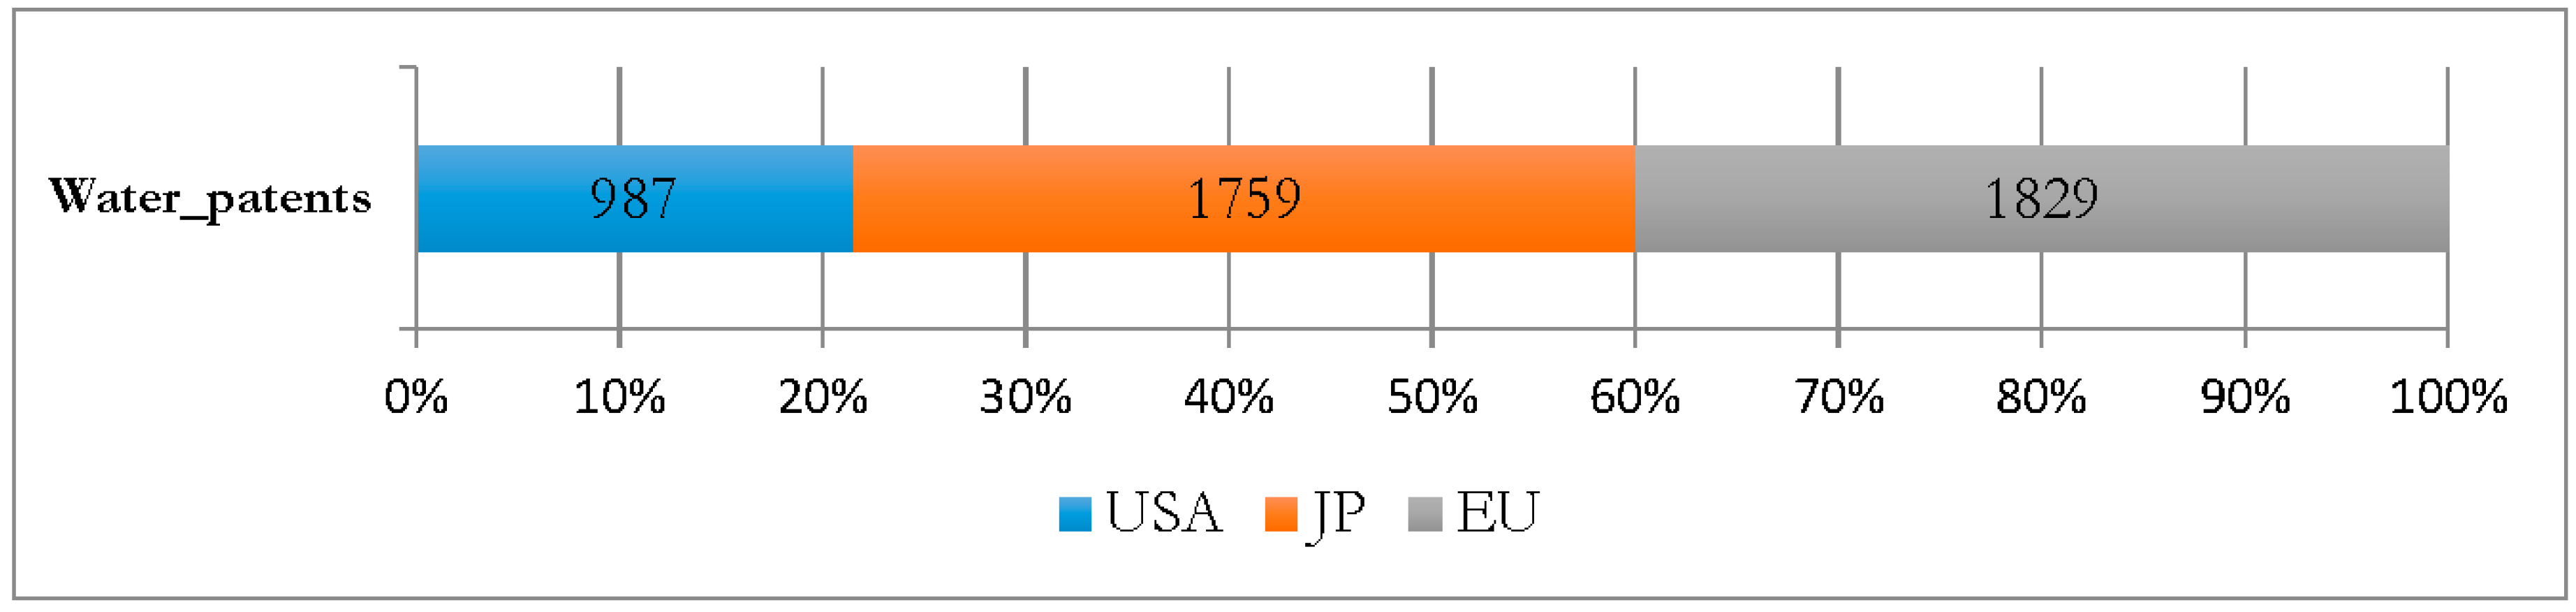
Figure 1 presents the distribution of water pollution abatement patents by economic area. As we can observe from the figure, European firms tend to specialize in the water environmental target.
The aim of this paper is to investigate the integration degree between technology classes of environmental patents. Since Jaffe’s proximity assumes flows only occur within the same technology class, (MARS externalities), intra-industry, or specialized externalities, but rules out spillovers between different classes, Jacobian, inter-industry, or diversified externalities, we use the Mahalanobis index based on the frequency that patents are taken out in different classes by the same firm and the same co-location. Thus, we compute an Environmental Technology Matrix based on the Mahalanobis approach [23].
4. Empirical Framework
4.1. Model Specification
To identify the impact of environmental spillovers on firms’ productivity, we consider the following specification model:
where:
- = natural logarithm;
- = productivity measured by net sales for firm i and year t;
- = physical capital stock for firm i and year t;
- = number of employees for firm i and year t;
- = R&D capital stock of firm i and year t;
- = firm’s fixed effects;
- = set of time dummies;
- = vector of Marshall-Arrow-Romer spillovers for firm i and year t;
- = vector of Jacobian spillovers for firm i and year t;
- = vectors of parameters; and
- = disturbance term.
Moreover, in order to evaluate the environmental performance of knowledge spillovers, we also estimate another model with the ratio between productivity and CO2 (SCO2) as the dependent variable [29] and regressors such as those in Equation (13). In Table 2, we show the summary statistics of our sample. In particular, we consider both the environmental spillovers based on the Mahalanobis procedure [23] and the R&D capital stock based on the perpetual inventory method [30] with a 5% initial growth rate and a 15% depreciation rate.
4.2. GMM Estimation Procedure
To address both firms’ unobserved heterogeneity and the weak exogeneity of the explanatory variables, we estimate Equation (13) using a one-stage generalized method of moments (GMM) estimator (see Arellano and Bover [31] and Blundell and Bond [32]), which combines the standard set of equations in the first difference with suitably lagged levels as instruments (GMM in first differences), with an additional set of equations in levels with suitably-lagged first differences as instruments, as in Aldieri and Cincera [33]. The validity of these additional instruments, which consist of first difference-lagged values of the regressors, can be tested through over-identification tests. The one-stage GMM (GMM SYS) estimator can lead to considerable improvements in terms of efficiency compared to the GMM in the first differences (GMM FD).
In Table 3 and Table 4, we present the empirical estimates for the GMM SYS estimator. In particular, we show the effects of specialized activities’ spillovers (MARS) and diversified technology fields’ spillovers (JS) on firms’ productivity in Table 3, and we show the environmental performance effects of spillovers in Table 4. We lag the environmental spillover components by a year in order to reflect the delayed response and also to mitigate contemporaneous feedback effects.
As the model is over-identified in the sense that there are more instruments than parameters to be estimated, the validity of the instruments can be tested by means of the Hansen test for over-identified restrictions. Considering the set of instruments used and the need to satisfy the orthogonality conditions, it helps to verify the null hypothesis of the joint validity of the instruments. The Hansen test statistic is X2 distributed under the null with (p–k) degrees of freedom (where p is the number of instruments and k is the number of variables in the regression).
The model specification includes country, time, and industry dummies, which capture the impact of factors that change over time, but not over the cross-sectional dimension of the sample. Table 3 presents the Hansen test of over-identifying restrictions and tests for first-order (AR (1)) and second-order (AR (2)) serial correlation tests of first-differenced residuals. The result of the AR (2) tests is consistent with the assumption of no serial correlation in the residuals in levels and the Hansen tests do not reject the null hypothesis of valid instruments, indicating that the instruments are not correlated with the error term.
The interesting results are relative to causal effects of environmental spillovers on productivity and environmental performance. In particular, specialized environmental technology fields’ spillovers (MARS) have a positive impact, while the diversified activities portfolio (Jacobian spillovers) has a negative impact, thus confirming the theoretical predictions. This finding is extremely important for policy implications. In addition to European incentives to favor the complementarity between dirty and environmental activities to balance competitiveness and sustainability, the integration between the water pollution abatement technology fields is also crucial for a fully-sustainable achievement of firms.
5. Conclusions
The motivation for developing this investigation stems from questions about outcomes of economic areas that excel in the global economic scene. According to Paredis [34], all countries have responsibilities for achieving sustainable growth, but the industrialized countries should take the lead.
Related to the importance of technological innovation for the economic growth of countries, the paper explores the integration process between dirty activities and environmental ones, such as water pollution abatement.
The relevance and the innovative nature of this study are based on the gap between empirical research and comparative studies investigating the effects of external sustainable innovation on firms’ productivity and environmental performance.
In particular, the aim of this paper is to investigate the role of externalities stemming from different technological sectors in the water pollution abatement field for international firms engaged in both environmental and in dirty activities. Indeed, the importance of analyzing the sectoral patterns of technical change is well documented [13]. Literature about innovation frameworks has paid attention to the complementarity between dirty and environmental innovations. The results of these studies lead to the lack of integrated innovation adoption behind environmental productivity performance. We present a theoretical framework and an empirical analysis of the United States, Japan, and Europe based on a dataset composed of worldwide R&D-intensive firms. In order to identify the technological proximity between the firms, we construct an original Mahalanobis environmental industry weight matrix, based on the construction of technological vectors for each firm, with European ecological patents distributed across more technology classes. The final results evidence a significant impact of environmental spillovers on firms’ productivity.
The analysis presented here is not intended to exhaust the discussion. Indeed, more empirical investigations of other environmental goals should be performed to generalize our results.
Acknowledgments
The authors wish to thank the editor and two anonymous reviewers for their useful comments on the previous drafts of the work.
Author Contributions
Conflicts of Interest
The authors declare no conflict of interest.
References
- Nelson, R.R.; Winter, S.G. An Evolutionary Theory of Economic Change; The Belknap Press of Harvard University Press: Cambridge, MA, USA; London, UK, 1982. [Google Scholar]
- Dosi, G. Technological paradigms and technological trajectories. Res. Policy 1982, 11, 147–162. [Google Scholar] [CrossRef]
- Dosi, G. Sources, Procedures, and Microeconomic Effects of Innovation. J. Econ. Lit. 1988, 26, 1120–1171. [Google Scholar]
- Santana, N.B.; Do Nascimento Rebelatto, D.A.; Périco, A.E.; Moralles, H.F.; Filho, W.L. Technological innovation for sustainable development: an analysis of different types of impacts for countries in the BRICS and G7 groups. Int. J. Sustain. Dev. World Ecol. 2015, 22, 425–436. [Google Scholar]
- Cainelli, G.; Mazzanti, M.; Montresor, S. Environmental innovations, local networks and Internalization. Ind. Innov. 2012, 19, 697–734. [Google Scholar] [CrossRef]
- De Marchi, V. Environmental innovation and R&D cooperation: Empirical evidence from Spanish manufacturing firms. Res. Policy 2012, 41, 614–623. [Google Scholar]
- Horbach, J. Determinants of environmental innovations-new evidence from German panel data sources. Res. Policy 2008, 37, 163–173. [Google Scholar] [CrossRef]
- Kemp, R.; Pontoglio, S. The innovation effects of environmental policy instruments-a typical case of the blind men and the elephant? Ecol. Econ. 2011, 72, 28–36. [Google Scholar] [CrossRef]
- Hall, B.; Mairesse, J.; Lotti, F. Evidence on the impact of R&D and ICT investment on innovation and productivity in Italian firms. Econ. Innov. New Technol. 2012, 22, 300–328. [Google Scholar]
- Mancinelli, S.; Mazzanti, M. Innovation, Networking activities and complementarity. Empirical evidence on SME performances for a local economic system in Northern Italy. Annals Reg. Sci. 2009, 43, 567–597. [Google Scholar] [CrossRef]
- Mohnen, P.; Roller, L.H. Complementarities in innovation policy. Eur. Econ. Rev. 2005, 49, 1431–1450. [Google Scholar] [CrossRef]
- Aghion, P.; Dechezlepetre, A.; Hemous, D.; Martin, R.; Van Reenen, J. Carbon Taxes, Path Dependency and Directed Technical Change: Evidence from the Auto Industry. J. Political Econ. 2016, 124, 1–51. [Google Scholar] [CrossRef]
- Pavitt, K. Sectoral patterns of technical change: Towards a taxonomy and a theory. Res. Policy 1984, 13, 343–373. [Google Scholar] [CrossRef]
- Marshall, A. Priciples of Economics; Macmillan: London, UK, 1890. [Google Scholar]
- Arrow, K.J. The economic implications of learning by doing. Rev. Econ. Stud. 1962, 29, 155–172. [Google Scholar] [CrossRef]
- Romer, P.M. Increasing returns and long-run growth. J. Political Econ. 1986, 94, 1002–1037. [Google Scholar] [CrossRef]
- Glaeser, S.; Kallal, H.D.; Scheinkman, J.A.; Shleifer, A. Growth of cities. J. Political Econ. 1992, 100, 1126–1152. [Google Scholar] [CrossRef]
- Jacobs, J. The Economy of Cities; Random House: New York, NY, USA, 1969. [Google Scholar]
- Bloom, N.; Schankerman, M.; Van Reenen, J. Identifying technology spillovers and product market rivalry. Econometrica 2013, 81, 1347–1393. [Google Scholar]
- Aldieri, L. Knowledge technological proximity: Evidence from US and European patents. Econ. Innov. New Technol. 2013, 22, 807–819. [Google Scholar] [CrossRef]
- Lychagin, S.; Pinkse, J.; Slade, M.E.; Van Reenen, J. Spillovers in Space: Does Geography Matter? J. Ind. Econ. 2016. [Google Scholar] [CrossRef]
- Bretschger, L.; Lechthaler, F.; Rausch, S.; Zhang, L. Knowledge diffusion, endogenous growth, and the costs of global climate policy. Eur. Econ. Rev. 2017, 93, 47–72. [Google Scholar] [CrossRef]
- Aldieri, L.; Kotsemir, M.; Vinci, C.P. Jacobian Spillovers in Environmental Technological Proximity: The Role of Mahalanobis Index on European Patents within the Triad; MPRA Working Paper N. 77274; University Library of Munich: Munich, Germany, 2017. [Google Scholar]
- OECD. REGPAT Database. Available online: https://www.oecd.org/sti/inno/40794372.pdf (accessed on 1 March 2017).
- Maraut, S.; Dernis, H.; Webb, C.; Spiezia, V.; Guellec, D. The OECD REGPAT Database: A Presentation; STI Working Paper; OECD: Paris, France, 2008. [Google Scholar]
- European Commission. The 2013 EU Industrial R&D Investment Scoreboard. Available online: http://iri.jrc.ec.europa.eu/scoreboard.html (accessed on 1 March 2017).
- Marin, G.; Lotti, F. Productivity effects of eco-innovations using data on eco-patents. Ind. Corp. Chang. 2016. [Google Scholar] [CrossRef]
- OECD. Green Patents. Available online: http://www.oecd.org/env/indicators-modelling-outlooks/green-patents.htm (accessed on 1 March 2017).
- Repetto, R. Environmental productivity and why it is so important. Challenge 1990, 33, 33–38. [Google Scholar] [CrossRef]
- Griliches, Z. Issues in assessing the contribution of R&D to productivity growth. Bell J. Econ. 1979, 10, 92–116. [Google Scholar]
- Arellano, M.; Bover, O. Another look at the instrumental-variable estimation of error-components models. J. Econom. 1995, 68, 29–52. [Google Scholar] [CrossRef]
- Blundell, R.W.; Bond, S.R. Initial conditions and moment restrictions in dynamic panel data models. J. Econom. 1998, 87, 115–143. [Google Scholar] [CrossRef]
- Aldieri, L.; Cincera, M. Geographic and technological R&D spillovers within the triad: micro evidence from US patents. J. Technol. Transf. 2009, 34, 196–211. [Google Scholar]
- Paredis, E. Sustainability transitions and the nature of technology. Found. Sci. 2011, 16, 195–225. [Google Scholar] [CrossRef]
Figure 1.
Distribution of water patents by economic area.


Table 1.
Environmental patent classes.
| Macro Category | Sub-Category | IPC | |||||||
|---|---|---|---|---|---|---|---|---|---|
| Water | Water pollution abatement | C02F | E03F | E02B | C09K | C05F | B63J | E03C | E03B |
Table 2.
Summary statistics.
| Variable | Mean a | Std. Dev. |
|---|---|---|
| lnY | 8.50 | 1.450 |
| lnSCO2 | 21.68 | 4.021 |
| lnC | 7.49 | 1.584 |
| lnL | 9.97 | 1.360 |
| LnK | 7.15 | 1.426 |
| lnMARS | 0.09 | 0.328 |
| lnJS | 0.10 | 0.383 |
a: 1837 observations.
Table 3.
Productivity of environmental spillover effects: GMM estimates.
| Dependent Variable: ∆ lnYt | ||
|---|---|---|
| Estimate | S.E. a | |
| ∆lnY(t – 1) | 0.77 *** | (0.059) |
| ∆lnL | 0.19 *** | (0.048) |
| ∆lnC | −0.01 | (0.032) |
| ∆lnK | 0.09 *** | (0.028) |
| ∆lnMARS(t – 1) | 1.03 ** | (0.525) |
| ∆lnJS(t – 1) | −0.85 ** | (0.448) |
| AR (1) c test | z = −5.21 | p > z = 0.000 |
| AR (2) test | z = 0.33 | p > z = 0.742 |
| Hansen b: χ2 (129) = 141.71 | [0.210] | |
Notes: a: heteroskedastic-consistent standard errors; b: Hansen test of over-identifying restrictions, p-value in square brackets; c: AR(1) and AR(2) are tests for first- and second-order serial correlation; ***, **, coefficient significance at the 1% and 5% levels, respectively. Country, time, and industry dummies included. Endogenous variables are physical capital, labor, R&D capital stock, and spillovers. Instruments are lagged values (2–9) of all explanatory variables.
Table 4.
Environmental performance of spillover effects: GMM estimates.
| Dependent Variable: ∆ lnSCO2t | ||
|---|---|---|
| Estimate | S.E. a | |
| ∆lnSCO2t (t – 1) | 0.82 *** | (0.045) |
| ∆lnL | 0.44 *** | (0.107) |
| ∆lnC | −0.08 | (0.076) |
| ∆lnK | 0.22 *** | (0.068) |
| ∆lnMARS(t – 1) | 2.46 ** | (1.230) |
| ∆lnJS(t – 1) | −2.04 ** | (1.052) |
| AR (1) c test | z = −5.82 | p > z = 0.000 |
| AR (2) test | z = 0.15 | p > z = 0.884 |
| Hansen b:χ2 (129) = 146.93 | [0.134] | |
Notes are the same as those in the previous table.
© 2017 by the authors. Licensee MDPI, Basel, Switzerland. This article is an open access article distributed under the terms and conditions of the Creative Commons Attribution (CC BY) license (http://creativecommons.org/licenses/by/4.0/).
Share and Cite
MDPI and ACS Style
Aldieri, L.; Vinci, C.P. The Role of Technology Spillovers in the Process of Water Pollution Abatement for Large International Firms. Sustainability 2017, 9, 868. https://doi.org/10.3390/su9050868
AMA Style
Aldieri L, Vinci CP. The Role of Technology Spillovers in the Process of Water Pollution Abatement for Large International Firms. Sustainability. 2017; 9(5):868. https://doi.org/10.3390/su9050868
Chicago/Turabian StyleAldieri, Luigi, and Concetto Paolo Vinci. 2017. "The Role of Technology Spillovers in the Process of Water Pollution Abatement for Large International Firms" Sustainability 9, no. 5: 868. https://doi.org/10.3390/su9050868
Note that from the first issue of 2016, this journal uses article numbers instead of page numbers. See further details here.