Energy Stress-Mediated Cytotoxicity in Tuberous Sclerosis Complex 2-Deficient Cells with Nelfinavir and Mefloquine Treatment

 and
and 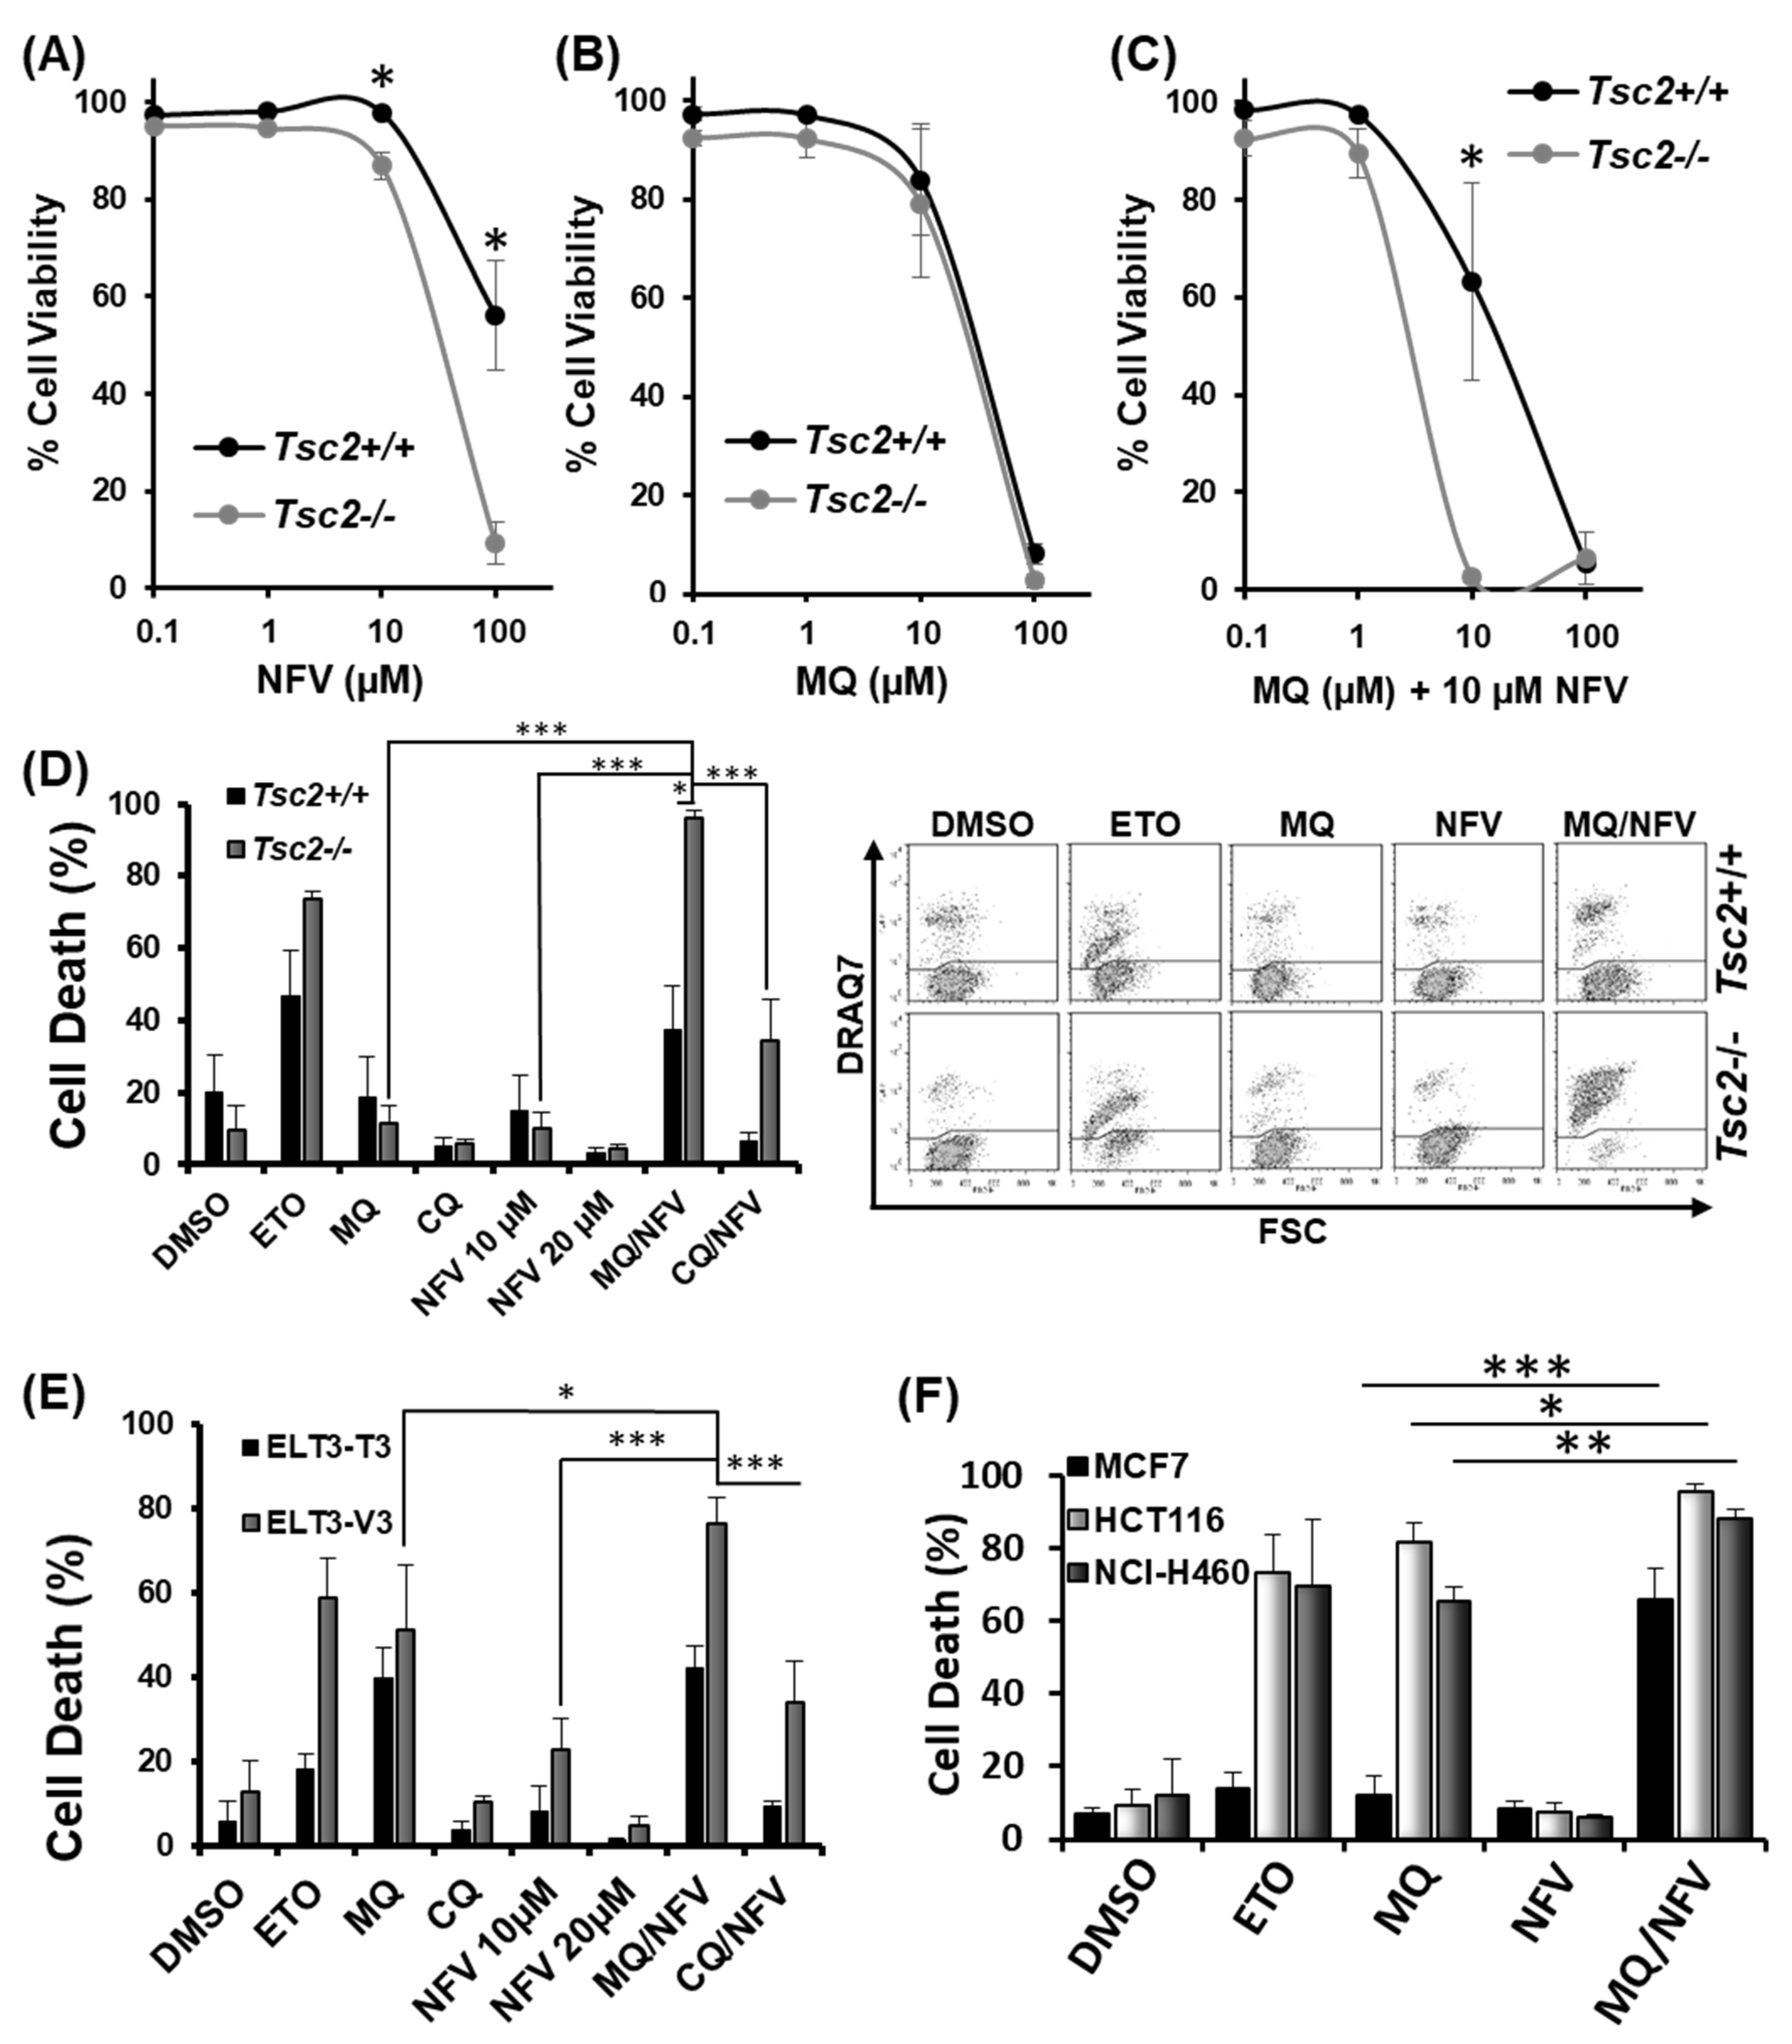
Abstract
:1. Introduction
2. Results
2.1. Nelfinavir and Mefloquine Synergize, and Selectively Kill Tsc2-Deficient Cell Lines
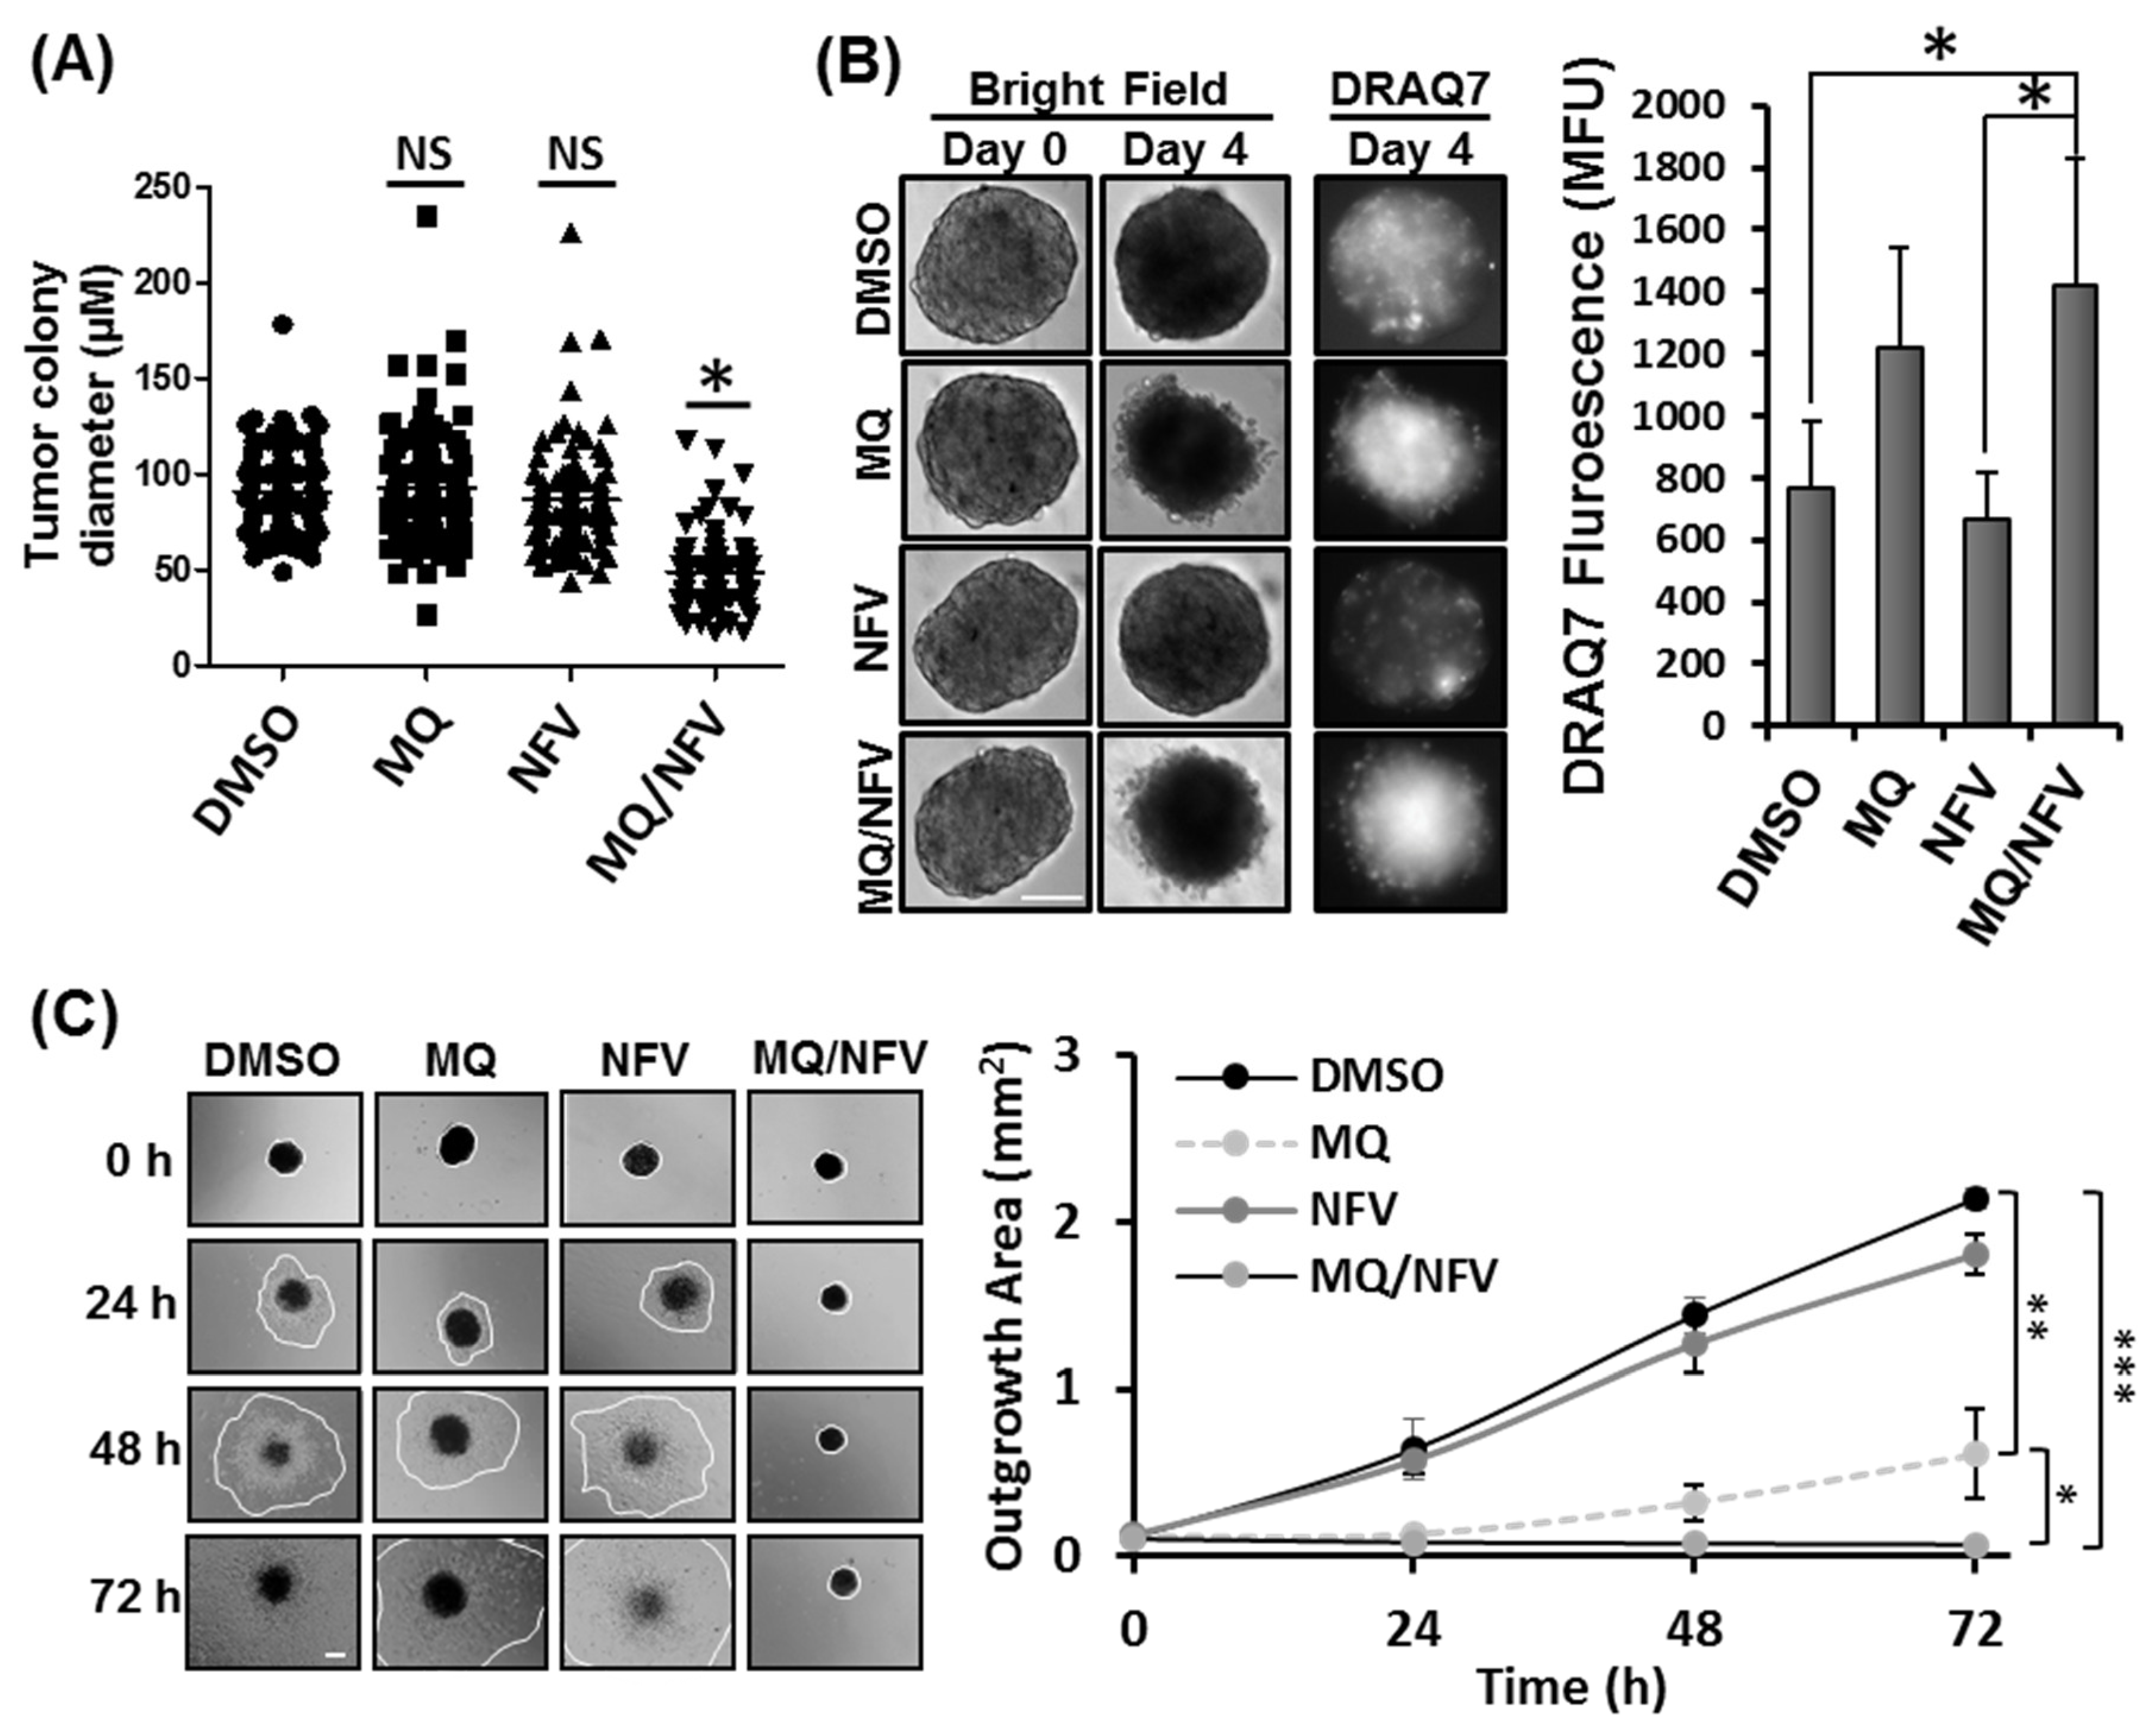
2.2. Combined Nelfinavir and Mefloquine Treatment Inhibits Tumor Formation, Induces Cytotoxicity in Tsc2−/− Spheroids, and Prevents Spheroid Outgrowth
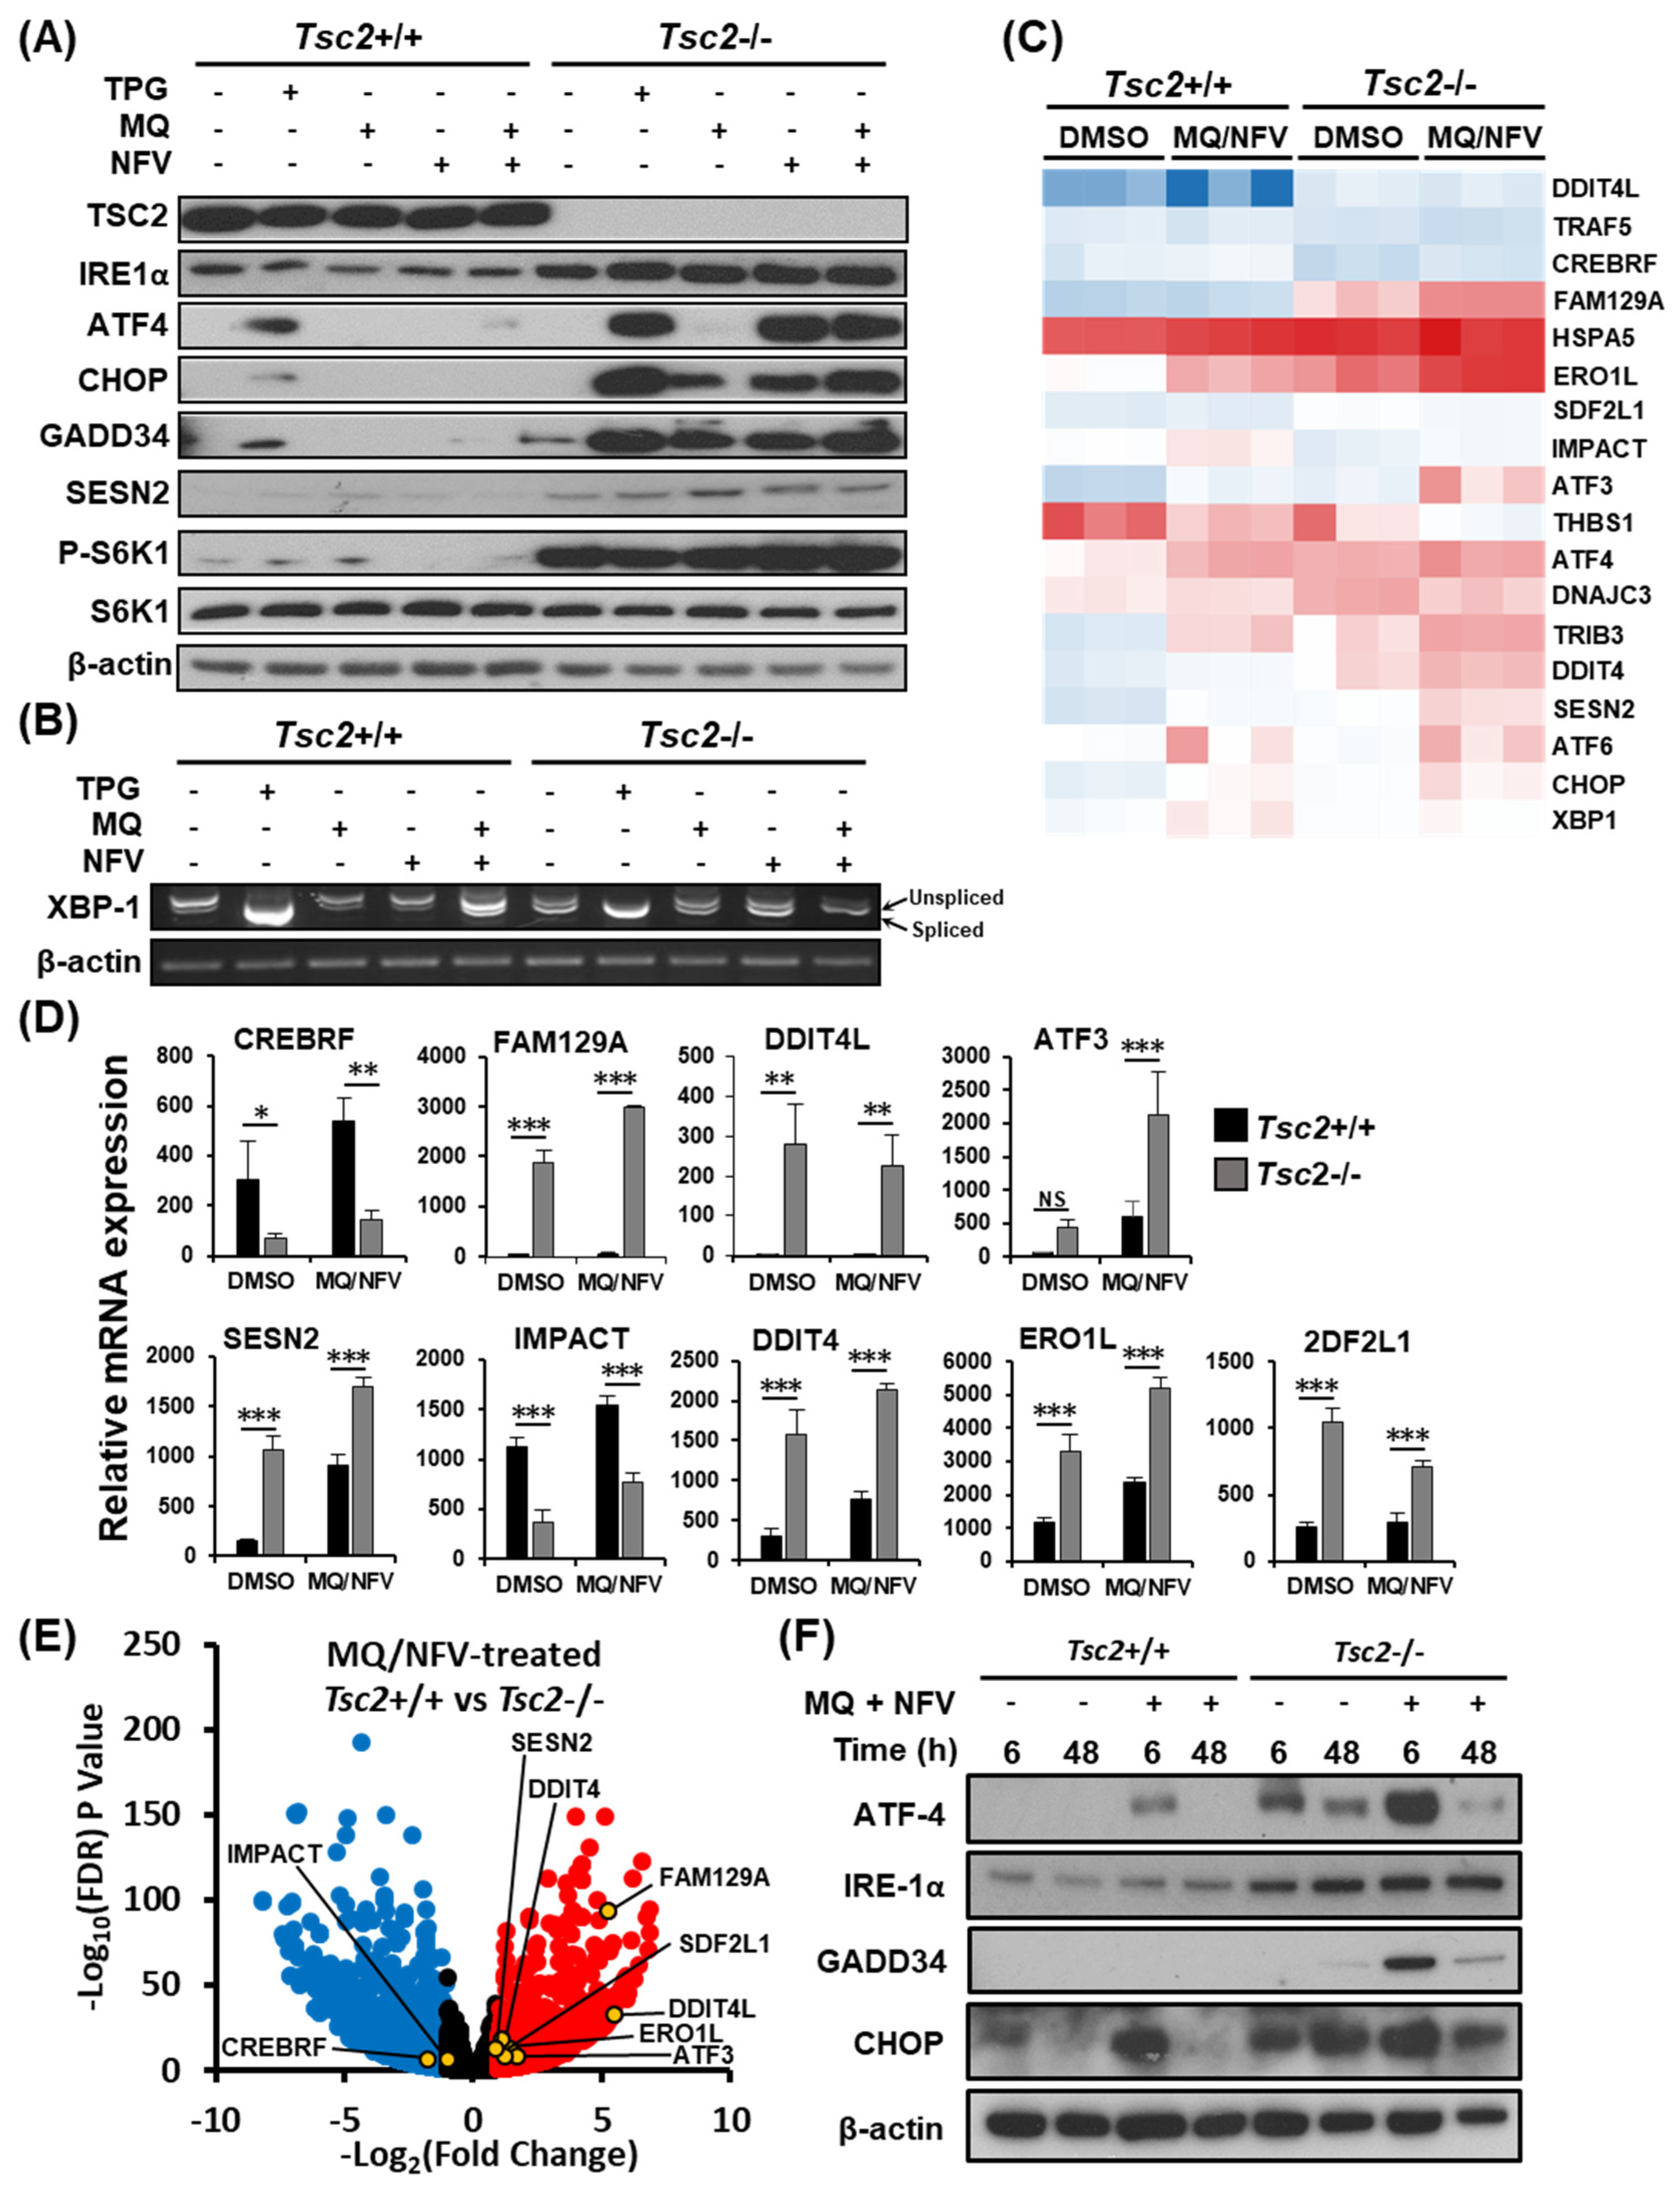
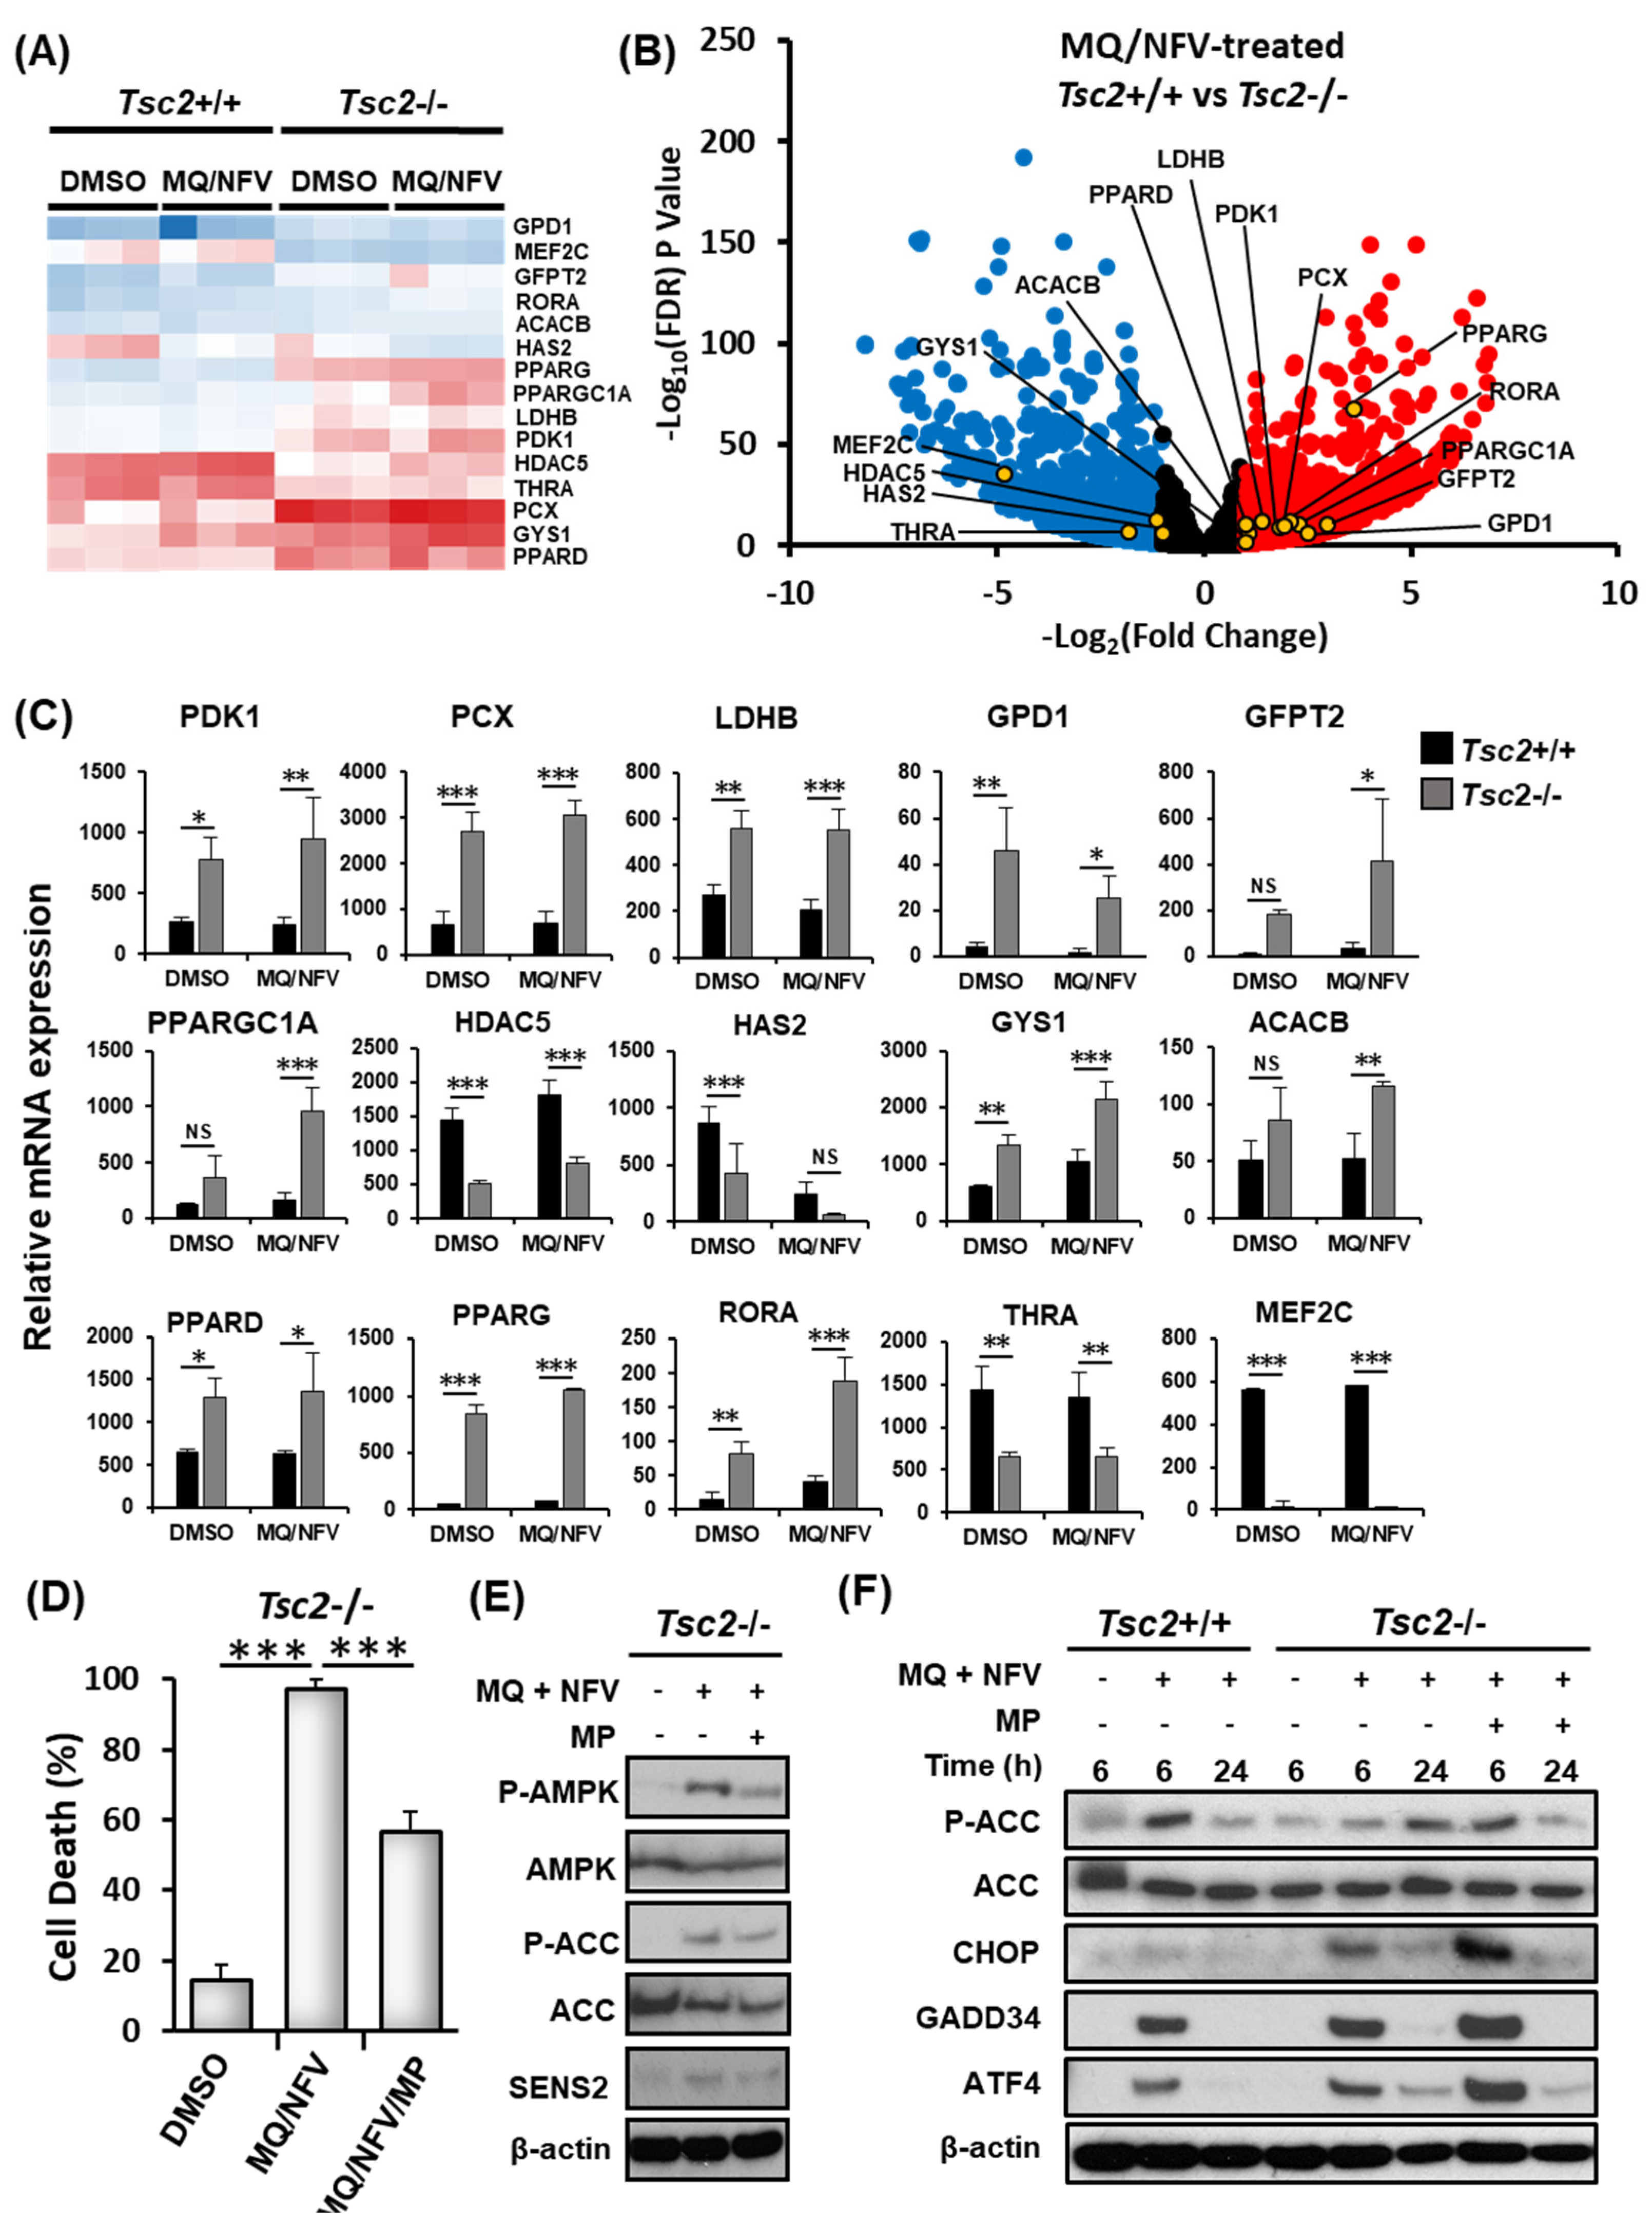
2.3. Homeostatic Balance is Lost in Tsc2−/− MEFs after Combination Treatment with Nelfinavir and Mefloquine
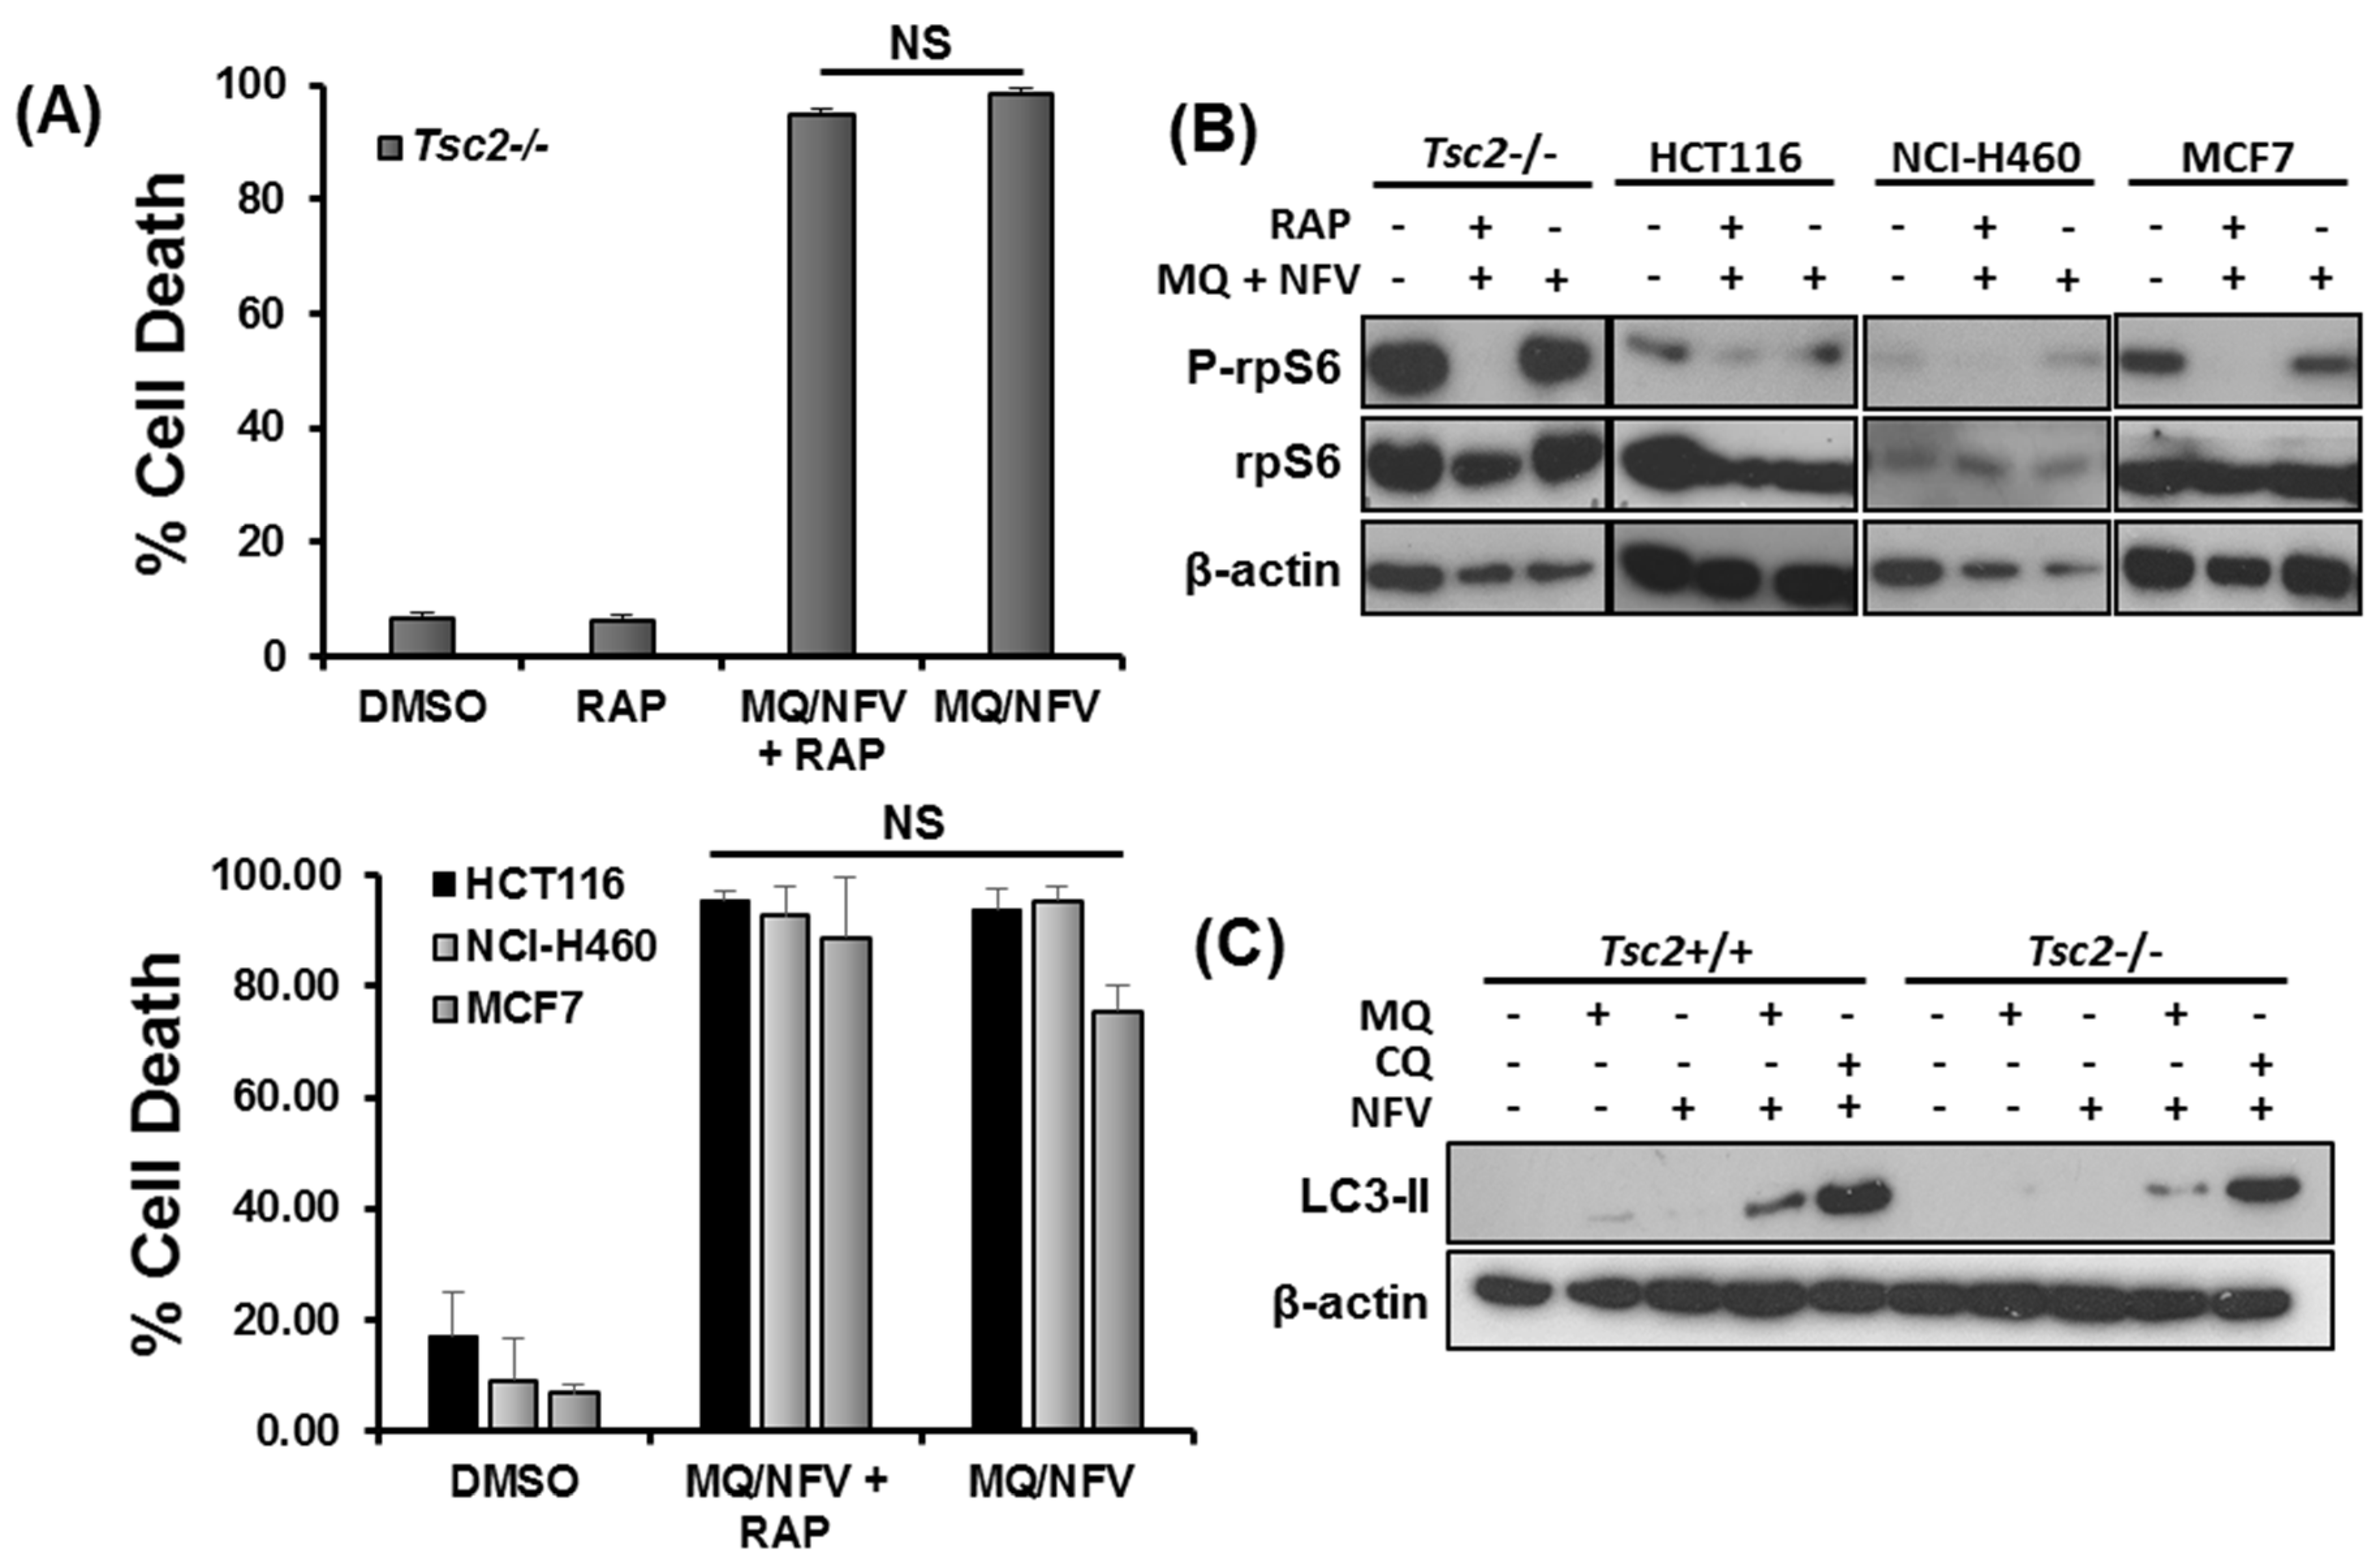
2.4. Cytotoxicity of Tsc2-Deficient Cells with Nelfinavir and Mefloquine is Energy Dependent
3. Discussion
4. Materials and Methods
4.1. Cell Culture and Drug Treatments
4.2. Flow Cytometry
4.3. Western Blotting
4.4. mRNA Extraction and Reverse Transcription
4.5. XBP-1 Splicing
4.6. Tumor Formation Assay
4.7. Tumor Outgrowth Assay
4.8. RNA Sequencing
4.9. Statistical Analysis
5. Conclusions
Supplementary Materials
Author Contributions
Funding
Acknowledgments
Conflicts of Interest
References
- Tee, A.R. The Target of Rapamycin and Mechanisms of Cell Growth. Int. J. Mol. Sci. 2018, 19, E880. [Google Scholar] [CrossRef] [PubMed]
- Rad, E.; Murray, J.T.; Tee, A.R. Oncogenic Signalling through Mechanistic Target of Rapamycin (mTOR): A Driver of Metabolic Transformation and Cancer Progression. Cancers 2018, 10, E5. [Google Scholar] [CrossRef] [PubMed]
- Tee, A.R.; Fingar, D.C.; Manning, B.D.; Kwiatkowski, D.J.; Cantley, L.C.; Blenis, J. Tuberous sclerosis complex-1 and -2 gene products function together to inhibit mammalian target of rapamycin (mTOR)-mediated downstream signaling. Proc. Natl. Acad. Sci. USA 2002, 99, 13571–13576. [Google Scholar] [CrossRef] [PubMed] [Green Version]
- Krymskaya, V.P.; Goncharova, E.A. PI3K/mTORC1 activation in hamartoma syndromes: Therapeutic prospects. Cell Cycle 2009, 8, 403–413. [Google Scholar] [CrossRef] [PubMed] [Green Version]
- Schmid, K.; Bago-Horvath, Z.; Berger, W.; Haitel, A.; Cejka, D.; Werzowa, J.; Filipits, M.; Herberger, B.; Hayden, H.; Sieghart, W. Dual inhibition of EGFR and mTOR pathways in small cell lung cancer. Br. J. Cancer 2010, 103, 622–628. [Google Scholar] [CrossRef] [PubMed] [Green Version]
- Vestergaard, H.H.; Christensen, M.R.; Lassen, U.N. A systematic review of targeted agents for non-small cell lung cancer. Acta Oncol. 2018, 57, 176–186. [Google Scholar] [CrossRef] [PubMed]
- Li, H.; Zeng, J.; Shen, K. PI3K/AKT/mTOR signaling pathway as a therapeutic target for ovarian cancer. Arch. Gynecol. Obstet. 2014, 290, 1067–1078. [Google Scholar] [CrossRef] [PubMed]
- Nabi, S.; Kessler, E.R.; Bernard, B.; Flaig, T.W.; Lam, E.T. Renal cell carcinoma: A review of biology and pathophysiology. F1000Research 2018, 7, 307. [Google Scholar] [CrossRef] [PubMed]
- Wang, Z.; Valera, J.C.; Zhao, X.; Chen, Q.; Silvio Gutkind, J. mTOR co-targeting strategies for head and neck cancer therapy. Cancer Metastasis Rev. 2017, 36, 491–502. [Google Scholar] [CrossRef] [PubMed] [Green Version]
- Sato, Y.; Yoshizato, T.; Shiraishi, Y.; Maekawa, S.; Okuno, Y.; Kamura, T.; Shimamura, T.; Sato-Otsubo, A.; Nagae, G.; Suzuki, H.; et al. Integrated molecular analysis of clear-cell renal cell carcinoma. Nat. Genet. 2013, 45, 860–867. [Google Scholar] [CrossRef] [PubMed]
- Ghosh, A.P.; Marshall, C.B.; Coric, T.; Shim, E.H.; Kirkman, R.; Ballestas, M.E.; Ikura, M.; Bjornsti, M.A.; Sudarshan, S. Point mutations of the mTOR-RHEB pathway in renal cell carcinoma. Oncotarget 2015, 6, 17895–17910. [Google Scholar] [CrossRef] [PubMed]
- Zhang, Y.; Ng, P.K.-S.; Kucherlapati, M.; Chen, F.; Liu, Y.; Tsang, Y.H.; de Velasco, G.; Jeong, K.J.; Akbani, R.; Hadjipanayis, A.; et al. A Pan-Cancer Proteogenomic Atlas of PI3K/AKT/mTOR Pathway Alterations. Cancer Cell 2017, 31, 820–832.e3. [Google Scholar] [CrossRef] [PubMed]
- Lam, H.C.; Nijmeh, J.; Henske, E.P. New developments in the genetics and pathogenesis of tumours in tuberous sclerosis complex. J. Pathol. 2017, 241, 219–225. [Google Scholar] [CrossRef] [PubMed]
- Tee, A.R.; Manning, B.D.; Roux, P.P.; Cantley, L.C.; Blenis, J. Tuberous sclerosis complex gene products, Tuberin and Hamartin, control mTOR signaling by acting as a GTPase-activating protein complex toward Rheb. Curr. Biol. 2003, 13, 1259–1268. [Google Scholar] [CrossRef]
- Dibble, C.C.; Elis, W.; Menon, S.; Qin, W.; Klekota, J.; Asara, J.M.; Finan, P.M.; Kwiatkowski, D.J.; Murphy, L.O.; Manning, B.D. TBC1D7 is a third subunit of the TSC1-TSC2 complex upstream of mTORC1. Mol. Cell 2012, 47, 535–546. [Google Scholar] [CrossRef] [PubMed]
- Peng, Z.F.; Yang, L.; Wang, T.T.; Han, P.; Liu, Z.H.; Wei, Q. Efficacy and safety of sirolimus for renal angiomyolipoma in patients with tuberous sclerosis complex or sporadic lymphangioleiomyomatosis: A systematic review. J. Urol. 2014, 192, 1424–1430. [Google Scholar] [CrossRef] [PubMed]
- Dabora, S.L.; Franz, D.N.; Ashwal, S.; Sagalowsky, A.; DiMario, F.J., Jr.; Miles, D.; Cutler, D.; Krueger, D.; Uppot, R.N.; Rabenou, R.; et al. Multicenter phase 2 trial of sirolimus for tuberous sclerosis: Kidney angiomyolipomas and other tumors regress and VEGF-D levels decrease. PLoS ONE 2011, 6, e23379. [Google Scholar] [CrossRef] [PubMed]
- Appenzeller-Herzog, C.; Hall, M.N. Bidirectional crosstalk between endoplasmic reticulum stress and mTOR signaling. Trends Cell Biol. 2012, 22, 274–282. [Google Scholar] [CrossRef] [PubMed] [Green Version]
- Johnson, C.E.; Hunt, D.K.; Wiltshire, M.; Herbert, T.P.; Sampson, J.R.; Errington, R.J.; Davies, D.M.; Tee, A.R. Endoplasmic reticulum stress and cell death in mTORC1-overactive cells is induced by nelfinavir and enhanced by chloroquine. Mol. Oncol. 2015, 9, 675–688. [Google Scholar] [CrossRef] [PubMed]
- Gills, J.J.; Lopiccolo, J.; Dennis, P.A. Nelfinavir, a new anti-cancer drug with pleiotropic effects and many paths to autophagy. Autophagy 2008, 4, 107–109. [Google Scholar] [CrossRef] [PubMed] [Green Version]
- Golden, E.B.; Cho, H.Y.; Hofman, F.M.; Louie, S.G.; Schönthal, A.H.; Chen, T.C. Quinoline-based antimalarial drugs: A novel class of autophagy inhibitors. Neurosurg. Focus 2015, 38, E12. [Google Scholar] [CrossRef] [PubMed]
- Yan, K.H.; Yao, C.J.; Hsiao, C.H.; Lin, K.H.; Lin, Y.W.; Wen, Y.C.; Liu, C.C.; Yan, M.D.; Chuang, S.E.; Lai, G.M.; et al. Mefloquine exerts anticancer activity in prostate cancer cells via ROS-mediated modulation of Akt, ERK, JNK and AMPK signaling. Oncol. Lett. 2013, 5, 1541–1545. [Google Scholar] [CrossRef] [PubMed] [Green Version]
- Liu, Y.; Chen, S.; Xue, R.; Zhao, J.; Di, M. Mefloquine effectively targets gastric cancer cells through phosphatase-dependent inhibition of PI3K/Akt/mTOR signaling pathway. Biochem. Biophys. Res. Commun. 2016, 470, 350–355. [Google Scholar] [CrossRef] [PubMed]
- Astrinidis, A.; Cash, T.P.; Hunter, D.S.; Walker, C.L.; Chernoff, J.; Henske, E.P. Tuberin, the tuberous sclerosis complex 2 tumor suppressor gene product, regulates Rho activation, cell adhesion and migration. Oncogene 2002, 21, 8470–8476. [Google Scholar] [CrossRef] [PubMed] [Green Version]
- Cantó, C.; Auwerx, J. PGC-1alpha, SIRT1 and AMPK, an energy sensing network that controls energy expenditure. Curr. Opin. Lipidol. 2009, 20, 98–105. [Google Scholar] [CrossRef] [PubMed]
- Monchusi, B.; Ntwasa, M. Methyl pyruvate protects a normal lung fibroblast cell line from irinotecan-induced cell death: Potential use as adjunctive to chemotherapy. PLoS ONE 2017, 12, e0182789. [Google Scholar] [CrossRef] [PubMed]
- Kollaritsch, H.; Karbwang, J.; Wiedermann, G.; Mikolasek, A.; Na-Bangchang, K.; Wernsdorfer, WH. Mefloquine concentration profiles during prophylactic dose regimens. Wien Klin. Wochenschr 2000, 112, 441–447. [Google Scholar] [PubMed]
- Zhang, K.E.; Wu, E.; Patick, A.K.; Kerr, B.; Zorbas, M.; Lankford, A.; Kobayashi, T.; Maeda, Y.; Shetty, B.; Webber, S.; et al. Circulating metabolites of the human immunodeficiency virus protease inhibitor nelfinavir in humans: Structural identification, levels in plasma, and antiviral activities. Antimicrob. Agents Chemother. 2001, 45, 1086–1093. [Google Scholar] [CrossRef] [PubMed]
- Marzolini, C.; Buclin, T.; Decosterd, L.A.; Biollaz, J.; Telenti, A. Nelfinavir plasma levels under twice-daily and three-times-daily regimens: High interpatient and low intrapatient variability. Ther. Drug Monit. 2001, 23, 394–398. [Google Scholar] [CrossRef] [PubMed]
- Blumenthal, G.M.; Gills, J.J.; Ballas, M.S.; Bernstein, W.B.; Komiya, T.; Dechowdhury, R.; Morrow, B.; Root, H.; Chun, G.; Helsabeck, C.; et al. A phase I trial of the HIV protease inhibitor nelfinavir in adults with solid tumors. Oncotarget 2014, 5, 8161–8172. [Google Scholar] [CrossRef] [PubMed] [Green Version]
- Yang, F.; Lingli Yang, L.; Mari Wataya-Kaneda, M.; Yoshimura, T.; Tanemura, A.; Katayama, I. Uncoupling of ER/Mitochondrial Oxidative Stress in mTORC1 Hyperactivation-Associated Skin Hypopigmentation. J. Investig. Dermatol. 2018, 138, 669–678. [Google Scholar] [CrossRef] [PubMed]
- Choo, A.Y.; Kim, S.G.; Vander Heiden, M.G.; Mahoney, S.J.; Vu, H.; Yoon, S.O.; Cantley, L.C.; Blenis, J. Glucose addiction of TSC null cells is caused by failed mTORC1-dependent balancing of metabolic demand with supply. Mol. Cell 2010, 38, 487–499. [Google Scholar] [CrossRef] [PubMed]
- Sharma, N.; Thomas, S.; Golden, E.B.; Hofman, F.M.; Chen, T.C.; Petasis, N.A.; Schönthal, A.H.; Louie, S.G. Inhibition of autophagy and induction of breast cancer cell death by mefloquine, an antimalarial agent. Cancer Lett. 2012, 326, 143–154. [Google Scholar] [CrossRef] [PubMed]
- Dunlop, E.A.; Hunt, D.K.; Acosta-Jaquez, H.A.; Fingar, D.C.; Tee, A.R. ULK1 inhibits mTORC1 signaling, promotes multisite Raptor phosphorylation and hinders substrate binding. Autophagy 2011, 7, 737–747. [Google Scholar] [CrossRef] [PubMed] [Green Version]
- Dunlop, E.A.; Johnson, C.E.; Wiltshire, M.; Errington, R.J.; Tee, A.R. Targeting protein homeostasis with nelfinavir/salinomycin dual therapy effectively induces death of mTORC1 hyperactive cells. Oncotarget 2017, 8, 48711–48724. [Google Scholar] [CrossRef] [PubMed]
- Love, M.I.; Huber, W.; Anders, S. Moderated estimation of fold change and dispersion for RNA-seq data with DESeq2. Genome Biol. 2014, 15. [Google Scholar] [CrossRef] [PubMed]


© 2018 by the authors. Licensee MDPI, Basel, Switzerland. This article is an open access article distributed under the terms and conditions of the Creative Commons Attribution (CC BY) license (http://creativecommons.org/licenses/by/4.0/).
Share and Cite
McCann, H.D.; Johnson, C.E.; Errington, R.J.; Davies, D.M.; Dunlop, E.A.; Tee, A.R. Energy Stress-Mediated Cytotoxicity in Tuberous Sclerosis Complex 2-Deficient Cells with Nelfinavir and Mefloquine Treatment. Cancers 2018, 10, 375. https://doi.org/10.3390/cancers10100375
McCann HD, Johnson CE, Errington RJ, Davies DM, Dunlop EA, Tee AR. Energy Stress-Mediated Cytotoxicity in Tuberous Sclerosis Complex 2-Deficient Cells with Nelfinavir and Mefloquine Treatment. Cancers. 2018; 10(10):375. https://doi.org/10.3390/cancers10100375
Chicago/Turabian StyleMcCann, Henry D., Charlotte E. Johnson, Rachel J. Errington, D. Mark Davies, Elaine A. Dunlop, and Andrew R. Tee. 2018. "Energy Stress-Mediated Cytotoxicity in Tuberous Sclerosis Complex 2-Deficient Cells with Nelfinavir and Mefloquine Treatment" Cancers 10, no. 10: 375. https://doi.org/10.3390/cancers10100375