Article

Impact of Land Use on Frequency of Floods in Yongding River Basin, China

State Key Laboratory of Simulation and Regulation of Water Cycle in River Basin, China Institute of Water Resources and Hydropower Research, Beijing 100038, China
*
Author to whom correspondence should be addressed.
Water 2016, 8(9), 401; https://doi.org/10.3390/w8090401
Submission received: 10 May 2016 / Revised: 27 August 2016 / Accepted: 31 August 2016 / Published: 14 September 2016
(This article belongs to the Special Issue Tackling Complex Water Problems in China under Changing Environment)

Abstract

:
As the debates surrounding the negative influences of flood control using dams or reservoirs on the eco-environment become fierce, non-structural flood control measures like land use change gain more attention. This study researched the effect of integrated and single land use changes on three floods at small, medium and large scales, respectively, in Yongding River basin. A SWAT (Soil and Water Assessment Tool) model was used to simulate the effect of integrated and single land use changes on floods of different scales. The single land uses were set as S1, S2, S3 to represent the agricultural, grass and construction land changes. The results showed that: (1) the integrated land use changes reduced the small flood, the medium flood and the large flood by 14%, 13% and 5%; (2) the land use management functioned most effectively on medium-scale floods and least effectively on large-scale floods; (3) S1 decreased the medium floods optimally by 24% with a 7-day maximum runoff volume as the indicator and by 29% with a 1-day maximum flood discharge; (4) S2 reduced the medium floods optimally by 21% with runoff depth volume as the indicator; (5) S3 increased the medium floods optimally by 15% with a 1-day maximum flood discharge as the indicator.

1. Introduction

Historically, the preferred flood management options are engineered structural solutions, such as dams and embankments. Critics of these traditional approaches argued that although they might meet short-term goals, in the long term they had failed to reduce the economic losses from flooding and when flooding increases it is impractical, expensive and unsustainable to continually heighten floodwalls and strengthen structural defenses [1]. Also, super abundant hydraulic engineering projects could do more harm for the ecological environment and the local climate [2]. Some researchers have proposed the concept of sustainable flood management (SFM) which emphasizes a natural and sustainable response to flood risk with the need to link flood risk management, agriculture and land use management [3]. Other scholars proposed the resilience concept of flood risk management and considered resilience as a promising instrument for preventing and mitigating the impacts of hazards [4,5]. Resilience is the ability of a system to return to its equilibrium after a reaction to a disturbance [6]. Flood risk management implies two types of measures distinguished by their aims: structural and non-structural measures. The aim of structural measures is to modify the flood pattern, while non-structural measures focus on reducing flood impacts [7]. Even though dams have a big advantage in flood control and play an irreplaceable role in safeguarding cities, they are not ideal for medium or small flood control due to management costs and the waste of water resources.
Non-point flood alleviation of land use management fits this new trend. The concept of non-point flood alleviation is centered on using surface measures to assist point measures (dams and embankments). By changing the land use, flood protection of the basin can be more effective while the focus of non-point flood alleviation is to retain rainfall on the surface and in soil pores.
Land use plays a very important role in the hydrological processes of a certain basin [8]. Plenty of researches and experiments have proved that different land uses can lead to changes in the runoff process. Beven et al. [9] compared the land use and the floods happening in the same period with the land use changed in the past to find the historical connection. Woldeamlak [10] analyzed the pattern of the runoff in northwestern highland Ethiopia with the dynamics method and confirmed that the decrease of forest, the increase of the agriculture land, the grassland degradation and artificial afforestation would all be crucial factors having an influence on the runoff process. McIntyre [11] testified the connection between floods and land use at the regional scale. Li et al. [12] quantified the effects of land use change on flood peaks and volumes in Daqinghe River basin with a multiple-linear regression analysis method. Now it has been established that the variable of land use can change the flood pattern, whether it can achieve the aim of flood control by increasing some sort of land use which benefits rainfall retention still remains to be explored. This flood control measure is different from the punctate measure of dams which is called non-point flood alleviation.
The main effect of the land use on runoff/flood is to reduce the rainfall energy by interception, sink filling, transpiration, evapotranspiration and infiltration [13]. Nie et al. [14] demonstrated in the upper San Pedro watershed that construction land and the decrease of forests would cause surface runoff to increase. A similar conclusion was made by Lin [15] in Willow Basin, Canada. The negative changes aforementioned could lead to the degradation of the soil which can lower the infiltration, causing poorer connectivity and impairing the water-holding capacity, thus increasing the flood risk [16]. According to Feng [17], grassland can delay the runoff three-fold compared to bare land. The average speed of the runoff on grassland is only 40% of that on bare land. The root system of the grass increases in surface soil voids. The grass covering the surface can also ease the impact of rain drops hitting on soil and compromise the integrity of the soil surface, while also increasing the roughness of the surface soil, so the runoff coefficient becomes significantly smaller [18]. Fan et al. [19] compared bare land, grassland and woodland runoff over years with a monthly distribution. Runoff of bare land, grassland and woodland accounted for rainfall over the same period of 18.6%, 5.1%, 3.7%, respectively; and the uniformity coefficients of the bare land, grassland and woodland for the distribution of monthly runoff were 0.99, 0.74, and 0.69 [19]. Therefore, planting trees and grass reduces runoff and improves the uniformity of the distribution of runoff. As for agricultural land, there has been plenty of studies proving its benefit in preventing floods. Sujono [20] showed through experiments that some measures of agricultural planting can reduce surface runoff. Evans et al. [21] showed that certain measures at autumn sowing can lower the frequency of muddy floods. The phenomena can be explained by the fact that with the measures carried out, the soil structure is changed and the land surface is uneven, so the rain either goes to the deep soil layers through the gaps or fills in the depressions [22]. In addition, the residue covering can protect the land surface from being hit by the rain drops, and slows down the speed of infiltration [23].
Despite the researches aforementioned, the effects of the land use change on the runoff/flood still remain unclear, especially at basin scale [24]. For some basins, the flood process is influenced by several factors, such as rainfall, elevation, soil depth, and water steepness [25], and land use change depends on the former type, the change type, the location, the change time and the like [26]. Table 1 lists some researches trying to distinguish the effects with various methods.
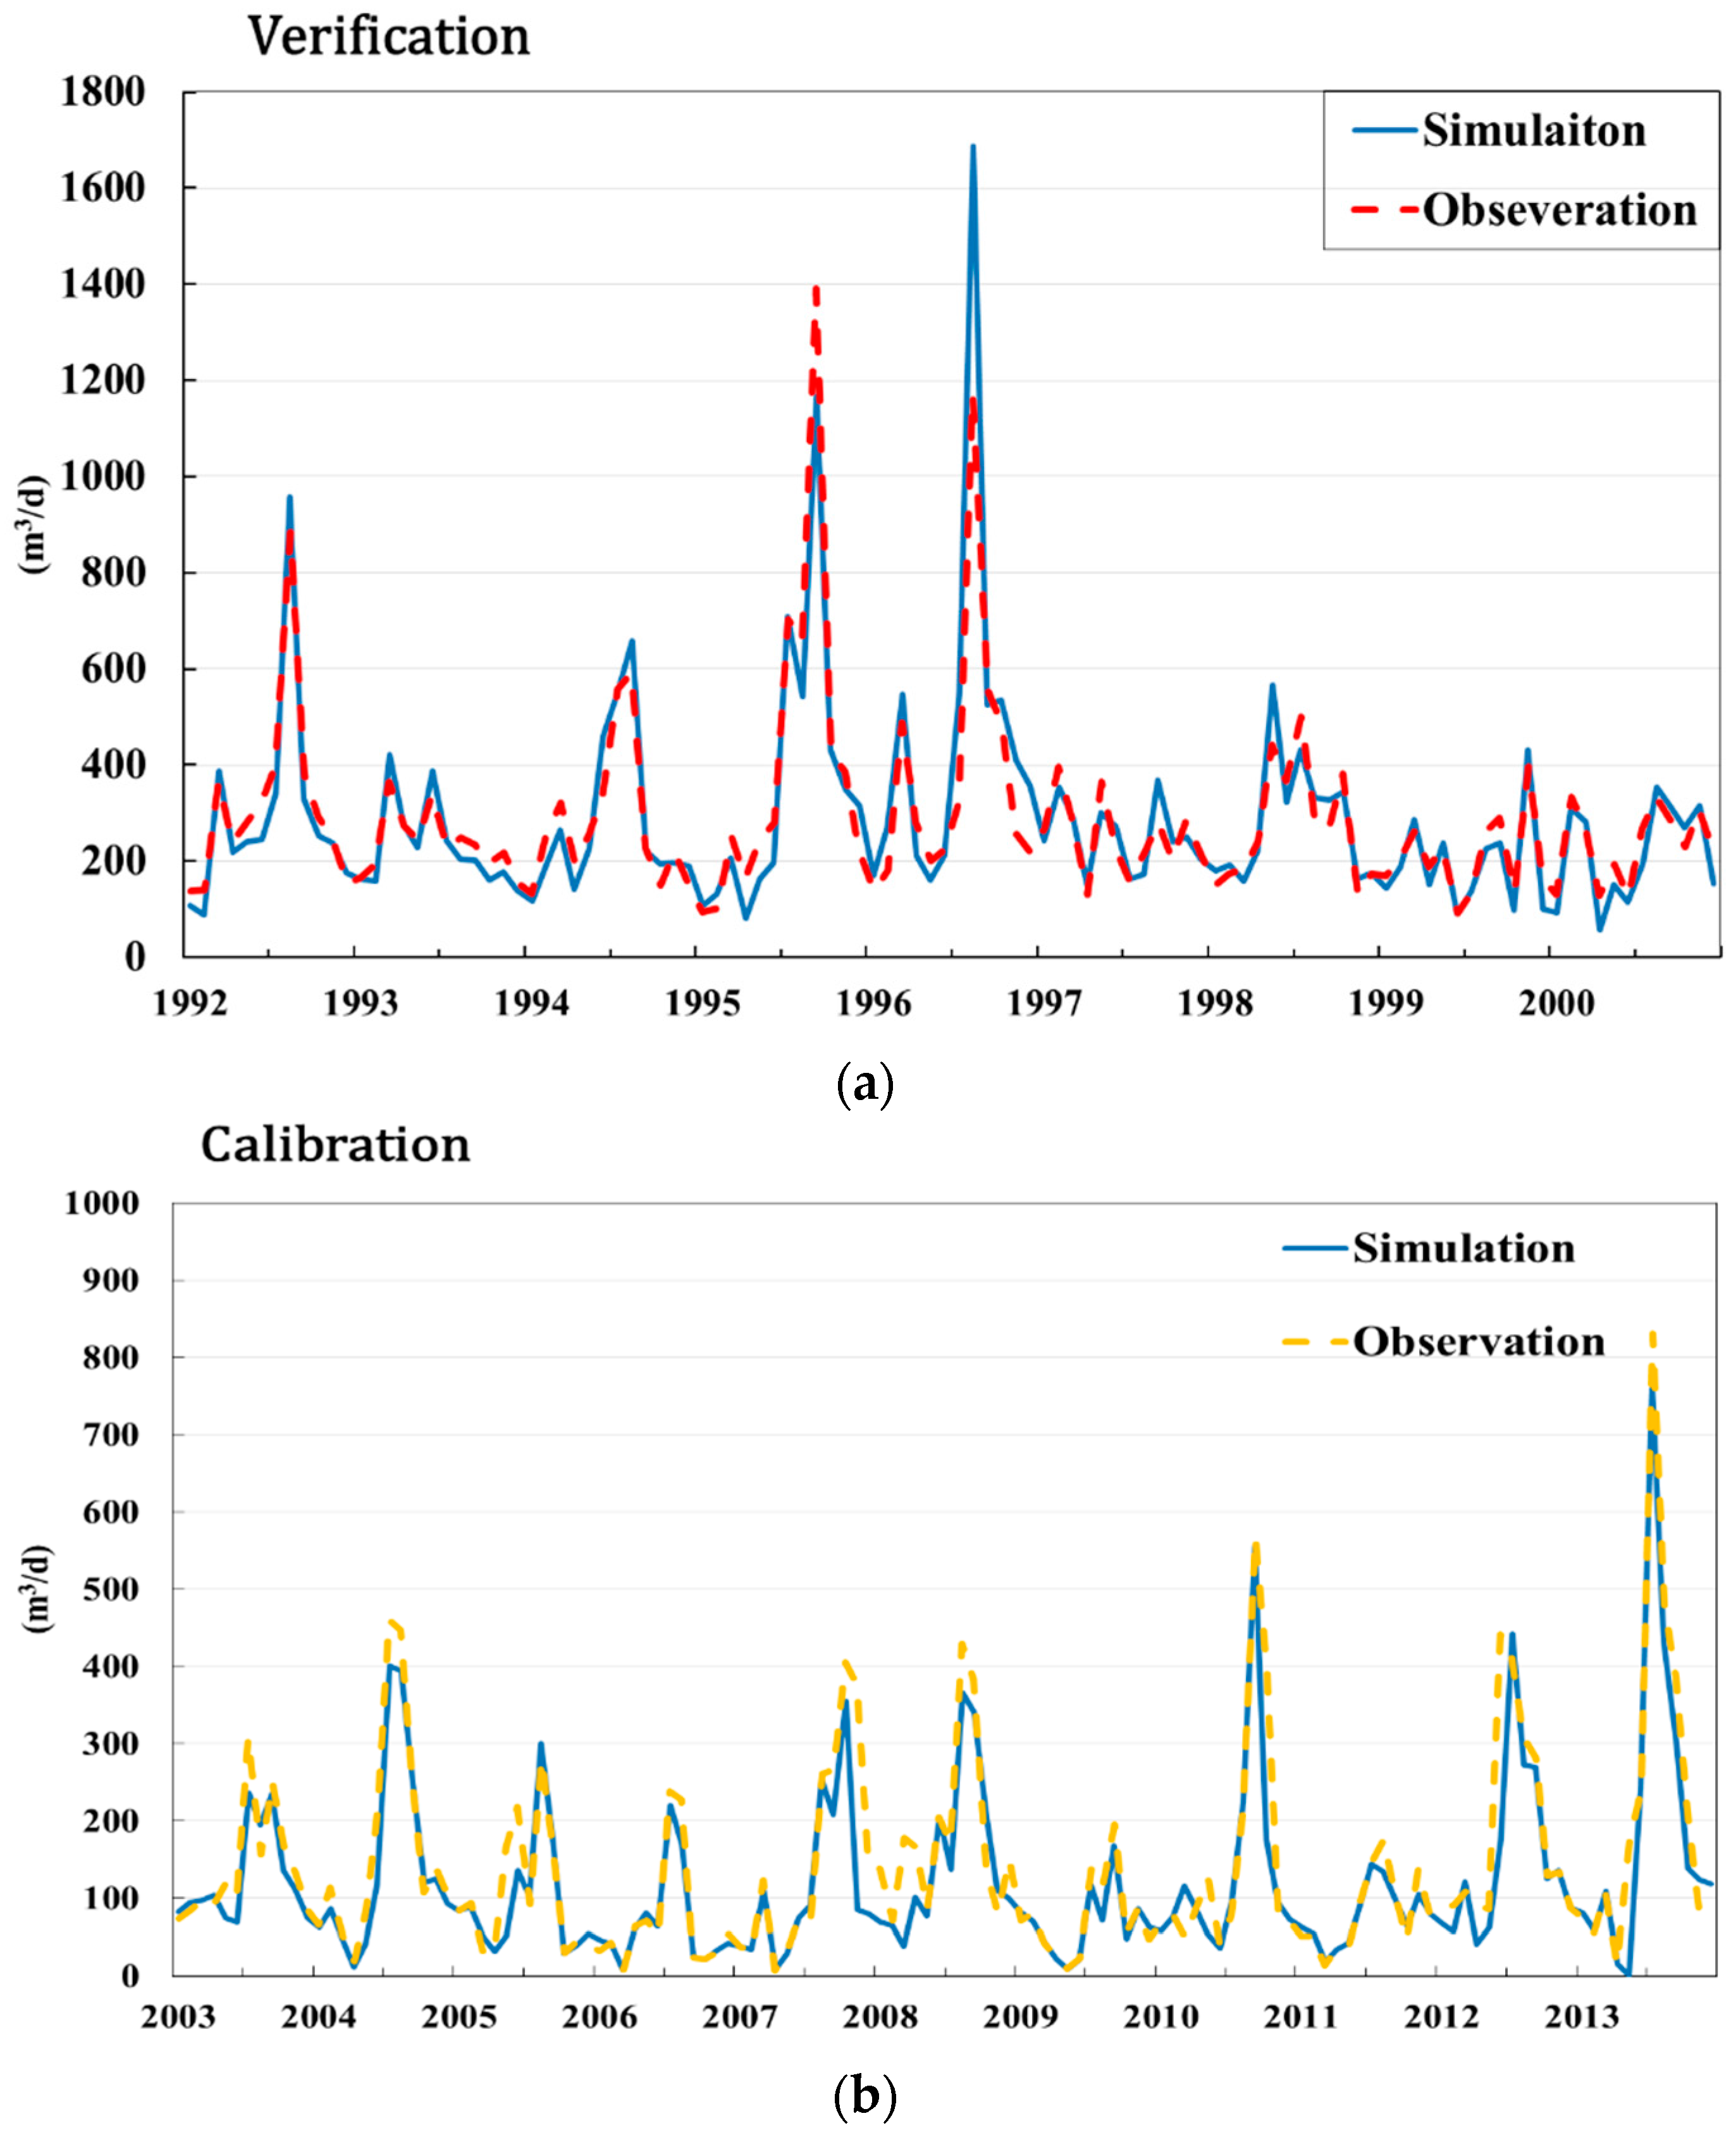
This paper used the SWAT model to simulate flood processes with different frequency under different land use scenarios in Yongding River Basin, and analyzed the quantitative effect of non-point flood alleviation of each land use scenario. Yongding River basin locates in the upstream region of Beijing, which is an important geographical location with high demand for flood control and is one of China’s four major river flood control areas [35]. In history, flood was the major disaster in this region. From 1949 to 2001, flood disasters occurred 22 times, once in every 2.4 years [36]. However, extreme floods rarely occurred as precipitation drastically decreased in recent years while medium and small floods became the main problem. It is reasonable to consider land use management to practice non-point flood alleviation in the Yongding River Basin. The upper reaches of the Yongding River Basin are the Loess Plateau, where soil has a point edge contact support structure, high water permeability and small water storage capacity. Non-point flood alleviation in the Yongding River Basin has the potential to play an important role in flood control.
The objects of this paper are: (1) simulating different floods with different frequencies under the chosen land use scenarios; (2) analyzing the characteristics of flood processes under integrated and single land use changes; (3) determining the effects of non-point flood alleviation and its main influencing factors.

2. Study Area and Datasets

2.1. Study Area

Yongding River Basin is located south west of Beijing. It is the biggest river basin of the north part of the Haihe water system. The catchment has an area of 43,727 km2 and lies 38°27′–41°20′ N and 111°40′–117°45′ E (shown in Figure 1). The whole basin crosses five provinces including Shanxi, Inner Mongolia, Hebei, Beijing, and Tianjin, and is located in a semi-humid and semi-arid region, and belongs to a continental climate zone. The annual mean temperature is 9.6 °C, and annual precipitation is about 530 mm (1951–2007). Precipitation in flood season (from June to September) generally accounts for 70%–85% of the annual precipitation and rainfall is concentrated in July and August [37].

2.2. Datasets

The hydro-meteorological data for the SWAT model including the precipitation, temperature, wind speed and humidity is collected from 13 weather stations according to the standard methodology of the China Meteorological Administration, which applies data quality control before releasing data. The observed basin-outlet runoff data was obtained from Guanting hydrologic station with the time span of 1990–2013.
DEM (Digital Elevation Model) was obtained from the Shuttle Radar Topography Mission (SRTM) with a spatial resolution of 3 arc-seconds (approximately 90 m). Land use data for 1995 and 2005 was obtained from the Environmental and Ecological Science Data Center. The dataset, with a spatial resolution of 1 km, was created by Chinese Academy of Sciences (CAS) in accordance with the land-use maps in the same period on a scale of 1:100,000. The soil data was downloaded from HWSD (Harmonized World Soil Database). The database is set by FAO and IIASA. The current version was released in 2009. The resolution is 1 km. In this study, the original soil map of the area contains over 100 kinds of soil types. To simplify the simulation process, the soil type was classified into 19 kinds, according to their own properties. There are total 16 soil groupings in this area. Groups with a proportion of area less than 6% was replaced by the most-counted group. The soil groups were reduced to 13 kinds. A soil unit in one group with a proportion of the whole area more than 5% was the major soil unit remaining, and the rest were replaced by the major unit. Some groups have two major units and the rest were divided according to the ratio of the two major units and were replaced separately. Finally, 19 soil units were selected as the soil layer types in the study area.

3. Methods and Scenarios

3.1. SWAT Model and SWAT CUP

The SWAT (Soil and Water Assessment Tool) Model is a process-based distributed parameter model applied to simulate long-term hydrological process in different scale basins [38,39,40]. In the SWAT model, a watershed is divided into sub-basins and further into a series of uniform hydrological response units (HRUs) as the combination of single land use, soil and the management. SWAT allows a number of different physical processes to be simulated in a basin such as evaporation, infiltration, plant uptake, lateral flows, percolation, etc. In the SWAT model, the thresholds should be set when defining HRUs to simplify the computation and enhance the operability of the simulation. The values of land use, soil and slop under the thresholds would be erased and the area would be classified as other types in sub-basins [41]. The existing HRU partition method of the SWAT model has no spatial localization, and the interaction effects of sub-basins are not considered [42]. The lack of definition of spatial location limits the HRUs’ function for hydrological cycle simulation [43]. The smallest scale of spatial analysis is generally confined to the sub-basin scale [44]. In this study, the analysis is in basin scale, and the threshold value of slope level is 10%, while the threshold value of soil type area is set to 10%. Also, because the study focused on land use changes, the threshold of land use is set as 0%, which means no land use type was erased in the model. According to the study by Her [45], the thresholds of HRUs can significantly influence the loss of information on the land use map, and loss of information is inevitable whenever a non-zero HRU threshold is applied, since minor watershed landscape features are ignored in SWAT modeling. So, the 0 threshold of land use only has limited effect to prevent small land use categories being eliminated.
In SWAT model, there are numerous parameters to be calibrated to match the simulated and observed flow, and it will be a heavy workload to adjust parameters manually. SWAT-CUP is a public domain program which links SUFI2, PSO, GLUE, ParaSol, and MCMC procedures to SWAT. SWAT Calibration Uncertainty Procedures (SWAT-CUP) is a public program for parameter calibration of SWAT model. It contains SUFI2, PSO, GLUE, ParaSol, and MCMC algorithms to process calibration and uncertainty analysis [46].
We chose SUFI2 as the optimization algorithm for the study. The parameter sets sampled in the calibration processes are listed in Table 2.

3.2. Land Use Scenarios

The core of the non-point flood alleviation is to distinguish the influence of the land uses on flood process and decide the suitable transition to achieve effective flood alleviation. For that purpose, we not only considered the real effects of the historical conditions, and a single type of land use transition was also taken into account. The scenarios were set as practical ones and designed ones.
The change of land uses between 1995 and 2005 involved 5 out of 6 types of the land uses (shown in Table 2), with the expansion of agricultural land, grass land and construction land and the diminution of forest and unused land. In the model, the land uses of 1995 and 2005 were set as control groups to uncover the integrated effect of land use change, and the single land use changes were the control group to uncover the effect of each land use change on flood processes.
Agricultural land, forest land, grass land, water area, urban land and unused land were the main land-use types, and their changes between 1995 and 2005 are listed in Table 3.
The land use of 1995 was set as the baseline scenario and the land use of 2005 was set as the compared scenario. Each type of land use was regarded as transformed from other types and the transfer matrix can be seen in Table 3. S1, S2, S3 are the created scenarios in which the land use change only happens on one type and the transformation from other types to a single type. The scenarios came from the historical data. All the change values of land use scenarios were extracted from the real change in the situations from 1995 to 2005. The values in Table 4 mean the area of the land use changed from the type indicated in a row into that in a column.
  • S1: Other types of land uses transformed to agricultural land.
  • S2: Other types of land uses transformed to grass lands.
  • S3: Other types of land uses transformed to urban lands.

3.3. Flood Scenarios

To assess the effect of the non-point flood alleviation, the ideal approach is to analyze the change of types of flood processes under different land use scenarios. The reoccurrence period of floods can reveal their frequency, as well as the safety level of the protected object and the degree of severity of the hazard [47,48].
According to the data published by the Hydrological Experiment Station of Guanting Reservoir Management Office, the frequency of precipitation responding to long-sequence flood events was calculated using Pearson-III type curve. According to Zhao [49], the flood events occurring in Yongding River basin are mostly of 5%–20% possibility. So, we identified the rainfall events with 5% occurrence possibility, and 10% and 20% in the Pearson-III type curve. We identified flood events [50] with similar rainfall volume at a certain possibility in the Pearson-III type curve. Based on the hydrological handbook [51], representative floods should have large peak flow, high flood volume concentration during the major flood peak and disadvantage of flood protection. We chose peak flow, 1-day maxim discharge, and 7-day maxim discharge as indexes to decide representative floods [52]. Also, the flood patterns in Yongding River Basin are significant with few variations [53]: floods are mostly caused by consecutive heavy rain. With all variables considered, we decided that floods in 1996, 1995 and 2000 represented a 20%-probability flood, a 10%-probability flood and a 5%-probability flood, respectively. The amount of precipitation of three floods were displayed in Figure 2.
The design is to simulate these three flood under a 1995 scenario and a 2005 scenario, S1, S2, and S3. Through a comparison and analysis, a better understanding of how the flood responds to the single/combined land uses can be expected.
When a flood occurs, it is accompanied by heavy rainfall events, lasting for months, which could cause more than one flood peak in succession. So, it would be difficult to accurately determine the beginning and end of a specific flood. Instead of the exact flood process, we aimed at identifying the rainfall processes responsible for the chosen floods. We set the period of simulation time from 1 June to 30 September for each year with the chosen flood. The rainfall process is seen as longer than the whole flood process in order to get a better indication of how the flood responds to the single/combined land uses.

4. Results

4.1. Model Calibration and Verification

The model was calibrated and validated using the land use map of year 1995 by comparing the calculated outflow with the observed outflow at the outlet of the Yongding River Basin in SWAT-CUP.
In order to analyze the impacts of the land use changes, the calibrated model was input into land use maps of other scenarios by redefining HRUs while keeping the DEM and soil maps constant. To make sure that land use is the only changing factor in the model, the parameters identified during the calibration were kept the same except CN when the model was loaded with other land uses.
The years 1990–1992 were set as a warm-up period. Because the observation data from 2001 to 2002 is not available, the calibration and validation periods were set respectively as 1992–2000 and 2003–2013. The model was calibrated and validated by SWAT-CUP. The selected parameters are presented in Table 2. The fitting results (shown in Figure 3) prove that the model is reasonable.
The Nash–Sutcliffe efficiency (NSE) coefficient, the correlation coefficient (r2) and RE (relative error) were used to assess the model precision. The model has higher precision when NSE and r2 were close to 1. NSE and r2 are defined as:
NSE = 1 i = 1 n ( Q obs ,   i Q sim ,   i ) 2 i = 1 n ( Q obs ,   i Q obs ) 2
r 2 = [ i = 1 n ( Q obs ,   i Q obs ) ( Q sim ,   i Q sim ) ] 2 i = 1 n ( Q obs ,   i Q obs ) 2 i = 1 n ( Q sim ,   i Q sim ) 2
RE = Q sim Q obs Q obs × 100 %
where Qobs,i and Qsim,i are the observed and simulated runoff, respectively; Qobs and Qsim represent the mean values of the observed and simulated runoff, respectively; and n is the length of time series. The values of NSE, r2 and RE are displayed in Table 5.

4.2. Source of Error

There are sources of error which should be acknowledged during the study. First, the uncertainty of the parameters in the SWAT model was not fully examined and qualified. SWAT-CUP has two indicators for the uncertainty analysis: P-factor and R-factor. P-factor is 95% prediction uncertainty (95PPU), and R-factor is the thickness of the 95PPU envelop. In theory, P-factor ranges from 0 to 1, and R-factor ranges from 0 to ∞. When P-factor is 1 and R-factor is 0, the simulation is the exact match for the observation [46]. The values of the both indicators are displayed in Table 6.
The validation has both low P-factor and low R-factor, though its NSE and r2 are high, which means the uncertainty exists in the result of the validation and the outcomes of the uncertainty and the accuracy are not consistent. The longer the period is, the more the inconsistency of the hydrological process increases, which makes calibration and validation more difficult [54].
Second, the remote sensing data with misclassification increased uncertainty of the model [55]. The error varies with the scale [56]. The study was only designed at regional scale. However, there is no systematical method to qualify the effect of the land use classification error [57]. Future work will consider applying methods mentioned in current researches to the land use in order to test the classification accuracy and balance out the misclassification.
Furthermore, floods are accidental events. Therefore, in the study, not conducting an analysis of the representativeness of the flood process may make it difficult to determine the actual flood control effect of land use change. However, the chosen floods which were well discussed in Fang’ research [50] are assumed to be fairly representative of floods occurring in the area. The soil moisture content is an important prerequisite of the flood hydrograph. In the simulation, the soil moisture content was not discussed. Though the interference cannot be eliminated, the simulation was set longer than the runoff process in order to reduce the uncertainty to some extent. The spatial distribution of different land using types in the basin also has an important influence on non-point flood alleviation, and analysis of the change of geographical location of the land use will be further studied.

4.3. Comparison of Flood Processes under 1995 and 2005 Land Use Scenarios

The results (Table 7) show that the land use of year 2005 is more beneficial to flood alleviation than that of year 1995, especially for 10%-probability flood (moderate level flood), which indicates the function of land use change for flood alleviation is limited. For a 20%-probability flood (small level flood), both land uses of the years 1995 and 2005 have a strong ability of retain water, and the land use of year 2005 cannot take advantage of its maximum ability. However, for a 5%-probability flood (high level flood), it exceeds the ability of flood alleviation of the year 2005 land use, so the effectiveness of the 2005 land use decreased for high level floods compared with moderate level floods. The land use change altered the allocation proportion of the precipitation between soil water and runoff water, which is the key of the non-point flood alleviation.
The change rates were calculated by the equation below
R = Q Q 1995 Q 1995
where R means the change rate, Q1995 means the runoff in the land use map of the year 1995, Q’ means the runoff in the other land use map of the remaining scenarios.
Figure 4 gives a general view of the effects of the integrated land uses change on the flood process. Compared with the land use of 1995, the changes happening in 2005 were more favorable for flood protection. The data shows that the land use of 2005 has better results for three indicators, which is a positive indication for flood control.

4.4. Transformation from Other Types of Land Uses to Agricultural Land

In order to uncover the effect of increased agricultural land on the flood process, Scenario S1 (shown in Table 8) was set as other types of land uses being transformed to agricultural land according to the land uses transfer matrix in Table 3. The model outcomes are shown in Figure 5. Under S1, when a 20%-probability flood happens, the 1-day maximum discharge, the 7-day maximum runoff volume and the runoff depth will decrease by 19%, 21%, and 16%, respectively; when a 10%-probability flood happens, the 1-day maximum discharge, the 7-day maximum runoff volume and the runoff depth is decreased by 29%, 24% and 17%, respectively; when a 5%-probability flood happens, the 1-day maximum discharge, the 7-day maximum runoff volume and the runoff depth will decrease by 18%, 16% and 10%, respectively.

4.5. Transformation from Other Types of Land Uses to Grass Land

Scenario S2 (shown in Table 9) was set as other types of land uses being transformed into grass land. The model outcomes are shown in Figure 6. Under S2, when a 20%-probability flood happens, the 1-day maximum discharge, the 7-day maximum runoff volume and the runoff depth will decrease by 4%, 10% and 19%, respectively; when a 10%-probability flood happens, the 1-day maximum discharge, the 7-day maximum runoff volume and the runoff depth is decreased by 6%, 14% and 21%, respectively; when a 5%-probability flood happens, the 1-day maximum discharge, the 7-day maximum runoff volume and the runoff depth will decrease by 1%, 8% and 20%, respectively.
S2 has the best result in reducing the 10%-probability flood, as well as reducing the 20%-probability flood. It has the smallest effect on the 5%-probability flood. Also, S2 functions more significantly in long-term indicators than that in the short-term.

4.6. Transformation from Other Land Uses to Urban/Construction Lands

Scenario S3 (shown in Table 10) was set as other types of land uses being transformed into urban land. The model outcomes are shown in Figure 7. Under S3, when a 20%-probability flood happens, the 1-day maximum discharge, the 7-day maximum runoff volume and the runoff depth increase by 29%, 15% and 5%, respectively; when a 10%-probability flood happens, the 1-day maximum discharge increases by 15%, the 7-day maximum runoff volume increases by 4%, and the runoff depth stays the same; when a 5%-probability flood happens, the 1-day maximum discharge, the 7-day maximum runoff volume and the runoff depth increase by 13%, 9% and 2%, respectively.

5. Discussion

5.1. The Effect of Different Types of Land Uses on Flood Alleviation

By simulating results from flood processes for different land uses in 1995 and 2005, the agricultural land and the grassland were found to have the biggest influence on the 10%-probability flood, the smallest on the 5%-probability flood, and a moderate influence on the 20%-probability flood. When a small flood occurs, agricultural land and grassland do not work at full capacity; when a large flood occurs, their full capacity will not be enough to hold the rainfall. Generally, agricultural land and grassland play a positive role in flood protection, and have the potential for scattered flood alleviation. The agricultural land has better results than grassland. Most agricultural land of Yongding River Basin is dry land. The cropping structure is wheat and corn. The basic reason for agriculture land’s flood alleviation functions is the soil of the agriculture land in Yongding River Basin. The soil here has a loose, spongy structure with a large number of internal spaces [58]. Soil parent material includes fluvial deposits, sediment, and loess-like sediment. Soil type is meadow soil and cinnamon soil [59]. These types of soil have large specific surface areas of soil clay, dense arrangements, many capillary pores and few non-capillary pores [60]. Organic matter decomposition occurs slowly and humus accumulates in the soil [61]. All properties indicate large water holding capacity, which explains the reduced runoff in agriculture land in Yongding River Basin. Beyond that, the absorptive capacity of the root system of crops is greater than that of grassland, and the high crop planting density with multiple farming outputs compared with the sparse grasslands leads to higher infiltration rates and higher rainfall retention. The outcomes of S3 showed that the urban/construction land’s role is too weak in terms of flood alleviation ability in the basin. The results revealed that the small-scale flood is more easily affected by increased urban land. When a large-scale flood occurs, the rainfall intensity is greater than the infiltration rate, which causes more surface runoff. Whereas when a small-scale flood occurs, the precipitation process is more moderate, the subsurface flow is the main part of the whole runoff. Urban/construction land is usually impermeable. Thus, when the transformation happens, with the permeable surfaces converted to impermeable surfaces, the rainfall that would originally produce the subsurface flow could directly produce surface flows. With urban land use increasing, the 1-day maximum flood discharge changed most strikingly, which means urban/construction land can lead to higher flood peaks and the process becomes more acute. However, because the proportion of urban/construction land is small, the effects are limited.

5.2. The Combination of Point and Non-Point Flood Alleviation

As Yongding River basin is one of the four main flood-controlled rivers, a large number of hydraulic engineering projects have been built to prevent floods. For a long period of time, these projects functioned effectively as the key instrument for flood control in the basin. However, with changes in the climate leading to a decrease in annual rainfall which fell from 409 mm to 385 mm, the frequency of the large scale floods reduced, and small and medium floods increased. The changing circumstances place an increasing burden on the local reservoir operations and lead to a waste of water resources during the flood season. This paper gave evidence to support that the changes that happened in the basin are good for flood protection on the small/medium scale ones. But it should be noted that the paper neglected the role of the reservoir operation. For Yongding River basin, the combination of point and non-point flood alleviation can have more advantages than only implementing a single measure against flood protection. The expanse of agricultural land and grass land can improve the regional water conservation capacity, as well as mitigate the harm of floods. In future, increasing the proportion of arable land and grassland in important flood control areas should be considered in flood control planning, which can relieve the pressure on reservoir operations without undermining the effectiveness of current flood control measures.

6. Conclusions

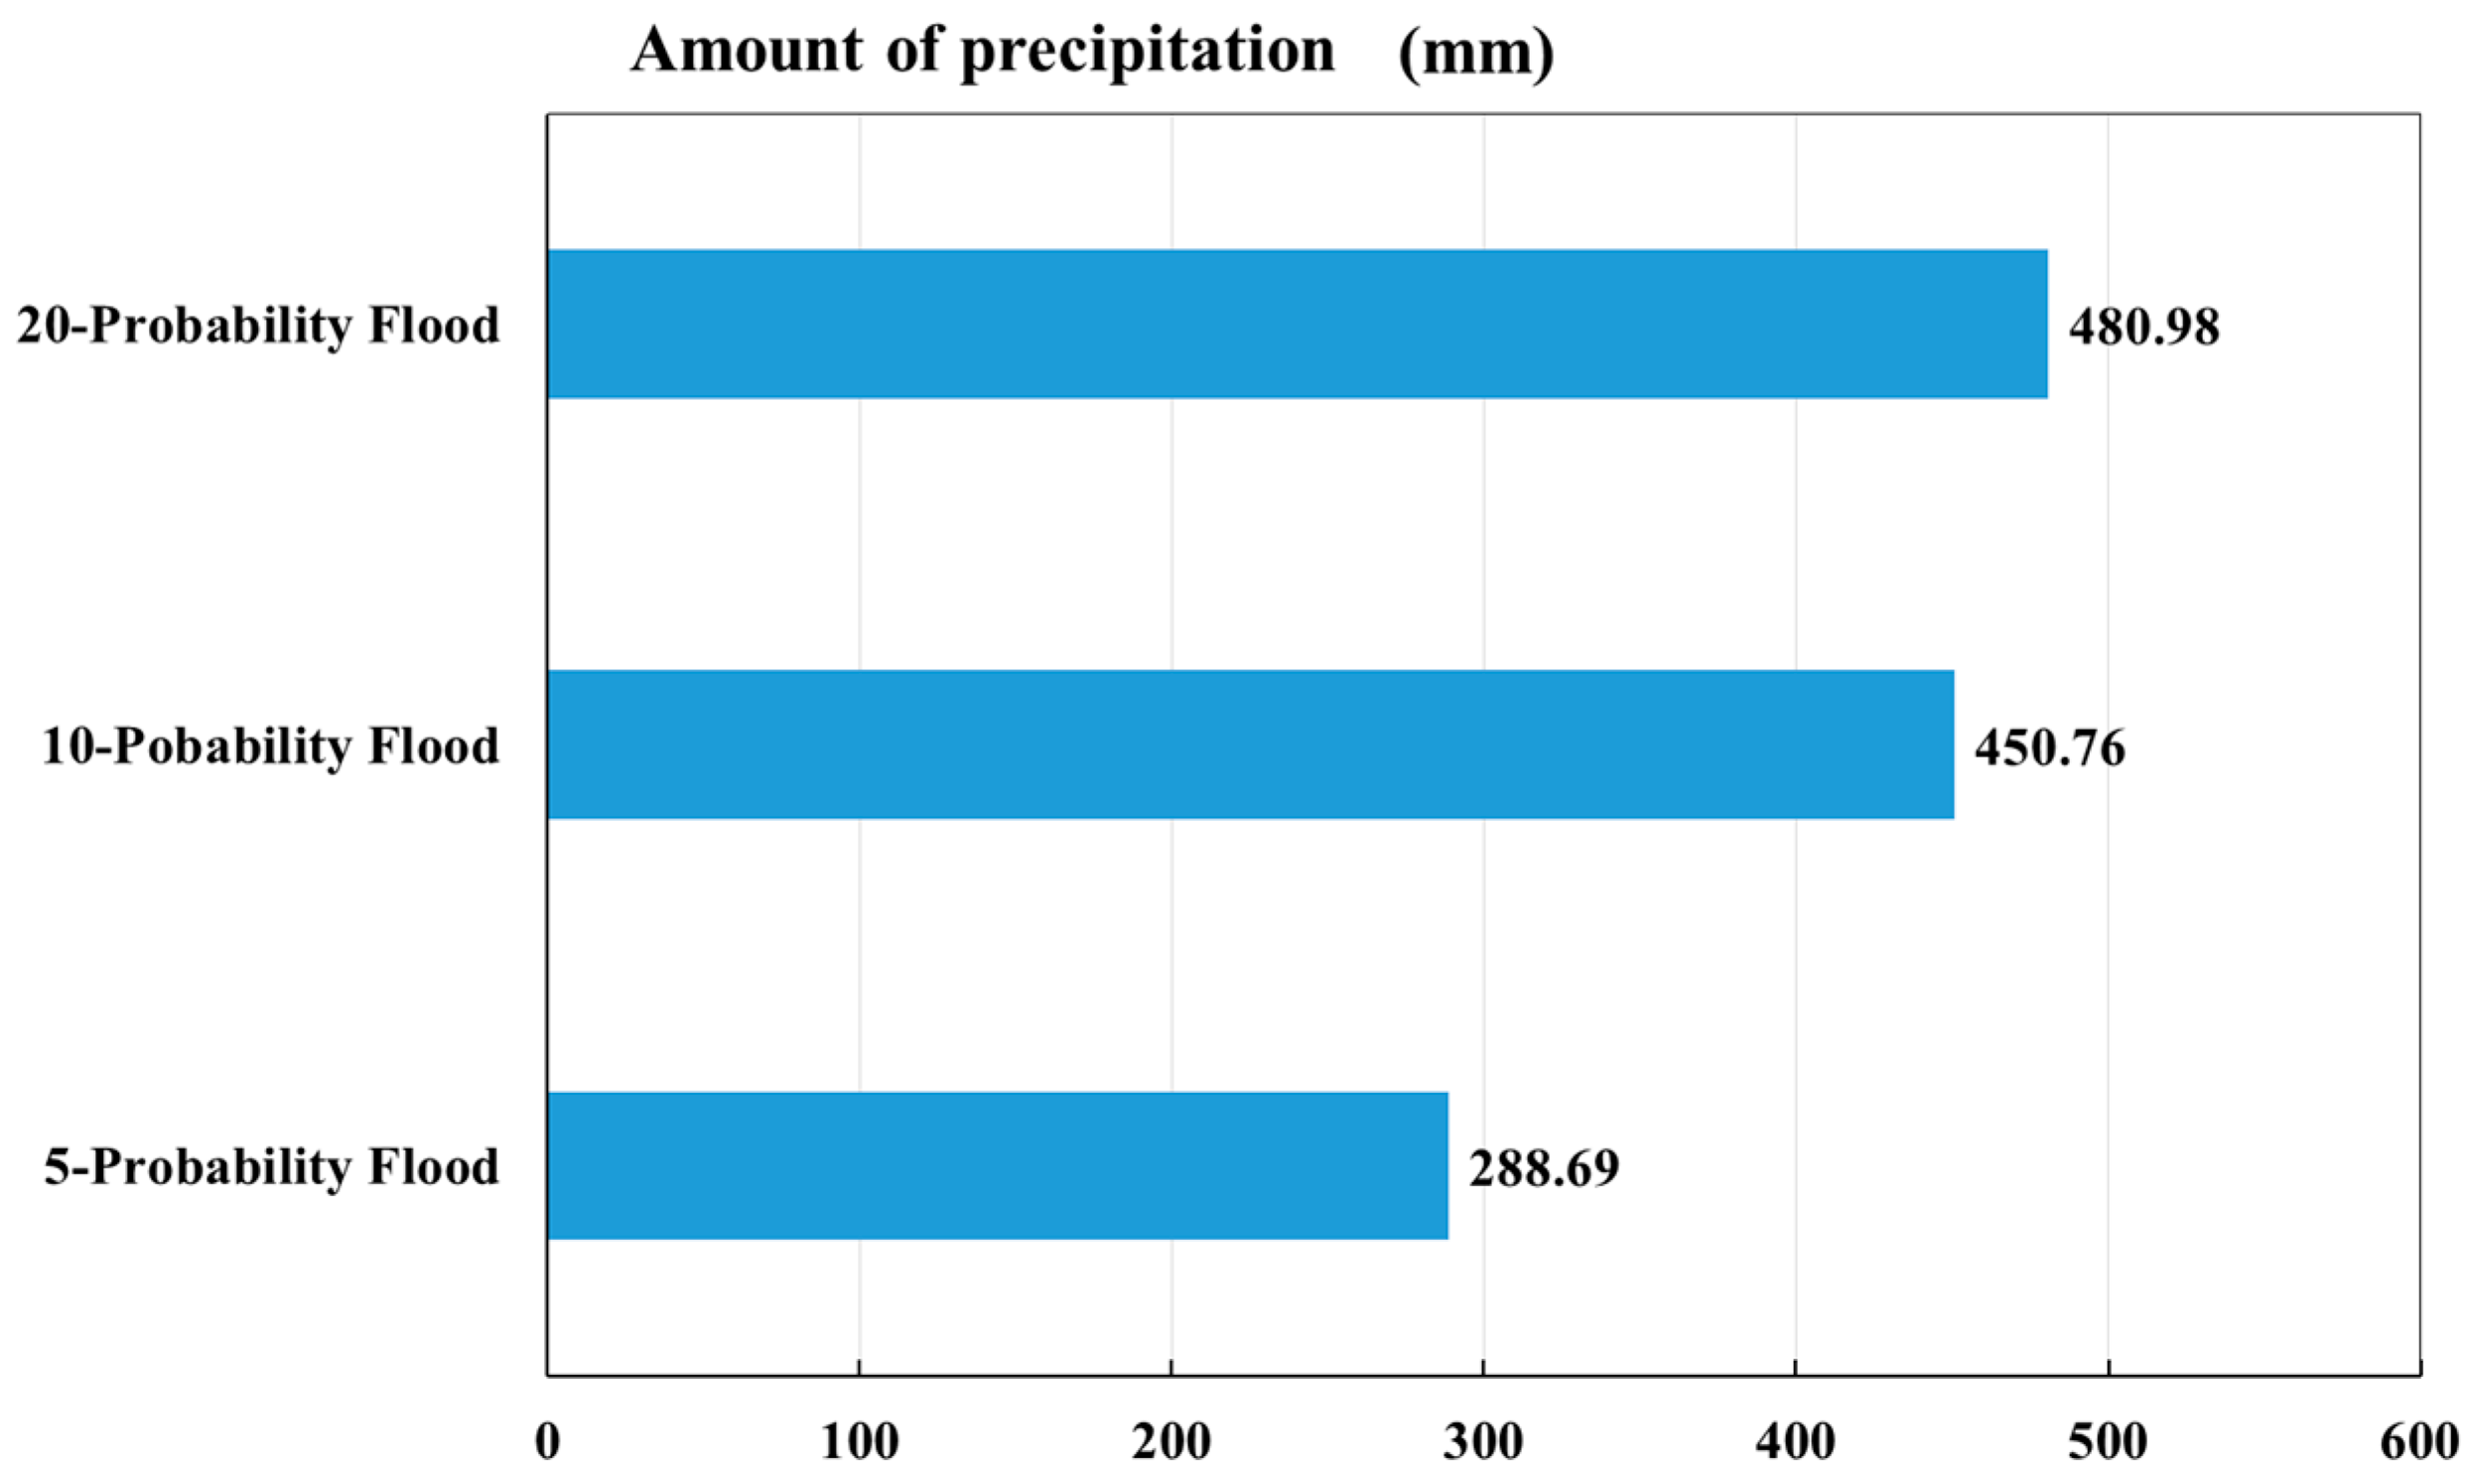
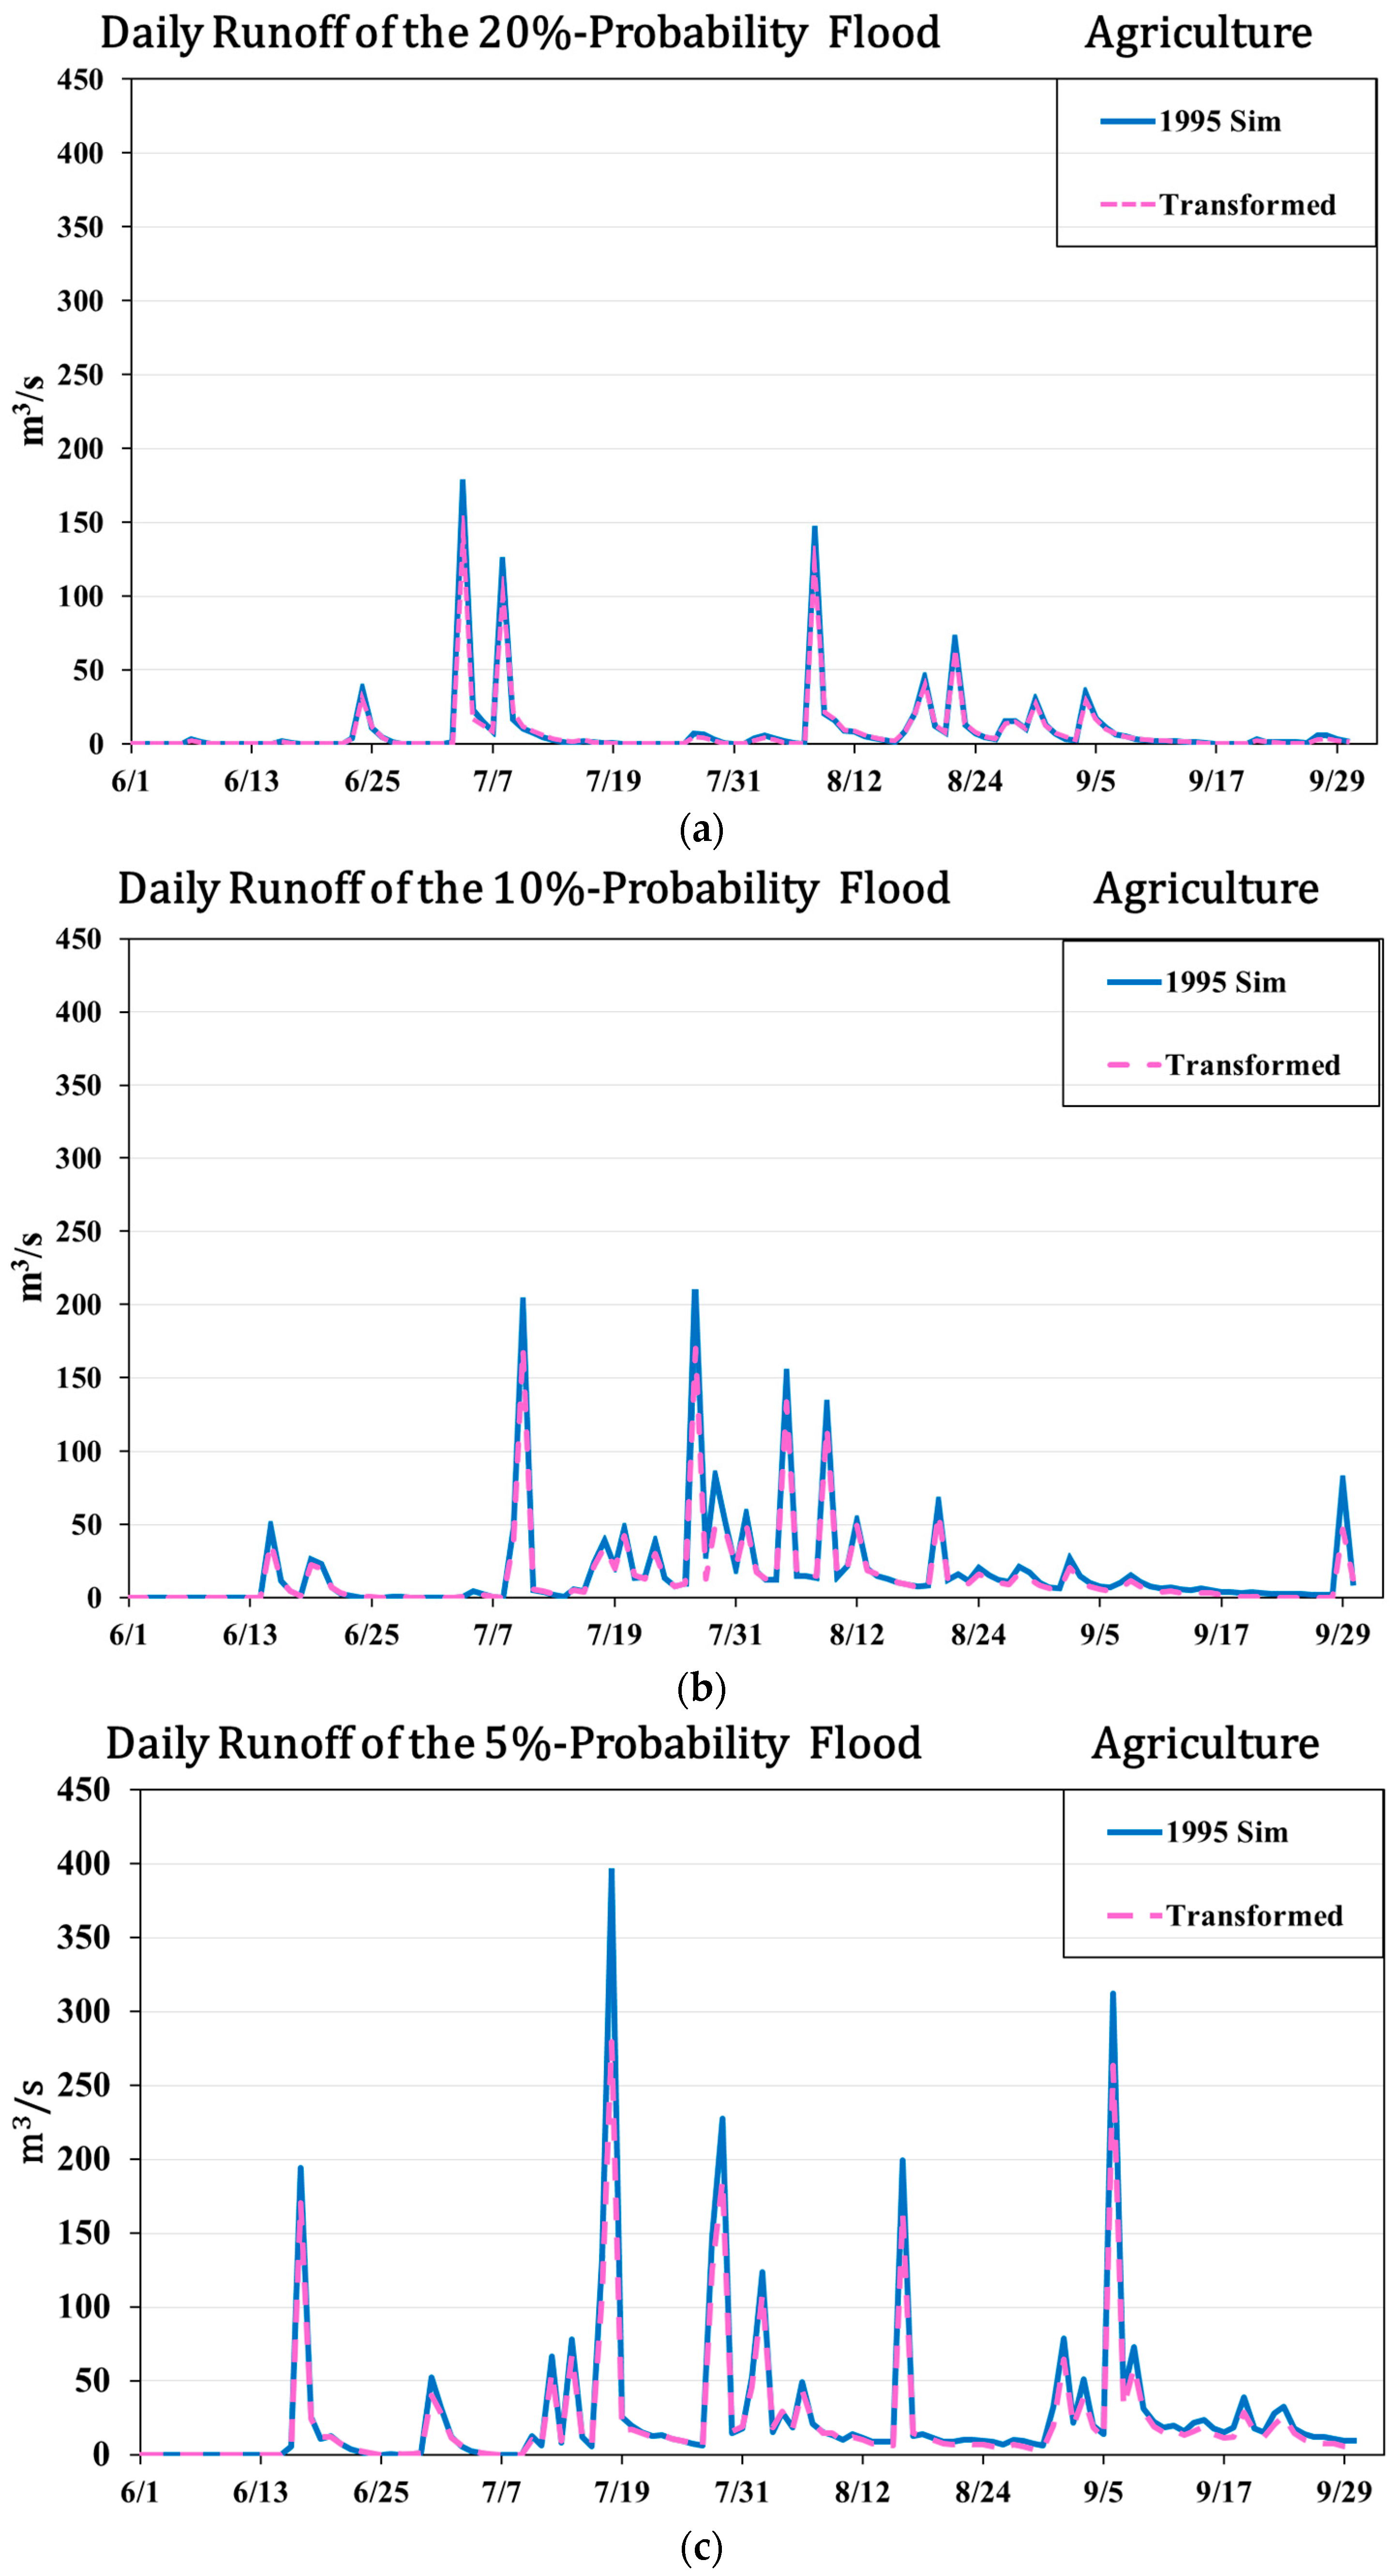
To give a general view of the potential of non-point flood alleviation, we averaged the figures separately of the 1-day runoff, 7-day runoff and the runoff depth of all three kinds of floods. The land use of 2005 can on average reduce floods according to the three indicators by 10.7%, 9.7%, 12.3%; the agricultural land was reduced by 20.0%, 20.3%, 14.3%; the grass land was reduced by 3.7%, 10.7%, 20% and the urban/construction land increased by 19.0%, 9.3%, 2.3%.
As a concept, how non-point flood alleviation can be put into use and the practical results remain to be explained. We chose the SWAT model to solve this problem. Through the simulations of land uses of the years 1995 and 2005, we think the results present a relatively clear demonstration of the pattern of non-point flood alleviation.
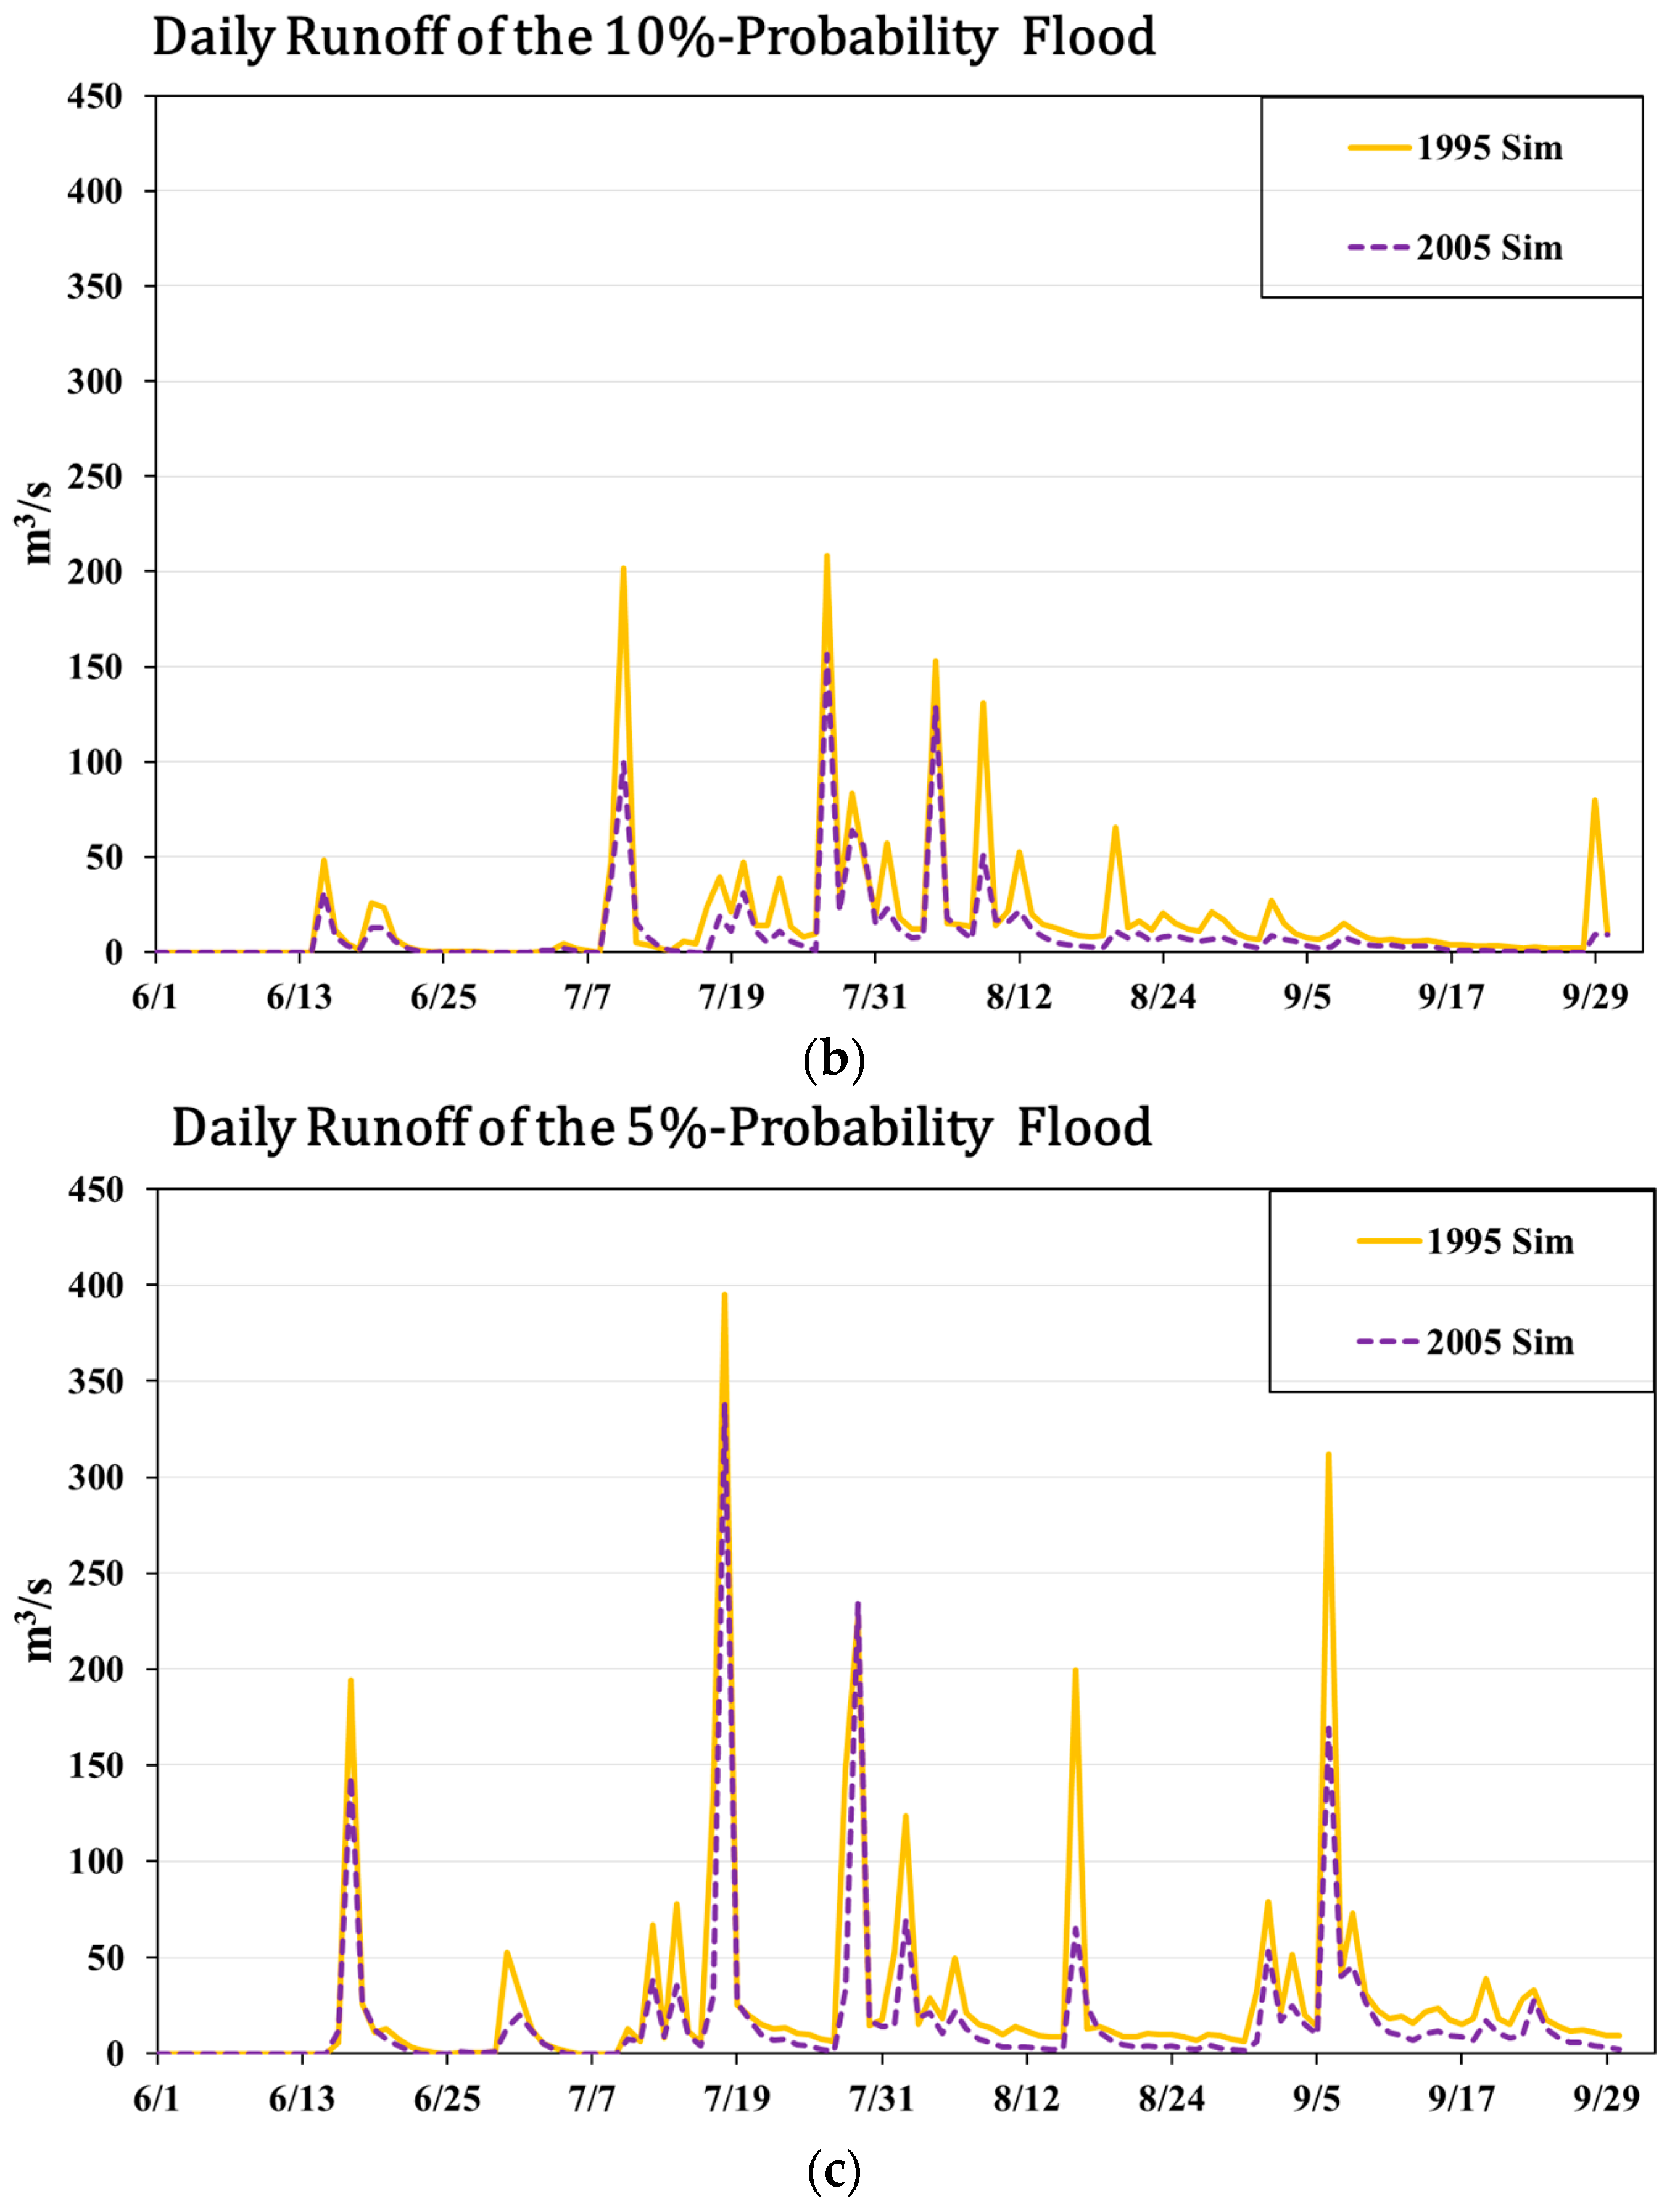
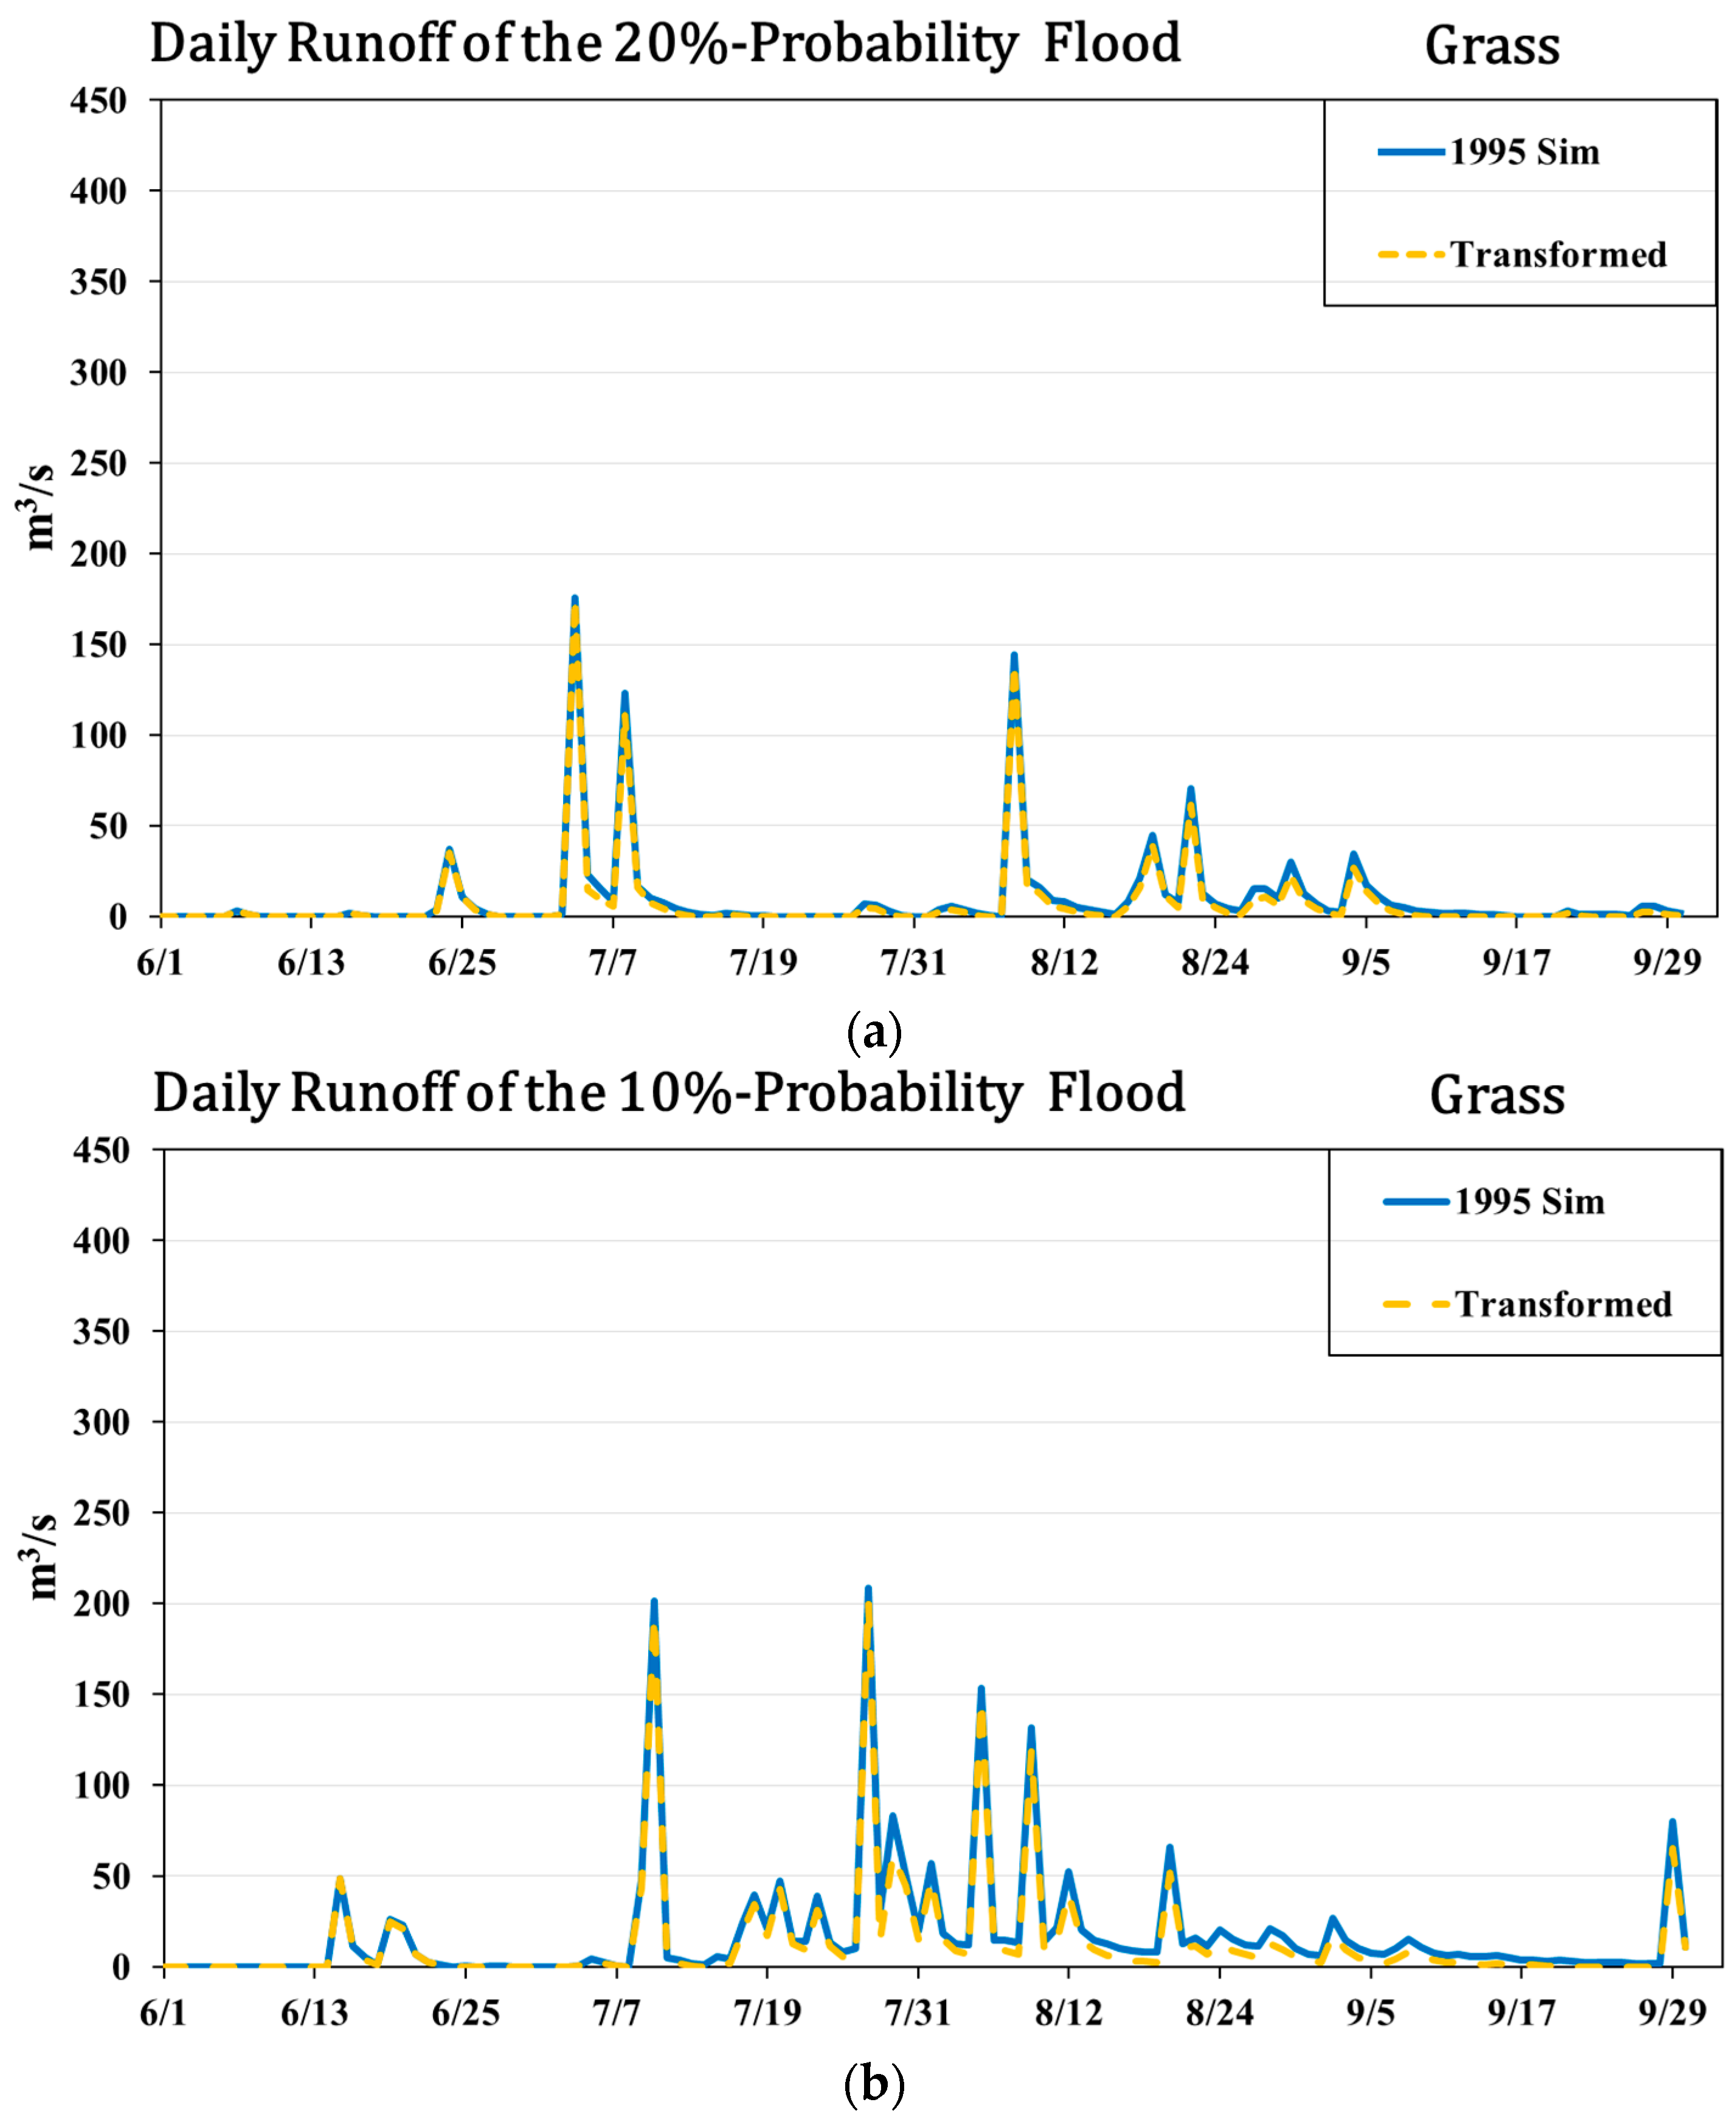
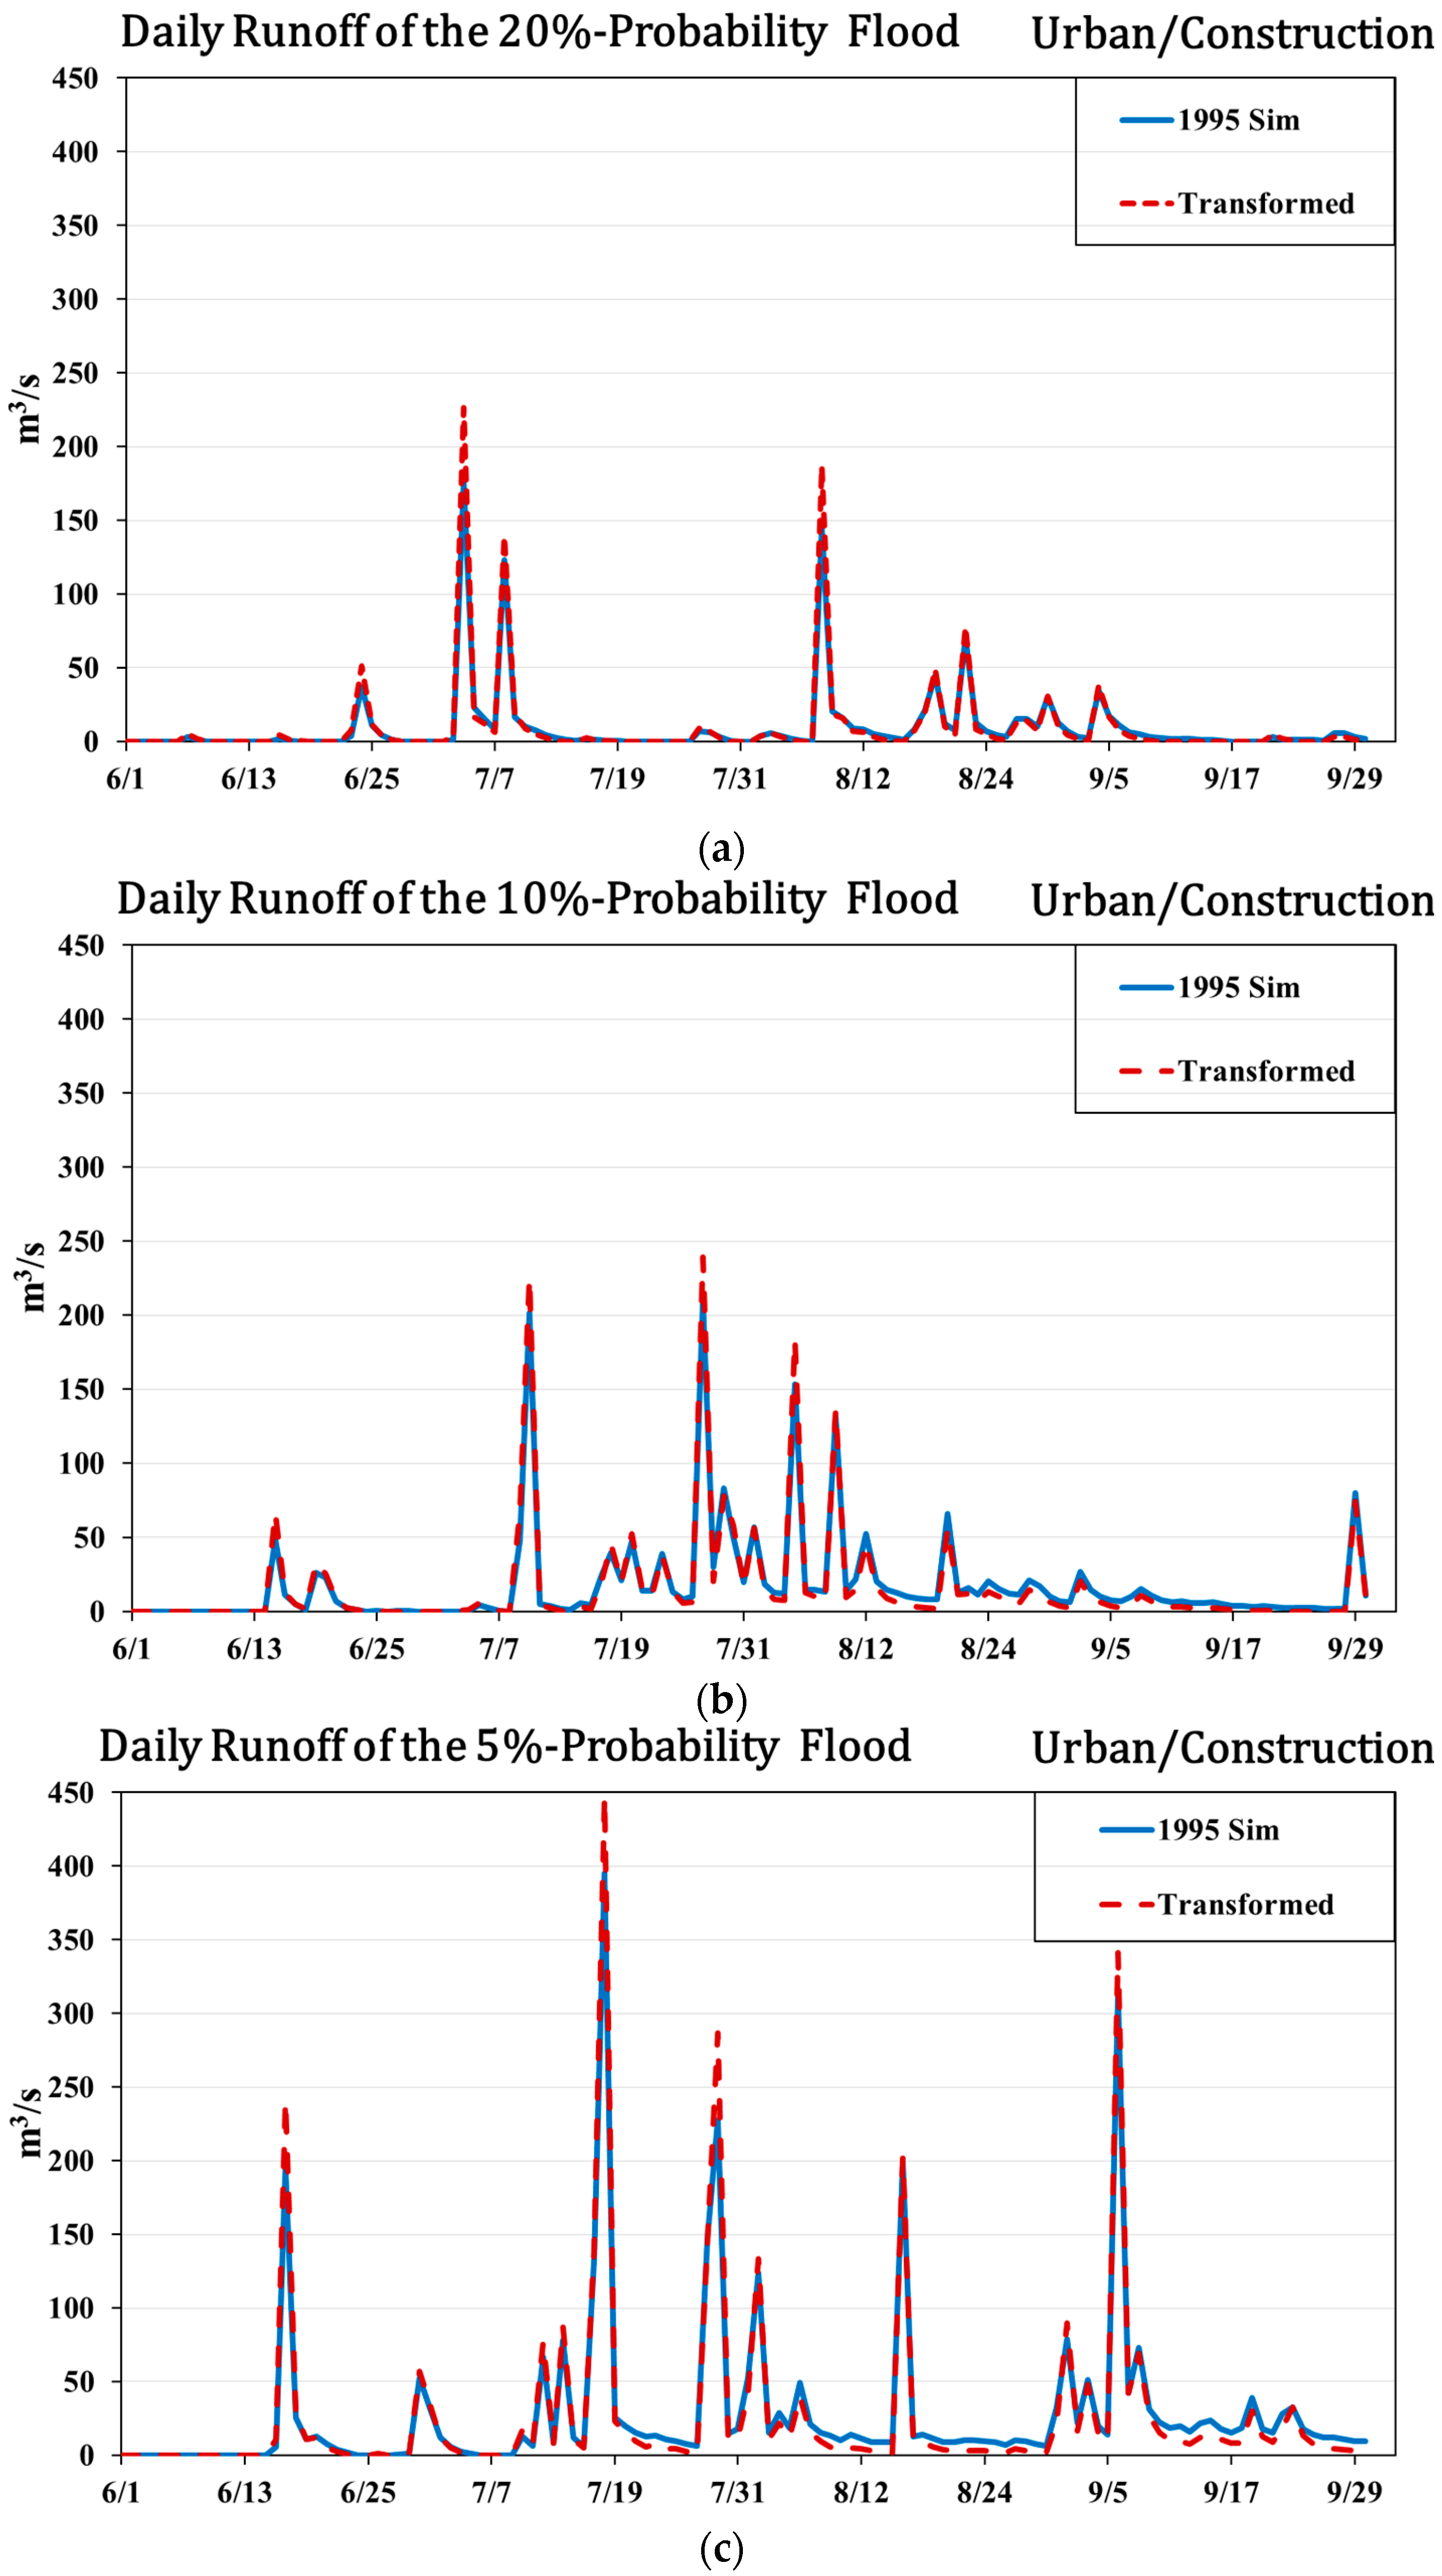
Non-point flood alleviation is based on the response of runoff/floods to changes in land use. The simulations show that S2 is better in reducing the floods under different rainfall amounts, which indicates that the land use in 2005 functions better in reducing scattered floods than that of 1995. The same goes for the single land use transformation. According to the same three indicators, we can determine that agricultural land and grassland are favorable to reducing scattered floods while urban/construction land is not conducive to mitigating scattered floods in Yongding River basin.
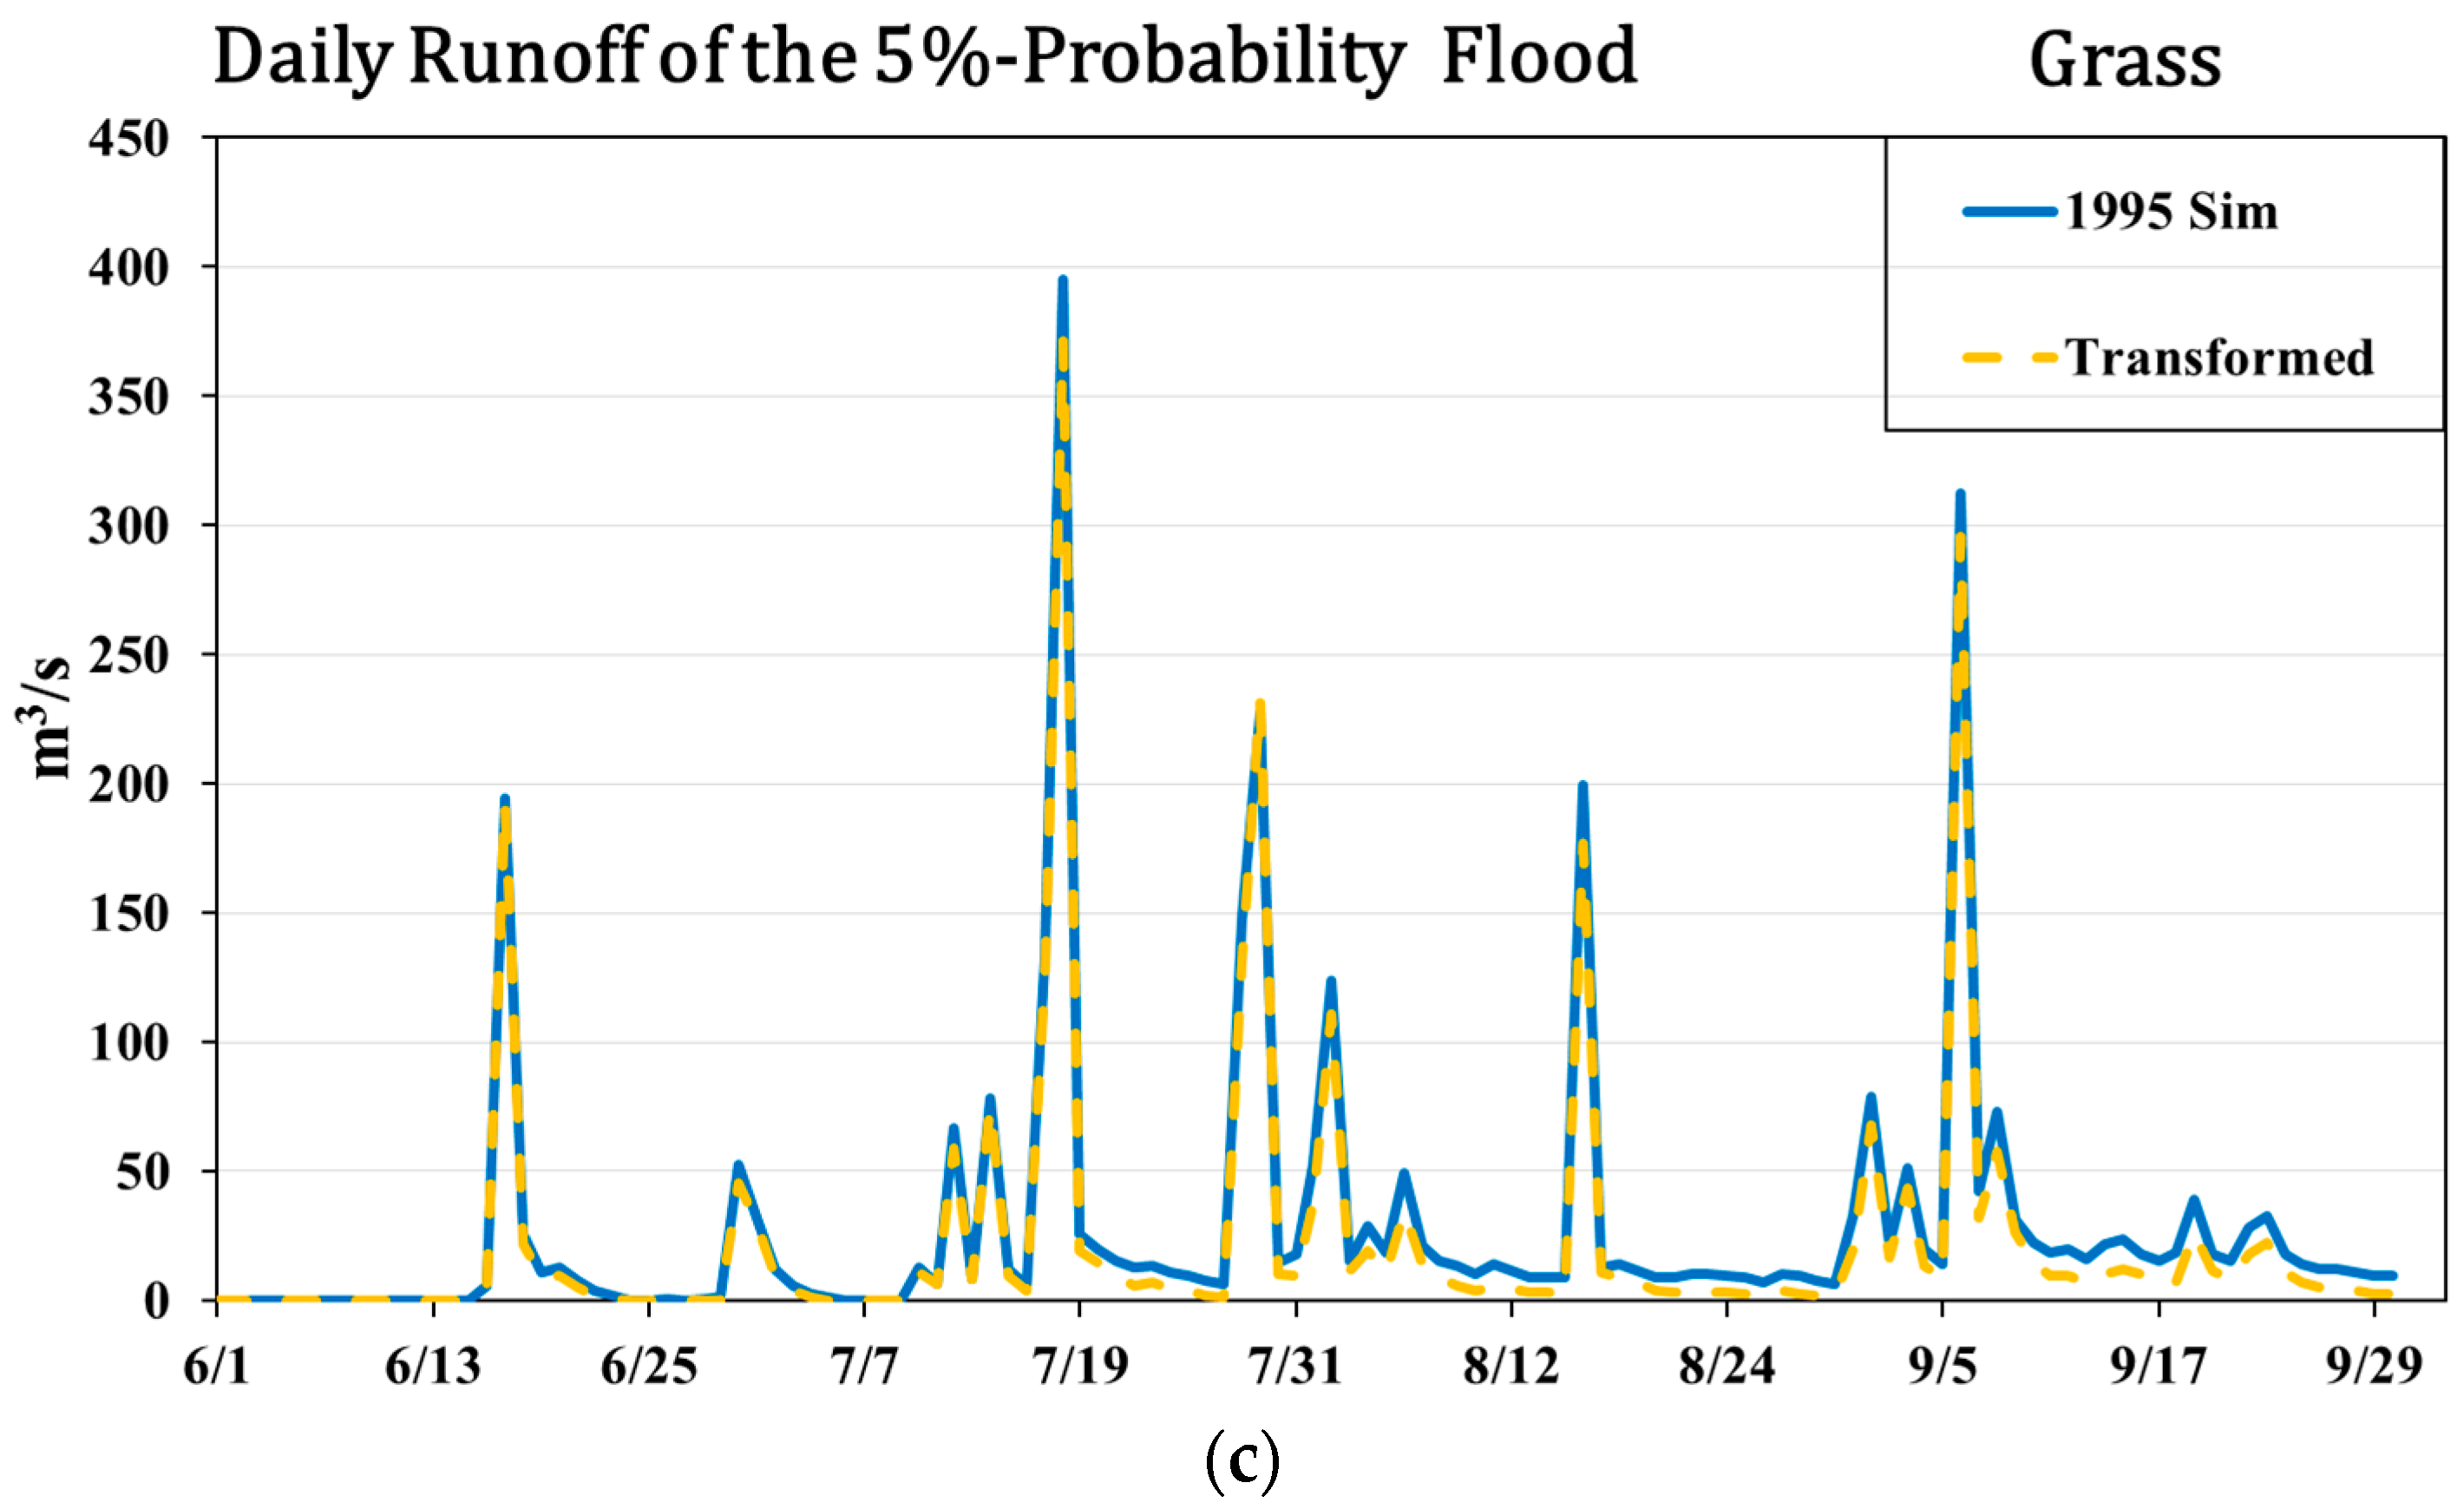
When comparing the return periods of the floods, we discovered that non-point flood alleviation in Yongding River basin has a stronger effect on small floods, and with the return period increasing, the effect is diminished.
Because of land use change, we assume that non-point flood alleviation depends on the change in water-holding capacity. Non-point flood alleviation can fill in the gap in present flood control management as a new measure. One possibility of non-point flood alleviation could consist of a soil water bank on the bottom of the basin, and using various land use measures to prevent floods. For larger floods, the usual engineering projects like dams and reservoirs still are the most effective means. However, for medium and small floods, non-point flood alleviation of land use is attracting more attention. By using land use management to prevent floods, the flood control capacity of Yongding River basin has been improved, the pressure on flood control downstream has been eased and the comprehensive utilization of rainwater has been strengthened at the same time. In addition, non-point flood alleviation is a non-engineering measure, thus, the degree of damage to the ecological environment damage degree has been reduced, which is more conducive to the sustainable development of water resources in the region.

Acknowledgments

This research is supported by National Natural Science Fund of China (NSFC) (No. 51379216 and No.51309249), Young Scientist fund of NSFC (No. 51309246), the National key Research and Development Program of China (Grant No. 2016YFC0401407), Independ research of State Key Laboratory (No.2016CG01) and Consulting Project of Chinese Academy of Engineering (No. 0135082016).

Author Contributions

Yong Zhao and Jianhua Wang conceived and designed the experiments; Yue Zhang performed the model; Qingming Wang and Yongnan Zhu analyzed the data; Haihong Li, Jiaqi Zhai and Jiazhen Li contributed data materials; Yue Zhang wrote the paper.

Conflicts of Interest

The authors declare no conflict of interest.

References

  1. Mileti, D.S. Disasters by Design; Joseph Henry Press: Washington, DC, USA, 1999. [Google Scholar]
  2. Aristeidis, M.; Konstantinos, M. Impact of River Damming and River Diversion Projects in a Changing Environment and in Geomorphological Evolution of the Greek Coast. Br. J. Environ. Clim. Chang. 2013, 3, 127–159. [Google Scholar] [CrossRef] [PubMed]
  3. Kenyona, W.; Hill, G. Scoping the role of agriculture in sustainable flood management. Land Use Policy 2008, 25, 351–360. [Google Scholar] [CrossRef]
  4. Marrero, L.; Mar, T.D. Adaptive Capacity and Resilience to Floods in the Caribbean: A Case Study of Two Flood-Prone Communities in Puerto Rico. Ph.D. Thesis, Pennsylvania State University, State College, PA, USA, 2008. [Google Scholar]
  5. Uehlinger, U. Resistance and resilience of ecosystem metabolism in a flood-prone river system. Freshw. Biol. 2000, 45, 319–332. [Google Scholar] [CrossRef]
  6. Bruijn, K.D. Resilience and flood risk management. Water Policy 2004, 6, 53–66. [Google Scholar]
  7. Liu, J.; Fang, W.H.; Ge, Y.; Wang, J.A.; Lu, X.Y.; Shi, P.J. Regional flood resilience and flood risk management: A case study on Dongting Lake region. J. Nat. Disasters 2006, 15, 56–61. [Google Scholar]
  8. DeFries, R.; Eshleman, K.N. Land-use change and hydrologic processes: A major focus for the future. Hydrol. Process. 2004, 18, 2183–2186. [Google Scholar] [CrossRef]
  9. Beven, K.; Young, P.; Romanowicz, R.; O’Connell, E.; Ewen, J.; O’Donnell, G.M.; Holman, I.; Posthumus, H.; Morris, J.; Hollis, J.; et al. Analysis of Historical Datasets to Look for Impacts of Land Use and Management Change on Flood Generation; Final Report FD2120; DEFRA: London, UK, 2008.
  10. Bewket, W.; Sterk, G. Dynamics in land cover and its effect on stream flow in the Chemoga watershed, Blue Nile basin, Ethiopia. Hydrol. Process. 2005, 19, 445–458. [Google Scholar] [CrossRef]
  11. Mcintyre, N.; Marshall, M. Identification of rural land management signals in runoff response. Hydrol. Process. 2010, 24, 3521–3534. [Google Scholar] [CrossRef]
  12. Li, J.Z.; Feng, P.; Wei, Z. Incorporating the data of different watersheds to estimate the effects of land use change on flood peak and volume using multi-linear regression. Mitig. Adapt. Strat. Glob. Chang. 2013, 18, 1183–1196. [Google Scholar] [CrossRef]
  13. Ristić, R.; Radić, B.; Vasiljević, N. Land Use Change for Flood Protection—A prospective study for the restoration of the river Jelašnica watershed. Glasnik Umarskog Fakulteta 2011, 103, 115–130. [Google Scholar] [CrossRef]
  14. Nie, W.M.; Yuan, Y.P. Assessing impacts of Land use and Land cover changes on hydrology for the upper San Pedro watershed. J. Hydrol. 2011, 407, 105–114. [Google Scholar] [CrossRef]
  15. Lin, Y.; Wei, X. The impact of large-scale forest harvesting on hydrology in the Willow watershed of Central British Columbia. J. Hydrol. 2008, 359, 141–149. [Google Scholar] [CrossRef]
  16. Burt, T.P. Integrated management of sensitive catchment systems. Catena 2001, 42, 275–290. [Google Scholar] [CrossRef]
  17. Feng, H.; Wu, S.F.; Wu, P.T.; Li, M. Study on Scouring Experiment of Regulating Runoff in Grassland Slope. J. Soil Water Conserv. 2005, 19. (In Chinese) [Google Scholar] [CrossRef]
  18. Xia, J.; Qiao, Y.F.; Song, X.F.; Ye, A.Z.; Zhang, X.C. Analysis about Effect Rules of Underlying Surface Change to the Relationship between Rainfall and Runoff in the Chabagou Catchment. Resour. Sci. 2007, 29, 71–76. (In Chinese) [Google Scholar]
  19. Fan, S.X.; Gao, Y.; Cheng, Y.C.; Bai, Q.J. Research of Plot Testing for Effects of the Woods and Grass Vegetation on Runoff. J. Shandong Agric. Univ. (Nat. Sci.) 2006, 37, 43–47. (In Chinese) [Google Scholar]
  20. Sujono, J. Flood Reduction Function of Paddy Rice Fields under Different Water Saving Irrigation Techniques. J. Water Resour. Prot. 2010, 2, 555–559. [Google Scholar] [CrossRef]
  21. Boardman, J.; Evans, R.; Ford, J. Muddy floods on the South Downs, southern England: Problem and responses. Environ. Sci. Policy 2003, 6, 69–83. [Google Scholar] [CrossRef]
  22. Yang, L.N.; Wang, Y.S.; Bai, Y. Effects of Tillage Measures on surface runoff and sediment yield. Technol. Soil Water Conserv. 2006, 3, 15–16. (In Chinese) [Google Scholar]
  23. O’Connell, P.E.; Beven, K.J.; Carney, J.N.; Clements, R.O.; Ewen, J.; Hollis, J.; Morris, J.; O’Donnell, G.M.; Packman, J.C.; Parkin, A.; et al. Review of Impacts of Rural Land Use and Management on Flood Generation; Short Term Improvement in Modelling and Future Research Plan; Final Report FD2114; DEFRA: London, UK, 2004.
  24. Uhlenbrook, S.; Mc Donnell, J.; Leibundgut, C. Runoff generation and implications for river basin modelling. Hydrol. Process. 2001, 13, 4–13. [Google Scholar] [CrossRef]
  25. Wheater, H.S. Flood hazard and management: A UK perspective. Philos. Trans. R. Soc. A 2006, 364, 2135–2145. [Google Scholar] [CrossRef] [PubMed]
  26. Tollan, A. Land-use change and floods: What do we need most, research or management? Water Sci. Technol. 2002, 45, 183–190. [Google Scholar] [PubMed]
  27. Schilling, K.E.; Gassman, P.W. The potential for agricultural land use change to reduce flood risk in a large watershed. Hydrol. Process. 2014, 28, 3314–3325. [Google Scholar] [CrossRef]
  28. Sriwongsitanon, N.; Taesombat, W. Effects of land cover on runoff coefficient. J. Hydrol. 2011, 410, 226–238. [Google Scholar] [CrossRef]
  29. Ronfort, C.; Souchère, V. Methodology for land use change scenario assessment for runoff impacts: A case study in a north-western European Loess belt region (Pays de Caux, France). Catena 2011, 86, 36–48. [Google Scholar] [CrossRef]
  30. Deasy, C.; Baxendale, S.A. Advancing understanding of runoff and sediment transfers in agricultural catchments through simultaneous observations across scales. Earth Surf. Process. Landf. 2011, 36, 1749–1760. [Google Scholar] [CrossRef]
  31. Zhang, X.; Liu, Y.; Fang, Y.; Liu, B.; Xia, D. Modeling and assessing hydrologic processes for historical and potential land-cover change in the Duoyingping watershed, southwest China. Phys. Chem. Earth 2012, 53, 19–29. [Google Scholar] [CrossRef]
  32. Ashagrie, A.G.; de Laat, P.J.M.; de Wit, M.J.M.; Tu, M.; Uhlenbrook, S. Detecting the influence of land use changes on discharges and floods in the Meuse River Basin? The predictive power of a ninety-year rainfall-runoff relation. Hydrol. Earth Syst. Sci. Discuss. 2006, 10, 691–701. [Google Scholar] [CrossRef]
  33. Ott, B.; Uhlenbrook, S. Quantifying the impact of land-use changes at the event and seasonal time scale using a process-oriented catchment model. Hydrol. Earth Syst. Sci. 2004, 8, 62–78. [Google Scholar] [CrossRef]
  34. Niehoff, D.; Fritsch, F.; Bronstert, A. Land use impacts on storm-runoff generation: Scenarios of land-use change and simulation of hydrological response in a meso-scale catchment in SW-Germany. J. Hydrol. 2002, 267, 80–93. [Google Scholar] [CrossRef]
  35. Ou, C.P.; Xia, J.; Wang, Z.G.; Zhu, X.J. LUCC influence on SWAT hydrological simulation—A case study of Haihe river basin. J. Hydroelectr. Eng. 2009, 28, 126–131. (In Chinese) [Google Scholar]
  36. Zhao, L.K. Countermeasures and suggestions on speeding up the construction of flood control system in Haihe River Basin. Water Resour. Dev. Res. 2012, 4, 42–47. (In Chinese) [Google Scholar] [CrossRef]
  37. Li, D.; Wang, X.; Zhao, M.; Zhang, J.; Liu, S. Flood dispatching numerical simulation for detention basins of Yongding River. Tianjin Daxue Xuebao 2015, 48, 76–86. [Google Scholar]
  38. Leta, O.T.; Nossent, J.; Velez, C.; Shrestha, N.K.; van Griensven, A.; Bauwens, W. Assessment of the different sources of uncertainty in a SWAT model of the River Senne (Belgium). Environ. Model. Softw. 2015, 65, 129–146. [Google Scholar] [CrossRef]
  39. Ghaffari, G.; Keesstra, S.; Ghodousi, J.; Ahmadi, H. SWAT-simulated hydrological impact of land-use change in the Zanjanrood Basin, Northwest Iran. Hydrol. Process. 2010, 24, 892–903. [Google Scholar] [CrossRef]
  40. Tan, M.L.; Ficklin, D.L.; Dixon, B.; Ibrahim, A.L.; Yusop, Z.; Chaplot, V. Impacts of DEM resolution, source, and resampling technique on SWAT-simulated streamflow. Appl. Geogr. 2015, 63, 357–368. [Google Scholar] [CrossRef]
  41. Winchell, M.; Srinivasan, R.; di Luzio, M.; Arnold, J. ArcSWAT Interface for SWAT 2009 User’s Guide; The Yellow River Water Conservancy Press: Zhengzhou, China, 2011. (In Chinese) [Google Scholar]
  42. Bryant, R.; Gburek, W.; Veith, T.; Hively, W.D. Perspectives on the potential for hydropedology to improve watershed modeling of phosphorus loss. Geoderma 2006, 131, 299–307. [Google Scholar] [CrossRef]
  43. Gassman, P.; Reyes, M.; Green, C.; Arnold, J.G. The soil and water assessment tool: Historical development, applications, and future research directions. Am. Soc. Agric. Biol. Eng. 2007, 50, 1211–1250. [Google Scholar] [CrossRef]
  44. Ning, J.C.; Liu, G.H.; Liu, Q.S.; Xie, C.J. Spatial Discretization of Hydrological Response Units and Improved SWAT model. Adv. Water Sci. 2013, 23, 14–20. [Google Scholar]
  45. Her, Y.; Frankenberger, J.; Chaubey, I. Threshold Effects in HRU Definition of the Soil and Water Assessment Tool. Am. Soc. Agric. Biol. Eng. 2015, 58, 367–378. [Google Scholar] [CrossRef]
  46. Abbaspour, K.C. SWAT-CUP2 SWAT Calibration and Uncertainty Programs Version 2; Eawag/Swiss Federal Institute of Aquatic Science and Technology: Dübendorf, Switherland, 2011. [Google Scholar]
  47. Zhang, G.J.; Fan, H.Y.; Wang, C. Thoughts and Countermeasures on the key problems of the construction of the weak links in the river basin. Haihe Water Resour. 2013, 1, 26–29. (In Chinese) [Google Scholar] [CrossRef]
  48. Xun, W.C.; Wang, W. Analysis on Application Technique of the Rainfall Warning System. J. Catastrophol. 2003, 18, 43–446. (In Chinese) [Google Scholar]
  49. Zhao, X.H.; Wang, J.; Wei, M. The Characteristics and Causes of Flood in Yongding River in Historical Period. J. Hebei Norm. Univ./Nat. Sci. Ed. 2013, 37, 85–91. [Google Scholar]
  50. Fang, K. Study on the Response of Flood Runoff to Land-Use Change. Master’s Thesis, Tianjin University, Tianjin, China, 2009. [Google Scholar]
  51. Linag, J.Z. Handbook of Hydrological Information and Forecasting Technology; China Water & Power Press: Beijing, China, 2010. [Google Scholar]
  52. Luo, W.S. Hydrology and Water Resources Calculation; China Water & Power Press: Beijing, China, 2008. [Google Scholar]
  53. Yao, L.F. The regularity of The Flood of Yongding River during the Holocene. Geogr. Res. 1991, 10, 60–67. [Google Scholar]
  54. Zhang, X.; Srinivasan, R.; Zhao, K.; Liew, M.V. Evaluation of global optimization algorithms for parameter calibration of a computationally intense hydrological model. Hydrol. Process. 2008, 23, 430–441. [Google Scholar] [CrossRef]
  55. Puertas, O.L.; Brenning, A.; Meza, F.J. Balancing misclassification errors of land cover classification maps using support vector machines and Landsat imagery in the Maipo river basin (Central Chile, 1975–2010). Remote Sens. Environ. 2013, 137, 112–123. [Google Scholar] [CrossRef]
  56. Dong, M.; Bryan, B.A.; Connor, J.D. Land use mapping error introduces strongly-localised, scale-dependent uncertainty into land use and ecosystem services modelling. Ecosyst. Serv. 2015, 15, 63–74. [Google Scholar] [CrossRef]
  57. Menno, W.S.; van der Perk, M.; Schipper, A.M.; de Nooij, R.J.W.; Leuven, R.S.E.W.; Huthoff, F.; Middelkoop, H. Uncertainty in hydromorphological and ecological modelling of lowland river floodplains resulting from land cover classification errors. Environ. Model. Softw. 2013, 42, 17–29. [Google Scholar]
  58. Zhou, H.; Lv, Y.Z.; Yang, Z.C.; Li, B.G. Effects of Conservation Tillage on Soil Aggregates in Huabei Plain, China. Sci. Agric. Sin. 2007, 40, 1973–1979. [Google Scholar]
  59. Xie, W.Y.; Fan, G.S. Influence of Soil Structure on Infiltration Characteristics of Soil. J. Taiyuan Univ. Technol. 2004, 35, 381–384. [Google Scholar]
  60. Chen, Q.; Chen, Y.; Li, X.; Li, H. Seasonal Variations of Soil Structures and Hydraulic conductivities and Their Effects on Soil and Water Conservation under No-Tillage and Reduced Tillage. Acta Pedol. Sin. 2004, 51, 11–20. [Google Scholar]
  61. Dong, L.L. Characteristics of Soil Water Stable Aggregates under Different Land-Use Types. Sci. Silvae Sin. 2011, 47, 95–100. [Google Scholar]
Figure 1. The location of the study area. (a) The location of the river system and weather stations in study area and (b) The location of study area in China.
Water 08 00401 g001
Figure 2. Precipitation with 5%, 10% and 20% flood probability from June to September.
Water 08 00401 g002
Figure 3. The comparison of SWAT model simulation and observed monthly runoff. (a) The verification of the model with the time period of 1992–2000; (b) The calibration of the model with the time period of 2003–2013.
Water 08 00401 g003
Figure 4. (a) The daily runoffs of the20%-probability flood under 1995 land use and 2005 land use; (b) The daily runoffs of the 10%-probability flood under 1995 land use and 2005 land use; (c) The daily runoffs of the 5%-probability flood under 1995 land use and 2005 land use.
Water 08 00401 g004aWater 08 00401 g004b
Figure 5. In every panel, the original is the result under the 1995 land use simulated by SWAT model, the transformed is the result under the S1 scenario. (a) The comparison of daily runoff processes of the 20%-probability flood; (b) The comparison of daily runoff processes of the 10%-probability flood; (c) The comparison of daily runoff processes of the 5%-probability flood.
Water 08 00401 g005
Figure 6. In every panel, the original is the result under the 1995 land use simulated by SWAT model, the transformed is the result under the S2 scenario. (a) The comparison of daily runoff processes of the 20%-probability flood; (b) The comparison of daily runoff processes of the 10%-probability flood; (c) The comparison of daily runoff processes of the 5%-probability flood.
Water 08 00401 g006aWater 08 00401 g006b
Figure 7. In every panel, the original is the result under the 1995 land use simulated by SWAT model, the transformed is the result under the S3 scenario. (a) The comparison of daily runoff processes of the 20%-probability flood; (b) The comparison of daily runoff processes of the 10%-probability flood; (c) The comparison of daily runoff processes of the 5%-probability flood.
Water 08 00401 g007
Table 1. The studies on the land use change.
CatchmentStudy MethodLand-Use Change ImpactReference
the Raccoon River watershedSWAT modelConverting cropland to perennial vegetation or extension could reduce the flood risk.Keith E. Schilling et al. (2014) [27]
Daqinghe watershedmulti-linear regressionChanges with in-field irrigation treatments have an effect on the local-scale runoff generation.Li (2013) [12]
Upper Ping River Basinland cover on runoff coefficientForests have proved to offer flood mitigation benefits for smaller flood events.Nutchanart Sriwongsitanon (2011) [28]
Saussay watershedSTREAM modelA variability of runoff was found to affect the watershed outlet by a low-intensity rainfall event.C. Ronfort (2011) [29]
the River LuggThe ZILN modelRunoff and sediment yields increase as scale increases, which is likely due to increasing connectivity within the catchment, and the dominance of preferential flow pathways including field drains.C. Deasy (2011) [30]
the Duoyingping watershedThe VIC modelWhen it concerns forest protection policy, annual ET increased by more than 15%, while annual runoff decreased by 6%.Zhang et al. (2011) [31]
the river Meusesemi-distributed conceptual model (HBV)Most of the variation in the discharge record could be explained by variation in the meteorological conditions.A. G. shagrie (2006) [32]
the Dreisam basinthe model TACD (TAC, Distributed)Forest had a significant effect which indicated a decrease in groundwater, surface water discharge, and in flood peaks.Bettina Ott et al. (2004) [33]
Lein Catchment in Germanymodified WaSiM-ETH modelThe influence of the land use on storm runoff generation for rainfall events was most distinct for short, intense rainfall events and minor for longer, less intense rainfall events.Niehoff et al. (2002) [34]
Table 2. The parameters calibrated in the study.
No.ParametersMeaningValueUnit
1R 1_CN2.mgtSCS runoff curve number under moisture condition II−0.1915/
2V 2_ALPHA_BF.gwunderground base flow recession constant0.0697/
3V_GW_DELAY.gwTime delay of groundwater430.0497d
4V_GWQMN.gwThreshold of water level of shallow aquifer required for return flow1.2596mm
5V_GW_REVAP.gwRevap coefficient of groundwater0.1664/
6V_ESCO.hruSoil evaporation compensation factor0.8571/
7V_ALPHA_BNK.rteBase flow recession constant with bank storage0.9258/
8R_SOL_AWC(1).solEffective moisture content of the first layer of soil0.0823/
9R_SOL_K(1).solSaturated permeability coefficient of the first layer soil−0.6928/
10R_SOL_BD(1).solWet bulk density of the first layer of soil−0.2457/
Notes: 1 R_ means an existing parameter value is multiplied by (1 + a given value); 2 V_ means the existing parameter value is to be replaced by a given value [44]; “/” means non-dimensional.
Table 3. The changes in land use between 1995 and 2005.
Class19952005Area Change 1995–2005 (km2)Change %
Area (km2)%Area (km2)%
Agricultural land19,23944%19,53945%3002%
Forest land 1959922%891220%−687−7%
Grass land12,23928%12,70829%4694%
Water area2781%2431%−35−13%
Unused land 211423%6732%−469−41%
Urban/Construction land12243%16464%42234%
Notes: 1 Forest land includes shrubbery, woodland and open forest land; 2 Unused land includes bare ground, alkaline land, and sandy land.
Table 4. Different land use transfer matrix from 1995 to 2005; Unit: km2.
Land UseS1/S2S3/
AgriculturalForestGrassUrbanUnused
Agricultural 117440859935
Forest1500 72151715
Grass10213 131
Urban779200951 9
Unused71524
Table 5. Calibration and validation statistics for modelled baseline runoff in the Yongding river basin.
PeriodDailyMonthlyRE
r2NSEr2NSE
Calibration1992–20000.780.690.80.65−16%
Validation2003–20130.740.720.70.695%
Table 6. Calibration and validation statistics for modelled baseline daily runoff in the Yongding river basin.
PeriodP-FactorR-Factor
Calibration1992–20000.71.17
Validation2003–20130.550.44
Table 7. The characteristics of floods with three probabilities in 1995 and 2005 land use scenarios.
Probability of Occurrence1-Day Maximum Discharge (m3/s)Change Rate (%)Run off Depth (mm)Change Rate (%)7-Day Maximum Runoff Volume (104 m3)Change Rate (%)
199520051995200519952005
20%-probability175.4166.6−5%2.21.7−20%372.3331.4−11%
10%-probability208.5181.4−13%4.23.4−19%468.3384.0−18%
5%-probability395.4338.1−14%6.86.2−8%669.9602.9−10%
Table 8. The results of three indictors of S1.
Flood Frequency1-Day Maximum Flood Discharge (m3/s)Change Rate (%)7-Day Maximum Runoff Volume (104 m3)Change Rate (%)Runoff Depth (mm)Change Rate (%)
20%-probability141.90−19%294.12−21%1.83−16%
10%-probability148.04−29%355.91−24%3.49−17%
5%-probability324.23−18%562.67−16%6.09−10%
Table 9. The results of three indictors of S2.
Flood Frequency1-Day Maximum Flood Discharge (m3/s)Change Rate (%)7-Day Maximum Runoff Volume (104 m3)Change Rate (%)Runoff Depth (mm)Change Rate (%)
20%-probability168.38−4%336.80−10%1.77−19%
10%-probability195.99−6%401.14−14%3.33−21%
5%-probability391.45−1%618.24−8%5.45−20%
Table 10. The results of three indictors of S3.
Flood Frequency1-Day Maximum Flood Discharge (m3/s)Change Rate (%)7-Day Maximum Runoff Volume (104 m3)Change Rate (%)Runoff Depth (mm)Change Rate (%)
20%-probability226.20+29%427.69+15%2.29+5%
10%-probability239.30+15%485.27+4%4.50+7%
5%-probability447.30+13%729.39+9%6.91+2%

