Chemical and Light Extinction Characteristics of Atmospheric Aerosols in Suburban Nanjing, China
by
Dan Wu
1,2,*, 
Fan Zhang
1,2,
Xinlei Ge
1,2,
Meng Yang
1,2,
Junrong Xia
3,
Gang Liu
1,2 and
Fengying Li
1,2 1
Jiangsu Collaborative Innovation Center of Atmospheric Environment and Equipment Technology (CICAEET), Nanjing University of Information Science and Technology, Nanjing 210044, China
2
Jiangsu Key Laboratory of Atmospheric Environment Monitoring and Pollution Control, Nanjing University of Information Science and Technology, Nanjing 210044, China
3
Key Laboratory for Aerosol-Cloud-Precipitation of China Meteorological Administration, Nanjing 210044, China
*
Author to whom correspondence should be addressed.
Atmosphere 2017, 8(8), 149; https://doi.org/10.3390/atmos8080149
Submission received: 7 July 2017
/
Revised: 10 August 2017
/
Accepted: 11 August 2017
/
Published: 15 August 2017
(This article belongs to the Section Aerosols)
Abstract
:This work reports the chemical and light extinction characteristics of the atmospheric particles collected from January to November 2014 in suburban Nanjing. Size-segregated measurement results showed that more than 80% of the major aerosol components were concentrated in PM2.5. The concentration of PM2.5 was highest in winter and lowest in autumn. Specifically, K+ concentration peaked in late spring indicating heavy influences from straw burning, while sulfate concentration was highest in summer and its daytime concentration was also higher than its nighttime concentration, both reflecting a significant role of photochemical production. Nevertheless, except for sulfate, all other components had higher concentrations during nighttime, signifying the role of unfavorable meteorological conditions in exacerbating the air pollution. The IMPROVE formula was employed, which can reconstruct the PM2.5 mass and light extinction well. The light extinction was mainly contributed by (NH4)2SO4 and NH4NO3 (together 58.3%). Mass concentrations of all PM2.5 components increased significantly with the increase of pollution levels, but nitrate increased most rapidly; correspondingly, the contribution of nitrate to light extinction also increased quickly when pollution became heavy. Such results were different from those observed in Beijing-Tianjin-Hebei where sulfate increased most quickly. Our results thus highlight that reduction of vehicular NO2 is likely a priority for air quality improvement in Nanjing. Back trajectory analysis showed the dominance of the local air mass and the one from Huanghai, yet the air mass originated from Bohai, and passed though Shandong and north of Jiangsu province could deliver highly-polluted air to Nanjing, as well.
1. Introduction
With the rapid economic growth and increasingly-emitted pollutants in China, aerosol pollution has become a serious problem recently [1]. Particulate matter emitted from human and natural sources causes atmospheric haze which results in light extinction and visibility degradation. In recent years, numerous large-scale haze events have occurred over broad areas of China, arousing worldwide attention [2]. Moreover, aerosol particles can jeopardize human health by entering the human body through the respiratory tract [3], influence the climate by absorbing and scattering the atmospheric radiation, and affect precipitation by acting as cloud condensation nuclei (CCN), etc. [4].
A vast number of studies have been conducted to investigate the aerosol properties in China and other areas, which show that the physicochemical characteristics of ambient aerosols could vary spatially and temporally, heavily dependent upon the emission sources, weather conditions, and atmospheric environments. Among various aerosol components, water-soluble ions and carbonaceous species are the main constituents, which altogether can take up ~80% of the total aerosol mass [5,6,7,8]. These species are also major contributors to the atmospheric light extinction. The light extinction characteristics of aerosol are closely related to its chemical composition, size distribution, mixing state, and hygroscopicity, etc. Currently, there are three main methods to quantify the aerosol light extinction: Mie theory, linear regression, and IMPPROVE (Interagency Monitoring of Protected Visual Environments) formula. The Mie calculation requires both particle number concentrations and size distributions of different species, which is often impractical. The linear regression needs to fit into a large amount of data, including both light extinction coefficients and mass concentrations of various components, in order to obtain the unit mass extinction coefficient for each individual component, and then the total light extinction. The IMPROVE formula is relatively simple, and is widely used around the world. Basically, it is an empirical equation derived based on the observational data of visibility and aerosol compositions of over 180 sites across the United States [9,10]. Although the parameterization was established based on US data, some previous investigations have showed its suitability in China [11,12,13,14].
In China, secondary ions (mainly sulfate, nitrate, and ammonium (SNA)) were found to contribute the most to atmospheric light extinction (40–60%), followed by organic aerosols (OA) (20–30%). Elemental carbon (EC) is a main substance for light absorption, but contributes <10% light extinction. However, the light extinction coefficients and contributions of different species can differ greatly [13,15,16,17,18]. For instance, Tao et al. [19] found the extinction coefficients from spring to winter were 243 Mm−1, 95 Mm−1, 473 Mm−1, and 469 Mm−1 in Guangzhou, China and contributions of various components changed seasonally: (NH4)2SO4 dominated in autumn (64%), NH4NO3 contributed most in winter (27%), while OM was the major contributor in summer (23%). Li et al. [11] showed that during the 2008 Beijing Olympic Games, SNA, OM, and EC contributed 81.7%, 8.4%, and 4.3% of the light extinction during low-visibility days (bottom 20%); while the SNA contribution was only 33.8% for the high-visibility days (top 20%), but OM and EC contributions increased to 30.7% and 15.7%, respectively. Deng et al. [14] found that the extinction coefficient of regional transported aerosols was 349 Mm−1, with (NH4)2SO4, NH4NO3, OM and EC contributing 33.3%, 21.8%, 31.9%, and 9.0% respectively, while the value of long-range transported aerosols was 286 Mm−1, with (NH4)2SO4, NH4NO3, OM, and EC contributing 40.0%, 18.2%, 29.2%, and 9.0%, respectively.
The Yangtze River Delta (YRD) region covers only 2.2% of the area of China, but contributes ~20% of the gross domestic product (GDP). Correspondingly, it is also an area with serious air pollution due to large energy consumption and industrial activity. Nanjing is an important megacity in the YRD region and the host city for the 2014 Youth Olympic Games. However, Nanjing is facing serious air pollution and the hazy days can reach over 200 days in a year [20]. Some earlier studies have investigated the aerosol properties in Nanjing, including size distribution [21], optical properties [22], water soluble ions [23], carbonaceous species [24], heavy metals [25], as well as the interplay between atmospheric particles with haze formation, etc. [26,27]. Nevertheless, aerosol chemistry studies are still lacking compared with other megacities, like Beijing, Shanghai, and Guangzhou. Relevant studies regarding the light extinction characteristics are particularly scarce [28,29,30]. This work characterized aerosol samples collected in the suburbs of Nanjing during 2014 with a focus on the light extinction properties, including: (1) the size distribution, seasonal, and day-night difference of the aerosol particles; (2) the light extinction and contributions of different aerosol components using the IMPROVE method; and (3) the characteristics of air masses under different pollution levels and with different origins, as well as their contributions to atmospheric light extinction.
2. Methodology
2.1. Aerosol Sampling
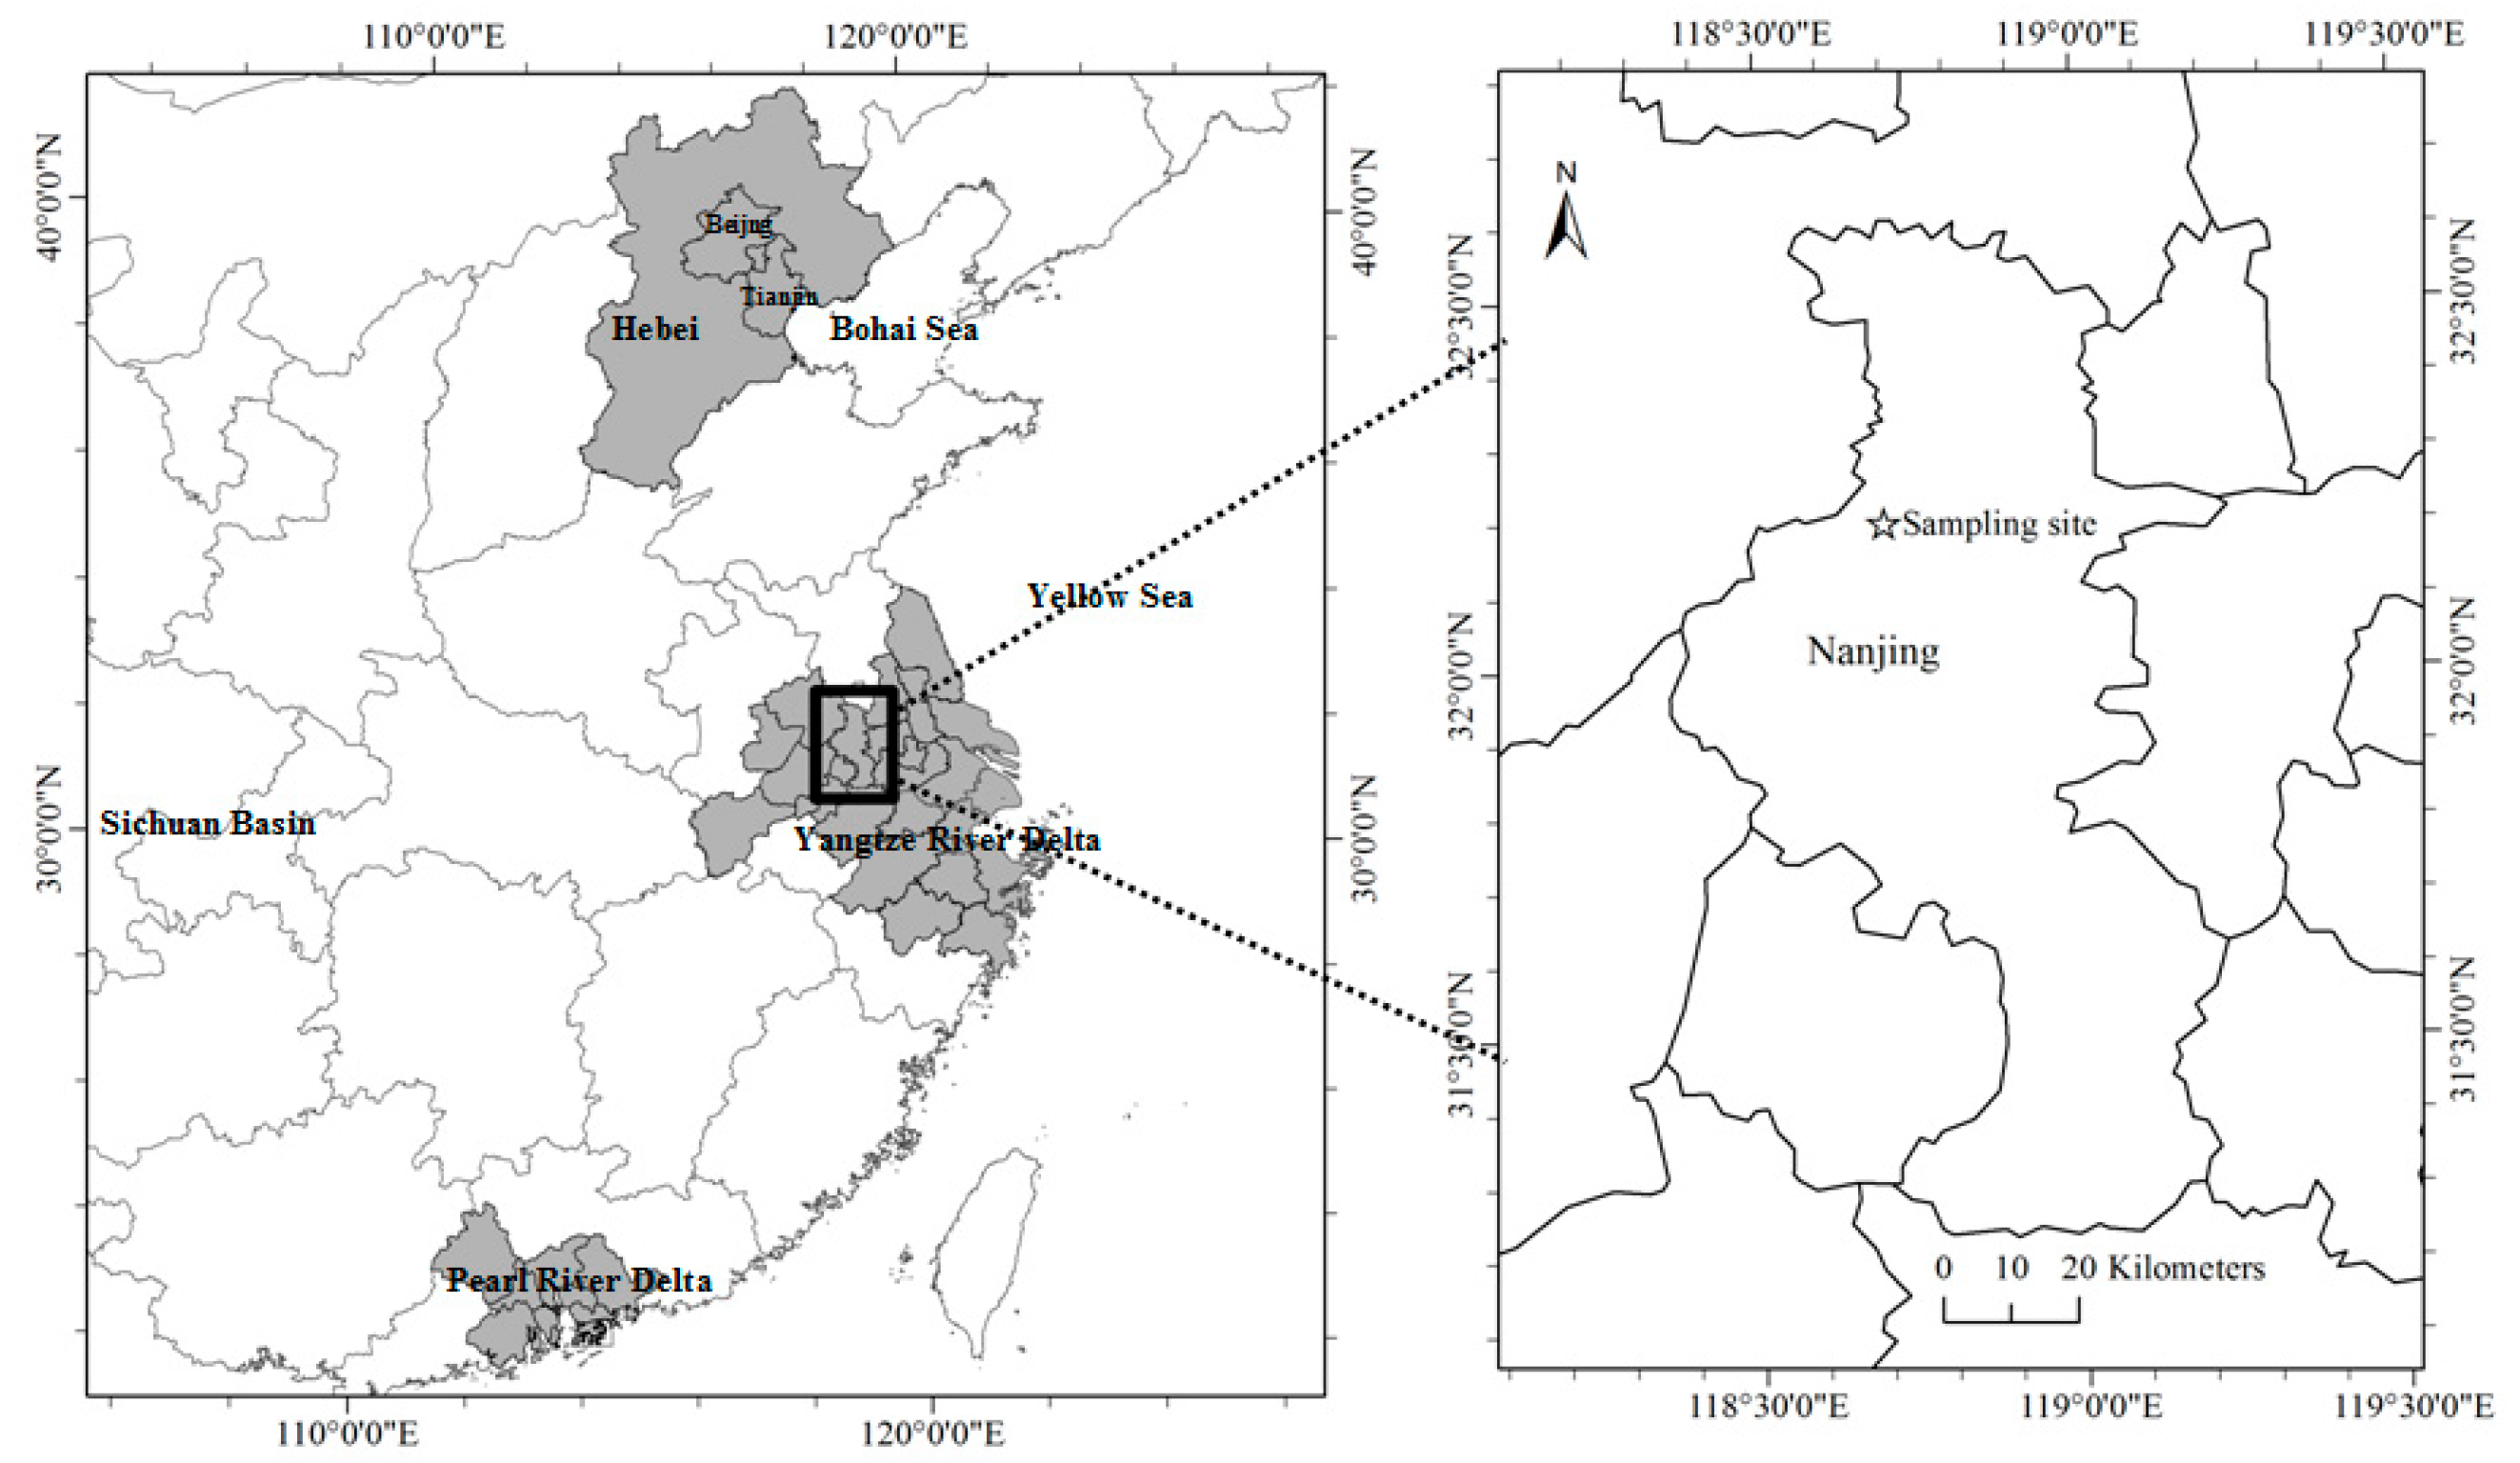
The sampling site was located in the Atmospheric Integrated Observation and Training Base of the China Meteorological Administration at the Nanjing University of Information Science and Technology, Pukou district, northern suburb of Nanjing City (altitude 22 m, 32°12′ N, 118°42′ W) (Figure 1). It is ~15 km away from the city center, with a highway ~1.5 km to the east, Nanjing Iron and Steel Plant ~3.5 km to the east, Nanjing Chemical Industry Zone ~10 km to the northeast, residence areas, villages, and farmland to the west/north and the low-altitude Longwang mountain to the south. The site is influenced by a mix of industry, traffic, residential and agricultural emissions simultaneously, representing the typical atmospheric environment of the suburb area of a megacity. Moreover, the sampling site was set on the side of a flat area surrounded by low-grassland with no tall buildings blocking the air masses.
Aerosol samples were collected using a mid-volume sampler (Laoshan Mountain Electronic Instrument Factory Co., Ltd., KC-120H, Qingdao, China). The instrument is designed based on inertial impaction. Under a certain flow, particles with a greater inertia hit the impactor, while ones with less inertia flow to the next impactor. As the orifice diameters decrease gradually, the flow rate increases accordingly and, finally, particles with different sizes are captured by different impactors. The sampler can classify the particles into four size ranges: <2.5 μm, 2.5–5 μm, 5–10 μm, and >10 μm. We can then obtain the mass concentrations of the total suspended particles (TSP), PM10, and PM2.5. The sampling flow rate is 100 L/min and can be self-adjusted automatically. The quartz filters (Pall Corp., Port Washington, NY, USA) were used for sampling and were baked at 500 °C for more than 5 h in a muffle furnace before use. After stabilization for 48 hours in a desiccator, the filters were weighed by an analytical balance (Ohaus Corp., DV215CD, Newark, NJ, USA, precision: 0.01 mg). Filters after sampling were weighed in the same way. Each value of mass was determined as an average of three measurements with a deviation <0.02 mg. The mass of collected particles was calculated as the mass of filter loaded with sampled particles subtracting the mass of blank filter. The filters were stored in the refrigerator maintained at −18 °C for further chemical analysis after weighing.
Aerosol samples were collected twice a week during January to November of 2014, one on weekdays (normally Wednesday) and another on weekends (normally Saturday). We collected both daytime and nighttime samples for each sampling day. The daytime sample was from 8:00 am until 8:00 pm, and the nighttime sample was collected from 8:00 pm to 8:00 am of the next day. The sampling schedule was irregularly interrupted at rainy/foggy days, or due to unexpected power failure and instrument malfunction. Finally, we obtained in total 66 sets of daytime samples and 46 sets of nighttime samples.
2.2. Chemical Analysis
The water-soluble ions were analyzed by ion chromatography (Dionex Corp., Sunnyvale, CA, USA). For each sample, a half filter was extracted in ionized water with 30 min of ultra-sonication and stabilized for 12 h, and then the solution was filtrated using a 0.22 µm filter (3M Deutschland GmbH, PES, Wuppertal, Nordrhein-Westfalen, Germany). The cations were analyzed by using an ICS3000 system with a Ion PacCS16 (5 × 250 mm) separation column, an Ion Pac CG16 (5 × 50 mm) guard column, a CSRS-4 mm suppressor, and a 33 mmol·L−1 methane sulfonic acid solution as eluent. The anions were measured by an ICS2000 system equipped with an Ion Pac (4 × 250 mm) separation column, an Ion Pac AG11-HC (4 × 50 mm) guard column, an ASRS-4mm suppressor, and a 10 mmol·L−1 KOH solution as eluent. The minimum detection limit of each ion was less than 0.01 μg·m−3.
A thermo/optical carbon analyzer (Atmoslytic Inc., DRI2001A, Calabasas, CA, USA) was used for measuring the organic carbon (OC) and EC concentrations based on the IMPROVE protocol. The filter was heated stepwise to 120 °C, 250 °C, 450 °C, and 550 °C in a pure He atmosphere to determine OC1, OC2, OC3, and OC4, respectively. Consequently, the filter was heated to 550 °C, 700 °C, and 800 °C in a 2% O2/98% He atmosphere to measure EC1, EC2, and EC3, respectively. The organics were converted to CO2 through catalytic oxidation, then reduced to methane (CH4), and were quantified by the flame ionization detector (FID). The coking effect during heating could convert a portion of OC into pyrolysis carbon (OCP) which was determined by 633 nm He-Ne laser. The OC is defined as OC = OC1 + OC2 + OC3 + OC4 + OCP, while the EC is equivalent to EC1 + EC2 + EC3-OCP. The detection limits for OC and EC are 0.45 μg·cm−2 and 0.06 μg·cm−2, respectively.
Strict quality controls have been performed during the IC and OC/EC measurements. For each batch of samples, 2–3 blank filters were treated in the same manner as for samples to determine the background values, and results for samples were all blank corrected in this work. Before sampling, two identical samplers were operated in parallel to confine the measurement uncertainty within 10% for each component. Standard solutions (Merck KGaA, Darmstadt, Hesse-Darmstadt, Germany) were used to calibrate the IC systems for each batch of measurements. The IC systems were also checked before and after the measurement on each day to maintain the analytical uncertainty at <5%, otherwise the calibration was re-done. The He/CH4 standard gas was used to calibrate the OC/EC analyzer to assure the variation of the standard’s peak area to be <5%, and the corresponding FID signal drift within ±3. Additionally, for every ten samples, one sample was randomly selected for a duplicate analysis to guarantee the analytical uncertainty remained at <5%, otherwise the analysis was re-done.
2.3. Data Analysis
2.3.1. IMPROVE Formula
The IMPROVE formula was first proposed in 1990, and was modified in 2007 by assuming the spherical form of aerosols and external mixing of different components [9,10]. The modified IMPROVE formula was used here, as follows:
where bap and bsp represent the absorption and scattering coefficients of aerosol particles, while bag and bsg correspond to gaseous species. bap and bsp can be further calculated below:
bext = bap + bsp + bag + bsg,
bap = 10 × [EC],
bsp = 2.2 × fS(RH) × [Small (NH4)2SO4] + 4.8 × fL(RH) × [Large(NH4)2SO4] + 2.4 × fS[RH] × [Small NH4NO3] + 5.1 × fL(RH) × [Large NH4NO3] + 2.8 × [Small OM] + 6.1 × [Large OM] + 1.7 × fss(RH) × [SS] + 1 × [FS] + 0.6[CM].
In the formula, (NH4)2SO4 = 1.37[SO42−], NH4NO3 = 1.29[NO3−], [OM](organic matter) = 1.8 × [OC]. The method splits (NH4)2SO4, NH4NO3 and OM into “large-mode” and “small-mode” particles as particles with different sizes have different mass scattering efficiencies. The separation is based on the log-normal mass size distributions with 0.2 µm (geometric standard deviation, σg of 2.2) for small-mode and 0.5 µm (σg of 1.5) for large-mode particles. The mass scattering coefficients were then calculated using Mie theory for large and small-mode particles, respectively. The fraction of large particles was calculated using a threshold concentration of 20 μg·m−3, as shown below:
[X]Large = [X]2Total/(20μg·m−3), [X]Total < 20 μg·m−3
[X]Large = [X]Total, [X]Total ≥ 20 μg·m−3
[X]Small = [X]Total − [X]Large
Here X refers to (NH4)2SO4, NH4NO3, and OM. In Equation (3), [SS](sea salt) = 1.8 × [Cl−], FS(fine soil) = 2.2[Al] + 2.49[Si] + 1.63[Ca] + 2.42[Fe] + 1.94[Ti]. Since the metal elements were not detected, FS was set to be 20 times the mass concentration of Ca2+ based on known soil composition [17]. CM(coarse mass) = PM10 − PM2.5. RH refers to relative humidity of atmosphere. fS(RH), fL(RH) and fss(RH) are hygroscopic growth factors [10]. Atmospheric light absorption by gases is caused mainly by NO2 gas, and bag = 161[NO2] [10]. bsg refers to the Rayleigh scattering of gas and is set to 10 here. The units of scattering and absorption coefficients are both Mm–1. The mass concentrations of (NH4)2SO4, NH4NO3, OC, EC, PM10, and PM2.5 are in μg·m−3. The unit of NO2 concentration is mg·m−3, and NO2 data was acquired from the Pukou air quality monitoring site of the Nanjing Environmental Protection Bureau.
2.3.2. Koschmieder’s Formula
The extinction coefficients can be measured directly using nephelometer, aethalometer, and photoacoustic spectrometer, etc. [31]. Since no direct measurement was conducted in this work, the extinction coefficient was estimated from visibility using the Koschmieder’s formula [32]:
where V refers to the horizontal visibility (km), bext-V refers to the extinction coefficient (Mm−1), ε refers to the contrast threshold of human vision (0.05 in this work). The atmospheric visibilities were observed by the forward scattering visibility meter (CAMA Environment Monitoring Co., Ltd., CJY-1A, Luoyang, China). The instrument assumes the atmosphere is homogenous and the extinction coefficient is solely governed by the scattering of atmospheric particles. In principle, the scattering intensity is proportional to the light extinction and independent of aerosol size distribution and concentrations when the forward scattering angle is in the range of 20°–50°. For this instrument, the emitter launches a beam of infrared light, and the receiver converges the forward atmospheric scattering light to the surface of a photoelectric sensor receiving at the angle of 35° relative to the emitted light. The atmospheric extinction coefficient can be obtained from the electrical signals which can be converted to the visibility value according to Koschmieder’s formula. When the visibility is 0.01–1.5 km, the measurement uncertainty is ±10%, and it is ±20% when the visibility is 1.5–50 km. In terms of the extinction coefficient, the error is about ±20% when it is less than 2000 Mm−1 and is about ±10% when it is more than 2000 Mm−1. In this work, the extinction coefficients were calculated by using this method and compared with those estimated from the IMPROVE method.
2.3.3. Backward Trajectory and Clustering Analysis
The backward trajectory and clustering analysis was used to investigate the air mass pathways and the influences of long-range and regional transportation on atmospheric pollution. The model HYSPLIT4 developed by NOAA (National Oceanic and Atmospheric Administration, Washington, DC, USA) was adopted to calculate the 72 h backward trajectory from 2:00 pm (6:00 am, UT) of each sampling day. Considering the wind field at 500 m altitude can better represent the mean flow characteristics of the boundary layer, this altitude was chosen in the simulation using the Global Data Assimilation System (GDAS) meteorological data with 1° resolution [33].
3. Results and Discussion
3.1. Chemical Characteristics of Atmospheric Aerosol
3.1.1. Size-Segregated Mass Concentrations
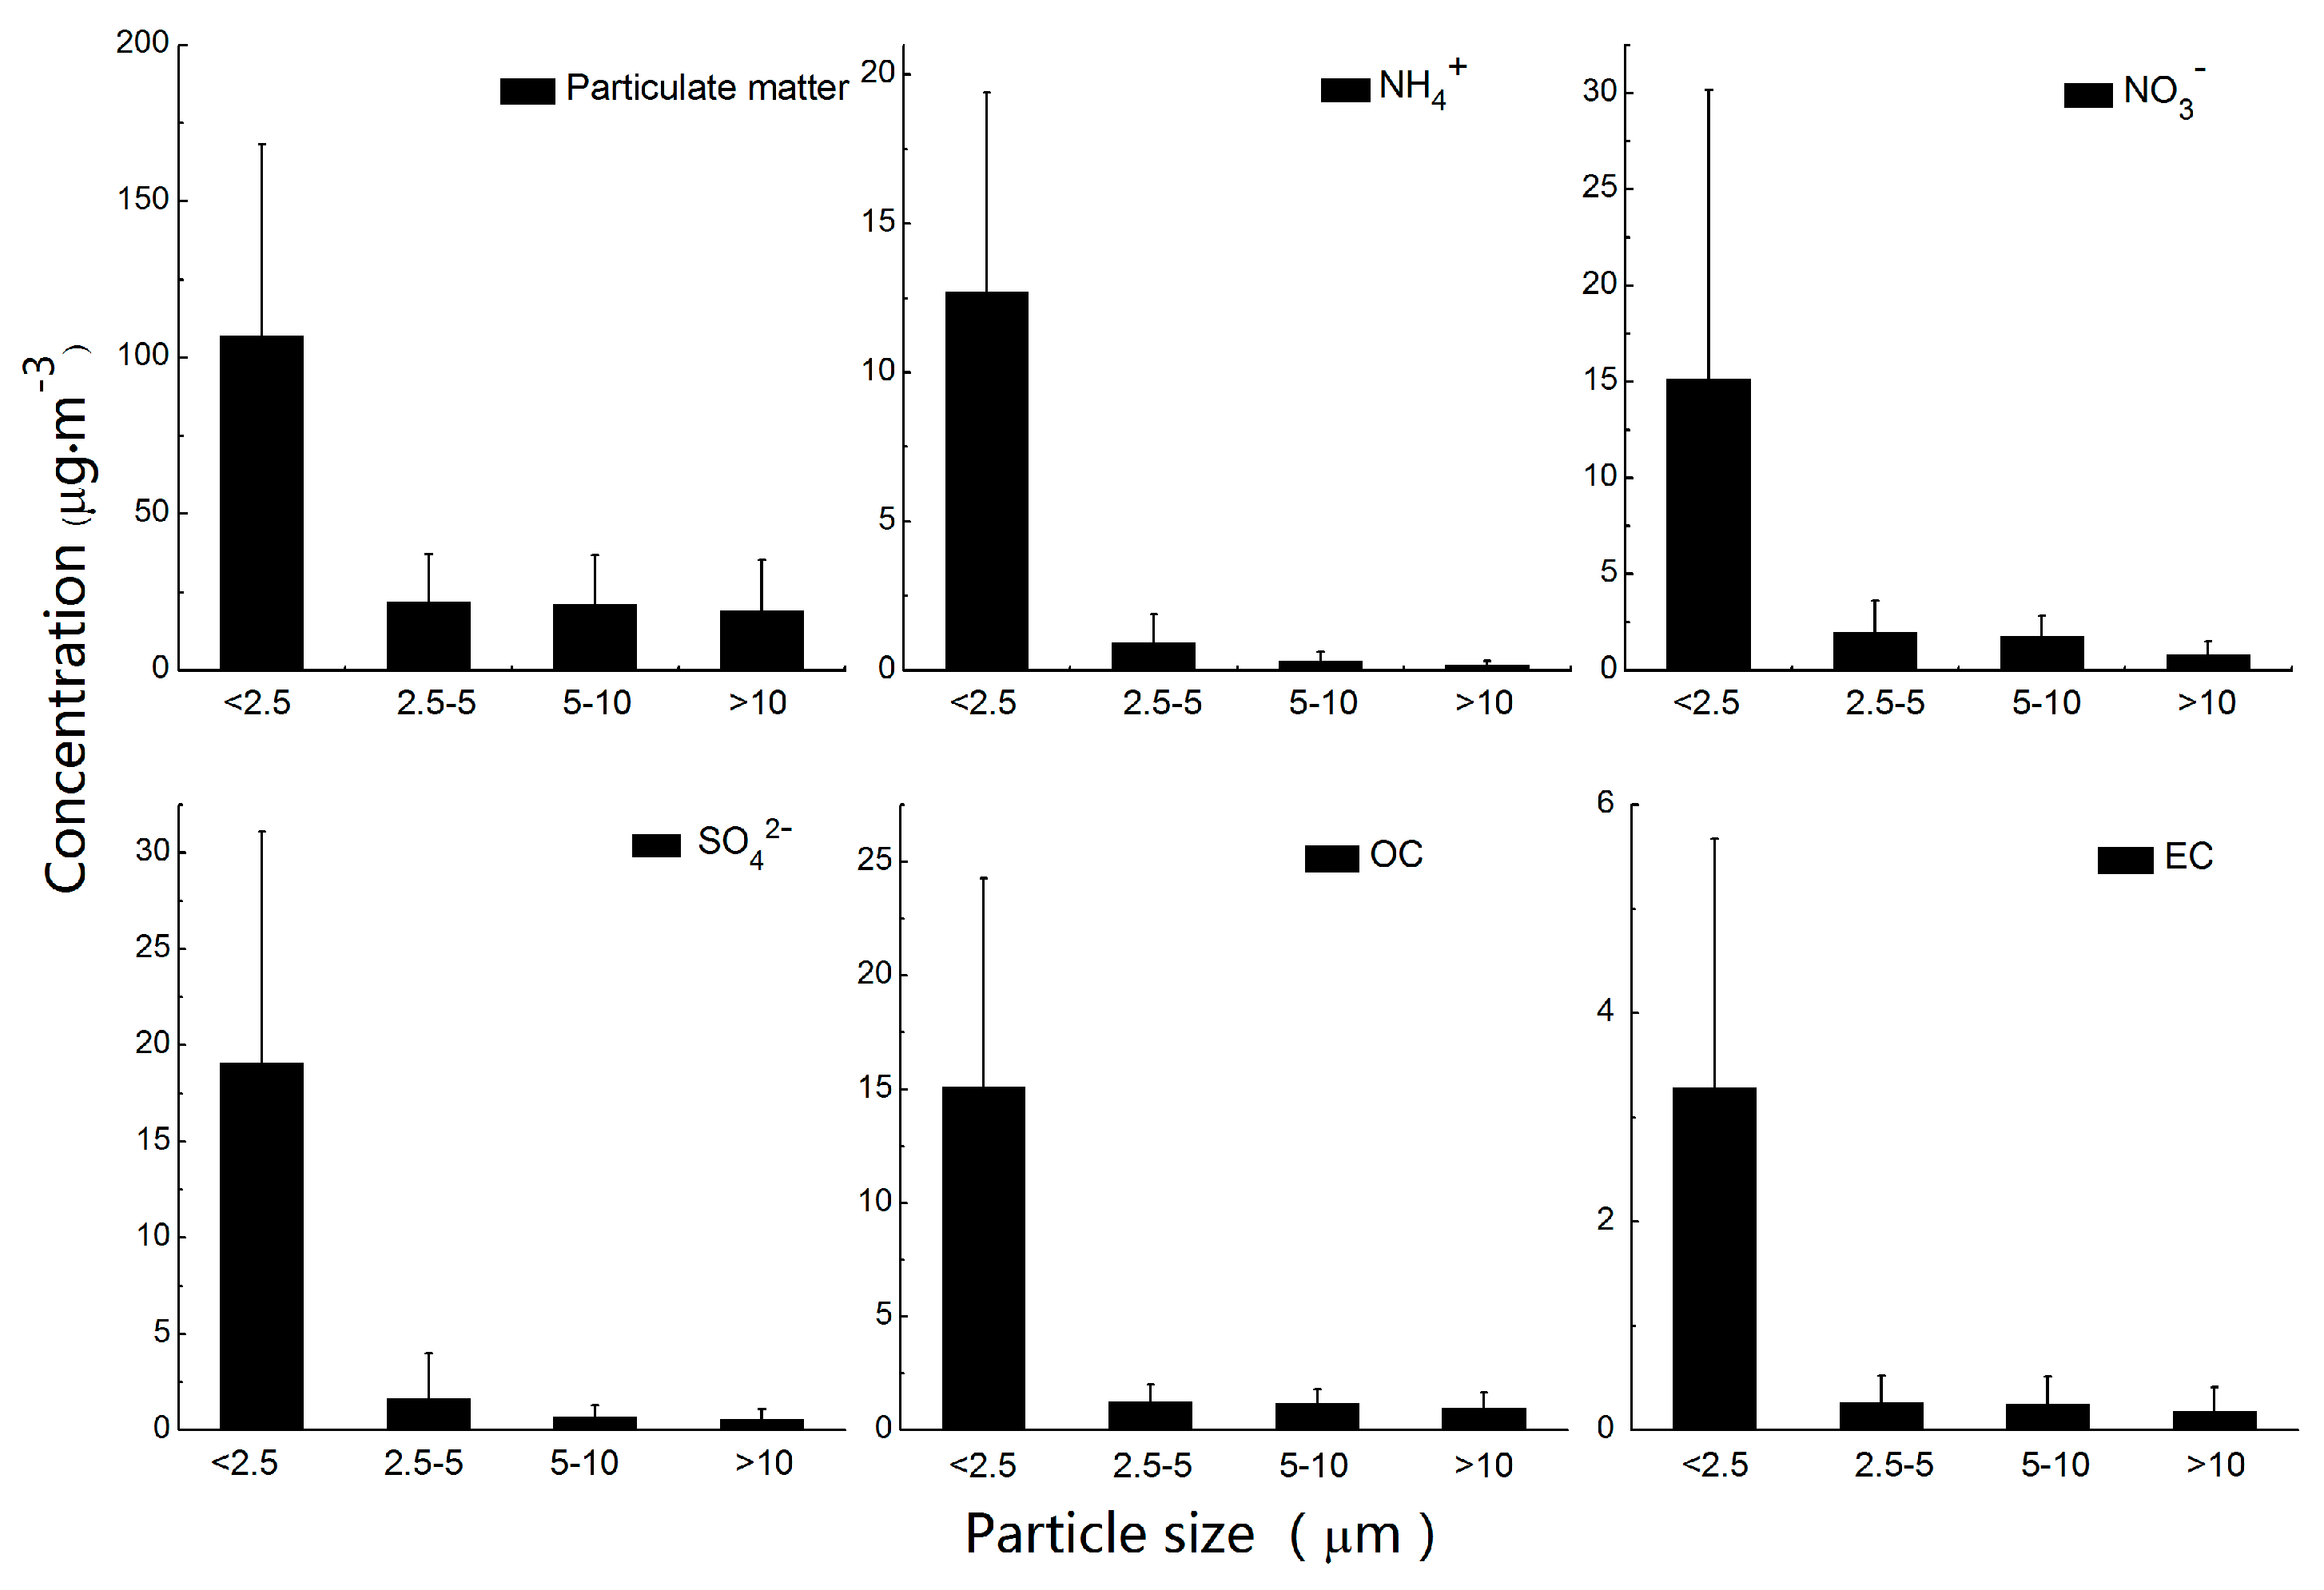
The mass concentrations of total aerosol particles and the major chemical components (SO42−, NO3−, NH4+, OC, and EC) at different size ranges are shown in Figure 2. PM2.5 could occupy 71.2% of the PM10 mass. This ratio is consistent with the results in Nanjing during 2013 [20], lower than the ratios of Guangzhou in summer and YRD during heavy haze periods [34,35], but higher than the values measured in Xia’men and Beijing [36,37]. Correspondingly, SO42−, NO3−, NH4+, OC, and EC in PM2.5 were 88.9%, 80.2%, 91.0%, 86.1%, and 86.4% of those in PM10, respectively, similar to the results observed in Beijing [38], Shanghai [39], Hong Kong [40], and Nanjing [41]. Since the scattering effect of particles with similar sizes as the wavelengths of visible light is strong, the fine particles mainly contributed to aerosol extinction. Our results highlight the importance to reduce the fine aerosol pollution in suburban Nanjing.
3.1.2. Seasonal Differences
Since PM2.5 dominated the aerosol population, we focus on PM2.5 and its chemical components here. Table 1 lists the average mass concentrations of PM2.5 and various species in four seasons (winter: January–February; spring: March–May; summer: June–August; autumn September–November), and Table 2 shows the mean daytime and nighttime meteorological parameters. The mass concentration of PM2.5 was highest in winter, following by summer and spring, and was lowest in autumn. Concentrations of most ionic species, OC, and EC reached their maximum in winter as well, in agreement with the seasonal changes previously observed in Nanjing [23], Peking [42], Hangzhou [43], Xi’an [44], and some other cities. This is due to winter typically having low temperatures, stagnant air, low boundary layer height, and less precipitation (Table 2), which are unfavorable for the dispersion and diffusion of air pollutants.
Typically, high temperature, intense atmospheric convection, and frequent precipitation in summer can significantly reduce the aerosol pollution and many cities indeed have the least aerosol pollution in summer [23,42,43,44]. Nanjing implemented a series of air quality control measures around the 2014 Youth Olympics Games period (16–28 August). Nevertheless, the mass concentration of PM2.5 in summer in this work appeared to be high. This is likely due to the summer samples not being specifically collected during the Youth Olympics Games period, and we also chose the sunny days with no precipitation for sampling. In such cases, high temperature and strong solar radiation may be in favor of secondary aerosol formation. Indeed, the concentration of SO42– reached its maximum in summer, even higher than that in winter.
We also estimated the concentration of secondary organic carbon (SOC) using the EC-tracer method which has been widely used in other studies [45]:
where (OC/EC)min was the minimum measured OC/EC ratio. The mass ratio SOC to OC was also the highest in summer [45], further strongly indicating the significant role of secondary formation.
SOC = OC-EC × (OC/EC)min.
The PM2.5 concentration in spring was slightly lower than that in summer while the concentration of K+ was highest in spring. As shown in Figure S1, the concentration of K+ in late May and early June was remarkably higher than it was during other periods, in accordance with the high concentration of OC. Combining with satellite images of fire points, this was related to straw burning. In the YRD region, this period is the farming season for rapeseed and wheat, and straw burning is frequent. Meanwhile, mass loadings of soil-derived Mg2+ and Ca2+ in spring were also high, likely due to that dry weather, low RH and high wind speed enhanced the suspension of soil dust. However, the concentration of Ca2+ was higher in autumn than that in spring, indicating that the dust due to construction activities can be an important source of Ca2+ as well [13]. During the Youth Olympics Games period, building construction was banned by the Nanjing government. Therefore, the restart of construction activities near the site could be the main cause of the burst of Ca2+ concentration in autumn. Nevertheless, generally speaking, the aerosol pollution in autumn is lightest and most species, such as SO42−, OC, and EC reached their minimums in response to the good atmospheric conditions for diffusion and dispersion.
3.1.3. Day–Night Differences
We chose the days with both daytime and nighttime samples and investigated the day-night variations of PM2.5 and its main components, as shown in Figure 3. Except for SO42–, mass concentrations of PM2.5 and other components all showed on average higher values during nighttime than those during daytime. This is consistent with results during spring of 2002 in Nanjing by Niu et al. [46]. There are many factors influencing the day-night variations, including emission sources and deposition, formation of secondary species, variability of meteorological conditions, and so on. Although the anthropogenic emissions may be significantly reduced during nighttime, the boundary layer height at night is typically low and the wind speed is low (Table 2), which limits the diffusion of air pollutants and leads to a rise in the concentrations. Moreover, the stagnant meteorological conditions during nighttime are unfavorable to the dry deposition of fine particles, especially those in accumulation mode [47]. As a result, the concentration of primary EC during nighttime was 1.5 times what it was during daytime.
The enhancements of secondary components were relatively small: concentrations of NH4+ and OC at night were 20% higher than those during daytime, and the nighttime concentration of SO42− was even less than that during daytime, especially in summer (Figure S2). This result reflects a role of secondary production of sulfate due to photochemical reactions during daytime. However, another secondary component NO3− showed significant enhancement during nighttime, which was more likely influenced by its volatility. Wang et al. [48] found a similar trend of NO3− in the YRD region previously. Daytime high temperature can result in significant evaporation/dissociation of NH4NO3 while, in turn, nighttime low temperature and high RH can promote the gas-to-particle partitioning of nitrate and/or the heterogeneous formation of NH4NO3 via N2O5 hydrolysis [49].
3.2. Light Extinction Estimated by the IMPROVE Formula
3.2.1. Reconstruction of PM2.5 Mass
The mass concentration of PM2.5 is reconstructed based on the IMPROVE formula. Calculation of the equivalent molar ratios of SO42−, NO3−, and NH4+ shows that the NH4+ is in excess and can adequately neutralize SO42− and NO3− most of the time (Figure S3). In the IMPROVE formula, the calculation of mass concentrations of (NH4)2SO4 and NH4NO3 is, thus, reliable. The OM/OC ratio is largely influenced by emission sources, etc., and the available values range from 1.4–2.2 [11,50]. In this work, we chose 1.8 as the conversion factor by considering previous values, especially those from Nanjing [15,18,51]. Apart from the ocean source, coal combustion may emit a certain amount of Cl− as well, and the IMPROVE formula may overestimate the contribution of sea salt. However, since Nanjing is far away from the ocean and the Cl− concentration was rather low, it is expected to insignificantly affect the mass reconstruction.
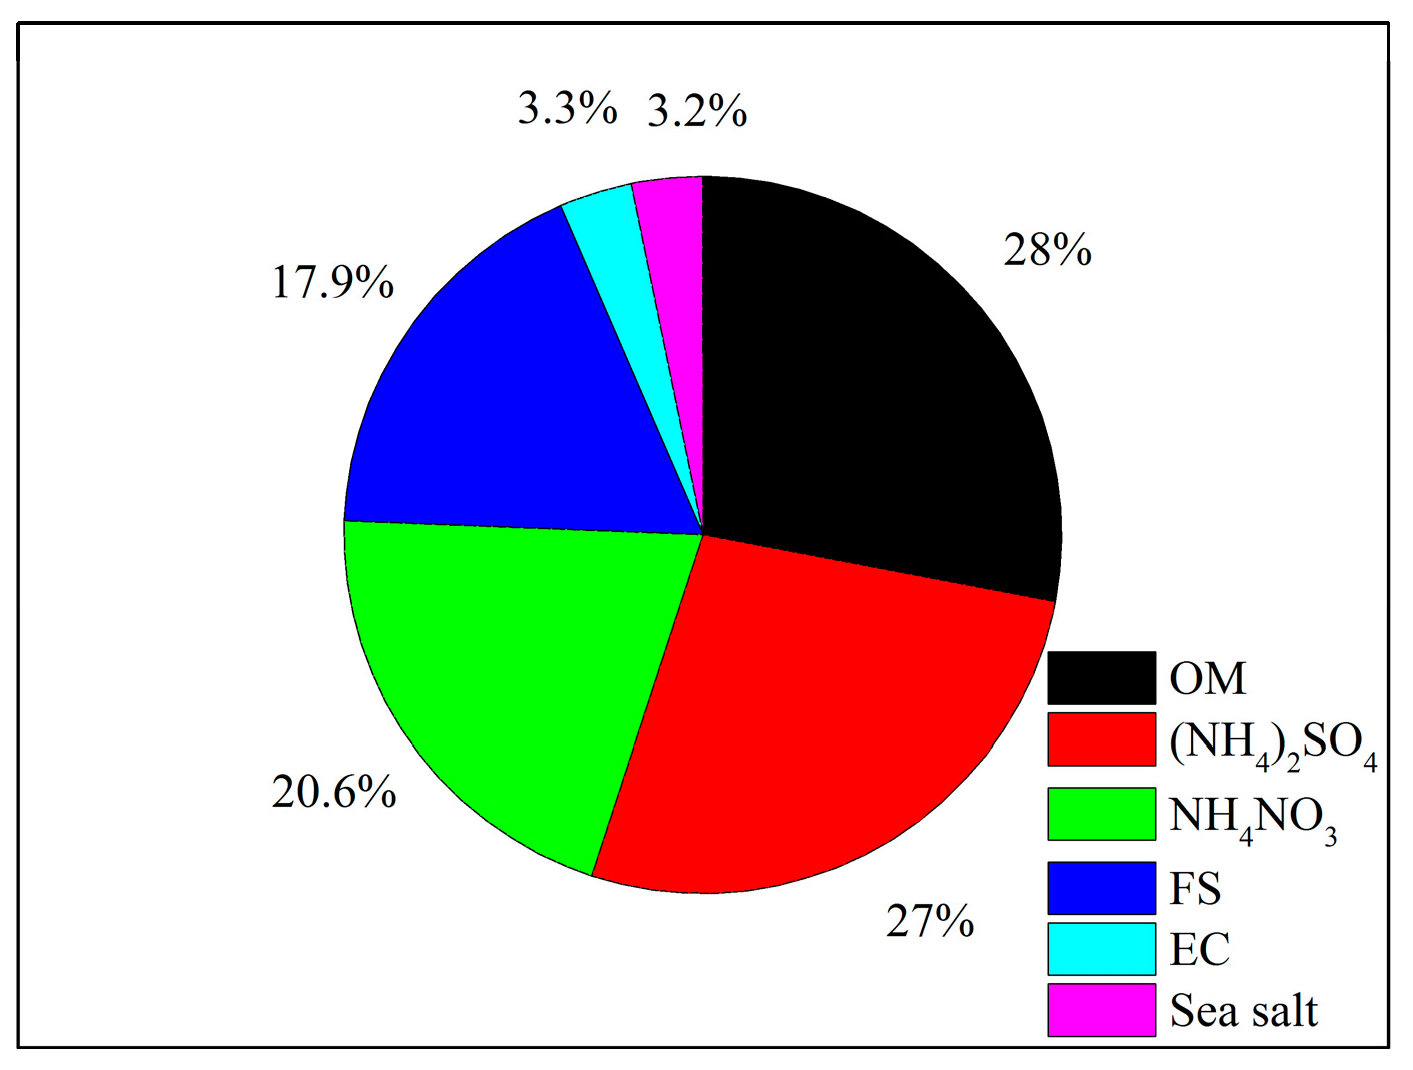
On average, the sum of mass concentrations of different components can reconstruct 93.9% of the total PM2.5 mass, illustrating that the IMPROVE formula can account for the majority of PM2.5 species in Nanjing. The mass contributions of different components are shown in Figure 4. The main species, OM, (NH4)2SO4, and NH4NO3, together occupied 75.6% of the total PM2.5 mass. In addition, contribution from FS (20 times of Ca2+) can reach as much as 17.9%. Yang et al. [8] pointed out that in the continental cities, the soil dust contribution was about 10%. Li et al. [20] used Fe as a soil indicator and estimated the soil dust contribution was about 17% in Nanjing aerosols. Our result also demonstrates the significance of soil-derived aerosols, but more direct and accurate measurements on the elements are necessary. Contributions of SS and EC were rather low, and both occupied ~3% of the total PM2.5 mass.
3.2.2. Estimation of Extinction Coefficients
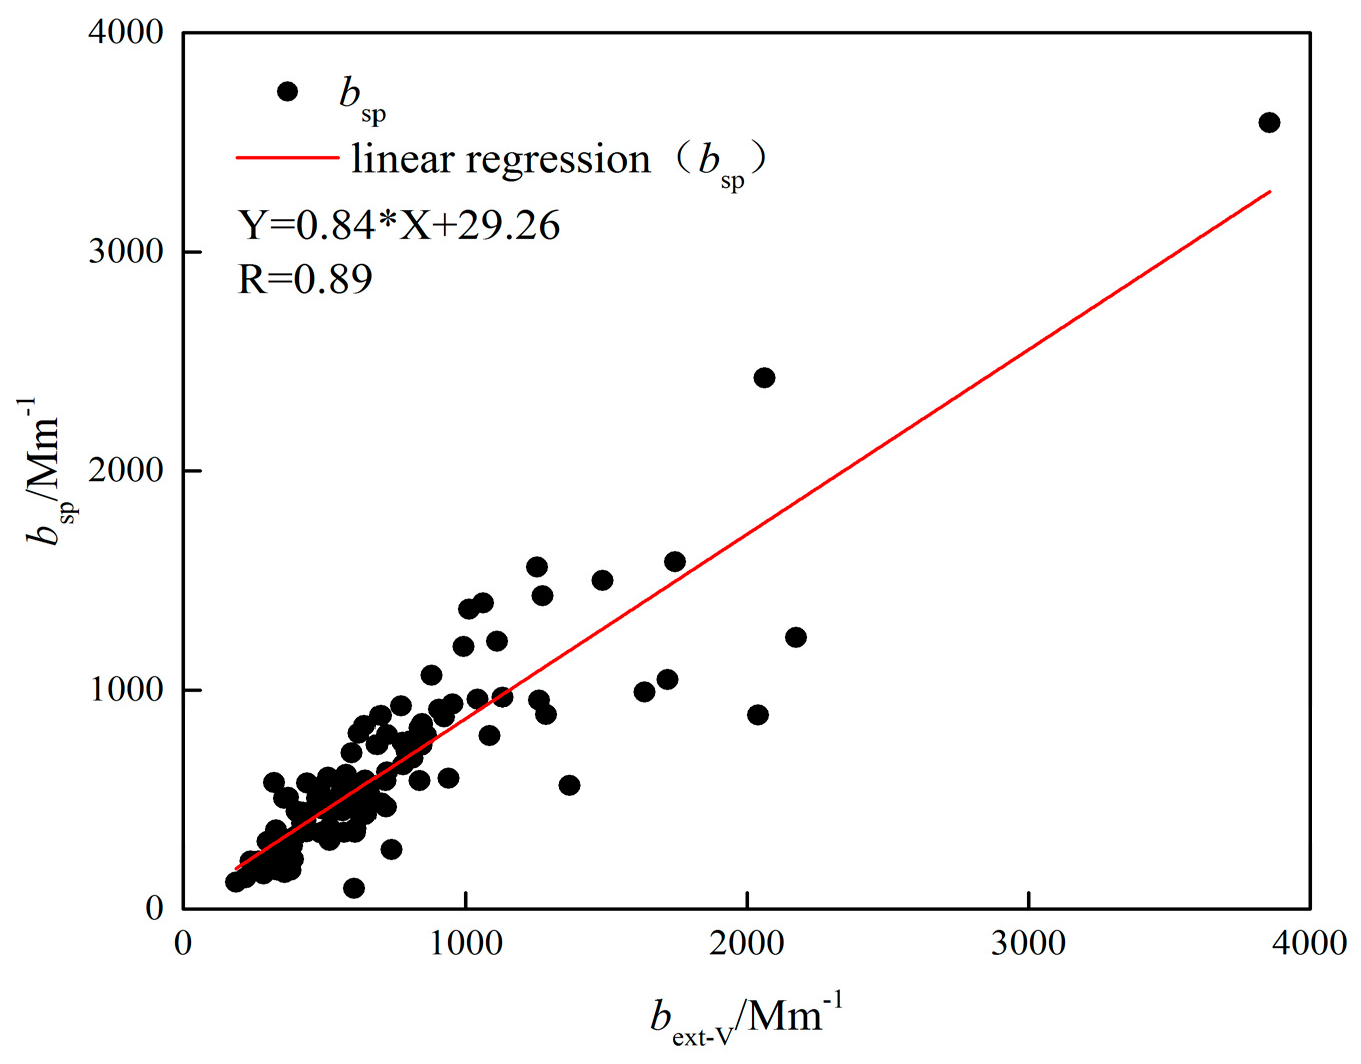
The IMPROVE formula was used for further calculation of the light extinction coefficients and compared with the extinction coefficients of bext-V calculated from the visibility. As the bext-V obtained by the forward scattering visibility meter actually only considered the scattering of aerosol particles, the particle scattering coefficient bsp from the IMPROVE formula was compared with bext-V, and the results are shown in Figure 5. The average values of bsp and bext-V were 642.4 Mm−1 and 731.5 Mm−1, respectively, thus, the IMPROVE formula underestimated the aerosol extinction by about 12.2%, but the correlation between them was very tight (R = 0.89), indicating that the IMPROVE formula could reflect the aerosol scattering reasonably well. Nevertheless, the deviations may be significantly affected by the measurement error of the extinction coefficient calculated from the forward scattering visibility meter. The other possible influencing factors are: (1) the atmospheric pollution in China is much worse than that in the US and the extinction coefficients of different components are likely low; (2) the water uptake by the organic matter is not explicitly included; and (3) influences of coarse particles were not considered as well [52]. Further studies should be conducted in order to obtain the extinction coefficients and hygroscopic growth factors that are especially suitable for Nanjing in order to better describe the light extinction characteristics of aerosol particles.
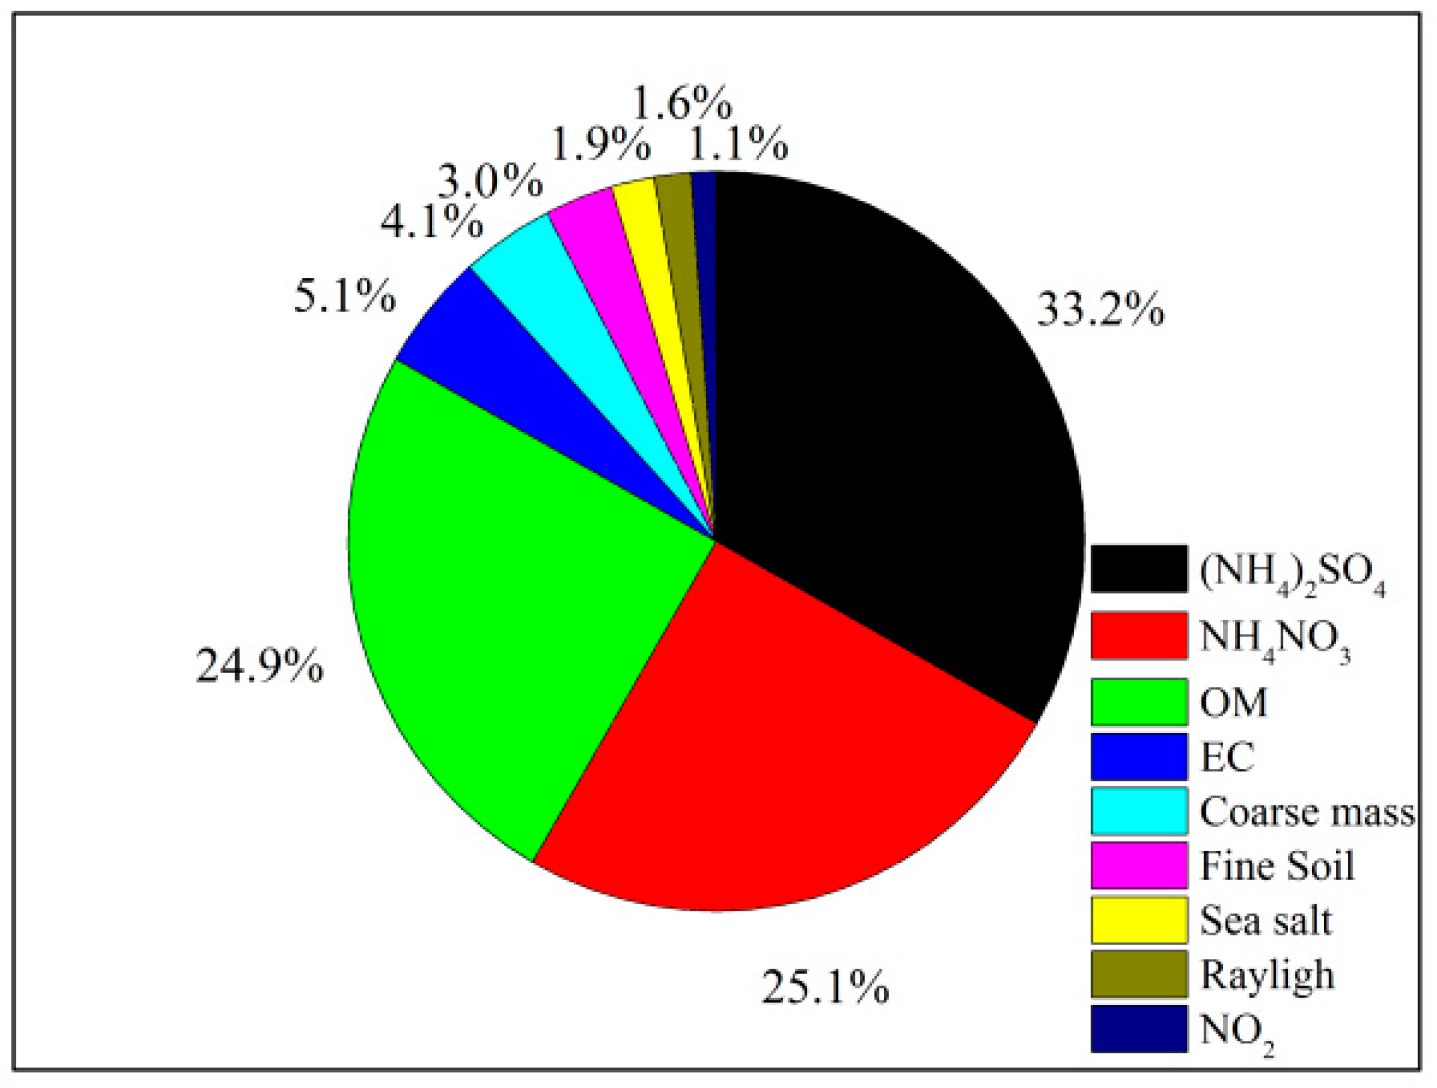
Based on the IMPROVE estimations, contributions of different components to the total light extinction is shown in Figure 6. It can be seen that the light extinction in Nanjing was mainly contributed by aerosol particles while the gases showed very minor contribution (2.7%). The main aerosol species for light extinction were (NH4)2SO4, NH4NO3, and OM, contributing 33.2%, 25.1%, and 24.9%, respectively. Compared with their corresponding mass contributions in PM2.5, the contribution of SNA to light extinction increased significantly, which was related to the significant water uptake by the SNA while OM’s contribution decreased since IMPROVE formula does not account for its hygroscopic growth. Among other components, EC contributed 5.1% while the rest of the species contributed a rather small amount. The total light extinction contribution of SNA was 58.3%. As in this suburban area, NO2 from vehicles and SO2 from coal burning are likely major precursors to the formation of SNA, and the results underscore the importance to reduce such emissions.
3.3. Variations of Chemical and Light Extinction Characteristics under Different Circumstances
3.3.1. Influences of Different Pollution Levels
Haze is the direct consequence caused by light extinction. According to The Meteorological Industry Standard of the People’s Republic of China—Observation and Forecasting levels of Haze (QX/T 113-2010) issued on 2010, when the visibility is less than 10 km and the RH is below 80%, it is defined as haze; when the RH is between 80% and 95% and PM2.5 is above 75 μg·m−3, it is also defined as haze, otherwise it is fog. In terms of the visibility, haze can be divided into four levels, namely, slightly, mild, moderate, and severe. To avoid the influence of radiation fog and the temperature inversion near the ground, we chose the visibility and RH values at 2:00 pm, and obtained the daily concentration by averaging the daytime and nighttime samples of the same day. If the samples were collected only in the daytime or nighttime, that data was regarded as the daily average. In total, we analyzed samples for 68 days. Huang et al. [53,54] classified the haze in the YRD region into three categories: secondary pollution, dust influence and straw combustion. According to the Yearbook of Chinese Meteorological Disaster (2014), we did not collect samples during dust-influenced days. Based on the concentrations of the biomass burning tracer K+ and the satellite image of fire points (Figure S4), 28 May, 30 May, and 7 June are typical straw combustion days and were thus removed in the following analysis to focus on the aerosol variations due to secondary pollution. Finally, we identified 47 hazy days and 18 non-haze days, and the occurrence rate of haze was 72%. The classification of hazy days, mass concentrations of various species and the meteorological conditions are shown in Table 3.
Obviously, the aerosol pollution during non-haze days are not serious, with an average concentration of PM2.5 of 69.8 μg·m−3, meeting the second-grade of Chinese National air quality standard (75 μg·m−3). The mass concentrations of OC and SO42− were close to each other and together they contributed significantly to the total PM2.5 mass. With the increase of haze pollution levels, the mass concentrations of total aerosols and individual components all increased, and the PM2.5 mass loading reached a maximum of 383.6 μg·m−3 in a very hazy day. Among different species, NO3− concentration increased most significantly, which was 12 times that of non-haze days. SO42− ranked second with an increase of 7.5 times. OC and EC increased relatively slowly, with five times and 4.5 times increases, respectively. The results show that the secondary inorganic species increased more rapidly during haze. Previous study shows that the carbonaceous aerosols may dominate in the initial stage of haze, while secondary species can form quickly under high RH [55]. Severe haze events are often accompanied by slow wind, shallow boundary layer height, and high RH. The stagnant atmospheric conditions are beneficial to the accumulation of pollutants while the high RH facilitates the formation of SNA and subsequent hygroscopic growth. Nevertheless, in this work, the wind speed, boundary layer height, and RH did not vary linearly with the haze pollution levels. This is likely due to the number of days with severe haze pollution used for analysis being small, and the influences of weather conditions and regional/long-range transported aerosols. It should be noted that our observation showed that NO3− increased more rapidly during haze episodes than that of SO42−. This result is in agreement with those conducted in Nanjing by Zhang et al. [56], and in Lin’an, a background city of the YRD region by Shen et al. [57], but is different from the sharp increase of SO42− contribution to PM2.5 mass during haze pollution in the Beijing-Tianjin-Hebei region. Our findings clearly point out the significantly-different haze formation mechanisms and governing factors in different regions.
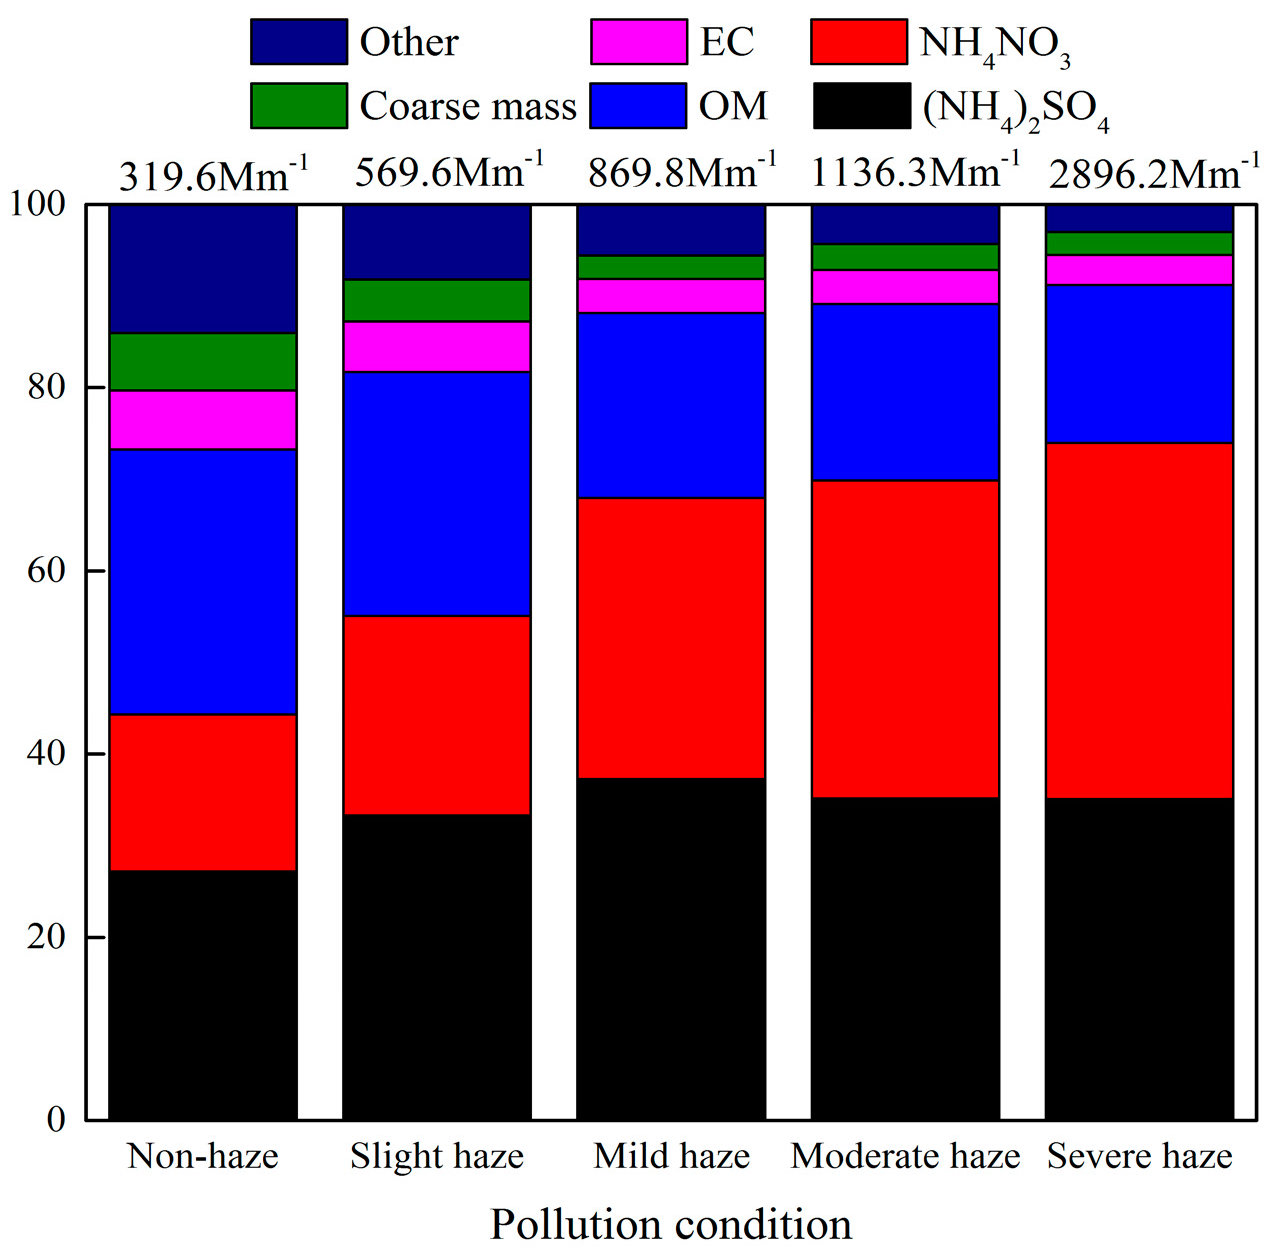
Furthermore, we used the IMPROVE formula to calculate the total light extinction and contributions of individual components under different haze pollution levels, as shown in Figure 7. From the figure, during non-haze days, OM contributed the most (29.0%) to the light extinction due to its relatively high mass contribution, (NH4)2SO4 ranked second (27.1%), following by NH4NO3 (17.1%). With the increase of haze pollution levels, the contribution of OM gradually decreased, while that of SNA, especially NH4NO3 increased quickly and amounted for 38.9% in the severe hazy days, dominating over that of (NH4)2SO4. In line with the rapid increase of NO3− mass concentration (Table 3), our results suggest that Nanjing may need to carry out strict control measures on vehicle emissions, such as a limit on the use of heavy-duty tracks, etc., as vehicle-emitted NO2 is the most important precursor for nitrate formation.
3.3.2. Influences of Different Air Masses
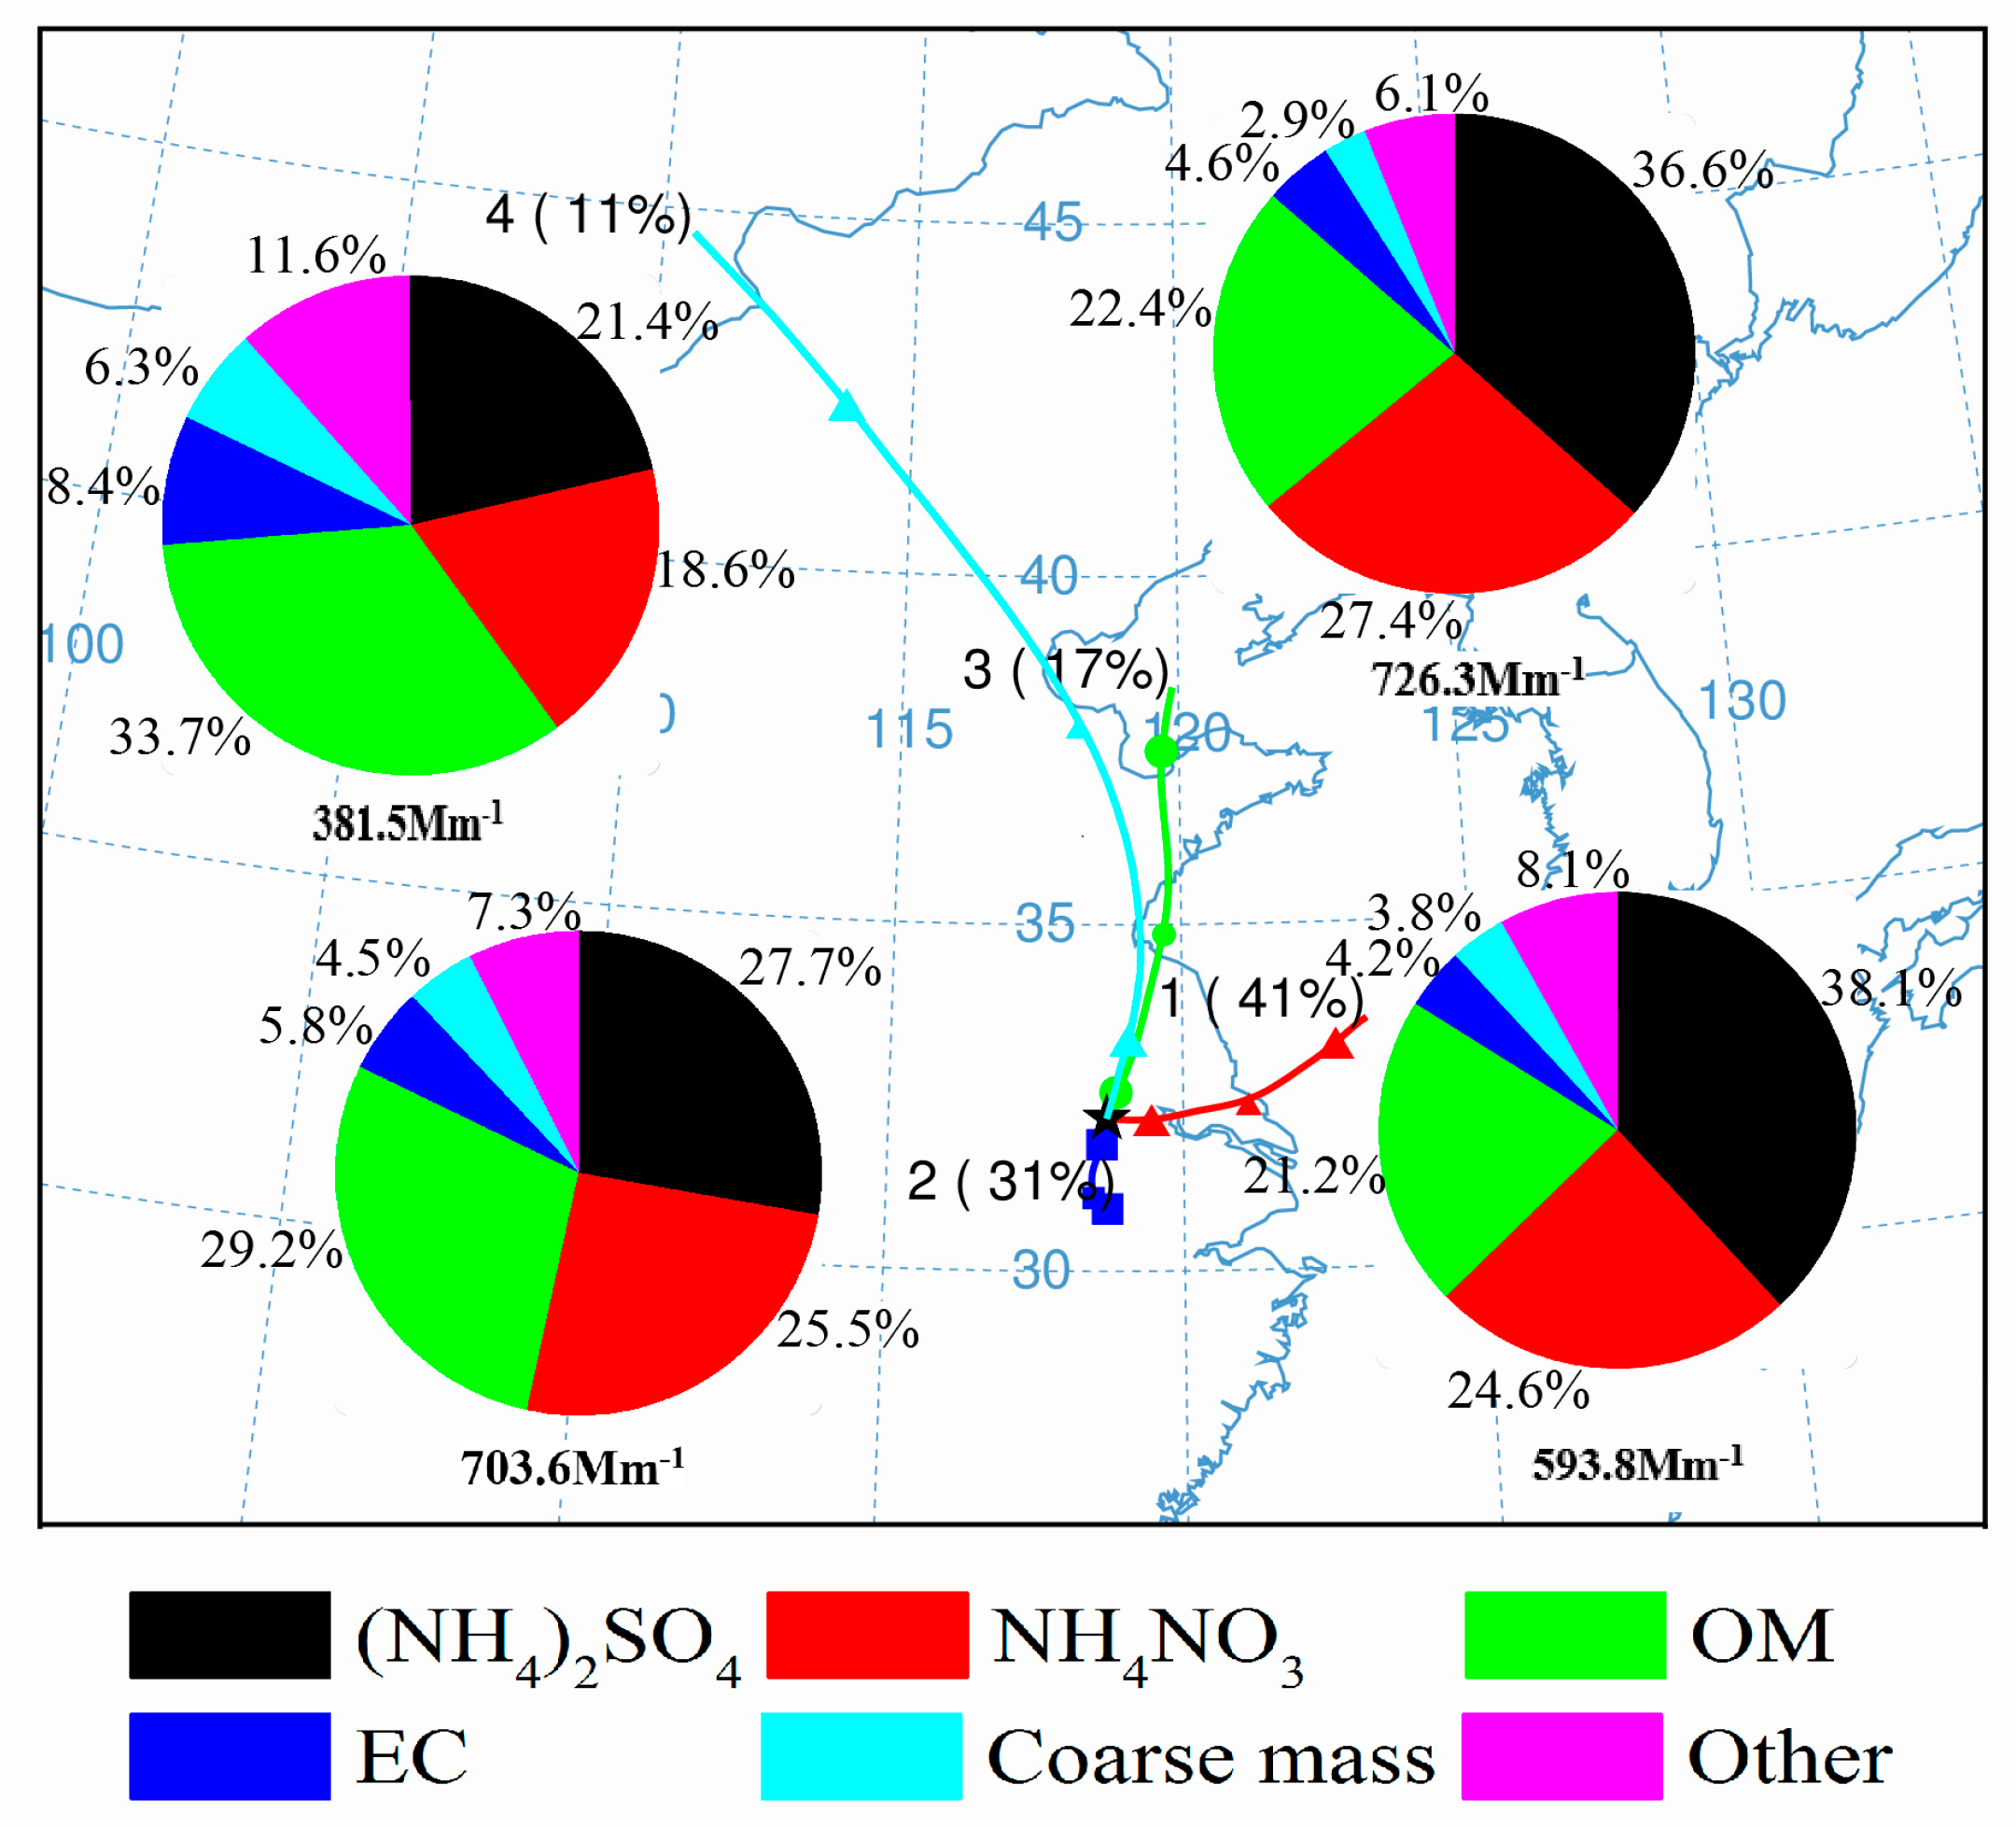
The aerosol pollution is not only influenced by the local emissions but also the long-range or regionally transported pollutants. The air parcels arrived at the sampling site can be very different due to their different origins and the pollutants they intercept along with their trajectories. As such, it is valuable to understand the potential source areas and transport pathways by investigating the interplay between different air mass trajectories and the aerosol characteristics. Based on the clustering analysis of HYSPLIT4, the air masses reached the site can be classified into four clusters, and their corresponding aerosol pollution levels and light extinction characteristics are shown in Table 4 and Figure 8, respectively. Among the four clusters, air mass originated from Eastern Huanghai (Type 1) occupied the largest fraction of all trajectories (41%) and were typically with high RH. This is consistent with the main wind direction in the northern suburb of Nanjing: east wind (Figure S5). Type 2 (31%) refers to the air mass close to the sampling location with different directions and short trajectories, which represents the local/regional emissions. Type 3 (17%) and type 4 (11%) refer to the air masses originating from Bohai and northwest inland China.
All four of these air masses can cause haze pollution, but the degrees and frequencies differed. According to Table 4, type 2 and type 3 both include heavy aerosol pollutions. The occurrence rate of haze in type 2 was as much as 84.2% and the corresponding boundary layer height was also the lowest. Type 3 included a severe haze event. On average, the PM2.5 concentrations of both type 2 and type 3 were close to 120 μg·m−3. The SO42− concentration was a bit higher in type 3 and concentrations of OC and EC were higher in type 2. Air masses in type 3 travelled through Shandong Peninsula and Northern Jiangsu Province, which may intercept heavy pollution. Type 2 air mass was mostly local, indicating severe local emissions, such as various combustion sources, like straw burning in and close to Nanjing, as it had relatively high OC and EC contents. The pollution in air mass type 1 was relatively light, likely due to it originating from clean marine air, while the concentration of SO42− in type 1 was on par with that in type 2, probably due to it passing through some developed cities where SO2 was abundant. Air mass type 4 started from the relatively clean northwest region, and the fraction of haze days was only 37.5% and they were all slightly hazy days. Its trajectory was the longest, and the mass concentration of PM2.5 was the lowest with especially much lower SNA concentrations. Only the concentrations of OC and EC in type 4 were slightly larger than those of type 1, likely because of the influence of straw combustion, etc.
Based on the IMPROVE formula, the extinction coefficient of air mass type 1 was 593.8 Mm−1, among which (NH4)2SO4 contributed the most (38.1%) and OM contributed 21.2%. The extinction coefficients in type 2 and type 3 were rather high, with OM and SNA as the most significant contributors, respectively. Type 4 has the least light extinction coefficient of 381.5 Mm−1, with OM contributing 33.7% and a relatively higher contribution from EC (8.4%) than it in other air masses. In summary, the light extinction by OM in the local air mass was significant, while the light extinctions of air masses from Huanghai and Bohai were mainly influenced by SNA; the northwest inland air mass was the clearest with obvious decrease of SNA contribution, yet the contributions of carbonaceous aerosols increased.
4. Conclusions
- PM2.5 dominated the aerosol pollution, with its highest mass concentration in winter, followed by summer, spring, and autumn. Concentrations of most chemical components were highest in winter too, except that the highest SO42− concentration occurred in summer, K+ and Mg2+ peaked in spring while Ca2+ reached its maximum in autumn. Mass concentrations of PM2.5 and most major species were higher during nighttime than daytime due to unfavorable conditions for pollutant diffusion. For NO3−, its loading was much lower during daytime, owing to its semi-volatile behavior and/or possible nocturnal heterogeneous production. However, SO42− concentration was higher during daytime, indicating the significant photochemical production.
- The measured species can reconstruct the total PM2.5 mass well, and OM, (NH4)2SO4, and NH4NO3 comprised the majority of PM2.5 (75.6%) with another significant component of FS contributing ~18%, and two minor components of SS and EC both occupying ~3%. The IMPROVE formula could estimate the aerosol light extinction reasonably well, with (NH4)2SO4, NH4NO3, and OM contributing 33.2%, 25.1%, and 24.9%, respectively. The light extinction was dominated by the SNA, indicating a significant role of secondary ions in visibility degradation.
- Mass concentrations of PM2.5 and all species increased gradually with the increase of haze pollution levels. The increase of SNA was particularly remarkable, and NO3− appeared to arise most rapidly among all species. Regarding the light extinction, the contribution from OM continuously decreased, while SNA, in particular nitrate contribution, increased with the increase of pollution levels, indicating a significant role of secondary species in haze formation and also underscoring the priority of reduction of vehicular NO2 emissions in Nanjing.
- Four clusters of air masses were identified, with differing chemical and light extinction characteristics. The local air mass and air mass originated from Bohai, but travelled through Shandong Province and north of Jiangsu Province appeared to be heavily polluted. The local air mass had high mass loadings of OC and EC and, correspondingly with OM, contributing most to the light extinction. The air mass from Bohai was contributed mainly by the SNA in terms of both mass concentration and light extinction. The air parcel from Huanghai was relatively clean, but with significant light extinction contributed by SO42−. The air mass starting from the northwest was the cleanest and clearest, and carbonaceous aerosols seemed to contribute most to its light extinction.
Supplementary Materials
The following are available online at www.mdpi.com/2073-4433/8/8/149/s1, Figure S1: Temporal variations of mass concentrations of aerosols and main chemical components in PM2.5. Figure S2: Day-night variations of PM2.5 and main chemical components in four seasons. Figure S3: Correlation analysis of molar concentrations of SO42-, NO3- and NH4+. Figure S4: Satellite images of fire points during typical biomass burning episodes. (a) 5.28–5.31; (b) 6.6–6.8. (https://firms.modaps.eosdis.nasa.gov/firemap/). Figure S5: Wind rose map from January to November 2014 in suburban Nanjing.
Acknowledgments
This work was supported by Natural Science Foundation of Jiangsu Province of China (BK20130998), National Natural Science Foundation of China (grant nos. 91544220, 41501197, and 41301581), and the Open Foundation of Hebei Key Laboratory of Meteorology and Ecological Environment (Z201607H). We gratefully acknowledge the NOAA Air Resources Laboratory (ARL) for the provision of the HYSPLIT4 transport and dispersion model. We appreciate Lin Shaolong for the assistance of data analysis and illustration of figures. We are grateful to Zhu Bin, An Junlin, Wang Honglei, Zhang Hai’ou, Kong Chunxia, and a few students for the guidance and help regarding the sample collection and laboratory analysis.
Author Contributions
Dan Wu conceived the idea; Dan Wu and Xinlei Ge wrote the manuscript; Dan Wu, Fan Zhang and Junrong Xia performed the aerosol sampling and data analysis; Dan Wu, Fan Zhang and Fengying Li performed the laboratory analysis; Fan Zhang and Meng Yang drawn the figures; Gang Liu provide valuable comments and suggestions for the development of the manuscript.
Conflicts of Interest
The authors declare no conflict of interest. The founding sponsors had no role in the design of the study; in the collection, analyses, or interpretation of data; in the writing of the manuscript, and in the decision to publish the results.
References
- Zhang, Y.L.; Cao, F. Fine particulate matter (PM2.5) in China at a city level. Sci. Rep. 2015, 5, 14884. [Google Scholar] [CrossRef] [PubMed]
- Huang, R.J.; Zhang, Y.; Bozzetti, C.; Ho, K.F.; Cao, J.; Han, Y.M.; Daellenbach, K.; Slowik, J.; Platt, S.; Canonaco, F.; et al. High secondary aerosol contribution to particulate pollution during haze events in China. Nature 2014, 514, 218–222. [Google Scholar] [CrossRef] [PubMed] [Green Version]
- Gao, M.; Guttikunda, S.K.; Carmichael, G.R.; Wang, Y.; Liu, Z.; Stanier, C.O.; Saide, P.E.; Yu, M. Health impacts and economic losses assessment of the 2013 severe haze event in Beijing area. Sci. Total Environ. 2015, 511, 553–561. [Google Scholar] [CrossRef] [PubMed]
- Zhang, X.Y. Aerosol over China and their climate effect. Adv. Earth Sci. 2007, 22, 12–16. (In Chinese) [Google Scholar]
- Cheng, M.C.; You, C.F.; Cao, J.; Jin, Z.D. Spatial and seasonal variability of water-soluble ions in PM2.5, aerosols in 14 major cities in China. Atmos. Environ. 2012, 60, 182–192. [Google Scholar] [CrossRef]
- Zhang, X.Y.; Wang, Y.Q.; Niu, T.J.; Zhang, X.C.; Gong, S.L.; Zhang, Y.M.; Sun, J.Y. Atmospheric aerosol compositions in China: Spatial/temporal variability, chemical signature, regional haze distribution and comparisons with global aerosols. Atmos. Chem. Phys. 2012, 12, 771–799. [Google Scholar] [CrossRef] [Green Version]
- Zheng, J.; Hu, M.; Peng, J.F.; Wu, Z.J.; Kumar, P.; Li, M.R.; Wang, Y.J.; Guo, S. Spatial distributions and chemical properties of PM2.5 based on 21 field campaigns at 17 sites in China. Chemosphere 2016, 159, 480–487. [Google Scholar] [CrossRef] [PubMed] [Green Version]
- Yang, F.; Tan, J.; Zhao, Q.; Du, Z.; He, K.; Ma, Y.; Duan, F.; Chen, G.; Zhao, Q. Characteristics of PM2.5 speciation in representative megacities and across China. Atmos. Chem. Phys. 2011, 11, 5207–5219. [Google Scholar] [CrossRef]
- Sisler, J.F.; Malm, W.C. Interpretation of trends of PM2.5 and reconstructed visibility from the IMPROVE network. J. Air Waste Manag. 2000, 50, 775–789. [Google Scholar] [CrossRef] [PubMed]
- Pitchford, M.; Malm, W.; Schichtel, B.; Kumar, N.; Lowenthal, D.; Hand, J. Revised algorithm for estimating light extinction from IMPROVE particle speciation data. J. Air Waste Manag. 2007, 57, 1326–1336. [Google Scholar]
- Li, X.H.; He, K.B.; Li, C.C.; Yang, F.M.; Zhao, Q.; Ma, Y.L.; Chen, Y.; Ouyang, W.J.; Chen, G.C. PM2.5 mass, chemical composition, and light extinction before and during the 2008 Beijing Olympics. J. Geophys. Res. Atmos. 2013, 118, 12158–12167. [Google Scholar] [CrossRef]
- Wang, H.; Shi, G.; Tian, M.; Zhang, L.; Chen, Y.; Yang, F.M.; Gao, X.Y. Aerosol optical properties and chemical composition apportionment in Sichuan Basin, China. Sci. Total Environ. 2017, 577, 245–257. [Google Scholar] [CrossRef] [PubMed]
- Lin, Y.F.; Huang, K.; Zhuang, G.S.; Fu, J.S.; Wang, Q.Z.; Liu, T.N.; Deng, C.R.; Fu, Q.Y. A multi-year evolution of aerosol chemistry impacting visibility and haze formation over an Eastern Asia megacity, Shanghai. Atmos. Environ. 2014, 92, 76–86. [Google Scholar] [CrossRef]
- Deng, J.J.; Zhang, Y.R.; Hong, Y.W.; Xu, L.L.; Chen, Y.T.; Du, W.J.; Chen, J.S. Optical properties of PM2.5 and the impacts of chemical compositions in the coastal city Xiamen in China. Sci. Total Environ. 2016, 557–558, 665–675. [Google Scholar] [CrossRef] [PubMed]
- Tao, J.; Zhang, L.M.; Cao, J.J.; Hsu, S.; Xia, X.J.; Zhang, Z.S.; Lin, Z.J.; Chen, T.T.; Zhang, R.J. Characterization and source apportionment of aerosol light extinction in Chengdu, southwest China. Atmos. Environ. 2014, 95, 552–562. [Google Scholar] [CrossRef]
- Cao, J.J.; Wang, Q.Y.; Chow, J.C.; Waston, J.G.; Tie, X.X.; Shen, Z.X.; Wang, P.; An, Z.S. Impacts of aerosol compositions on visibility impairment in Xi’an, China. Atmos. Environ. 2012, 59, 559–566. [Google Scholar] [CrossRef]
- Tao, J.; Zhang, L.M.; Gao, J.; Wang, H.; Chai, F.H.; Wang, S.L. Aerosol chemical composition and light scattering during a winter season in Beijing. Atmos. Environ. 2015, 110, 36–44. [Google Scholar] [CrossRef]
- Tian, M.; Wang, H.B.; Chen, Y.; Yang, F.M.; Zhang, X.H.; Zou, Q.; Zhang, R.Q.; Ma, Y.L.; He, K.B. Characteristics of aerosol pollution during heavy haze events in Suzhou, China. Atmos. Chem. Phys. 2016, 16, 7357–7371. [Google Scholar] [CrossRef]
- Tao, J.; Zhang, L.M.; Ho, K.F.; Zhang, R.J.; Lin, Z.J.; Zhang, Z.S.; Lin, M.; Cao, J.J.; Liu, S.X.; Wang, G.H. Impact of PM2.5 chemical compositions on aerosol light scattering in Guangzhou—The largest megacity in South China. Atmos. Res. 2014, 135–136, 48–58. [Google Scholar] [CrossRef]
- Li, B.; Zhang, J.; Zhao, Y.; Yuan, S.; Zhao, Q.; Shen, G.; Wu, H. Seasonal variation of urban carbonaceous aerosols in a typical city Nanjing in Yangtze River Delta, China. Atmos. Environ. 2015, 106, 223–231. [Google Scholar] [CrossRef]
- Wu, D.; Cao, S.; Tang, L.L.; Xia, J.R.; Lu, J.G.; Liu, G.; Yang, M.; Li, F.Y.; Ge, X.L. Variation of size distribution and the influencing factors of aerosol in Northern Suburbs of Nanjing. Environ. Sci. 2016, 37, 3268–3279. (In Chinese) [Google Scholar]
- Zhuang, B.L.; Wang, T.J.; Liu, J.; Li, S.; Xie, M.; Han, Y.; Cheng, P.L.; Hu, Q.; Yang, X.Q.; Fu, C.B.; et al. The surface aerosol optical properties in the urban area of Nanjing, west Yangtze River Delta, China. Atmos. Chem. Phys. 2017, 17, 1143–1160. [Google Scholar] [CrossRef]
- Wang, H.L.; An, J.L.; Cheng, M.T.; Shen, L.J.; Zhu, B.; Li, Y.; Wang, Y.S.; Duan, Q.; Sullivan, A.; Xia, L. One year online measurements of water-soluble ions at the industrially polluted town of Nanjing, China: Sources, seasonal and diurnal variations. Chemosphere 2016, 148, 526–536. [Google Scholar] [CrossRef] [PubMed]
- Wang, H.L.; An, J.L.; Zhu, B.; Shen, L.J.; Duan, Q.; Shi, Y.Z. Characteristics of carbonaceous aerosol in a typical industrial city—Nanjing in Yangtze River Delta, China: Size distributions, seasonal variations, and sources. Atmosphere 2017, 8, 73. [Google Scholar] [CrossRef]
- Li, H.M.; Wang, J.H.; Wang, Q.; Qian, X.; Qian, Y.; Yang, M.; Li, F.; Lu, H.; Wang, C. Chemical fractionation of arsenic and heavy metals in fine particle matter and its implications for risk assessment: A case study in Nanjing, China. Atmos. Environ. 2015, 103, 339–346. [Google Scholar] [CrossRef]
- Ge, X.; He, Y.; Sun, Y.; Xu, J.Z.; Wang, J.; Shen, Y.; Chen, M.D. Characteristics and formation mechanisms of fine particulate nitrate in typical urban areas in China. Atmosphere 2017, 8, 62. [Google Scholar] [CrossRef]
- Ming, L.; Jin, L.; Li, J.; Fu, P.; Yang, W.; Liu, D.; Zhang, G.; Wang, Z.; Li, X. PM2.5 in the Yangtze River Delta, China: Chemical compositions, seasonal variations, and regional pollution events. Environ. Pollut. 2017, 223, 200–212. [Google Scholar] [CrossRef] [PubMed]
- Shen, G.; Xue, M.; Yuan, S.; Zhang, J.; Zhao, Q.; Li, B.; Wu, H.; Ding, A. Chemical compositions and reconstructed light extinction coefficients of particulate matter in a mega-city in the western Yangtze River Delta, China. Atmos. Environ. 2014, 83, 14–20. [Google Scholar] [CrossRef]
- Yu, X.; Ma, J.; An, J.; Yuan, L.; Zhu, B.; Liu, D.; Wang, J.; Yang, Y.; Cui, H. Impacts of meteorological condition and aerosol chemical compositions on visibility impairment in Nanjing, China. J. Clean. Prod. 2016, 131, 112–120. [Google Scholar] [CrossRef]
- Hua, Y.; Cheng, Z.; Wang, S.; Jiang, J.; Chen, D.; Cai, Y.; Fu, X.; Fu, Q.Y.; Chen, C.; Xu, B.; et al. Characteristics and source apportionment of PM2.5 during a fall heavy haze episode in the Yangtze River Delta of China. Atmos. Environ. 2015, 123, 380–391. [Google Scholar] [CrossRef]
- Wei, L.F.; Yang, F.M.; Tan, J.H.; Ma, Y.L.; He, K.B. Research progress on aerosol extinction properties. Environ. Chem. 2014, 33, 705–715. (In Chinese) [Google Scholar]
- Chen, Z. Relationship between Haze Pollution and Aerosol Properties in the Yangtze River Delta of China. Ph.D. Dissertation, Tsinghua University, Beijing, China, November 2013. (In Chinese). [Google Scholar]
- Wang, Q. Study of Air Pollution Transportation Source in Shanghai Using Trajectory Model. Res. Environ. Sci. 2013, 26, 357–363. (In Chinese) [Google Scholar]
- Chen, W.H.; Wang, X.M.; Cohen, J.B.; Zhou, S.Z.S.; Chang, M.; Chan, C.Y. Properties of aerosols and formation mechanisms over southern China during the monsoon season. Atmos. Chem. Phys. 2016, 16, 13271–13289. [Google Scholar] [CrossRef]
- Li, L.; An, J.Y.; Zhou, M.; Yan, R.S.; Huang, C.; Lu, Q.; Lin, L.; Wang, Y.J.; Tao, S.K.; Qiao, L.P.; et al. Source apportionment of fine particles and its chemical components over the Yangtze River Delta, China during a heavy haze pollution episode. Atmos. Environ. 2015, 123, 415–429. [Google Scholar] [CrossRef]
- Zhao, J.P.; Zhang, F.W.; Xu, Y.; Chen, J.S. Characterization of water-soluble inorganic ions in size-segregated aerosols in coastal city, Xiamen. Atmos. Res. 2011, 99, 546–562. [Google Scholar] [CrossRef]
- Sun, Y.; Zhuang, G.; Tang, A.A.; Wang, Y.; An, Z. Chemical characteristics of PM2.5 and PM10 in haze−fog episodes in Beijing. Environ. Sci. Technol. 2006, 15, 3148–3155. [Google Scholar] [CrossRef]
- Huang, Y.M.; Liu, Z.R.; Chen, H.; Wang, Y.S. Characteristics of mass size distributions of Water-Soluble inorganic ions during summer and winter haze days of Beijing. Environ. Sci. 2013, 34, 1236–1244. (In Chinese) [Google Scholar]
- Waheed, A.; Lin, X.L.; Tan, M.G.; Bao, L.M.; Liu, J.F.; Zhang, Y.X.; Zhang, G.L.; Li, Y. Size Distribution and Sources of trace metals in ultrafine/fine/coarse airborne particles in the atmosphere of Shanghai. Aerosol Sci. Technol. 2011, 45, 163–171. [Google Scholar] [CrossRef]
- Luo, X.S.; Yu, S.; Li, X.D. Distribution, availability, and sources of trace metals in different particle size fractions of urban soils in Hong Kong: Implications for assessing the risk to human health. Environ. Pollut. 2011, 159, 1317–1326. [Google Scholar] [CrossRef] [PubMed]
- Wang, H.L.; Zhu, B.; Shen, L.J.; Xu, H.H.; An, J.L.; Xue, G.Q.; Cao, L.F. Water-soluble ions in atmospheric aerosols measured in five sites in the Yangtze River Delta, China: Size-fractionated, seasonal variations and sources. Atmos. Environ. 2015, 123, 370–379. [Google Scholar] [CrossRef]
- Huang, X.J.; Liu, Z.R.; Zhang, J.K.; Wen, T.X.; Ji, D.S.; Wang, Y.S. Seasonal variations and size distributions of water-soluble ions in atmospheric aerosols in Beijing. Atmos. Res. 2016, 168, 70–79. [Google Scholar] [CrossRef]
- Liu, G.; Li, J.; Wu, D.; Xu, H. Chemical composition and source apportionment of the ambient PM2.5 in Hangzhou, China. Particuology 2015, 18, 135–143. [Google Scholar] [CrossRef]
- Zhang, T.; Cao, J.J.; Tie, X.X.; Shen, Z.X.; Liu, S.X.; Ding, H.; Han, Y.M.; Wang, G.H.; Ho, K.F.; Qiang, J.; et al. Water-soluble ions in atmospheric aerosols measured in Xi’an, China seasonal variations and sources. Atmos. Res. 2011, 102, 110–119. [Google Scholar] [CrossRef]
- Ge, X.L.; Li, L.; Chen, Y.F.; Chen, H.; Wu, D.; Wang, J.F.; Xie, X.C.; Ge, S.; Ye, Z.L.; Xu, J.Z.; et al. Aerosol characteristics and sources in Yangzhou, China resolved by offline aerosol mass spectrometry and other techniques. Environ. Pollut. 2017, 225, 74–85. [Google Scholar] [CrossRef] [PubMed]
- Niu, H.Y.; Zhao, X.; Dai, Z.X.; Wang, G.H.; Wang, L.S. Characterization, source apportionment of particulate matter and n-Alk in atmospheric aerosols in Nanjing City. Environ. Pollut. Control 2005, 27, 363–366. (In Chinese) [Google Scholar]
- Liu, J.; Zhu, L.; Wang, H.; Yang, Y.; Liu, J.T.; Qiu, D.D.; Ma, W.; Zhang, Z.M.; Liu, J.L. Dry deposition of particulate matter at an urban forest, wetland and lake surface in Beijing. Atmos. Environ. 2016, 125, 178–187. [Google Scholar] [CrossRef]
- Wang, D.F.; Zhou, B.; Fu, Q.Y.; Zhao, Q.B.; Zhang, Q.; Chen, J.M.; Yang, X.; Duan, Y.S.; Li, J. Intense secondary aerosol formation due to strong atmospheric photochemical reactions in summer observations at a rural site in eastern Yangtze River Delta of China. Sci. Total Environ. 2016, 571, 1454–1466. [Google Scholar] [CrossRef] [PubMed]
- Squizzato, S.; Masiol, M.; Brunelli, A.; Pistollato, S.; Tarabotti, E.; Rampazzo, G.; Pavoni, B. Factors determining the formation of secondary inorganic aerosol: A case study in the Po Valley (Italy). Atmos. Chem. Phys. 2013, 13, 1927–1939. [Google Scholar] [CrossRef] [Green Version]
- Wang, H.B.; Li, X.H.; Shi, G.M.; Cao, J.J.; Yang, F.M.; Ma, Y.L.; He, K.B. PM2.5 Chemical compositions and aerosol optical properties in Beijing during the late fall. Atmosphere 2015, 6, 164–182. [Google Scholar] [CrossRef]
- Ye, Z.L.; Liu, J.S.; Gu, A.J.; Feng, F.F.; Liu, Y.H.; Bi, C.L.; Xu, J.Z.; Chen, H.; Chen, Y.F.; Dai, L.; et al. Chemical characterization of fine particular matter in Changzhou, China and source apportionment with offline aerosol mass spectrometry. Atmos. Chem. Phys. 2017, 17, 2573–2592. [Google Scholar] [CrossRef]
- Wu, D.; Lin, S.L.; Yang, H.Q.; Du, R.G.; Xia, J.R.; Qi, B.; Liu, G.; Li, F.Y.; Yang, M.; Ge, X.L. Pollution characteristics and light extinction contribution of water-soluble ions of PM2.5 in Hangzhou. Atmos. Environ. 2017, 38, 2656–2666. (In Chinese) [Google Scholar]
- Huang, K.; Zhuang, G.; Lin, Y.; Fu, J.S.; Wang, Q.; Liu, T.; Zhang, R.; Jiang, Y.; Deng, C.; Fi, Q.; et al. Typical types and formation mechanisms of haze in an Eastern Asia megacity, Shanghai. Atmos. Chem. Phys. 2012, 12, 105–124. [Google Scholar] [CrossRef]
- Cheng, Z.; Wang, S.X.; Jiang, J.K.; Fu, Q.Y.; Chen, C.H.; Xu, B.Y.; Yu, J.Q.; Fu, X.; Hao, J.M. Long-term trend of haze pollution and impact of particulate matter in the Yangtze River Delta, China. Environ. Pollut. 2013, 182, 101–110. [Google Scholar] [CrossRef] [PubMed]
- Wang, G.H.; Zhang, R.Y.; Gomez, M.E.; Yang, L.X.; Zamora, M.L.; Hu, M.; Lin, Y.; Peng, J.F.; Guo, S.; Meng, J.J.; et al. Persistent sulfate formation from London Fog to Chinese haze. Proc. Natl. Aacd. Sci. USA 2016, 113, 13630–13635. [Google Scholar] [CrossRef] [PubMed]
- Zhang, Y.W.; Zhang, X.Y.; Zhang, Y.M.; Shen, X.J.; Sun, J.Y.; Ma, Q.L.; Yu, X.M.; Zhu, J.L.; Zhang, L.; Che, H.C. Significant concentration changes of chemical components of PM1 in the Yangtze River Delta area of China and the implications for the formation mechanism of heavy haze–fog pollution. Sci. Total Environ. 2015, 538, 7–15. [Google Scholar] [CrossRef] [PubMed]
- Shen, X.J.; Sun, J.Y.; Zhang, X.Y.; Zhang, Y.M.; Zhang, L.; Che, H.C.; Ma, Q.L.; Yu, X.M.; Yue, Y.; Zhang, Y.W. Characterization of submicron aerosols and effect on visibility during a severe haze-fog episode in Yangtze River Delta, China. Atmos. Environ. 2015, 120, 307–316. [Google Scholar] [CrossRef]
Figure 1.
Location of the sampling site.

Figure 2.
Mass concentrations of the atmospheric particles and major components at different size ranges in suburban Nanjing.
Figure 2.
Mass concentrations of the atmospheric particles and major components at different size ranges in suburban Nanjing.

Figure 3.
Day–night variations of PM2.5 and main chemical components.

Figure 4.
Mass contributions of different components to the total PM2.5 mass.

Figure 5.
Comparison of the IMPROVE-calculated light scattering by particles versus that retrieved from visibility measurements.
Figure 5.
Comparison of the IMPROVE-calculated light scattering by particles versus that retrieved from visibility measurements.

Figure 6.
Relative contributions of different components to the light extinction estimated by the IMPROVE formula.
Figure 6.
Relative contributions of different components to the light extinction estimated by the IMPROVE formula.

Figure 7.
Variations of the contributions of different components to the light extinction under different haze pollution levels.
Figure 7.
Variations of the contributions of different components to the light extinction under different haze pollution levels.

Figure 8.
Relative contributions of different components to the light extinction from different air masses.
Figure 8.
Relative contributions of different components to the light extinction from different air masses.


Table 1.
Seasonal differences of mass concentrations of PM2.5 and its main chemical components (µg/m3).
Table 1.
Seasonal differences of mass concentrations of PM2.5 and its main chemical components (µg/m3).
| Components | Mean ± SD | |||
|---|---|---|---|---|
| Winter (Number = 79) | Spring (Number = 108) | Summer (Number = 123) | Autumn (Number = 132) | |
| PM2.5 | 166.0 ± 96.3 | 97.4 ± 35.9 | 100.4 ± 40.8 | 85.3 ± 44.4 |
| SO42− | 23.3 ± 19.6 | 15.7 ± 8.32 | 24.3 ± 9.51 | 14.5 ± 7.89 |
| NO3− | 29.0 ± 22.8 | 10.9 ± 7.85 | 12.2 ± 11.3 | 13.3 ± 12.0 |
| NH4+ | 16.7 ± 8.37 | 9.18 ± 4.12 | 13.1 ± 5.36 | 12.5 ± 7.45 |
| Na+ | 0.73 ± 0.30 | 0.55 ± 0.26 | 0.59 ± 0.78 | 0.36 ± 0.11 |
| K+ | 1.99 ± 1.02 | 2.03 ± 2.17 | 1.60 ± 1.40 | 1.01 ± 0.43 |
| Mg2+ | 0.09 ± 0.04 | 0.10 ± 0.07 | 0.06 ± 0.05 | 0.08 ± 0.04 |
| Ca2+ | 0.75 ± 0.60 | 1.06 ± 0.55 | 0.50 ± 0.28 | 1.43 ± 0.75 |
| F- | 0.11 ± 0.08 | 0.08 ± 0.09 | 0.07 ± 0.06 | 0.06 ± 0.03 |
| Cl− | 3.55 ± 2.15 | 1.36 ± 1.41 | 1.15 ± 1.59 | 1.39 ± 1.44 |
| OC | 21.5 ± 12.9 | 15.0 ± 7.54 | 13.6 ± 8.24 | 12.7 ± 6.87 |
| EC | 5.10 ± 3.30 | 3.95 ± 2.72 | 2.88 ± 1.50 | 2.06 ± 1.00 |
| SOC | 6.66 ± 6.61 | 4.23 ± 4.38 | 5.06 ± 4.82 | 4.44 ± 4.16 |
| SOC/OC | 28.9 ± 16.1% | 27.4 ± 19.2% | 33.7 ± 18.4% | 32.8 ± 16.0% |
Table 2.
Mean daytime and nighttime meteorological parameters in four seasons.
| Season | Time | Temperature/°C | Relative Humidity (%) | Wind Velocity (m·s−1) | Mixed Layer Height (m) 1 | Rainfall (mm) 2 |
|---|---|---|---|---|---|---|
| Winter | Day | 6.3 | 49.0 | 1.8 | 962.3 | 116.8 |
| Night | 2.4 | 66.8 | 1.0 | 153.3 | ||
| Spring | Day | 22.2 | 36.3 | 2.0 | 1384.7 | 136.4 |
| Night | 17.3 | 51.4 | 1.7 | 135.2 | ||
| Summer | Day | 27.8 | 59.8 | 1.4 | 1361.2 | 405.5 |
| Night | 24.0 | 78.9 | 1.1 | 147.3 | ||
| Autumn | Day | 20.1 | 56.2 | 1.7 | 1194.1 | 170.6 |
| Night | 15.9 | 78.5 | 1.2 | 155.3 |
1 Data is from the NOAA HYSPLIT model, daytime data is from 14:00 while nighttime data is from 02:00. 2 Rainfall data is the accumulated precipitation during the sampling period in that season.
Table 3.
Mass concentrations of PM2.5 and its components, and the meteorological parameters under different haze pollution levels.
Table 3.
Mass concentrations of PM2.5 and its components, and the meteorological parameters under different haze pollution levels.
| Haze Grades | Distinguishing Criteria | Day (Proportion, %) | PM2.5 (μg·m−3) | NH4+ (μg·m−3) | NO3− (μg·m−3) | SO42− (μg·m−3) | OC (μg·m−3) | EC (μg·m−3) | RH 1 (%) | WS (m·s−1) | MLH (m) |
|---|---|---|---|---|---|---|---|---|---|---|---|
| Non_haze | V > 10.0 2 | 18 (27.7) | 69.9 | 7.25 | 6.58 | 9.66 | 9.27 | 2.06 | 56.3 | 2.29 | 1082.2 |
| Slight | 5.0 ≤ V < 10.0 | 32 (49.2) | 98.0 | 11.9 | 12.4 | 17.9 | 14.5 | 3.16 | 62.3 | 1.35 | 1279.9 |
| Mild | 3.0 ≤ V < 5.0 | 11 (16.9) | 132.8 | 19.2 | 22.3 | 25.5 | 16.6 | 3.31 | 69.7 | 1.37 | 1041.0 |
| Moderate | 2.0 ≤ V < 3.0 | 3 (4.6) | 165.4 | 23.2 | 34.6 | 30.9 | 20.4 | 4.25 | 66.6 | 1.68 | 841.7 |
| Severe | V < 2.0 | 1 (1.5) | 383.7 | 23.8 | 80.3 | 72.7 | 45.5 | 9.44 | 75.4 | 0.38 | 772.0 |
1 RH refers to relative humidity, WS refers to wind speed, MLH refers to boundary-layer height (at 2:00 pm of each day); 2 V refers to visibility, the unit is km. When RH < 80%, non-haze days is defined as V > 10 km; when RH > 80%, the weather could be foggy, and no foggy days are included in the sampling days in this analysis.
Table 4.
Variations of aerosol concentration and meteorological elements from different air masses.
| Mass Source | PM2.5 (μg·m−3) | NH4+ (μg·m−3) | NO3− (μg·m−3) | SO42− (μg·m−3) | OC (μg·m−3) | EC (μg·m−3) | RH (%) | WS (m·s−1) | MLH (m) |
|---|---|---|---|---|---|---|---|---|---|
| 1 | 94.3 | 12.4 | 12.7 | 19.1 | 12.1 | 2.52 | 68.0 | 1.48 | 1227.1 |
| 2 | 119.7 | 14.3 | 17.9 | 19.4 | 18.8 | 4.06 | 56.3 | 1.39 | 1079.4 |
| 3 | 120.1 | 13.4 | 17.9 | 21.5 | 15.6 | 3.37 | 65.1 | 1.39 | 1147.5 |
| 4 | 86.2 | 7.90 | 8.41 | 10.2 | 13.2 | 3.30 | 48.3 | 2.48 | 1391.4 |
© 2017 by the authors. Licensee MDPI, Basel, Switzerland. This article is an open access article distributed under the terms and conditions of the Creative Commons Attribution (CC BY) license (http://creativecommons.org/licenses/by/4.0/).
Share and Cite
MDPI and ACS Style
Wu, D.; Zhang, F.; Ge, X.; Yang, M.; Xia, J.; Liu, G.; Li, F. Chemical and Light Extinction Characteristics of Atmospheric Aerosols in Suburban Nanjing, China. Atmosphere 2017, 8, 149. https://doi.org/10.3390/atmos8080149
AMA Style
Wu D, Zhang F, Ge X, Yang M, Xia J, Liu G, Li F. Chemical and Light Extinction Characteristics of Atmospheric Aerosols in Suburban Nanjing, China. Atmosphere. 2017; 8(8):149. https://doi.org/10.3390/atmos8080149
Chicago/Turabian StyleWu, Dan, Fan Zhang, Xinlei Ge, Meng Yang, Junrong Xia, Gang Liu, and Fengying Li. 2017. "Chemical and Light Extinction Characteristics of Atmospheric Aerosols in Suburban Nanjing, China" Atmosphere 8, no. 8: 149. https://doi.org/10.3390/atmos8080149
Note that from the first issue of 2016, this journal uses article numbers instead of page numbers. See further details here.