
Flood Simulations and Uncertainty Analysis for the Pearl River Basin Using the Coupled Land Surface and Hydrological Model System

 ,
,
Abstract
:1. Introduction
2. Model and Method
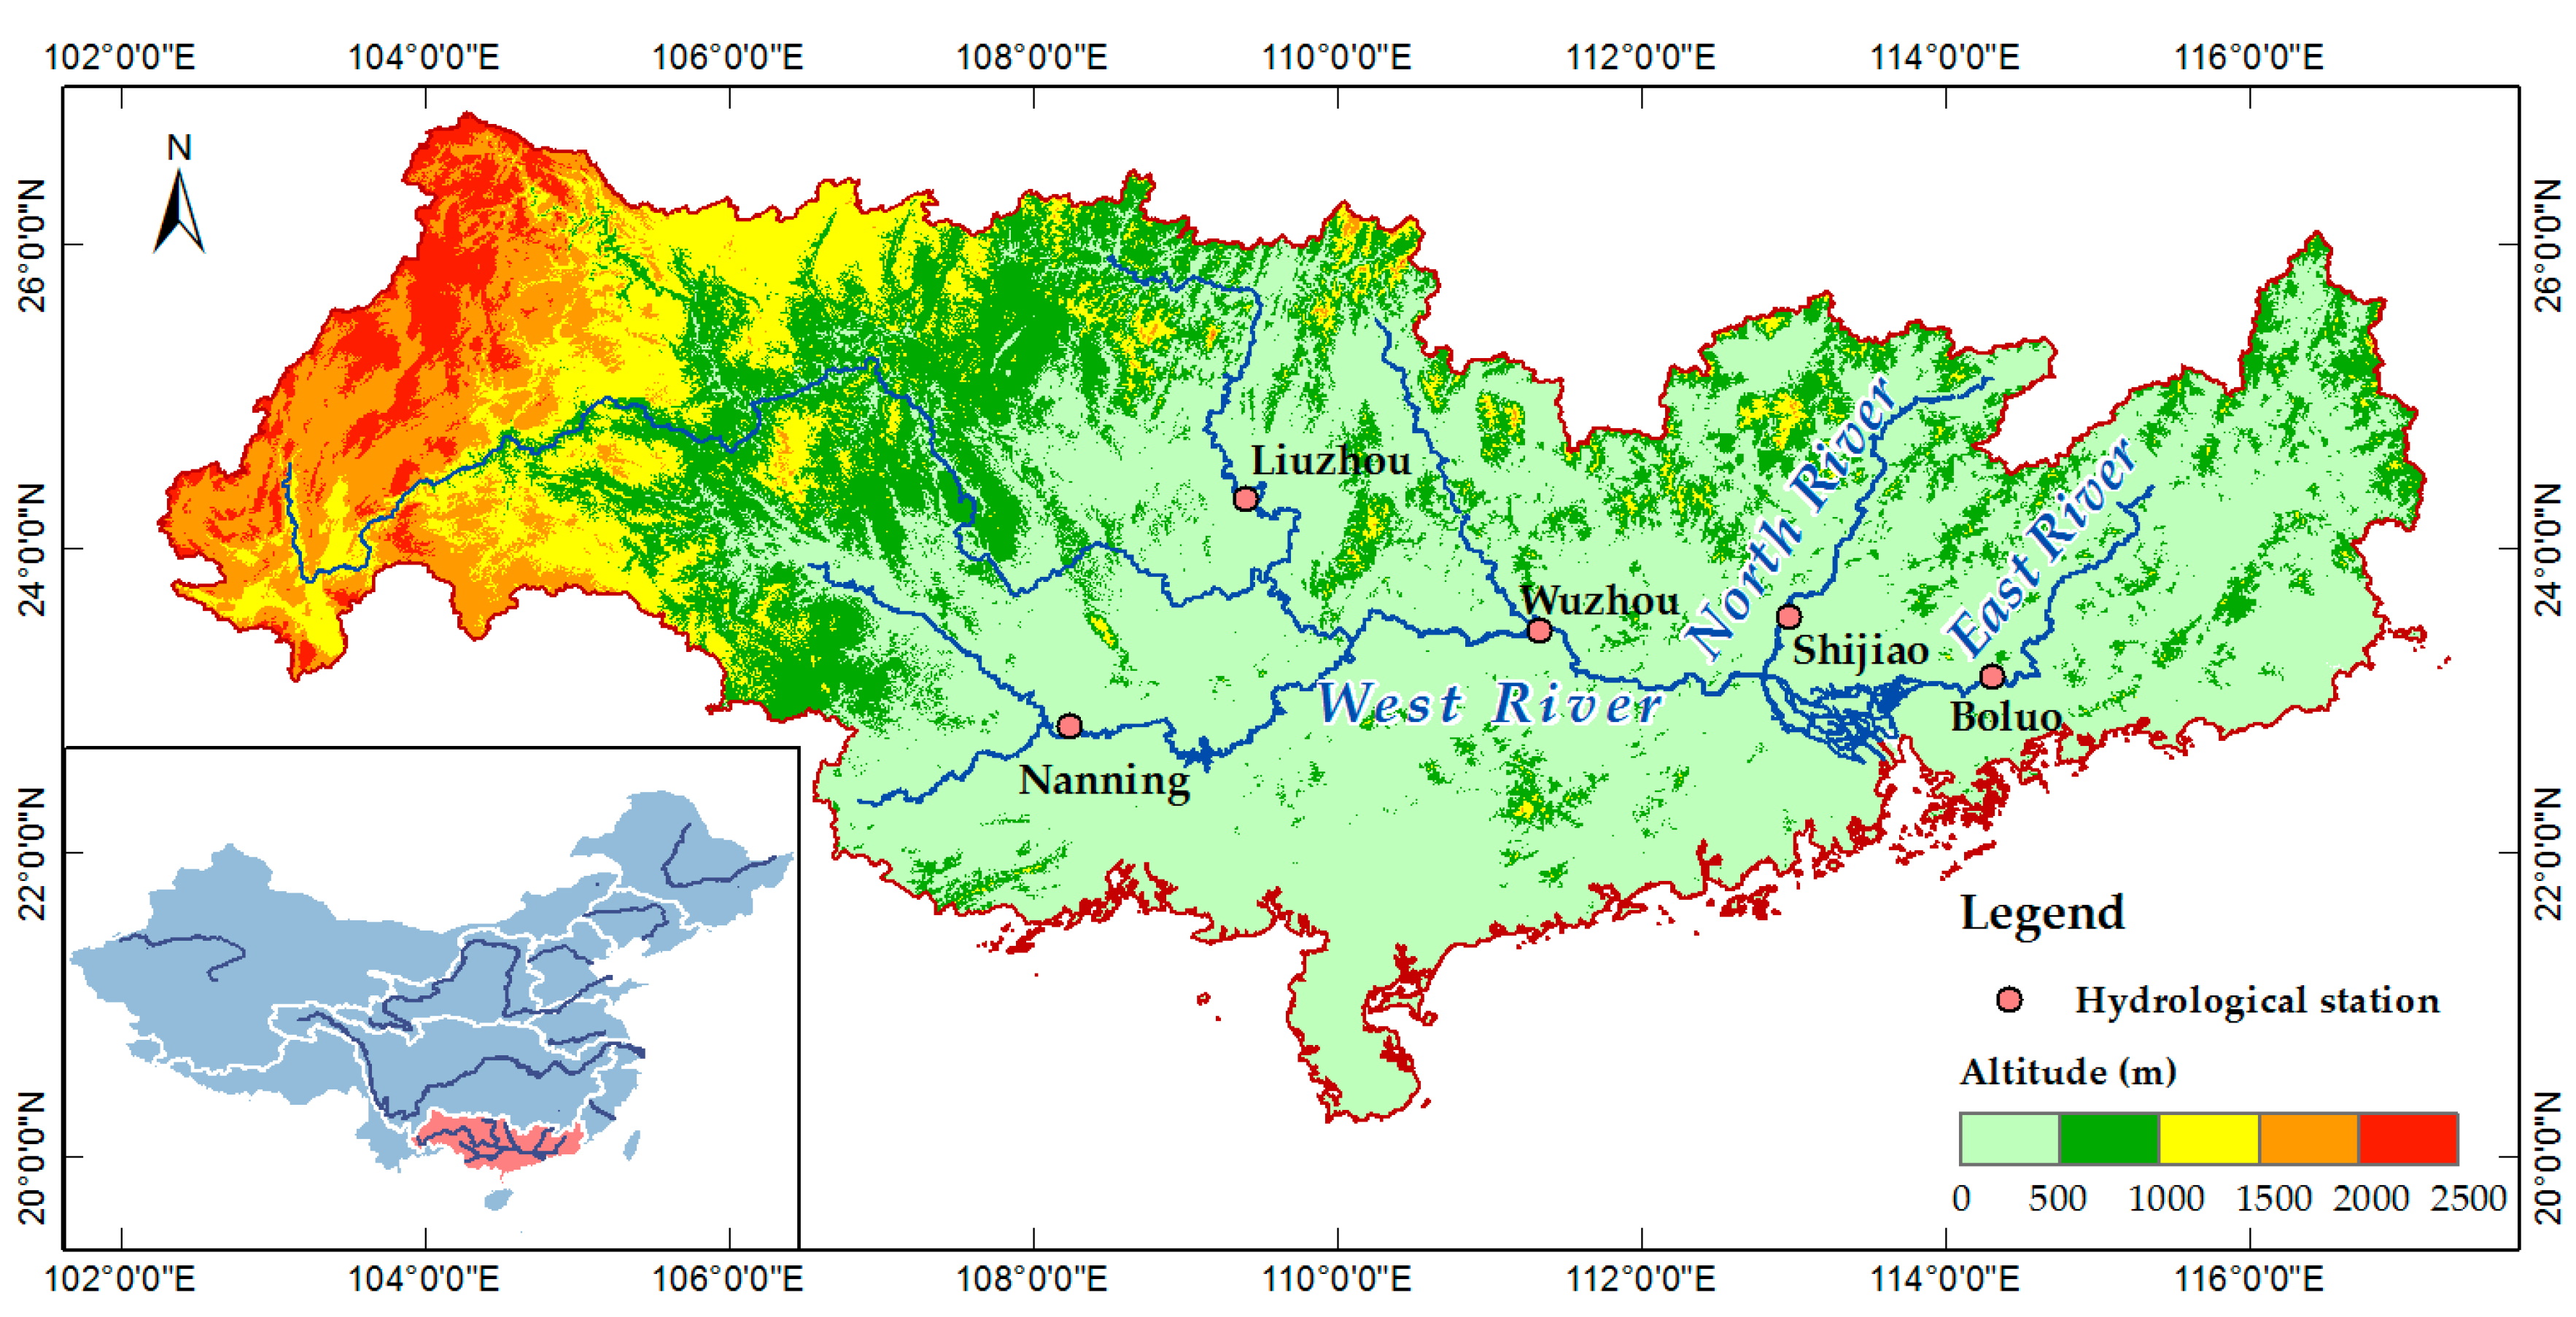
2.1. Study Area
2.2. Model Description and Simulation Design
3. Analysis of Simulation Results
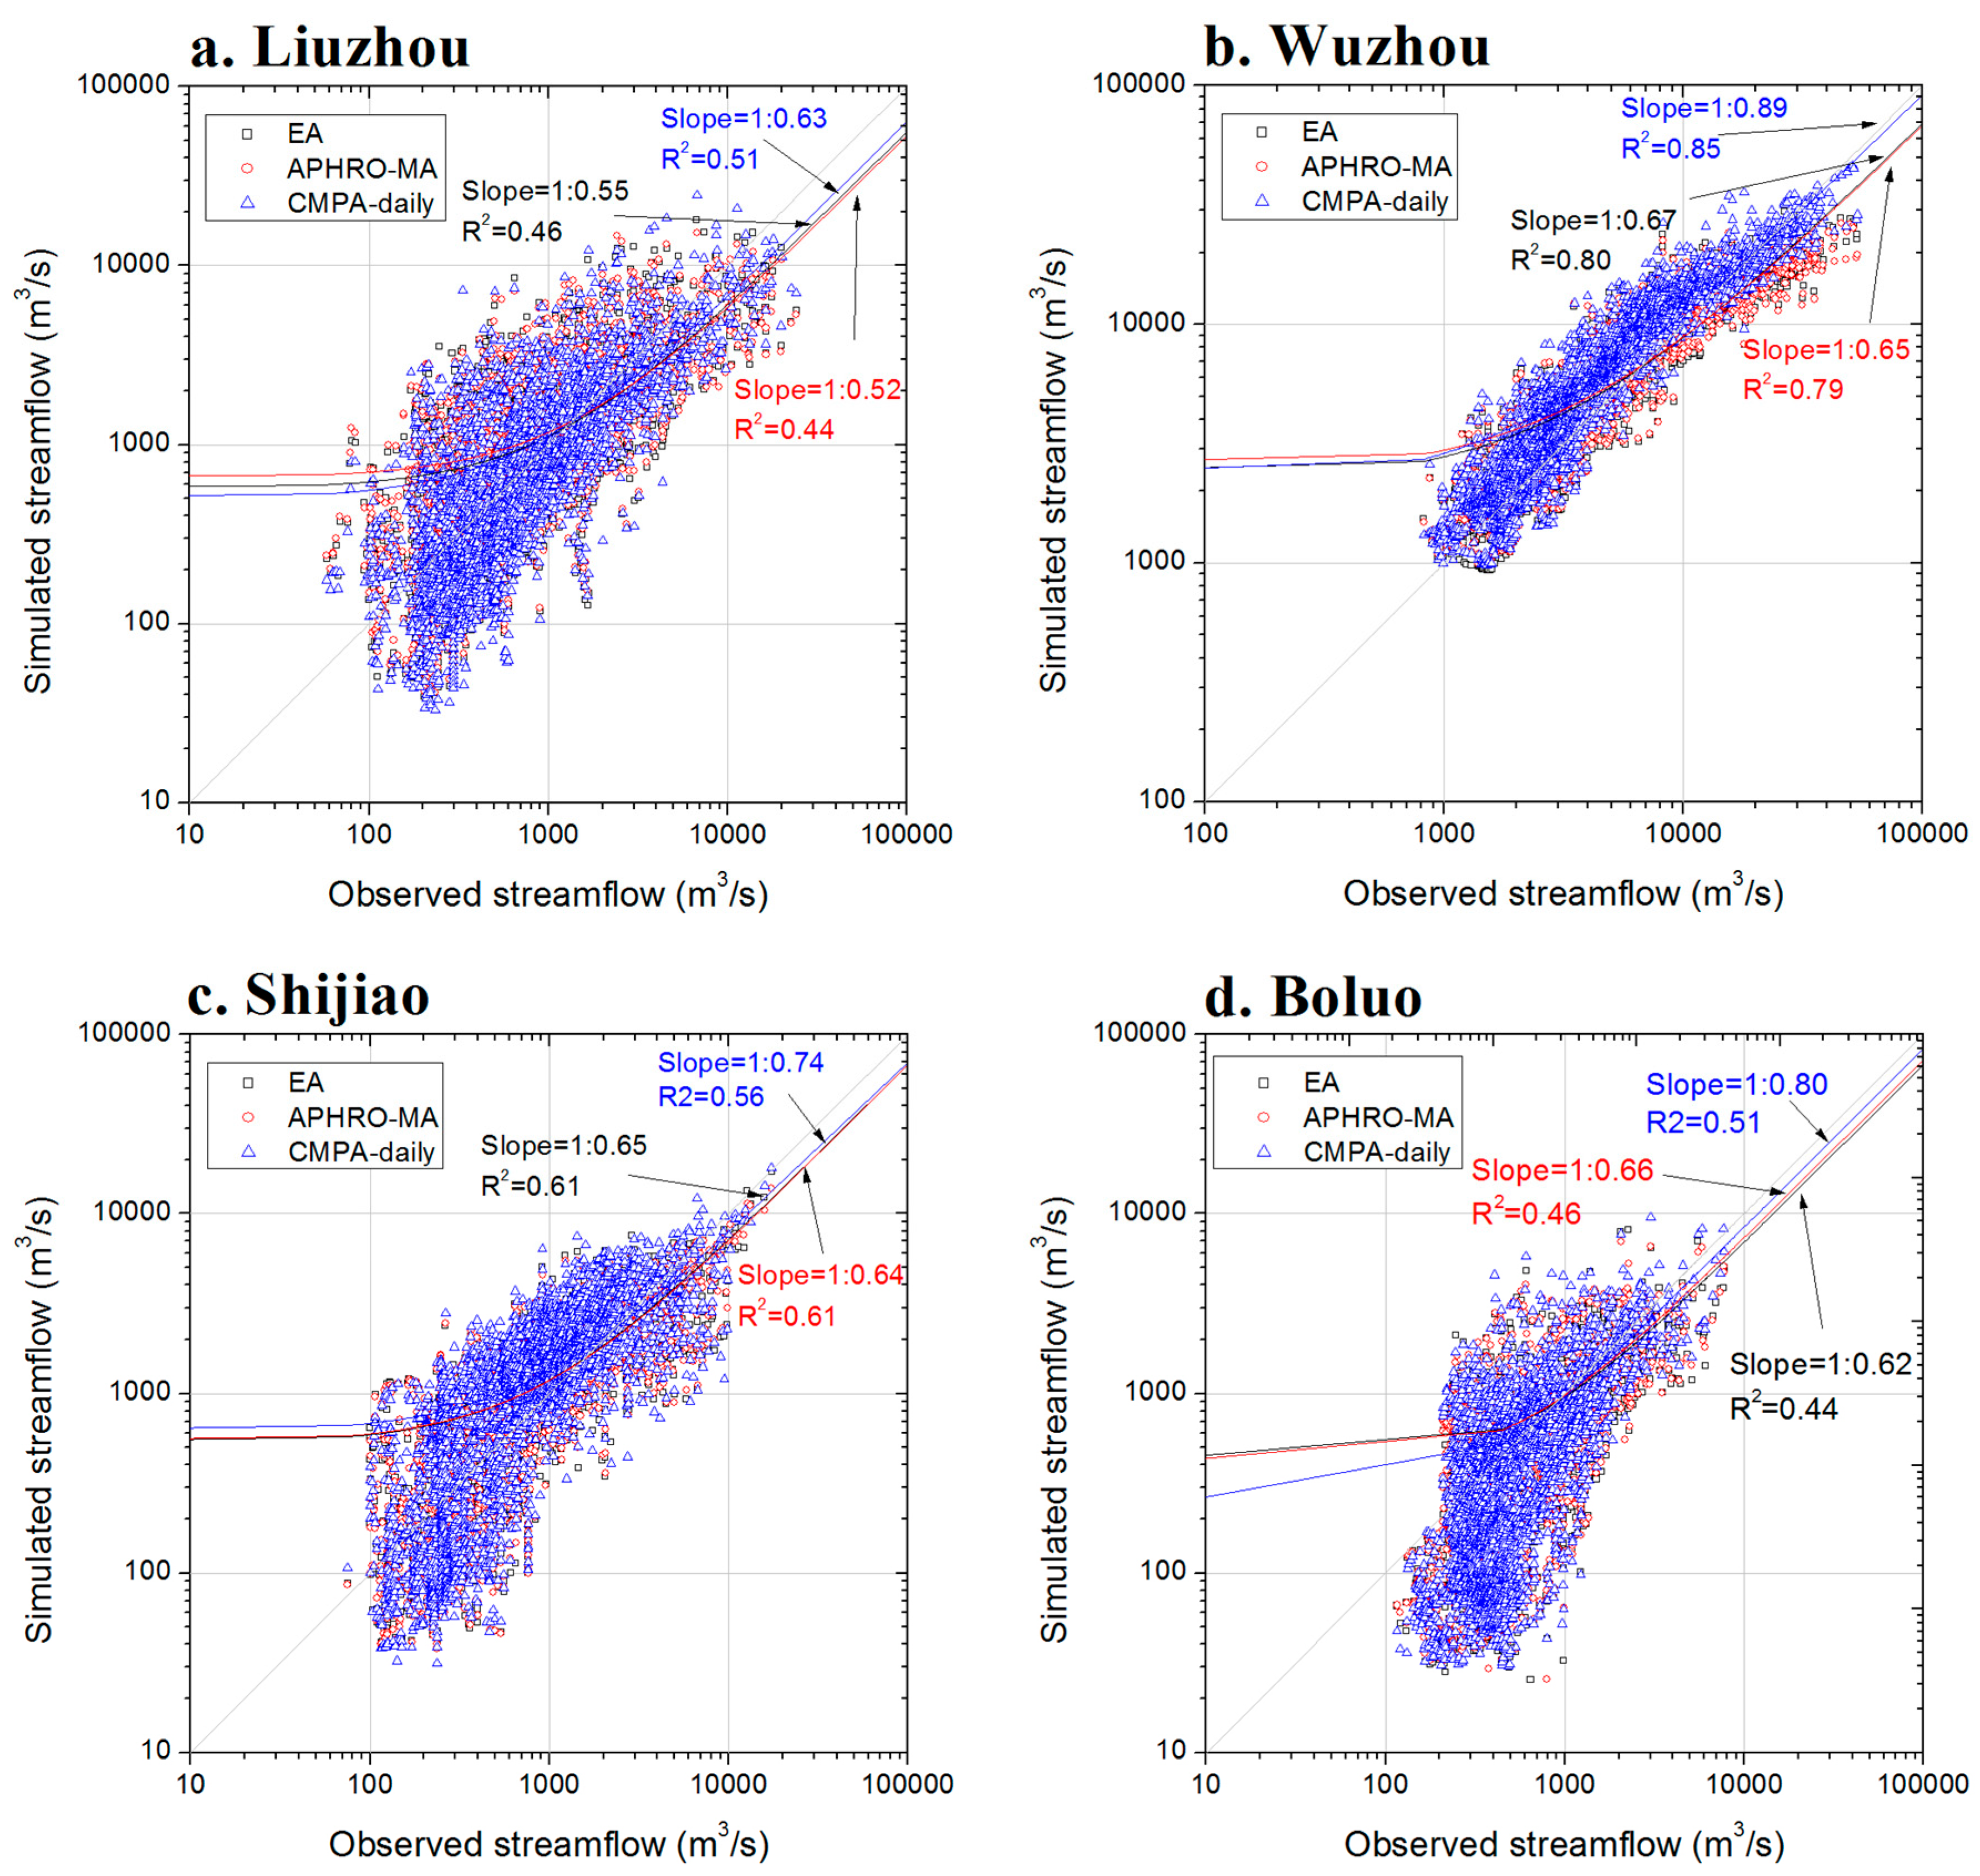
3.1. Evaluation of Daily Simulation Performance
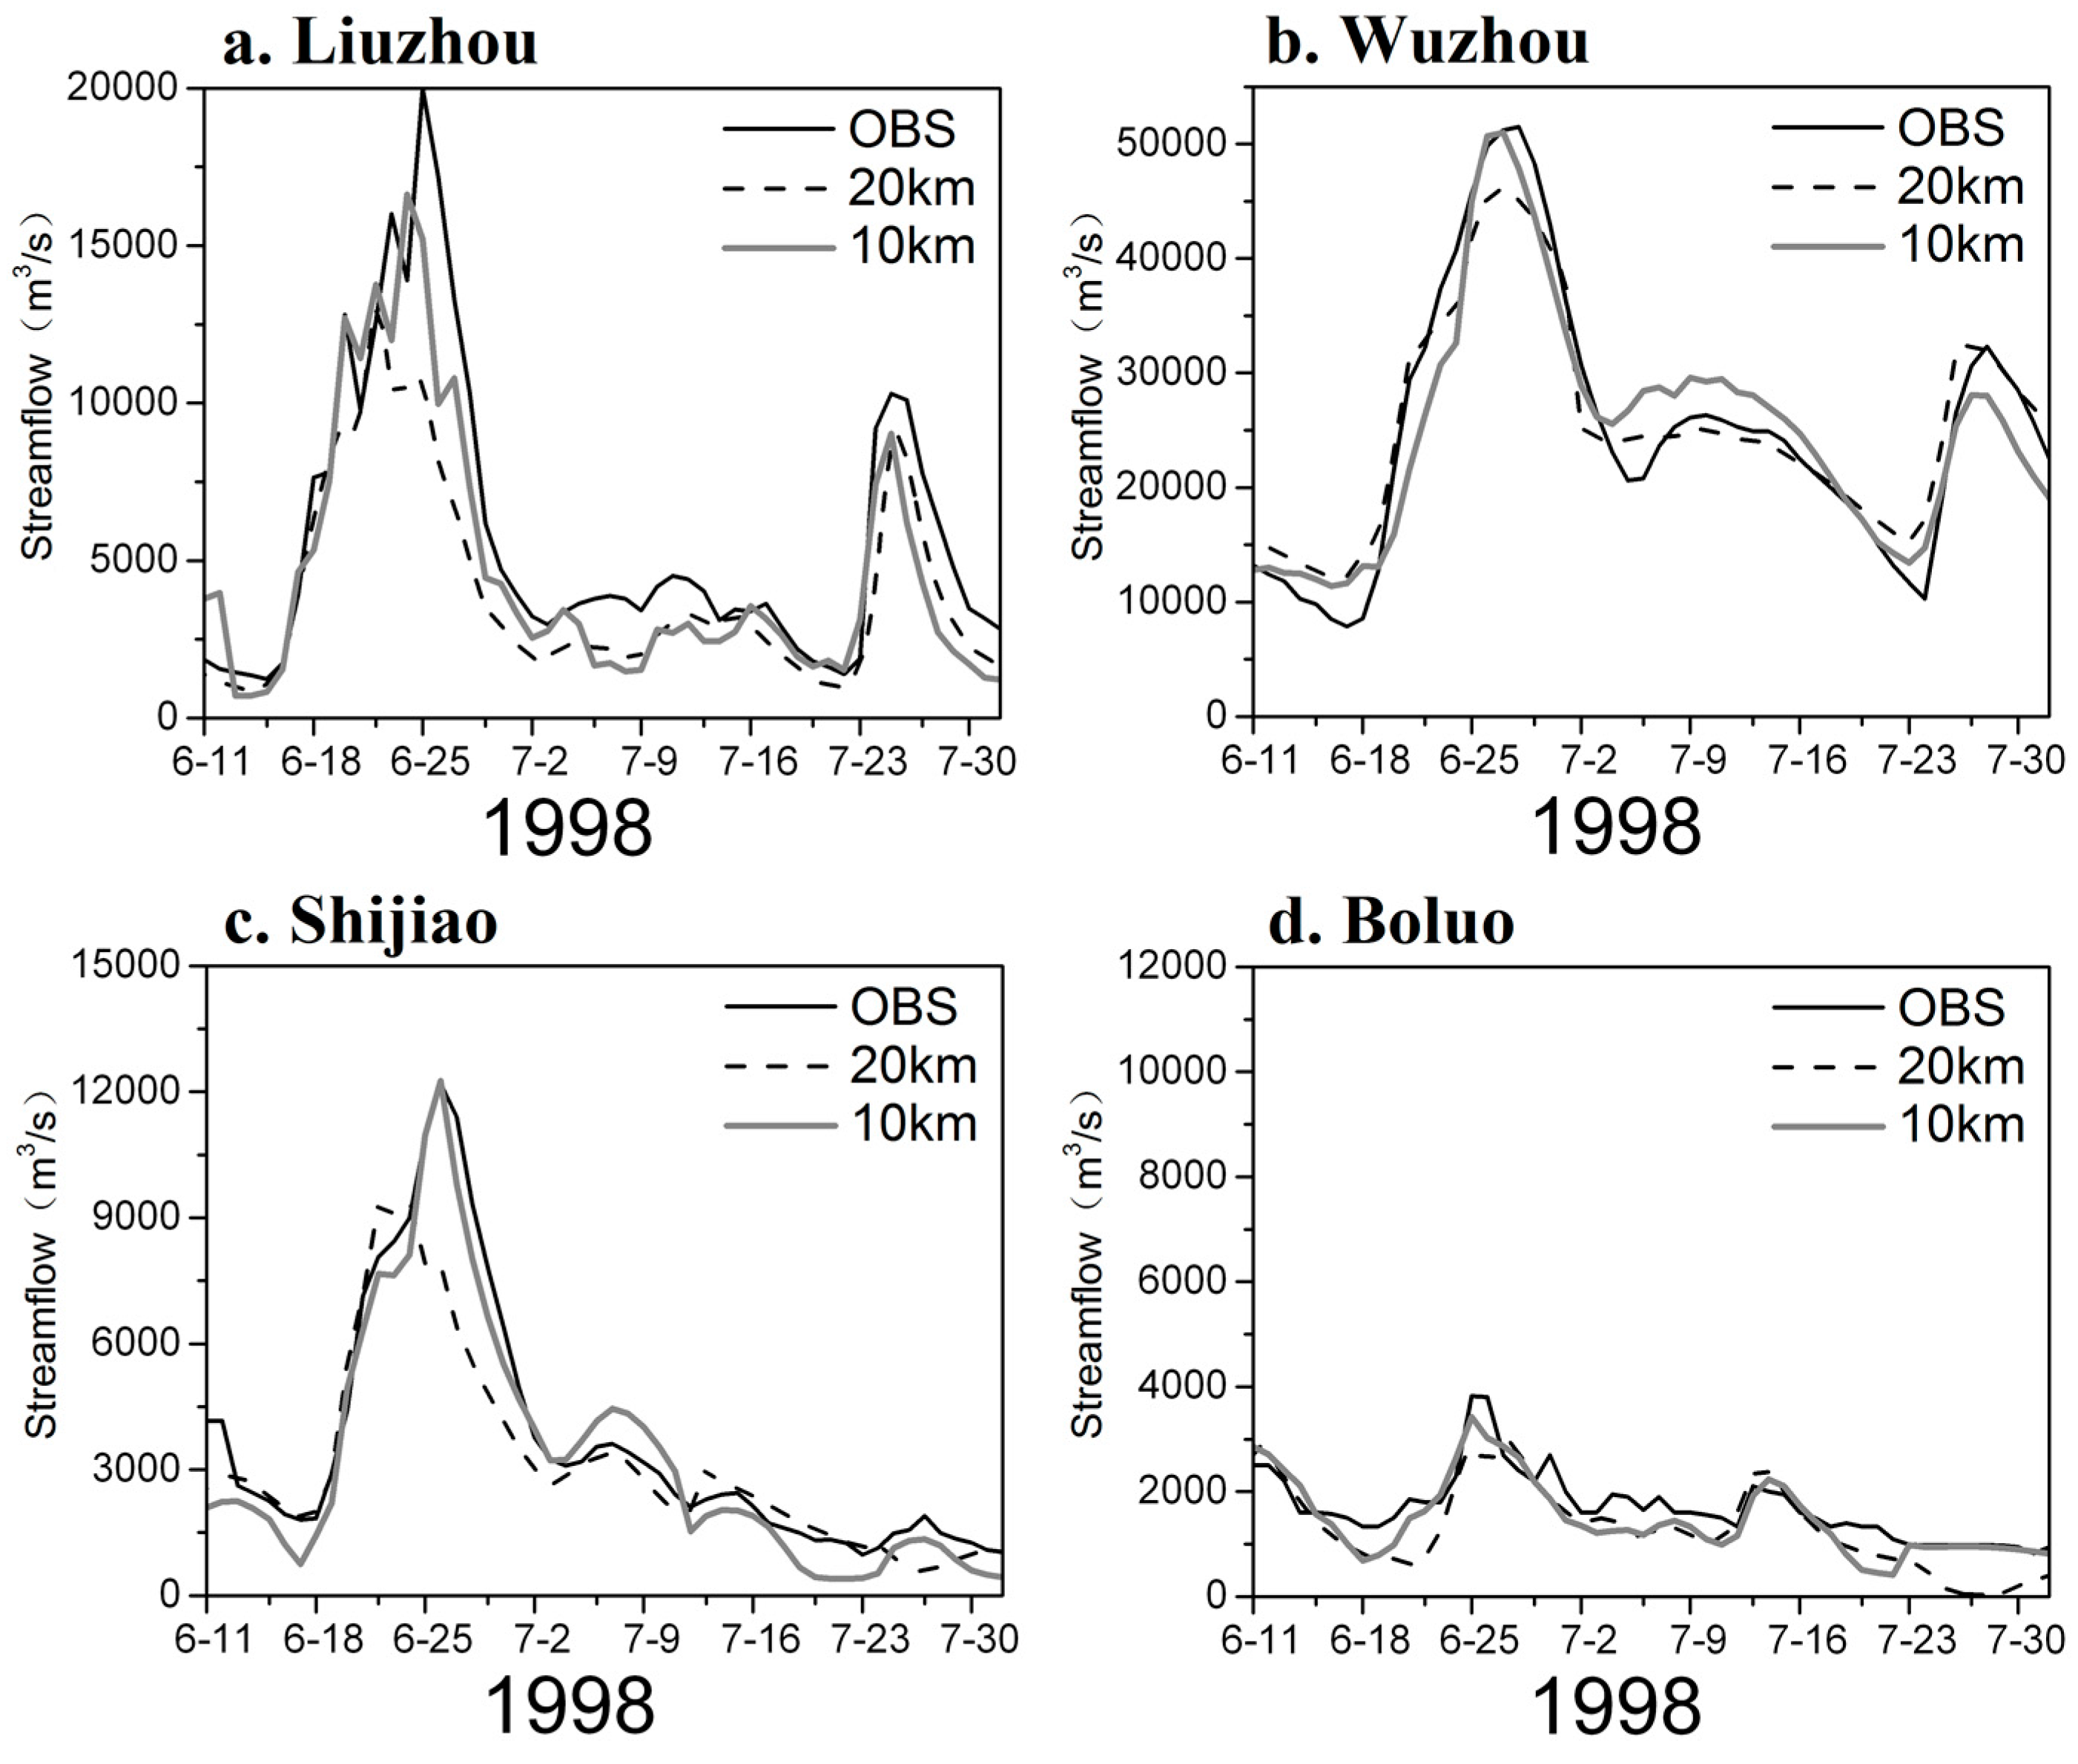
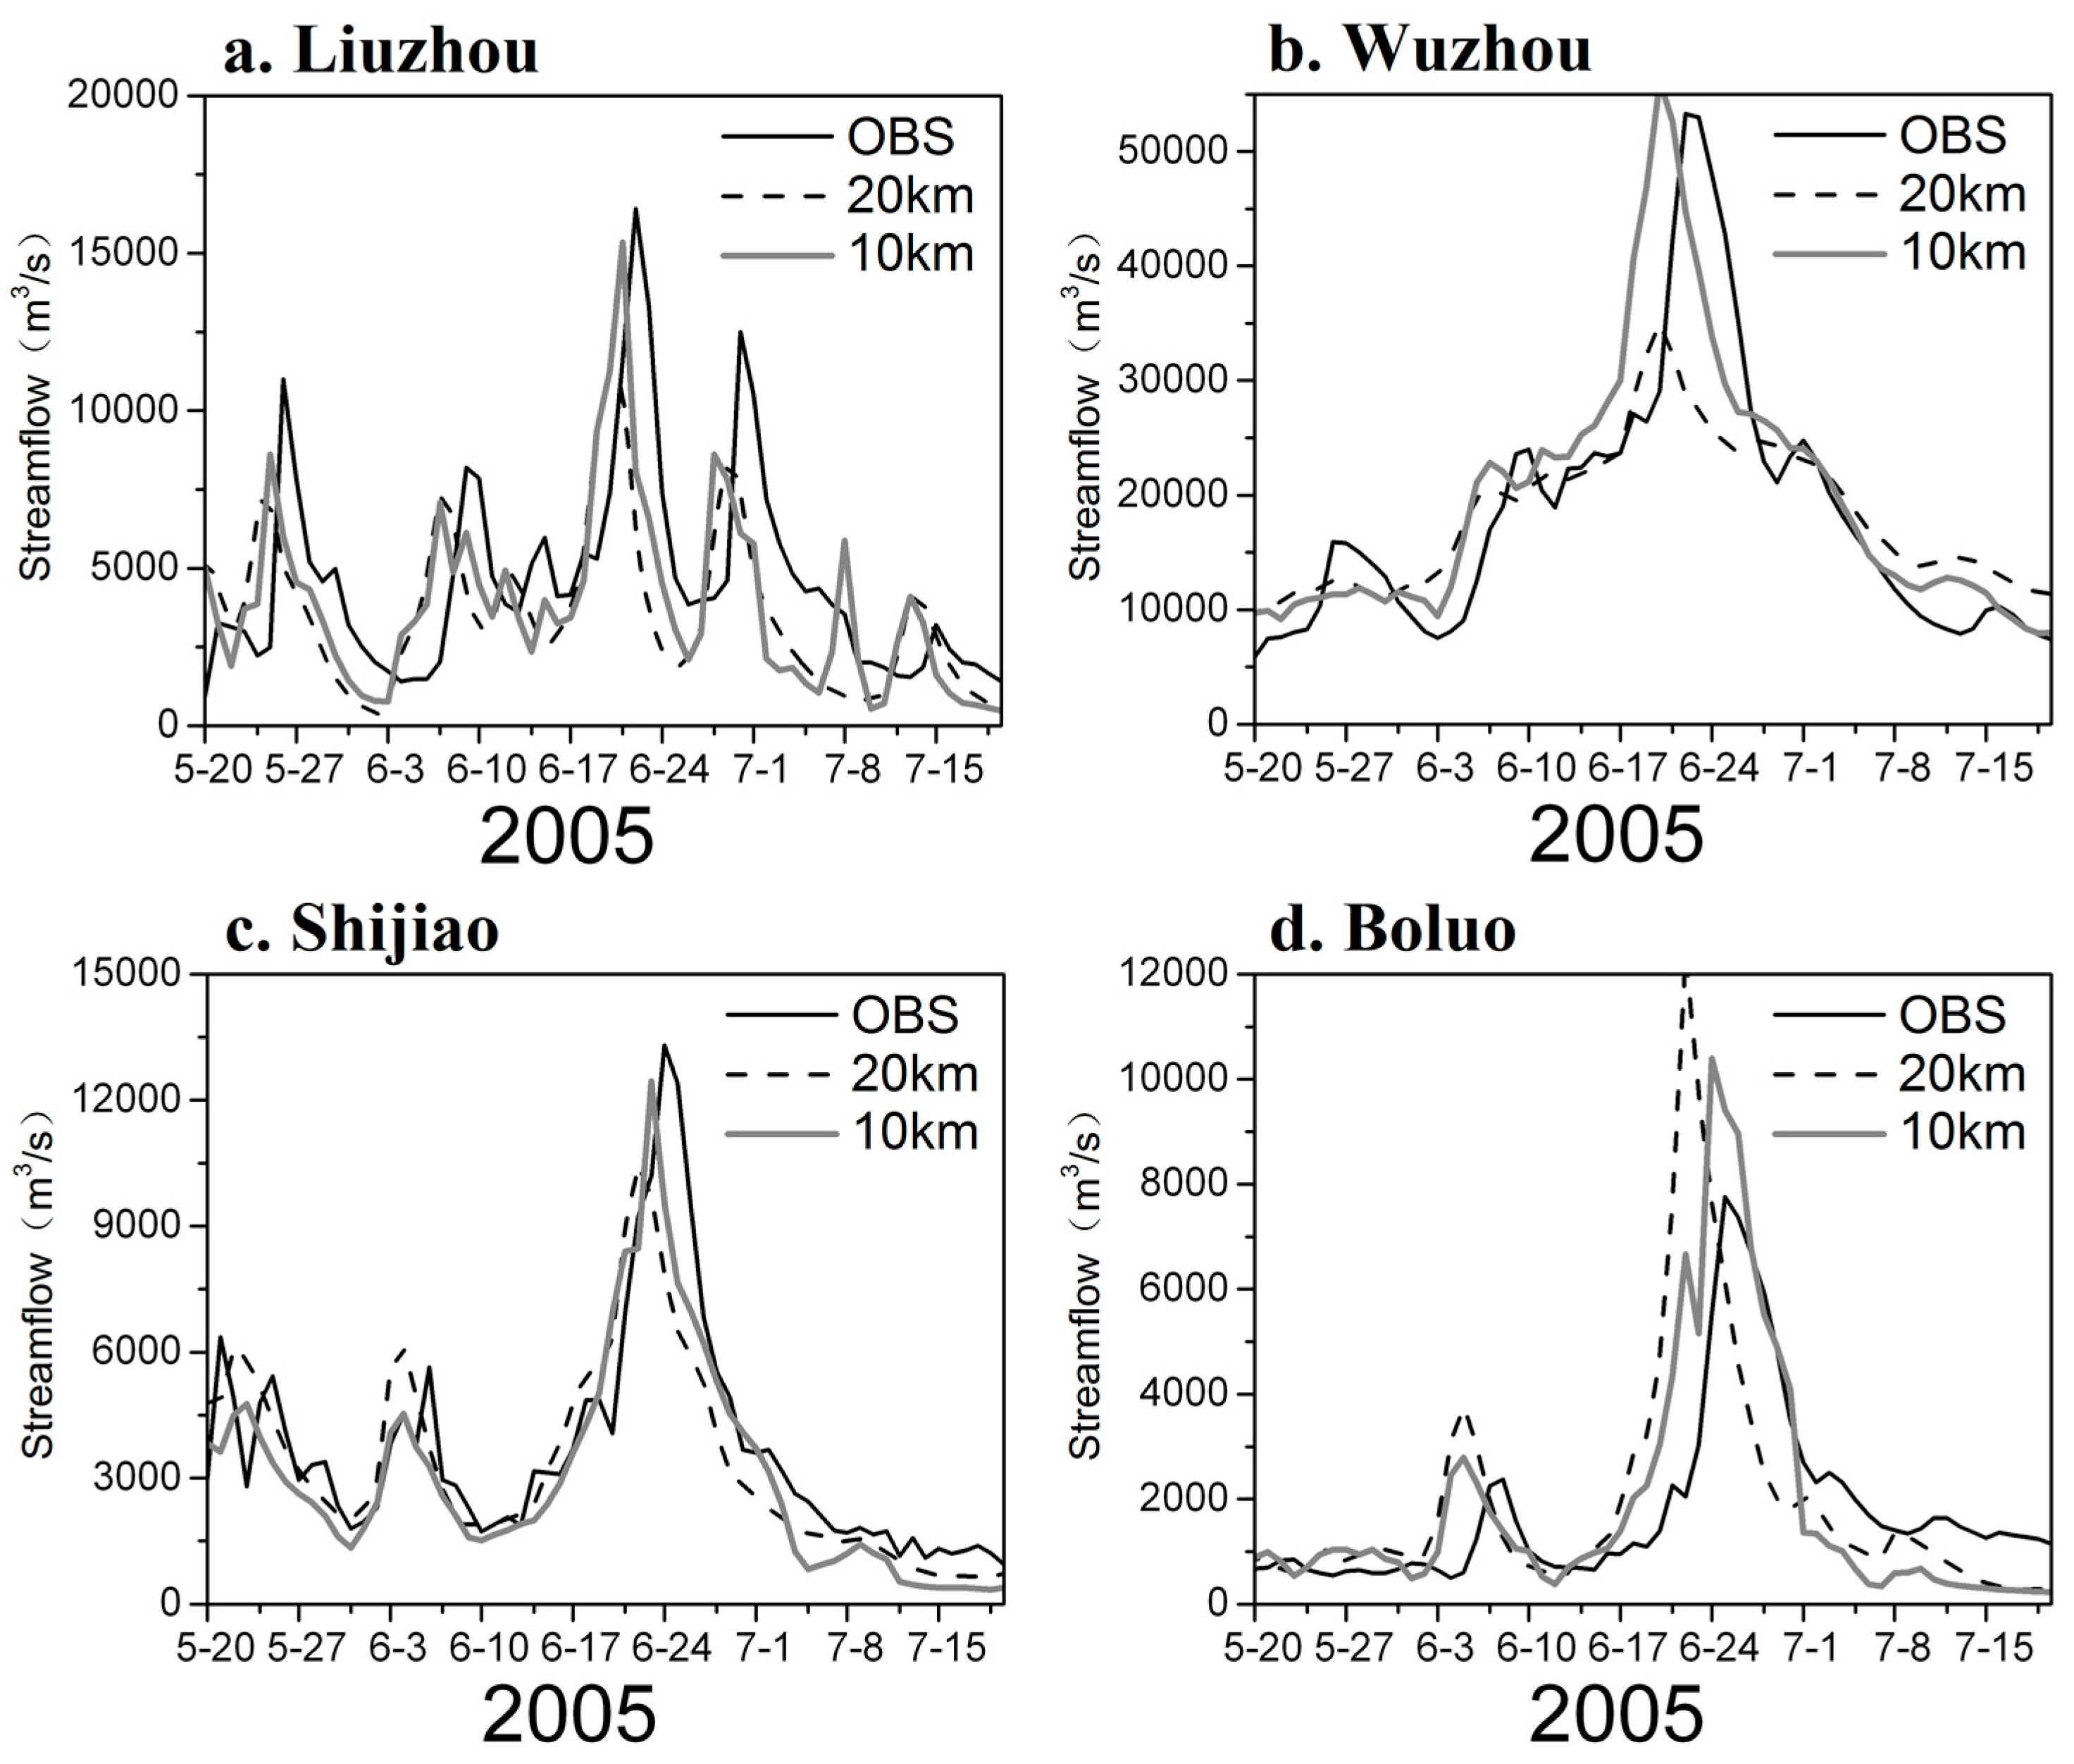
3.2. Evaluation of Hydrological Extreme Simulation Performance
4. Discussion and Conclusions
Acknowledgments
Author Contributions
Conflicts of Interest
References
- Zhang, J.; Wang, G.; Yang, Y.; He, R.; Liu, J. The possible impacts of Climate Change on Water Security in China. Adv. Clim. Chang. Res. 2008, 4, 290–295. (In Chinese) [Google Scholar]
- Piao, S.; Ciais, P.; Huang, Y.; Shen, Z.; Peng, S.; Li, J.; Zhou, L.; Liu, H.; Ma, Y.; Ding, Y.; et al. The impacts of climate change on water resources and agriculture in China. Nature 2010, 467, 43–51. [Google Scholar] [CrossRef] [PubMed]
- Beven, K. Dalton Medal Lecture: How far can we go in distributed hydrological modelling? Hydrol. Earth Syst. Sci. 2001, 5, 1–12. [Google Scholar] [CrossRef]
- Mauser, W.; Bach, H. PROMET—Large scale distributed hydrological modelling to study the impact of climate change on the water flows of mountain watersheds. J. Hydrol. 2009, 376, 362–377. [Google Scholar] [CrossRef]
- Krzysztofowicz, R. Bayesian theory of probabilistic forecasting via deterministic hydrologic model. Water Resour. Res. 1999, 35, 2739–2750. [Google Scholar] [CrossRef]
- Biondi, D.; De Luca, D.L. A Bayesian approach for real-time flood forecasting. Phys. Chem. Earth 2012, 42–44, 91–97. [Google Scholar] [CrossRef]
- Biondi, D.; De Luca, D.L. Performance assessment of a Bayesian Forecasting System (BFS) for real-time flood forecasting. J. Hydrol. 2013, 479, 51–63. [Google Scholar] [CrossRef]
- Feng, S.; Hu, Q.; Qian, W. Quality control of gaily meteorological data in China, 1951–2000: A new dataset. Int. J. Climatol. 2004, 24, 853–870. [Google Scholar] [CrossRef]
- Chen, D.; Ou, T.; Gong, L.; Xu, C.; Li, W.; Ho, C.; Qiang, W. Spatial interpolation of daily precipitation in China: 1951–2005. Adv. Atmos. Sci. 2010, 27, 1221–1232. [Google Scholar] [CrossRef]
- Shen, Y.; Zhao, P.; Pan, Y.; Yu, J. A high spatiotemporal gauge-satellite merged precipitation analysis over China. J. Geophys. Res. 2014, 119, 3063–3075. [Google Scholar] [CrossRef]
- Xie, P.; Yatagai, A.; Chen, M.; Hayasaka, T.; Fukushima, Y.; Liu, C.; Yang, S. A gauge-based analysis of daily precipitation over East Asia. J. Hydromereorol. 2007, 8, 607–626. [Google Scholar] [CrossRef]
- Yatagai, A.; Arakawa, O.; Kamiguchi, K.; Kawamoto, H.; Nodzu, M.I.; Hamada, A. A 44-year daily gridded precipitation dataset for Asia based on a dense network of rain gauges. SOLA 2009, 5, 137–140. [Google Scholar] [CrossRef]
- Ministry of water resources people’s republic of China. 2008 China Water Resources Bulletin; China Water Conservancy and Hydropower Press: Beijing, China, 2009. (In Chinese)
- Yang, C.; Shao, Y.; Lin, Z.; Yu, Z.; Hao, Z.; Liu, S. Development of a two-way coupled land surface-hydrology model: Method and application. In Proceedings of the international symposium on climate change and water, Nanjing, China, 20–22 April 2011. [Google Scholar]
- Yang, C.; Lin, Z.; Yu, Z.; Hao, Z.; Liu, S. Analysis and simulation of human activity impact on streamflow in the Huaihe River Basin with a large-scale hydrologic model. J. Hydrometeorol. 2010, 11, 810–821. [Google Scholar] [CrossRef]
- Pollard, D.; Thompson, S. Use of a land-surface-transfer scheme (LSX) in a global climate model (GENESIS): The response to doubling stomatal resistance. Glob. Planet. Chang. 1995, 10, 129–161. [Google Scholar] [CrossRef]
- Yu, Z.; Pollard, D.; Cheng, L. On continental-scale hydrologic simulations with a coupled hydrologic model. J. Hydrol. 2006, 331, 110–124. [Google Scholar] [CrossRef]
- Li, M.; Lin, Z.; Yang, C.; Shao, Q. Application of a coupled land surface-hydrological model to flood simulation in the Huaihe River Basin of China. Atmos. Ocean. Sci. Lett. 2014, 7, 493–498. [Google Scholar]
- Zhu, Y.; Lin, Z.; Wang, J.; Zhao, Y.; He, F. Impacts of Climate Changes on Water Resources in Yellow River Basin, China. Procedia Eng. 2016, 154, 687–695. [Google Scholar] [CrossRef]
- Zhu, Y.; Lin, Z.; Hao, Z. Development of Large Scale Coupled Land Surface and Hydrologic Model System and Its Application in Pearl River Basin. China Hydrol. 2015, 35, 14–19. (In Chinese) [Google Scholar]
- Webb, R.; Rosenzweig, C.; Levine, E. Specifying land surface characteristics in general circulation models: Soil profile data set and derived water-holding capacities. Glob. Biogeochem. Cycles 1993, 7, 97–108. [Google Scholar] [CrossRef]
- Yang, C.; Yu, Z.; Lin, Z.; Hao, Z. Method Study of Constructing Digital Watershed for Large-scale Distributed Hydrological Model. Prog. Geogr. 2007, 26, 68–76. (In Chinese) [Google Scholar]
- Shi, X.; Yu, D.; Warner, E.; Pan, X.; Petersen, G.; Gong, Z.; Weindorf, D. Soil Database of 1:1,000,000 Digital Soil Survey and Reference System of the Chinese Genetic Soil Classification System. Soil Surv. Horiz. 2004, 45, 129–136. [Google Scholar] [CrossRef]
- Fischer, G.; Nachtergaele, F.; Prieler, S.; Velthuizenvan, H.; Verelst, L.; Wiberg, D. Global Agro-Ecological Zones Assessment for Agriculture (GAEZ 2008); IIASA: Laxenburg, Austria; FAO: Rome, Italy, 2008. [Google Scholar]
- Xu, Y.; Gao, X.; Shen, Y.; Xu, C.; Shi, Y.; Giorgi, F. A daily temperature dataset over China and its application in validating a RCM simulation. Adv. Atmos. Sci. 2009, 26, 763–772. [Google Scholar] [CrossRef]
- Kalnay, E.; Kanamitsu, M.; Kistler, R.; Collins, W.; Deaven, D.; Gandin, L.; Iredell, M.; Saha, S.; White, G.; Woollen, J.; et al. The NCEP/NCAR 40-year reanalysis project. Bull. Am. Meteorol. Soc. 1996, 77, 437–472. [Google Scholar] [CrossRef]
- Sheffield, J.; Goteti, G.; Wood, E. Development of a 50-year high-resolution global dataset of meteorological forcings for land surface modeling. J. Clim. 2006, 19, 3088–3111. [Google Scholar] [CrossRef]
- Zhang, Q.; Xiao, M.; Liu, C.; Singh, V. Reservoir-induced hydrological alterations and environmental flow variation in the East River, the Pearl River basin, China. Stoch. Environ. Res. Risk Assess. 2014, 28, 2119–2131. [Google Scholar] [CrossRef]


| No. | Test Name | Resolution | Precipitation Data Sources | Meteorological Parameters |
|---|---|---|---|---|
| 1 | EA | 20 km × 20 km | Xie et al. [11] | CN05 daily temperature dataset [25]; 6-h NCEP-NCAR reanalysis data [26] |
| 2 | APHRO-MA | 20 km × 20 km | Yatagai et al. [12] | |
| 3 | CMPA-Daily (20 km) | 20 km × 20 km | Shen et al. [9] | |
| 4 | CMPA-Daily (10 km) | 10 km × 10 km |
| Hydrologic Station | Nanning | Liuzhou | Wuzhou | Shijiao | Boluo | |
|---|---|---|---|---|---|---|
| WBI | EA | 0.91 | 0.96 | 0.98 | 0.99 | 0.83 |
| APHRO-MA | 0.93 | 1.01 | 1.00 | 0.99 | 0.86 | |
| CMPA | 0.94 | 1.00 | 1.1 | 1.13 | 0.84 | |
| NSE | EA | 0.36 | 0.44 | 0.78 | 0.61 | 0.27 |
| APHRO-MA | 0.36 | 0.42 | 0.76 | 0.62 | 0.27 | |
| CMPA | 0.38 | 0.47 | 0.81 | 0.67 | 0.25 | |
| PMC | EA | 0.62 | 0.68 | 0.89 | 0.78 | 0.63 |
| APHRO-MA | 0.61 | 0.66 | 0.89 | 0.79 | 0.64 | |
| CMPA | 0.63 | 0.70 | 0.92 | 0.82 | 0.65 | |
| IOA | EA | 0.75 | 0.80 | 0.92 | 0.86 | 0.76 |
| APHRO-Ma | 0.75 | 0.78 | 0.92 | 0.86 | 0.78 | |
| CMPA | 0.75 | 0.82 | 0.95 | 0.90 | 0.77 | |
| NRSE | EA | −0.06 | −0.21 | 0.49 | 0.20 | 0.14 |
| APHRO-MA | −0.06 | −0.23 | 0.47 | 0.21 | 0.14 | |
| CMPA | −0.06 | −0.17 | 0.53 | 0.20 | 0.10 | |
| Hydrologic Station | Liuzhou | Wuzhou | Shijiao | Boluo | |
|---|---|---|---|---|---|
| WBI | 20 km | 0.70 | 1.02 | 0.87 | 0.78 |
| 10 km | 0.82 | 1.00 | 0.90 | 0.87 | |
| NSE | 20 km | 0.62 | 0.93 | 0.80 | 0.22 |
| 10 km | 0.76 | 0.90 | 0.95 | 0.60 | |
| PMC | 20 km | 0.90 | 0.98 | 0.91 | 0.88 |
| 10 km | 0.90 | 0.95 | 0.98 | 0.88 | |
| IOA | 20 km | 0.77 | 0.96 | 0.90 | 0.74 |
| 10 km | 0.90 | 0.95 | 0.98 | 0.84 | |
| NRSE | 20 km | 0.52 | 0.96 | 0.62 | 0.67 |
| 10 km | 0.62 | 0.95 | 0.81 | 0.76 | |
| Hydrologic Station | Liuzhou | Wuzhou | Shijiao | Boluo | |
|---|---|---|---|---|---|
| WBI | 20 km | 0.77 | 1.01 | 0.96 | 1.09 |
| 10 km | 0.66 | 1.09 | 0.88 | 1.04 | |
| NSE | 20 km | −0.08 | 0.61 | 0.74 | −0.67 |
| 10 km | −0.46 | 0.66 | 0.61 | 0.40 | |
| PMC | 20 km | 0.43 | 0.83 | 0.86 | 0.46 |
| 10 km | 0.20 | 0.84 | 0.81 | 0.85 | |
| IOA | 20 km | 0.33 | 0.75 | 0.88 | 0.54 |
| 10 km | 0.08 | 0.88 | 0.83 | 0.87 | |
| NRSE | 20 km | 0.21 | 0.58 | 0.59 | −0.31 |
| 10 km | 0.08 | 0.60 | 0.49 | 0.22 | |
© 2017 by the authors. Licensee MDPI, Basel, Switzerland. This article is an open access article distributed under the terms and conditions of the Creative Commons Attribution (CC BY) license (http://creativecommons.org/licenses/by/4.0/).
Share and Cite
Zhu, Y.; Lin, Z.; Zhao, Y.; Li, H.; He, F.; Zhai, J.; Wang, L.; Wang, Q. Flood Simulations and Uncertainty Analysis for the Pearl River Basin Using the Coupled Land Surface and Hydrological Model System. Water 2017, 9, 391. https://doi.org/10.3390/w9060391
Zhu Y, Lin Z, Zhao Y, Li H, He F, Zhai J, Wang L, Wang Q. Flood Simulations and Uncertainty Analysis for the Pearl River Basin Using the Coupled Land Surface and Hydrological Model System. Water. 2017; 9(6):391. https://doi.org/10.3390/w9060391
Chicago/Turabian StyleZhu, Yongnan, Zhaohui Lin, Yong Zhao, Haihong Li, Fan He, Jiaqi Zhai, Lizhen Wang, and Qingming Wang. 2017. "Flood Simulations and Uncertainty Analysis for the Pearl River Basin Using the Coupled Land Surface and Hydrological Model System" Water 9, no. 6: 391. https://doi.org/10.3390/w9060391