A Case Study of Stratus Cloud Properties Using In Situ Aircraft Observations over Huanghua, China


1
State Key Laboratory of Earth Surface Processes and Resource Ecology, and College of Global Change and Earth System Science, Beijing Normal University, Beijing 100875, China
2
Weather Modification Office of Hebei Province, Shijiazhuang 050021, Hebei, China
*
Author to whom correspondence should be addressed.
Atmosphere 2019, 10(1), 19; https://doi.org/10.3390/atmos10010019
Submission received: 25 November 2018
/
Revised: 27 December 2018
/
Accepted: 3 January 2019
/
Published: 8 January 2019
(This article belongs to the Special Issue The Growth of Atmospheric Droplets)
Abstract
:Cloud liquid water content (LWC) and droplet effective radius (re) have an important influence on cloud physical processes and optical characteristics. The microphysical properties of a three-layer pure liquid stratus were measured by aircraft probes on 26 April 2014 over a coastal region in Huanghua, China. Vertical variations in aerosol concentration (Na), cloud condensation nuclei (CCN) at supersaturation (SS) 0.3%, cloud LWC and cloud re are examined. Large Na in the size range of 0.1–3 μm and CCN have been found within the planetary boundary layer (PBL) below ~1150 m. However, Na and CCN decrease quickly with height and reach a level similar to that over marine locations. Corresponding to the vertical distributions of aerosols and CCN, the cloud re is quite small (3.0–6 μm) at heights below 1150 m, large (7–13 μm) at high altitudes. In the PBL cloud layer, cloud re and aerosol Na show a negative relationship, while they show a clear positive relationship in the upper layer above PBL with much less aerosol Na. It also shows that the relationship between cloud re and aerosol Na changes from negative to positive when LWC increases. These results imply that the response of cloud re to aerosol Na depends on the combination effects of water-competency and collision-coalescence efficiency among droplets. The vertical structure of aerosol Na and cloud re implies potential cautions for the study of aerosol-cloud interaction using aerosol optical depth for cloud layers above the PBL altitude.
1. Introduction
Stratus clouds, with about 24% global area coverage [1], have been the focus of many studies due to their significant influence on surface radiation budget [2,3,4,5,6]. By reflecting solar radiation back to space, stratus clouds, particularly marine stratus over low-reflecting oceans, have a significant cooling effect on the radiation budget at both the surface and top of the atmosphere (TOA). Globally, stratus clouds account for about 60% of the total, which is about 15 W m−2 net cooling, TOA radiation balance [7]. It is thus essential to examine and understand the properties of stratus clouds.
To obtain stratus cloud properties, in-situ aircraft, ground-based, and spaceborne remote sensing observations have been carried out. The long-term satellite and ground site observations provide possibilities for studies on cloud climatology, evaluation, and improvement of climate models. Evaluations of the ground-based and spaceborne cloud retrieval algorithms and studies of cloud processes often require in-situ aircraft observations of cloud properties. Each type of observation, however, has its own uncertainties, as indicated by the authors of [8,9].
Observational studies on stratus cloud properties have been carried out over various locations. Most of these studies are for marine stratus clouds, continental boundary layer stratus clouds, and Arctic stratus clouds [10,11,12,13,14,15]. In general, due to less aerosol loading in marine areas, marine stratus clouds have larger effective radii (re) and less droplet number concentrations (Nc) [8,16]. The effect of increasing Nc and decreasing re due to the increase of aerosol amount when cloud liquid water content (LWC) is fixed, is defined as aerosol first indirect effect, cloud albedo effect (CAE), or Twomey effect [17]. For most observations, the stratus cloud re mainly lies between 5 μm and 15 μm over the marine region, 3 μm and 12 μm over the US continental regions, and 5 μm and 20 μm in the Arctic [8]. This spatial distribution is likely associated with the variation in available water amount and aerosol pollution [8].
There are limited studies on the in-situ aircraft observations of cloud properties over regions in China, although many in situ aircraft observation studies on stratus cloud properties exist for other areas. Geography could have a large impact on stratus cloud properties as a result of two factors: Variations in the source and abundance of cloud condensation nuclei (CCN), and indirectly, the fundamental dependence on temperature of the adiabatic release rate of the condensate, as indicated by [18]. Here, the temperature dependence of release rate of the condensate means the condensational growth of cloud droplets with decreasing temperature during their updraft with the assumption of adiabatic process. Thus, the stratus cloud properties over China regions could differ much from those over other locations. Several studies [19,20,21,22] have examined stratus cloud properties over Chinese land areas such as Beijing, Yan’an and Hebei, based on very limited aircraft observations, which have mainly shown the characteristics of cloud droplet size distribution and liquid water content over these areas. In contrast, this study provides a case study about the coastal stratus clouds over Huangha, China, using observations from one flight. Implications from the findings of cloud properties are also discussed.
2. Instrument and Measurements
The Hebei Province Weather Modification Office Yun-14 Turboprop Transport Aircraft was used for the observation of aerosol and clouds in this experiment, same as that used by [22]. Instruments that were equipped in this aircraft include a Particle Measuring Systems (PMS) Forward Scattering Spectrometer Probe (FSSP-100), a PMS two-dimensional cloud (2DC) optical array probe, a two-dimensional grey cloud probe (2DGC), a two-dimensional precipitation probe (2DP), a Passive Cavity Aerosol Spectrometer Probe (PCASP) Model 100, a Cloud Condensation Nuclei (CCN) counter, and a thermometer.
There are four size ranges in terms of diameter for the particles measured by the FSSP. In this study, the FSSP measure range is set with sizes between 2 μm and 45.5 μm. However, due to the potential droplet shatter contamination, we did not choose the first size bin below 3.5 μm. Yet, the droplet Nc could still be somehow contaminated by the shatter artifacts, particularly when large droplets exist, which introduces additional errors to the FSSP observations. Actually, FSSP tends to overestimate the relative proportion of small droplets in the two first size bins [23]. Based on FSSP observation, the cloud droplet Nc is calculated by integrating the cloud droplet number concentration in each size bin from 3.5 μm to 45.5 μm, and the cloud droplet re and LWC are calculated as:
where d and N(d) are the mean droplet diameter and droplet number concentration in each size bin, respectively, ρ is liquid water density. There are totally 14 size bins between 3.5 μm and 45.5 μm. While it was indicated that the FSSP measurements of droplet size are accurate to 17% and LWC is accurate to within 34% [24], additional errors could exist in cloud droplet Nc, re and LWC, particularly due to the shatter artifact. Considering that the clouds observed in this study are liquid phase stratus clouds, which generally have a diameter size range between 2 μm and 40 μm, only measurements from the FSSP are used. The particle size distributions from 2DC (33–1056 μm), 2DGC (30–1920 μm) and 2DP (200–6400 μm) are not adopted in this study for the calculation of Nc, re and LWC. Each year, these instruments are calibrated by the instrument company. For example, for the FSSP instrument, it is essential to calibrate the relationship between the glass-bead diameter and water-droplet diameter, which has been discussed in other studies [25,26].
PCASP measures the aerosol particle size distribution (PSD) with 15 size bins from 0.1 μm to 3.0 μm. The aerosol PSD measured by the PCASP is derived from the aerosol particle light scattering intensity with Mie scattering theory. The PCASP is calibrated with polystyrene latex (PSL) aerosol particles with a refractive index (RI) of 1.59. However, the Mie scattering theory is used to generate the particle concentration in each size bin at RI = 1.55, a value slightly more representative of continental aerosol. Every year, PCASP is calibrated by comparing with the particle size distributions measured from Scanning Mobility Particle Sizer Spectrometer (SMPS), to ensure its consistency with the SMPS on average. Generally, the accuracy of measurements is 20% and 16% in particle size and concentration, respectively [22]. The aerosol concentration Na is calculated in this study by integrating the PCASP aerosol concentration within the 15 bins. In other words, Na is just for aerosols in a size range between 0.1 and 3.0 μm, which could be significantly less than the true total aerosol concentration, considering that there is a large fraction of aerosol with sizes less than 0.1 μm. On the other hand, the shatter of droplets could make the Na with additional uncertainties when measured in clouds. Evaporation of cloud droplets related to the heating in the PCASP or aerosol inlet can also contribute to aerosol detected in cloud, for which both complete and partial evaporation are possible [27]. Uncertainties associated with droplets shatter and evaporation are not investigated in this study.
Similar to the aerosol concentration, the CCN concentration measured by the CCN counter could also be contaminated by the cloud droplet shatter artifact, particularly when cloud droplets are large. The impacts of droplet shatter artifact are not counted in our analysis, while they could make CCN larger than the truth. For CCN counter, the supersaturation rate and Optical Particle Counter (OPC) are calibrated annually by the DMT company, and the flow sensors are calibrated using a flow meter and soap bubble unit before this flight experiment. The CCN concentration measured in this study is under a supersaturation (SS) of 0.3%. The thermometer is used for air temperature observation, which has been corrected for the dynamic heating.
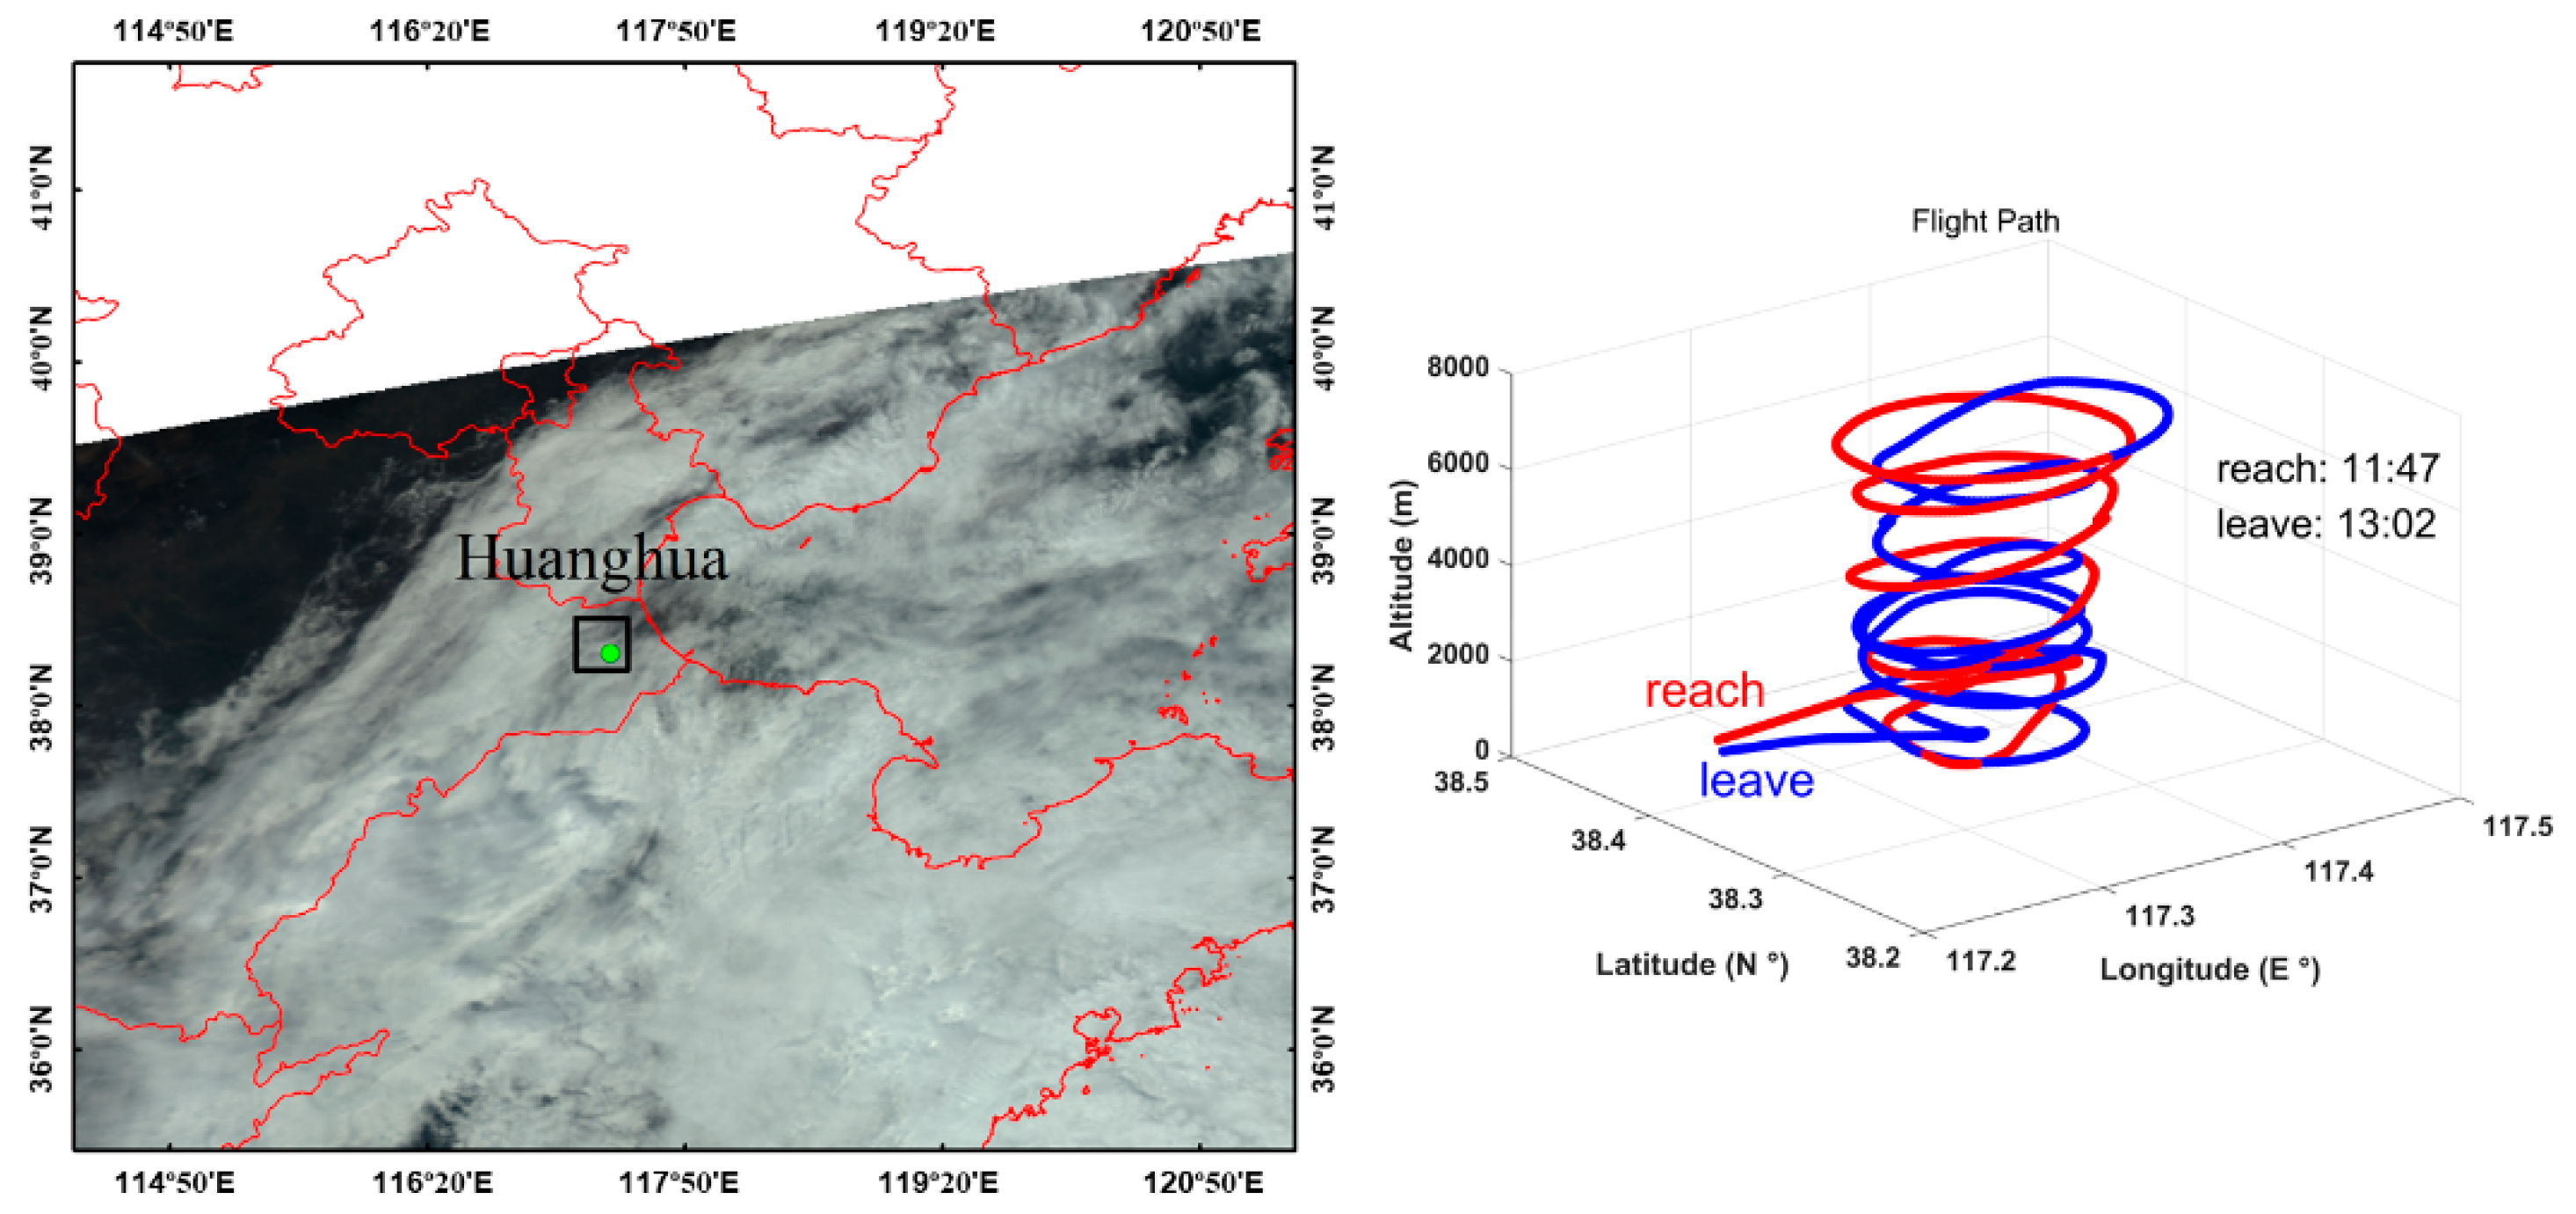
Only one 3-h mission was carried out during this field experiment. The flight started from Shijiazhuang city at 10:30 local time (LT), reached over Huanghua region at about 11:30 LT, made 1-h observation over Huanghua region, and flew back to ShiJiaZhuang at 13:30 LT on 26 April 2014. Figure 1 (left) shows the satellite map of clouds from the Moderate Resolution Imaging Spectroradiometer (MODIS) at 10:30 LT on the same day, from which we can see clearly that the clouds are overcast stratus clouds, along with the region (rectangle region) that aircraft made observations. Figure 1 (right) shows the flight tracks, including a spiral flight pattern from a low height of 600 m to a high level of 6900 m which was designed and carried out on 26 April 2014 over Huanghua, Hebei. This study focuses on cloud observations during the spiral flight period over Huanghua between 11:55 and 12:15 LT when the aircraft moves slowly with average ascent rate ~200 feet per minute from low level at 600 m to high levels up to 6900 m.
3. Analysis and Results
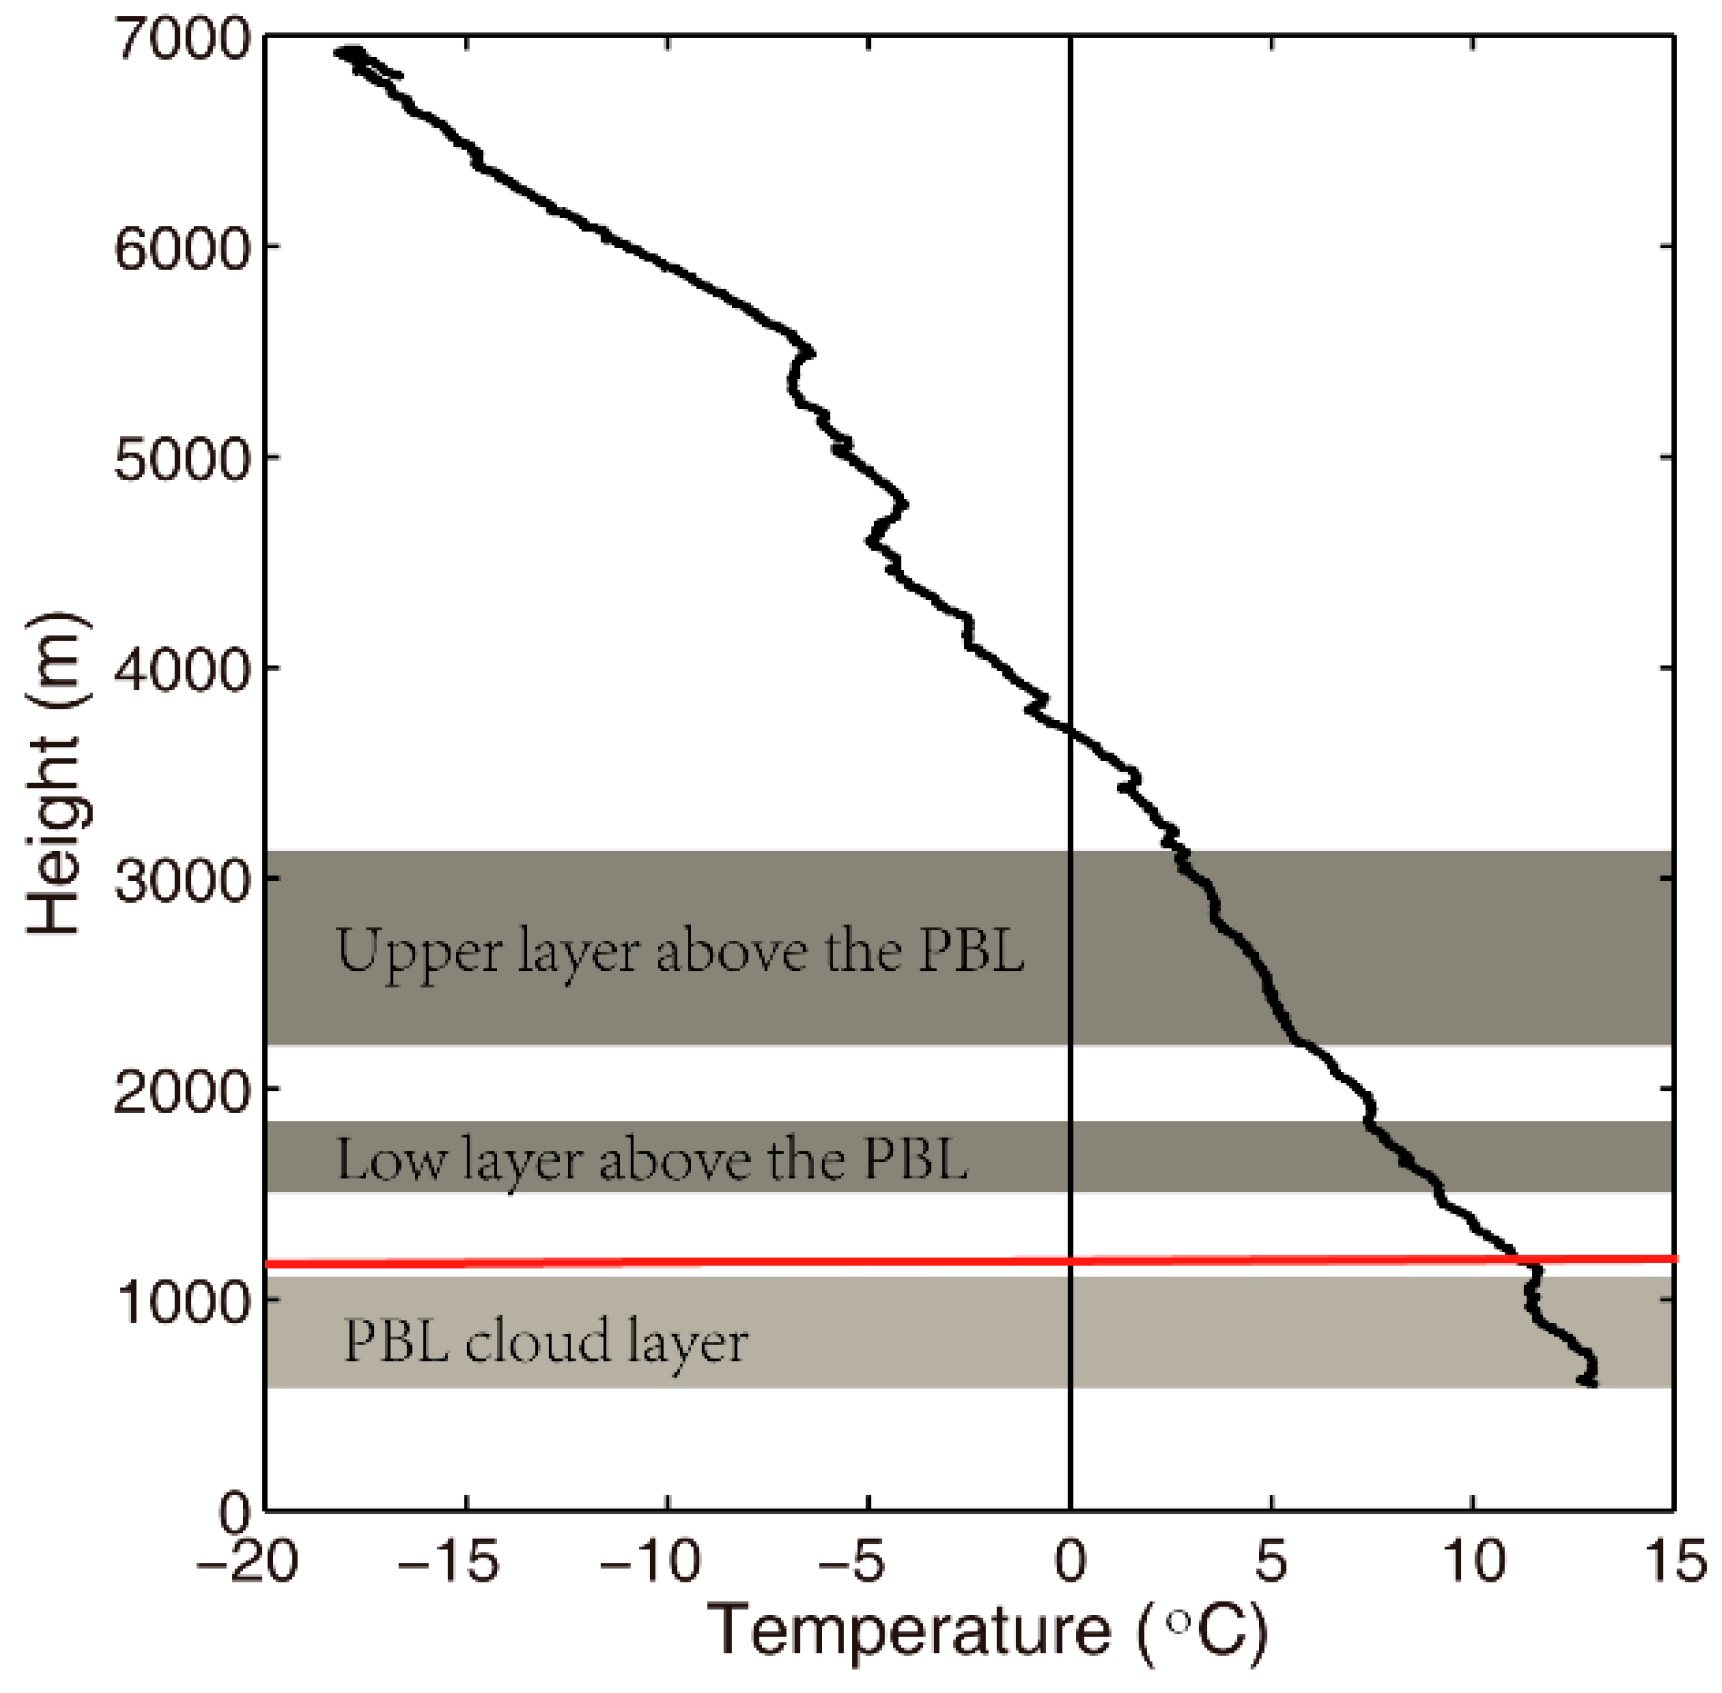
Same as [22,28,29], cloud bases and tops were determined as the lowest and highest altitudes for a continuous layer where Nc is larger than 10 cm−3 and LWC is larger than 0.001 g/m3. Three layers of clouds were found at heights below 1150 m, 1750–2050 m, and 2200–3120 m, respectively, which are illustrated in Figure 2 with gray colors. No clouds were found above these three cloud layers. The cloud base for the lowest cloud layer cannot be determined since the aircraft was still in the clouds when it reached the lowest flying height of 600 m. Figure 2 shows the profile of in-situ observed atmospheric temperature from the thermometer on the aircraft, which provides the basis for cloud phase determination in this field campaign study. The atmosphere temperature is above 0 °C for heights below 3750 m, and below 0 °C for heights above 3750 m. Therefore, this cloud with maximum top below 3200 m is pure liquid phase stratus cloud without the presence of ice particles. A weak inversion layer can be seen at a height around 1200 m (red line in Figure 2), indicating the likely height of the planetary boundary layer at that period over Huanghua on 26 April in 2014. Considering that the top of the lowest cloud layer is below the PBL altitude, the three cloud layers are denoted as the PBL cloud layer, low layer above the PBL, and upper layer above the PBL in this study.
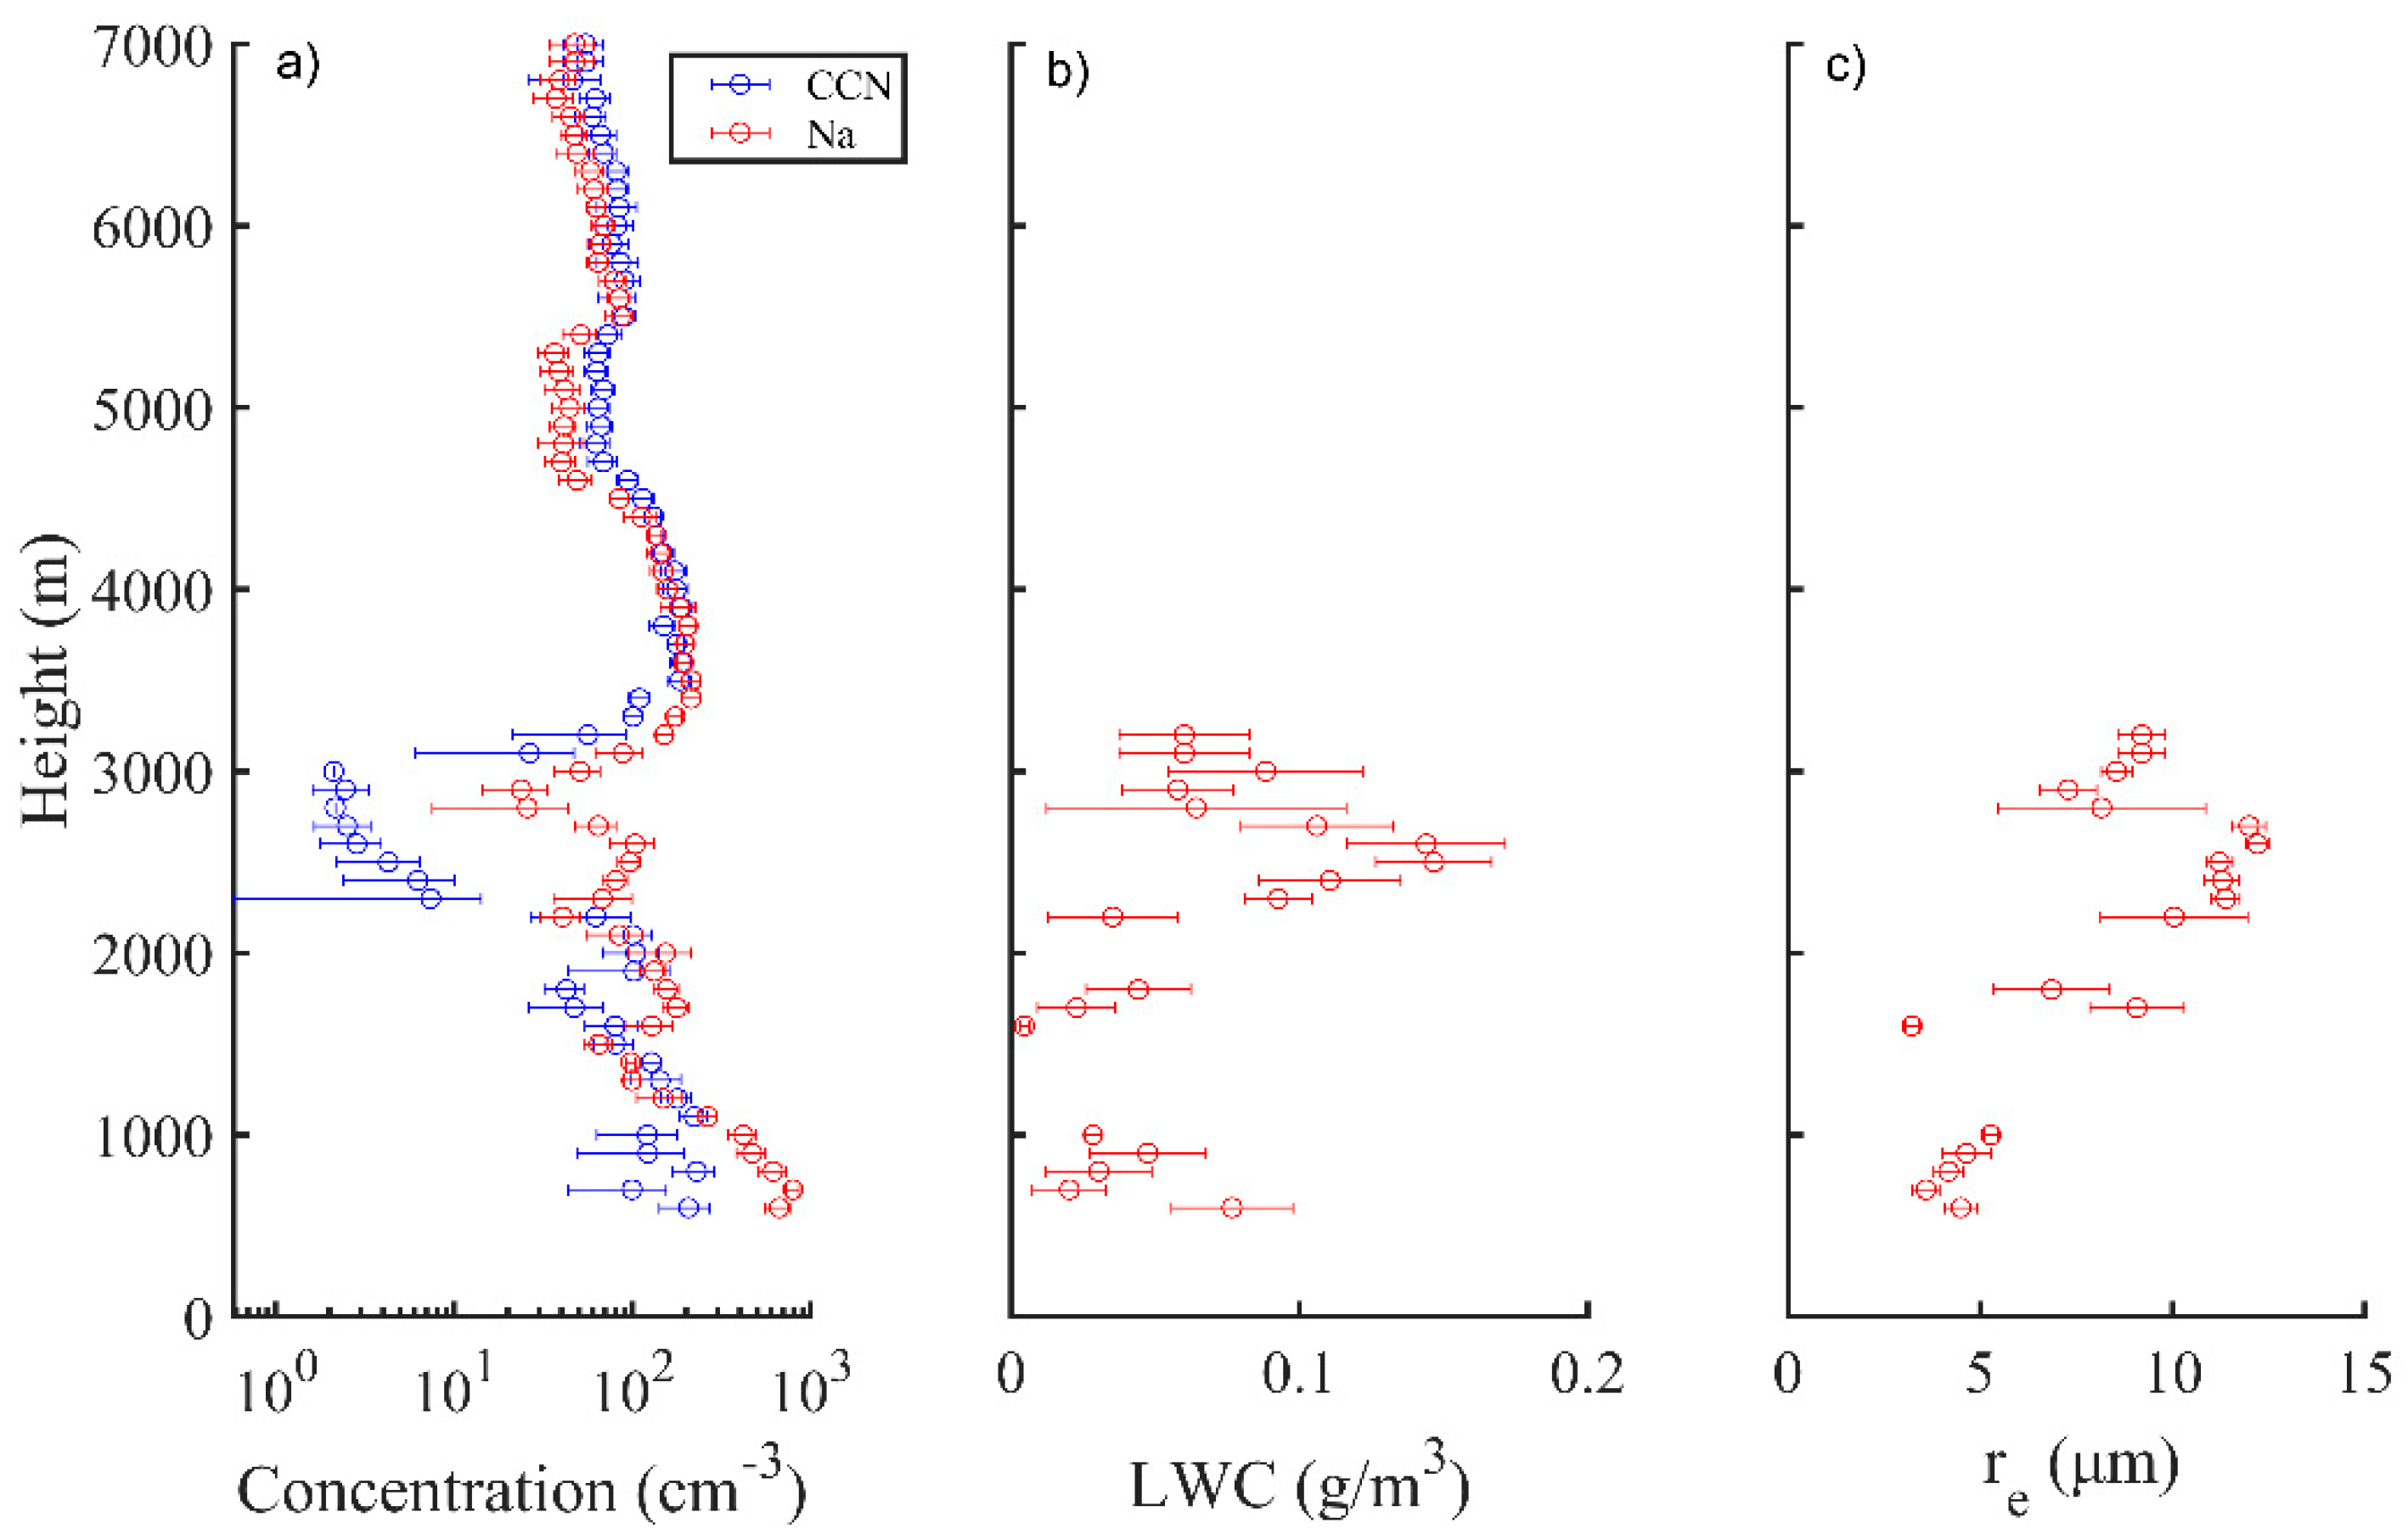
Figure 3 shows the vertical profiles of aerosol concentration (Na) from PCASP, CCN at SS = 0.3%, cloud LWC, and cloud droplet re. For heights below the PBL height of around 1200 m, Na is high with values between 300 and 900 cm−3 even for size range between 0.1 and 3 μm. Actually, Na with a broader size range such as between 10 nm and 3 μm can be as large as several 104 cm−3 in most regions of China [30,31,32,33]. There is a sharp decrease in Na around the top of PBL, which can be easily seen in clear air in the aircraft since the horizontal visibility has a sharp change between below and above the PBL height. A similar vertical exponential declining trend of aerosol Na was found over Beijing by [34]. At heights around 2900–4700 m, there is a layer with high Na, which could come from long-range transport. Further back trajectory analysis using the NOAA HYSPLIT model shows that the aerosol particles at this layer mainly come from east China region (~50–100 km south of the observation location) at 12:00 LT on 26 April 2014. The vertical variation of CCN at SS = 0.3% is similar as that of aerosol Na. Interestingly, the CCN at SS = 0.3% at some heights are even larger than the Na. This should be related to the measurable size range of 0.1–3 μm for aerosols by the PCASP: when there are considerable particles with sizes below 0.1 μm that can serve as CCN, observed CCN could be larger than the Na from PCASP. Note that the CCN at SS = 0.3% could also have large uncertainties when measured within clouds due to the cloud droplet shatter on the inlet surfaces [35,36,37,38], particularly for those large droplets.
Different from cumulus clouds, which generally have large cloud LWC [28], the LWC observed here (Figure 3b) is generally low with values below 0.2 g/m3. The LWC varies little with height for PBL cloud layer. By contrast, LWC above the PBL generally increases with height before reaching height 2650 m, consistent with many in-situ observations for liquid and mixed phase clouds at relatively clean regions [10,39,40,41]. It is likely caused by the condensation of water vapor with decreasing temperature for higher altitudes. After 2650 m, LWC shows a decreasing trend with height. While the reason is not clear, it is very likely caused by the air entrainment and detrainment. The dry air which enters clouds by entrainment helps droplet evaporate, making cloud droplets become smaller. Moreover, the wet air escape from clouds by detrainment, also making cloud droplets smaller. Statistically, LWC observed here mainly lies between 0.001 and 0.2 g m−3. This LWC range is roughly consistent with in-situ stratus cloud observations over other locations [11,42,43,44,45,46].
Different from cloud LWC, there are large vertical variation of cloud droplet re (Figure 3c). The cloud droplet radii are around 3–5 μm for the low cloud layer with tops below 1150 m, much smaller than those (7–13 μm) above PBL altitude. This could be a result of vertical changes of both aerosols and temperature. Decreasing temperature with height helps increase cloud droplet radii through the cloud condensation process. Moreover, decreasing the aerosol amount makes the cloud droplet size increase without too strong water competition among them. For these stratus clouds, there is no strong vertical velocity and the aerosols are mainly concentrated within the PBL, making the PBL cloud layer strongly affected by aerosols while layers above the PBL are not. Table 1 shows the mean and standard deviations (std) of aerosol Na, CCN, and cloud Nc in PBL cloud layer, low layer above the PBL, and upper layer above the PBL for the three-layer stratus cloud measured over Huanghua, China on 26 April 2014. Quantitatively, there are large Na, CCN and Nc concentrations within PBL altitude, which are around 300–800 cm−3, 150–300 cm−3, and 150–500 cm−3, respectively. By contrast, most Na and CCN concentrations are less than 200 cm−3, 100 cm−3, and 200 cm−3 at heights above PBL altitude, respectively. By assuming that the cloud droplet properties in the PBL cloud layer and upper layer above the PBL are for polluted and clean conditions, respectively, the effective radius is about 10–80% smaller in polluted than in clean conditions. Note that cloud re varies a lot with large standard deviation within the low layer above the PBL, which is likely associated with the relatively strong entrainment and detrainment effects due to its small thickness. The entrainment and detrainment occur more frequently around the boundaries between the clouds and air. Moreover, the entrainment and detrainment often make dry air mix with the cloud parcels inhomogeneously in stratocumulus clouds [47], further causing large variations of cloud re within this low layer above the PBL.
For cloud layers above PBL altitude, cloud droplet radii are mainly between 7 and 13 μm, consistent with many marine boundary layer clouds [6,48,49]. Similarly, the aerosol Na (0.1–3 μm) is also low (<200 cm−3) and consistent with those at clean marine areas [6]. Similar to many liquid and mixed-phase clouds observed by in situ aircraft, the cloud droplet re measured above PBL altitude here increases with height below 2650 m. All these characteristics imply that cloud properties of upper layer above the PBL are similar to those of marine stratus clouds without significant impacts by aerosols, different from the PBL cloud layer observed in this study.
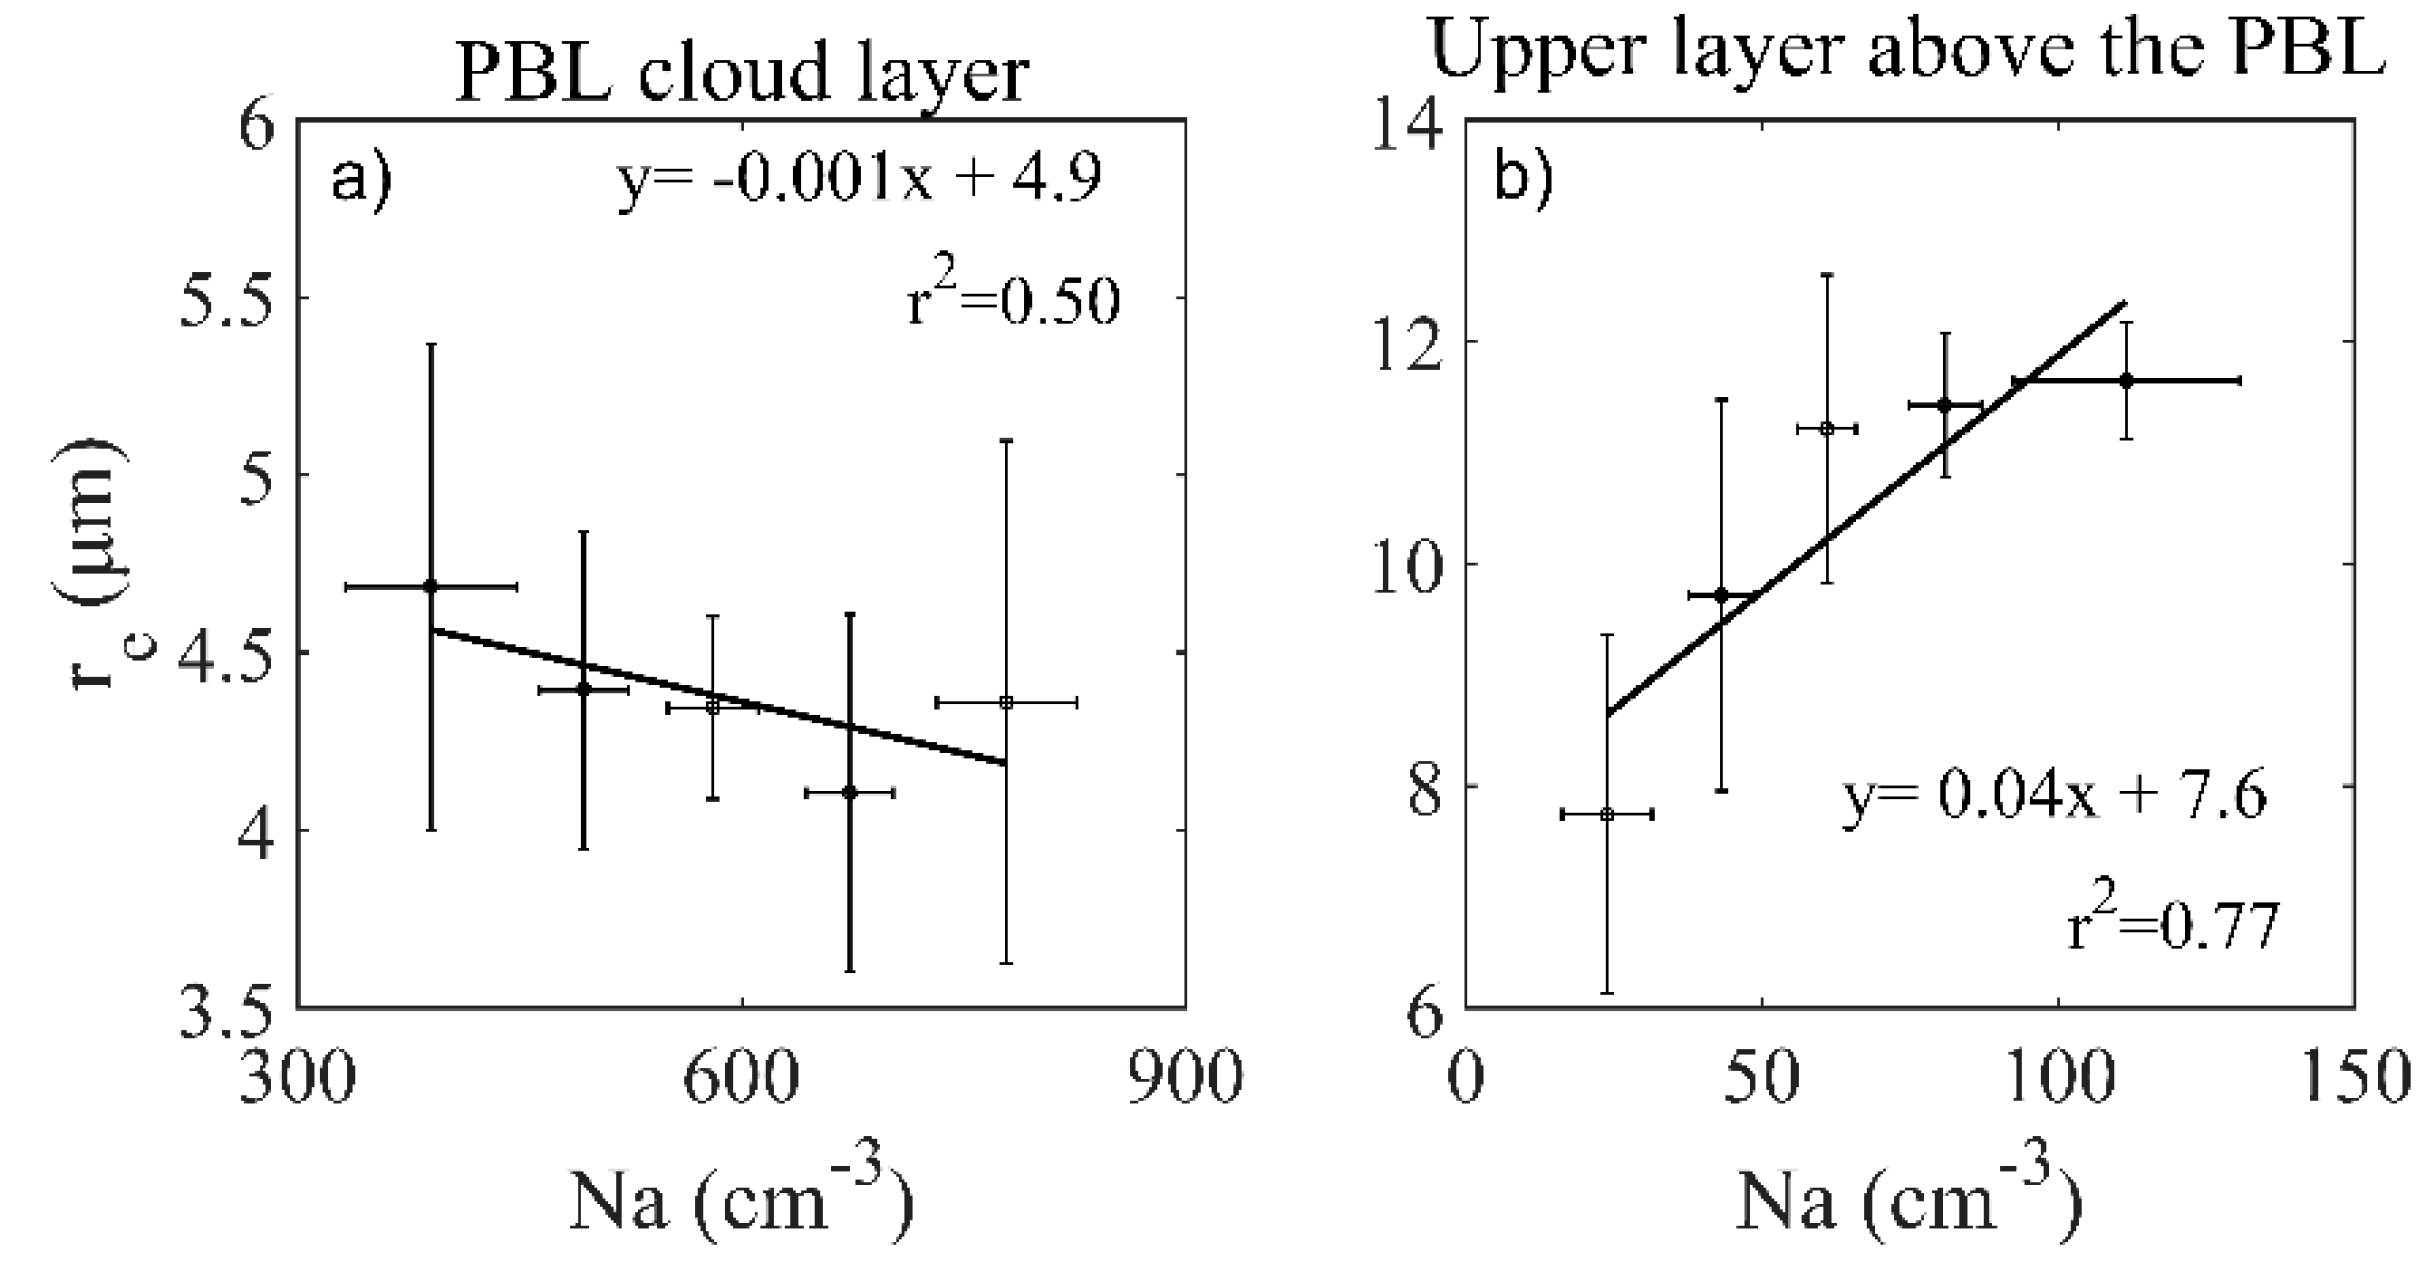
To investigate the potential impacts of aerosols on cloud properties, Figure 4 shows the variation of bin-averaged cloud droplet re with Na for the PBL cloud layer and the upper layer above the PBL. For each layer, the observations are divided into five bins with the same sample volume based on aerosol Na. For PBL cloud layer shown in Figure 4a, the 5 bins are 260–446 cm−3, 460–540 cm−3, 540–618 cm−3, 626–705 cm−3, and 714–855 cm−3; for upper layer above the PBL in Figure 4b, the 5 bins are 8–35 cm−3, 35–53 cm−3, 54–69 cm−3, 70–93 cm−3, and 93–190 cm−3. The fitting functions shown in Figure 4 are all linearly regressed based on the bin averages of Na and re, and the bars represent the standard deviations of Na (horizontal) and re (vertical) for each bin. Associated with the high Na within the PBL, the PBL cloud layer droplet re is very small with a layer average mean value around 4.5 μm. A weak but clear negative relationship (r2 = 0.50) is found between cloud droplet re and Na for PBL cloud layer, which should be associated with the water-competing effect of droplets with weak LWC in PBL cloud layer. This is consistent with the Twomey effect [8,16,17,22,50,51,52]. By contrast, we can see a clear positive relationship (r2 = 0.77) between cloud droplet re and aerosol Na in the upper layer above the PBL, opposite to the Twomey effect. This should be related to the much fewer aerosols and relatively larger LWC in the upper layer above the PBL, making the competence effect much weaker and collision-coalescence more effective among the droplets. If we examine the whole cloud, we can also find a clear negative relationship (not shown here) between cloud droplet re and aerosol Na. However, for the whole cloud, the negative relationship is more likely related to the opposite vertical distributions of cloud droplet re and aerosol Na, not only the effect of aerosols on the cloud droplet microphysical properties.
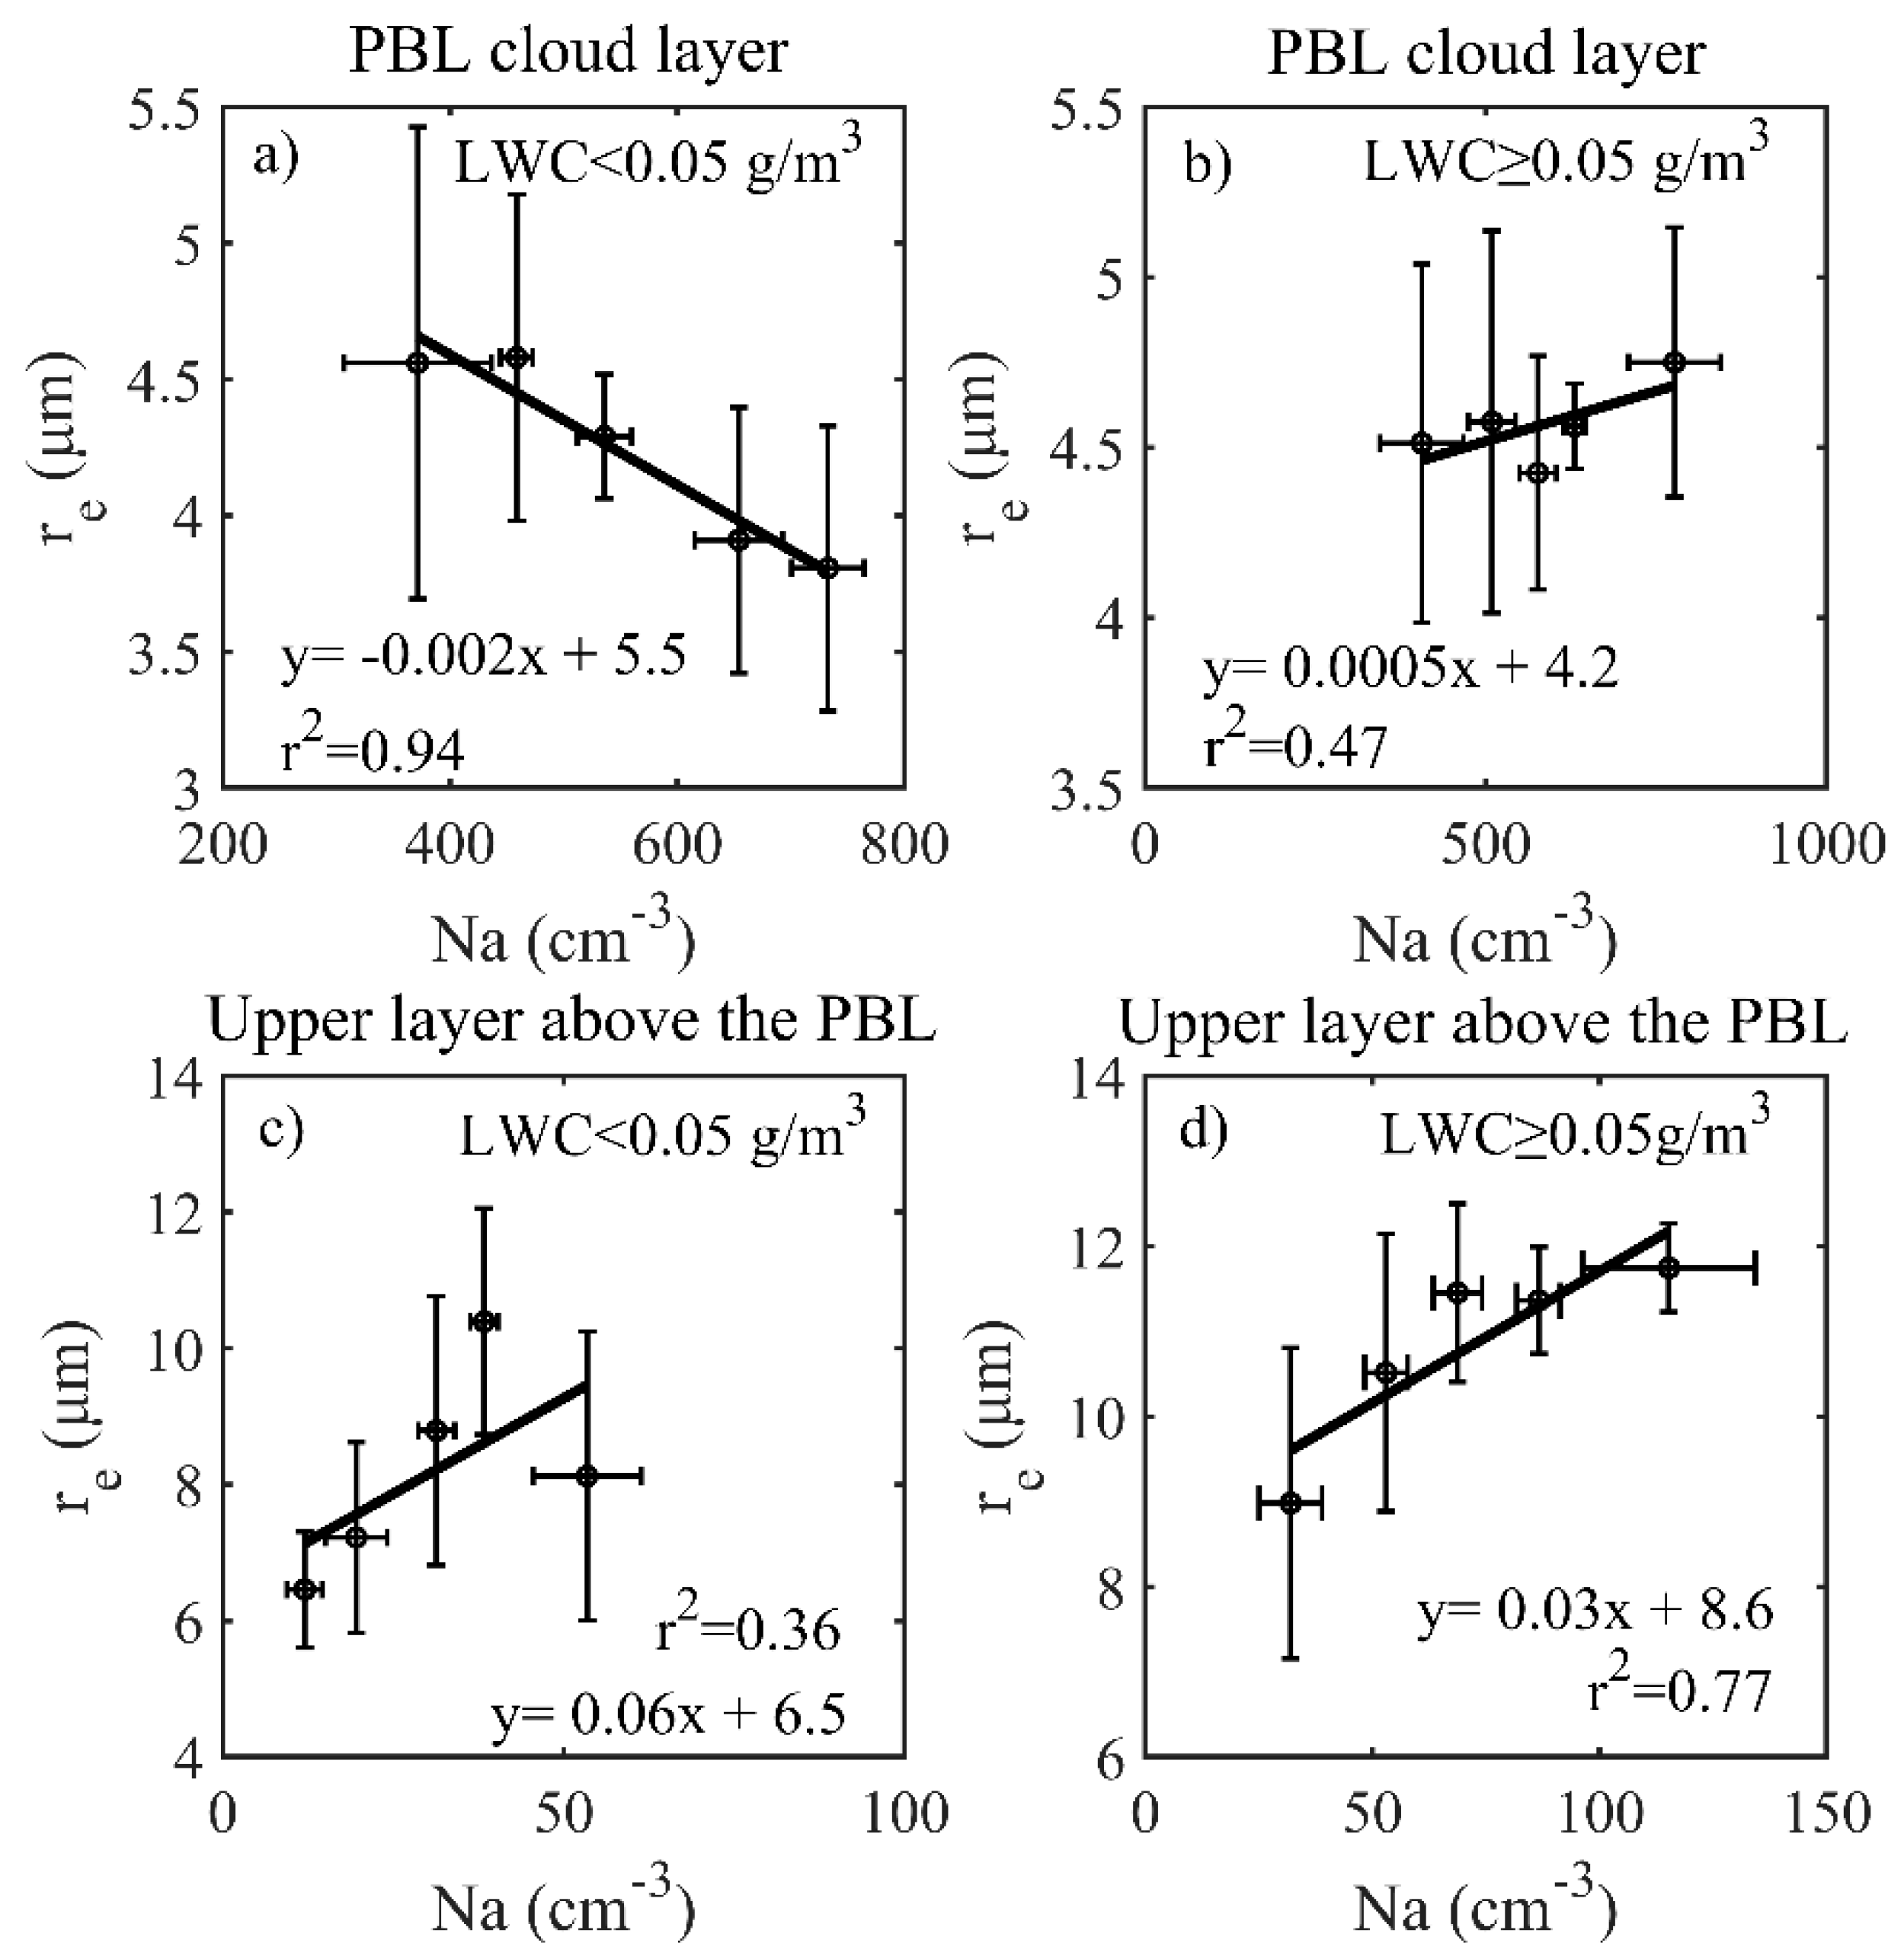
Figure 5 further shows the relationship between bin average cloud droplet re and bin average aerosol Na under both low and high LWC conditions for PBL cloud layer and upper layer above the PBL. Same as Figure 4, the five bins are divided based on aerosol Na with the same sample volume. For the PBL cloud layer, the five bins are 261–422 cm−3, 444–478 cm−3, 500–560 cm−3, 606–696 cm−3, 699–784 cm−3 when LWC < 0.05 g/m3, and 322–470 cm−3, 470–543 cm−3, 550–608 cm−3, 617–652 cm−3, 678–852 cm−3 when LWC ≥ 0.05 g/m3. For the upper layer above the PBL, the five bins are 8–16 cm−3, 16–28 cm−3, 29–36 cm−3, 36–41 cm−3, 46–66 cm−3 when LWC < 0.05 g/m3, and 19–44 cm−3, 44–60 cm−3, 60–78 cm−3, 78–95 cm−3, 95–189 cm−3 when LWC ≥ 0.05 g/m3. For the PBL cloud layer, there is a clear negative relationship (r2 = 0.94) between cloud re and aerosol Na under low LWC condition, while a weak but clear positive relationship (r2 = 0.47) is found under relatively high LWC condition. Consistent with what we previously proposed [53], with the increase of LWC, the competence effect among cloud droplets becomes weak and the collision-coalescence efficiency increases, the relationship between cloud droplet re and aerosol Na changes from negative to positive. The positive relationship could become even stronger when Na is less and/or LWC is higher. The results shown in Figure 5c,d for the upper cloud layer above the PBL exactly illustrate this. For the upper layer above the PBL, significant positive relationships between cloud re and aerosol Na are found under both low (r2 = 0.36) and high LWC (r2 = 0.77) conditions. The slopes are 0.06 when Na is much less (Figure 5c) and 0.03 (Figure 5d) when Na is relatively less than that shown in Figure 5b, which are both larger than the positive slope of 0.0005 shown in Figure 5b.
4. Conclusions
Vertical properties of one three-layer stratus cloud are investigated in this study based on a one-hour flight observation over a region in Huanghua, China on 26 April 2014. The three layers are at heights below 1150 m, 1750–2050 m, and 2200–3120 m, respectively. A profile of the temperature indicates that all of these three layers of cloud are in liquid phase. In addition, the temperature profile shows a PBL altitude of around 1200 m.
There is a sharp decrease in aerosol Na around the top of PBL, and the vertical variation of CCN at SS = 0.3% are similar as that of aerosol Na. The LWC varies little with height for observed PBL cloud layer. By contrast, LWC above the PBL generally increases with height, which is likely caused by the condensation of water vapor with decreasing temperature for higher altitudes. Different from cloud LWC, there are large vertical variation of cloud droplet re: 3–5 μm for the PBL cloud layer with tops below 1150 m, 7–13 μm for layers above the PBL altitude. This could be associated with vertical variation of both aerosols and temperature. For these stratus layers, there are no strong vertical velocities and the aerosols are mainly concentrated within the PBL, making the PBL cloud layer to be strongly affected by aerosols. By assuming that the cloud droplet properties in the PBL cloud layer and the upper layer above the PBL are for polluted and clean conditions, respectively, the effective radius is about 10–80% smaller in polluted than in clean stratus clouds.
Associated with the different amounts of aerosols, the sensitivity of cloud properties to aerosols varies a lot with heights based on our case study. There is a clear negative relationship between cloud droplet re and aerosol Na in the PBL cloud layer, consistent with the Twomey effect, particularly when LWC is low. When LWC is large, the relationship between cloud droplet re and aerosol Na changes from negative to positive. Moreover, a positive relationship between cloud droplet re and aerosol Na is found in the upper layer above the PBL when aerosol Na is low. These imply that the relationship between cloud droplet re and aerosol Na depends on the combination effect of water-competency and collision-coalescence among droplets.
The vertical structure of aerosol Na and cloud droplet re also implies potential cautions for the study of aerosol first indirect effect using aerosol optical depth (AOD): clouds with bases below the PBL altitude, instead of those with bases above the PBL altitude, are more related to the column aerosols which are more concentrated within the PBL. Considering that satellite often measures cloud properties in the top layer with passive remote sensors, it could be problematic to study aerosol’s first indirect effect by using satellite based cloud properties and aerosol column optical depths for clouds with tops much higher than the PBL altitude.
Author Contributions
Data curation, X.D.; Formal analysis, L.Z.; Funding acquisition, C.Z.; Methodology, L.Z.; Resources, C.Z.; Supervision, C.Z.; Writing–Original draft, C.Z.; Writing–Review & editing, C.Z.
Funding
This research was funded by the Ministry of Science and Technology of China National Key R&D Program on Monitoring, Early Warning and Prevention of Major Natural Disasters (2017YFC1501403), the National Natural Science Foundation of China (91837204, 41575143), the State Key Laboratory of Earth Surface Processes and Resources Ecology (2017-ZY-02), the Fundamental Research Funds for the Central Universities (2017EYT18), and the Scientific Research Foundation for the Returned Overseas Chinese Scholars, State Education Ministry.
Acknowledgments
We thank the three anonymous reviewers for their invaluable comments that helped us improve the quality of this paper. The data used in this study are available on request from Chuanfeng Zhao through [email protected].
Conflicts of Interest
The authors declare no conflict of interest.
References
- Warren, S.G.; Hahn, C.J.; London, J.; Chervin, R.M.; Jenne, R.L. Global Distribution of Total Cloud Cover and Cloud Type Amounts over the Ocean; NCAR Tech. Notes TN-317+STR or DOE/ER-0406; NCAR: Boulder, CO, USA, 1988. [Google Scholar]
- Manabe, S.; Wetherald, R.T. Thermal equilibrium of the atmosphere with a given distribution of relative humidity. J. Atmos. Sci. 1967, 24, 241–259. [Google Scholar] [CrossRef]
- Schneider, S.H. Cloudiness as a global climatic feedback mechanism: The effects on the radiation balance and surface temperature of variations in cloudiness. J. Atmos. Sci. 1972, 29, 1413–1422. [Google Scholar] [CrossRef]
- Ramanathan, V.; Cess, R.D.; Harrison, E.F.; Minnis, P.; Barkstrom, B.R. Cloud-radiative forcing and climate: Results from the Earth radiation budget experiment. Science 1989, 243, 57–63. [Google Scholar] [CrossRef] [PubMed]
- Harrison, E.F.; Minnis, P.; Barkstrom, B.R.; Ramanathan, V.; Cess, R.D.; Gibson, G.G. Seasonal variation of cloud radiative forcing derived from the Earth radiation budget experiment. J. Geophys. Res. 1990, 95, 18687–18703. [Google Scholar] [CrossRef]
- Sporre, M.K.; Glantz, P.; Tunved, P.; Swietlicki, E.; Kulmala, M.; Lihavainen, H. A study of the indirect aerosol effect on subarctic marine liquid low-level clouds using MODIS cloud 30 data and ground-based aerosol measurements. Atmos. Res. 2012, 116, 56–66. [Google Scholar] [CrossRef]
- Hartmann, D.L.; Ockert-Bell, M.E.; Michelsen, M.L. The effects of cloud type on the Earth’s energy balance: Global analysis. J. Clim. 1992, 5, 1281–1304. [Google Scholar] [CrossRef]
- Zhao, C.; Xie, S.; Stephen, A.K.; Protat, A.; Shupe, M.D.; McFarlane, S.A.; Comstock, J.M.; Delanoë, J.; Deng, M.; Dunn, M.; et al. Toward understanding of differences in current cloud retrievals of ARM ground-based measurements. J. Geophys. Res. 2012, 117, D10206. [Google Scholar] [CrossRef]
- Zhao, C.; Xie, S.; Chen, X.; Jensen, M.P.; Dunn, M. Quantifying uncertainties of cloud microphysical property retrievals with a perturbation method. J. Geophys. Res. Atmos. 2014, 119, 5375–5385. [Google Scholar] [CrossRef] [Green Version]
- Miles, N.L.; Verlinde, J.; Clothiaux, E.E. Cloud droplet size distributions in low-level stratiform clouds. J. Atmos. Sci. 2000, 57, 295–311. [Google Scholar] [CrossRef]
- Lawson, R.P.; Baker, B.A.; Schmitt, C.G. An overview of microphysical properties of Arctic clouds observed in May and July 1998 during FIRE ACE. J. Geophys. Res. 2001, 106, 14989–15014. [Google Scholar] [CrossRef] [Green Version]
- Dong, X.; Minnis, P.; Xi, B. A climatology of midlatitude continental clouds from the ARM SGP central facility: Part I: Low-level cloud macrophysical, microphysical, and radiative properties. J. Clim. 2005, 18, 1391–1410. [Google Scholar] [CrossRef]
- Lu, M.L.; Conant, W.C.; Jonsson, H.H.; Varutbangkul, V.; Flagan, R.C.; Seinfeld, J.H. The Marine Stratus/Stratocumulus Experiment (MASE): Aerosol-cloud relationships in marine stratocumulus. J. Geophys. Res. 2007, 112, D10209. [Google Scholar] [CrossRef]
- Dong, X.; Xi, B.; Crosby, K.; Long, C.N.; Stone, R. A 10 year climatology of Arctic cloud fraction and radiative forcing at Barrow, Alaska. J. Geophys. Res. 2010, 115, D12124. [Google Scholar] [CrossRef]
- Garrett, T.J.; Zhao, C. Ground-based remote sensing of thin clouds in the Arctic. Atmos. Meas. Tech. 2013, 6, 1227–1243. [Google Scholar] [CrossRef] [Green Version]
- Garrett, T.J.; Zhao, C.; Dong, X.; Mace, G.G.; Hobbs, P.V. Effects of Long-Range Pollution Transport on North American Arctic Stratus. Geophys. Res. Lett. 2004, 31, L17105. [Google Scholar] [CrossRef]
- Twomey, S. The influence of pollution on the shortwave albedo of clouds. J. Atmos. Sci. 1977, 34, 1149–1152. [Google Scholar] [CrossRef]
- Sassen, K.; Mace, G.G.; Wang, Z. Continetal stratus clouds: A case study using coordinated remote sensing and aircraft measurements. J. Atmos. Sci. 1999, 56, 2345–2358. [Google Scholar] [CrossRef]
- Wang, Y.F.; Lei, H.C.; Wu, Y.X.; Xiao, W.A.; Zhang, X.Q. Size distributions of the water drops in the warm layer of stratiform clouds in Yanan. J. Nanjing Inst. Meteorol. 2005, 28, 787–793. [Google Scholar]
- Zhao, Z.L.; Mao, J.T.; Wei, Q.; Ying, Y.J.; Wang, L.; Han, Z.G.; Li, C.C. A study of vertical structure of spring stratiform clouds in Northwest China. Meteorol. Mon. 2010, 36, 71–77. [Google Scholar]
- Wang, L.; Li, C.C.; Yao, Z.G.; Zhao, Z.L.; Han, Z.G.; Wei, Q. Application of aircraft observations over Beijing in cloud microphysical property retrievals from CloudSat. Adv. Atmos. Sci. 2014, 31, 926–937. [Google Scholar] [CrossRef]
- Zhao, C.; Qiu, Y.; Dong, X.; Wang, Z.; Peng, Y.; Li, B.; Wu, Z.; Wang, Y. Negative Aerosol-Cloud re Relationship from Aircraft Observations over Hebei, China. Earth Space Sci. 2018, 5, 19–29. [Google Scholar] [CrossRef]
- Burnet, F.; Brenguier, J.-L. Validation of droplet spectra and liquid water content measurements. Phys. Chem. 1999, 24, 249–254. [Google Scholar] [CrossRef]
- Baumgardner, D. An analysis and comparison of five water droplet measuring instruments. J. Appl. Meteorol. 1983, 22, 891–910. [Google Scholar] [CrossRef]
- Baumgardner, D.; Strapp, W.; Dye, J.E. Evaluation of the forward scattering spectrometer probe. Part II: Corrections for coincidence and dead-time losses. J. Atmos. Ocean. Technol. 1985, 2, 626–632. [Google Scholar] [CrossRef]
- Baumgardner, D.; Spowart, M. Evaluation of the forward scattering spectrometer probe. Part III: Time response and laser inhomogeneity limitations. J. Atmos. Oceanic. Technol. 1990, 7, 666–672. [Google Scholar] [CrossRef]
- Kleinman, L.I.; Daum, P.H.; Lee, Y.-N.; Lewis, E.R.; Sedlacek, A.J., III; Senum, G.I.; Springston, S.R.; Wang, J.; Hubbe, J.; Jayne, J.; et al. Aerosol concentration and size distribution measured below, in, and above cloud from the DOE G-1 during VOCALS-Rex. Atmos. Chem. Phys. 2012, 12, 207–223. [Google Scholar] [CrossRef]
- Yang, Y.; Zhao, C.; Dong, X.; Fan, G.; Zhou, Y.; Wang, Y.; Zhao, L.; Lv, F.; Yan, F. Toward understanding the process-level impacts of aerosols on microphysical properties of shallow cumulus cloud using aircraft observations. Atmos. Res. 2018. in review. [Google Scholar]
- Zhang, Q.; Quan, J.; Tie, X.; Huang, M.; Ma, X. Impact of aerosol particles on cloud formation: aircraft measurements in China. Atmos. Environ. 2011, 45, 665–672. [Google Scholar] [CrossRef]
- Hu, M.; Zhang, J.; Wu, Z.J. Chemical compositions of precipitation and scavenging of particles in Beijing. Sci. China Ser. B Chem. 2005, 48, 265–272. [Google Scholar] [CrossRef]
- Qian, L.; Yin, Y.; Tong, Y.Q.; Wang, W.W.; Wei, Y.X. Characteristics of size distributions of atmospheric fine particles in the north suburban area of Nanjing. China Environ. Sci. 2008, 28, 18–22. (In Chinese) [Google Scholar]
- Wang, H.; Zhu, B.; Shen, L.; Liu, X.; Zhang, Z.; Yang, Y. Size Distributions of Aerosol During the Spring Festival in Nanjing. Environ. Sci. 2014, 2, 442–450. [Google Scholar]
- Zhang, F.; Li, Z.; Li, R.J.; Sun, L.; Zhao, C.; Wang, P.C.; Sun, Y.L.; Li, Y.N.; Liu, X.G.; Li, J.X.; et al. Aerosol hygroscopicity and CCN activity obtained from a combination analysis based on size-resolved CCN and aerosol chemical composition observations during the AC3Exp13 campaign. Atmos. Chem. Phys. 2014, 14, 14889–14931. [Google Scholar] [CrossRef]
- Liu, P.; Zhao, C.; Zhang, Q.; Deng, Z.; Huang, M.; Ma, X.; Tie, X. Aircraft study of aerosol vertical distributions over Beijing and their optical properties. Tellus B 2009, 61, 756–767. [Google Scholar] [CrossRef] [Green Version]
- Hudson, J.G.; Frisbie, P.R. Cloud condensation nuclei near marine stratus. J. Geophys. Res. 1991, 96, 20795–20808. [Google Scholar] [CrossRef]
- Hudson, J.G. Cloud condensation nuclei near marine cumulus. J. Geophys. Res. 1993, 98, 2693–2702. [Google Scholar] [CrossRef]
- Weber, R.J.; Clarke, A.D.; Litchy, M.; Li, J.; Kok, G.; Schillawski, R.D.; McMurry, P.H. Spurious aerosol measurements when sampling from aircraft in the vicinity of clouds. J. Geophys. Res. 1998, 103, 28337–28346. [Google Scholar] [CrossRef] [Green Version]
- Craig, L.; Schanot, A.; Moharreri, A.; Roger, D.C.; Dhaniyala, S. Design and sampling characteristics of a new airborne aerosol inlet for aerosol measurements in clouds. J. Atmos. Ocean. Technol. 2013, 30, 1123–1135. [Google Scholar] [CrossRef]
- Martin, G.M.; Johnson, D.W.; Spice, A. The measurement and parameterization of effective radius of droplets in warm stratocumulus clouds. J. Atmos. Sci. 1994, 51, 1823–1842. [Google Scholar] [CrossRef]
- Wood, R. Parameterization of the effect of drizzle upon the droplets effective radius in stratocumulus clouds. Q. J. R. Meteorol. Soc. 2000, 126, 3309–3324. [Google Scholar] [CrossRef]
- Verlinde, J.; Harrington, J.Y.; Yannuzzi, V.T.; Avramov, A.; Greenberg, S.; Richardson, S.J.; Bahrmann, C.P.; McFarquhar, G.M.; Zhang, G.; Johnson, N.; et al. The Mixed-Phase Arctic Cloud Experiment. Bull. Am. Meteor. Soc. 2007, 88, 205–221. [Google Scholar] [CrossRef]
- McFarquhar, G.M.; Heymsfield, A.J. Microphysical characteristics of three anvils sampled during the Central Equatorial Pacific Experiment (CEPEX). J. Atmos. Sci. 1996, 53, 2401–2423. [Google Scholar] [CrossRef]
- Dong, X.; Minnis, P.; Mace, G.G.; Smith Jr, W.L.; Poellt, M.; Marchand, R.; Rapp, A.D. Comparison of stratus cloud properties deduced from surface, GOES, and aircraft data during the March 2000 ARM Cloud IOP. J. Atmos. Sci. 2002, 59, 3265–3284. [Google Scholar] [CrossRef]
- Heymsfield, A.J.; Schmitt, C.G.; Bansemer, A.; Baumgardner, D.; Weinstock, E.M.; Smith, J.T.; Sayres, D. Effective ice particle densities for cold anvil cirrus. Geophys. Res. Lett. 2004, 31, L02101. [Google Scholar] [CrossRef]
- McFarquhar, G.M.; Zhang, G.; Poellot, M.R.; Kok, G.L.; McCoy, R.; Tooman, T.; Fridlind, A.; Heymsfield, A.J. Ice properties of single-layer stratocumulus during the Mixed-Phase Arctic Cloud Experiment: 1. Observations. J. Geophys. Res. 2007, 112, D24201. [Google Scholar] [CrossRef]
- Yost, C.R.; Minnis, P.; Ayers, J.K.; Palikonda, R.; Spangenberg, D.; Change, F.L.; Sun-Mack, S.; Heck, P.W.; Lawson, R.P. Evaluation of In-Situ and Satellite-Derived Cirrus Microphysical Properties During SPARTICUS. Available online: https://asr.science.energy.gov/meetings/stm/posters/poster_pdf/2011/P000458.pdf (accessed on 25 November 2018).
- Lu, C.; Liu, Y.; Niu, S.; Krueger, S.; Wagner, T. Exploring parameterization for turbulent entrainment-mixing processes in clouds. J. Geophys. Res. 2013, 118, 185–194. [Google Scholar] [CrossRef] [Green Version]
- Bennartz, R. Global assessment of marine boundary layer cloud droplet number concentration from satellite. J. Geophys. Res. 2007, 112, D02201. [Google Scholar] [CrossRef]
- Ahmad, I.; Mielonen, T.; Grosvenor, D.; Portin, H.; Arola, A.; Mikkonen, S.; Kühn, T.; Leskinen, A.; Juotsensaari, J.; Komppula, M.; et al. Long-term measurements of cloud droplet concentrations and aerosol-cloud interactions in continental boundary layer clouds. Tellus B 2013, 65, 20138. [Google Scholar] [CrossRef]
- Albrecht, B.A. Aerosols, Cloud Microphysics, and Fractional Cloudiness. Science 1989, 245, 1227–1230. [Google Scholar] [CrossRef]
- Feingold, G.; Eberhard, W.L.; Veron, D.E.; Previdi, M. First measurements of the Twomey indirect effect using ground-based remote sensors. Geophys. Res. Lett. 2003, 30, 1287. [Google Scholar] [CrossRef]
- Garrett, T.J.; Zhao, C. Increased Arctic cloud longwave emissivity associated with pollution from mid-latitudes. Nature 2006, 440, 787–789. [Google Scholar] [CrossRef]
- Qiu, Y.; Zhao, C.; Guo, J.; Li, J. 8-Year ground-based observational analysis about the seasonal variation of the aerosol-cloud droplet effective radius relationship at SGP site. Atmos. Environm. 2017, 164, 139–146. [Google Scholar] [CrossRef]
Figure 1.
Flight tracks (right) over the observation location at Huanghua, China on 26 April 2014, along with the satellite map of clouds (left) from the Moderate Resolution Imaging Spectroradiometer (MODIS) at 10:30 LT on the same day.
Figure 1.
Flight tracks (right) over the observation location at Huanghua, China on 26 April 2014, along with the satellite map of clouds (left) from the Moderate Resolution Imaging Spectroradiometer (MODIS) at 10:30 LT on the same day.

Figure 2.
Profile of temperature observed by the aircraft between 600 m and 6900 m over Huanghua, China on 26 April 2014. The height ranges with filled gray colors are the height ranges with observed cloud layers. The black and red lines represent the 0 °C and PBL height, respectively.
Figure 2.
Profile of temperature observed by the aircraft between 600 m and 6900 m over Huanghua, China on 26 April 2014. The height ranges with filled gray colors are the height ranges with observed cloud layers. The black and red lines represent the 0 °C and PBL height, respectively.

Figure 3.
Vertical distribution of (a) aerosol number concentration (Na) with sizes between 0.1 and 10 μm (red squares) measured by PCASP, and cloud condensation nuclei (CCN) at a supersaturation of 0.3% (blue squares) measured by the CCN counter, (b) liquid water content (LWC), and (c) cloud droplet effective radius (re), over Huanghua, China on 26 April 2014. The circles and bars represent the means and standard deviations of the examined variables at each bin of altitude.

Figure 4.
Relationship between cloud droplet re and aerosol Na for (a) the PBL cloud layer, and (b) upper layer above the PBL. The circles and bars represent the means and standard deviations of the examined variables (re and Na) at each bin of Na. The five bins are classified based on Na with the same sample volume, which are 260–446 cm−3, 460–540 cm−3, 540–618 cm−3, 626–705 cm−3, and 714–855 cm−3 for the PBL cloud layer, and 8–35 cm−3, 35–53 cm−3, 54–69 cm−3, 70–93 cm−3, and 93–190 cm−3 for the upper layer above the PBL. The fitting lines are all linearly regressed based on the bin averages of Na and re.

Figure 5.
Relationship between cloud droplet re and aerosol Na for the PBL cloud layer and upper layer above the PBL with two different ranges of LWC: (a) PBL cloud layer with LWC < 0.05 g/m3; (b) PBL cloud layer with LWC ≥ 0.05 g/m3; (c) upper layer above the PBL with LWC < 0.05 g/m3, and (d) upper layer above the PBL with LWC ≥ 0.05 g/m3. The circles and bars represent the means and standard deviations of the examined variables (re and Na) at each bin of Na. The five bins are classified based on Na with the same sample volume. The fitting lines are all linearly regressed based on the bin averages of Na and re.


Table 1.
The mean and standard deviations (std) of aerosol concentration (Na), cloud condensation nuclei (CCN) concentration, and cloud droplet number concentration (Nc) in PBL cloud layer, low layer above the PBL, and upper layer above the PBL for the three-layer stratus cloud measured over Huanghua, China on 26 April 2014.
| Variable | PBL Cloud Layer | Low Layer Above the PBL | Upper Layer Above the PBL | |||
|---|---|---|---|---|---|---|
| Mean | Standard Deviation | Mean | Standard Deviation | Mean | Standard Deviation | |
| Na | 583.13 | 142.26 | 167.47 | 35.55 | 64.35 | 32.2 |
| CCN | 191.16 | 71.74 | 50.45 | 18.46 | 14.18 | 25.49 |
| Nc | 320.25 | 138.41 | 116.06 | 68.56 | 52.34 | 14.48 |
© 2019 by the authors. Licensee MDPI, Basel, Switzerland. This article is an open access article distributed under the terms and conditions of the Creative Commons Attribution (CC BY) license (http://creativecommons.org/licenses/by/4.0/).
Share and Cite
MDPI and ACS Style
Zhao, C.; Zhao, L.; Dong, X. A Case Study of Stratus Cloud Properties Using In Situ Aircraft Observations over Huanghua, China. Atmosphere 2019, 10, 19. https://doi.org/10.3390/atmos10010019
AMA Style
Zhao C, Zhao L, Dong X. A Case Study of Stratus Cloud Properties Using In Situ Aircraft Observations over Huanghua, China. Atmosphere. 2019; 10(1):19. https://doi.org/10.3390/atmos10010019
Chicago/Turabian StyleZhao, Chuanfeng, Lijun Zhao, and Xiaobo Dong. 2019. "A Case Study of Stratus Cloud Properties Using In Situ Aircraft Observations over Huanghua, China" Atmosphere 10, no. 1: 19. https://doi.org/10.3390/atmos10010019
Note that from the first issue of 2016, this journal uses article numbers instead of page numbers. See further details here.