Article

The Impact of Seasonal Environments in a Tropical Savanna Climate on Forking, Leaf Area Index, and Biomass of Cassava Genotypes

by
Phanupong Phoncharoen
1,
Poramate Banterng
1,2,*,
Nimitr Vorasoot
1,
Sanun Jogloy
1,2,
Piyada Theerakulpisut
3 and
Gerrit Hoogenboom
4
1
Department of Agronomy, Faculty of Agriculture, Khon Kaen University, Khon Kaen 40002, Thailand
2
Plant Breeding Research Center for Sustainable Agriculture, Faculty of Agriculture, Khon Kaen University, Khon Kaen 40002, Thailand
3
Department of Biology, Faculty of Science, Khon Kaen University, Khon Kaen 40002, Thailand
4
Institute for Sustainable Food Systems, University of Florida, Gainesville, FL 32611, USA
*
Author to whom correspondence should be addressed.
Agronomy 2019, 9(1), 19; https://doi.org/10.3390/agronomy9010019
Submission received: 26 October 2018 / Revised: 23 December 2018 / Accepted: 2 January 2019 / Published: 5 January 2019
(This article belongs to the Section Crop Breeding and Genetics)

Abstract

:
Information on the forking, leaf area index, and biomass of cassava for different growing seasons could help design appropriate management to improve yield. The objective was to evaluate the forking date, leaf growth, and storage root yield of different cassava genotypes grown at different planting dates. Four cassava genotypes (Kasetsart 50, Rayong 9, Rayong 11, and CMR38–125–77) were evaluated using a randomized complete block design with four replications. The cassava genotypes were planted on 20 April, 25 May, 30 June, 5 October, 10 November, and 15 December 2015, and 19 May and 3 November 2016. The soil properties prior to the planting, forking date, leaf area index (LAI), dry weights, harvest index (HI), starch content, and weather data were recorded. The forking date patterns for all of the growing seasons varied depending on the cassava genotypes. The weather caused occurring in the first forking for the Rayong 11 and CMR38–125–77 and the second forking for Rayong 11, but not for Kasetsart 50. The forking CMR38–125–77 had a higher LAI, leaf dry weight, biomass, and storage root dry weight than the non-forking Rayong 9. The higher storage root yields in Rayong 9 compared with Rayong 11 were due to an increased partitioning of the storage roots.

1. Introduction

Cassava (Manihot esculenta Crantz) is widely grown in tropical environments. It can be used for human consumption, animal feed, and for bioenergy production [1]. However, the average cassava storage root yield for the Association of Southeast Asian Nations (ASEAN) (21.7 t ha−1) is lower than the reported potential level of 80 t ha−1 [1,2]. This shortfall might be due to a lack of sufficient agro-advisory information about suitable cassava genotypes and appropriate management practices for the different growing seasons. In previous studies, differences in the weather conditions between the cassava planting dates resulted in different responses of cassava in terms of forking or branching [3,4].
Branching, known in cassava as “forking”, is the axillary bud growth from the apex of the main stem. The inflorescence is formed at the insertion point of the reproductive forking [5]. The forking of cassava affects the canopy development, yield, and dry matter partitioning [4,6,7], and is related to increasing the leaf area index (LAI) values and cassava yield [7,8,9]. A high LAI under a non-stress condition increases the crop growth rate and yield [10,11]. However, the forking of cassava is strongly affected by local weather conditions, which depend on the growing season [12]. The weather variability affects the forking habit and ultimately impacts the yield. Temperature is the main environmental condition that affects forking and growth, and average temperatures below 20 °C and above 28 °C reduce cassava growth [7].
A report by the Meteorological Department, Thailand [13], showed that the average annual temperature ranges from 18 to 36 °C, and most of the cassava growing areas in Thailand are in the tropical savanna climate zone with a growing period of 8 to 12 months, which covers almost all of the seasons in Thailand (hot season: March to May; rainy season: June to October, and cool season: November to February) [14]. The effect of weather variations during different periods of growing seasons in Thailand on the growth rate and final yield of cassava has been reported [15]. However, the responses of the different cassava genotypes in terms of forking, leaf growth, LAI, and storage root yield to the different growing seasons have not been evaluated in Thailand. Therefore, a study on the forking of different cassava genotypes during different growing seasons will provide basic information about the effect of weather conditions on forking habits as well as its relation to yield. Additional understanding about forking can help identify the suitable cassava genotypes for a specific growing condition, and for further cassava breeding programs in order to obtain a higher storage root yield. The objective of this study was, therefore, to evaluate the variation in the forking, leaf growth, and storage root yield of the different cassava genotypes grown at different planting dates.

2. Materials and Methods

The field experiments were conducted at the Khon Kaen University, Thailand (16°28′ N, 102°48′ E, 195 m above sea level), during 2015 to 2017. Each experiment had four different cassava genotypes as treatments. The Kasetsart 50 (forking type, Figure 1A) genotype was introduced by Kasetsart University, Thailand; the Rayong 11 (forking type, Figure 1B), CMR38–125–77 (forking type, Figure 1C), and Rayong 9 (non-forking type, Figure 1D) genotypes were promoted by the Department of Agriculture, Thailand. A randomized complete block design (RCBD) with four replications was used. The plot size and plant spacing were 77 m2 and 1 × 1 m (1 plant m−2), respectively. Land preparation was conducted by following normal procedures for the experimental field cultivation of cassava. The soil properties prior to planting are presented in Table 1, indicating low soil fertility. However, the total amount of available phosphorus in the soil was sufficient for the cassava requirement [16]. The variation in the pH values in the different planting dates was compensated by the application of calcium carbonate (CaCO3) (Pattarakan trading company limited, Nonthaburi, Thailand) during land preparation by following the procedure of Howeler [16]. The four cassava genotypes were planted on eight planting dates, 20 April, 25 May, 30 June, 5 October, 10 November, and 15 December in 2015, and 19 May and 3 November in 2016. The stems of the cassava nine months after planting were collected from the same field and were cut into stakes of 20 cm in length, and were soaked for 30 min with thiamethoxam (Syngenta crop protection limited, Bangkok, Thailand) 3–(2–chloro-thiazol–5–ylmethyl)–5–methyl–(1,3,5)–oxadiazinan–4–ylidene–N–nitroamine) and 25% water dispersible granules (WG) at a rate of 4 g per 20 litters of water, in order to prevent the cassava from infestation by the mealy bug (Rastrococcus invadens). The cassava stakes were then inserted vertically into the soil so that 2/3 of the length was buried. Weeds were controlled manually throughout the experiment. In order to avoid non-uniformity in soil nutrients and nutritional stress, all of the experimental plots were fertilized 30 days after planting (DAP), based on the information from the soil analysis that was conducted prior to planting and on the cassava nutrient requirements [16], and N fertilizer was applied at a rate of 46.9 kg ha−1 at 30 DAP (Chia tai company limited, Phranakhonsiayutthaya, Thailand). The compound fertilizer N–P2O5–K2O formula 15–0–18 was applied at a rate of 312.5 kg ha−1 at 60 DAP [14] (Chia tai company limited, Phranakhonsiayutthaya, Thailand). Supplementary irrigation was applied using a mini-sprinkler system when the soil water tension at the depth of 40 cm was at −30 kPa, and was stopped when the water tension at the depth of 20 cm was above −10 kPa (field capacity) [17]. To monitor the soil and water tension in the experimental field, the tensiometer sets were installed at soil depths of 20 and 40 cm for all eight of the planting dates.
The forking dates of the four cassava genotypes were determined from ten non-destructive plants in each experimental plot at three-day intervals for all eight of the planting dates. The forking date was recorded when at least 50% of the plants from a ten-plant sample showed forking on the top of the main stem (Figure 1). The subsequent forking levels from the first level were recorded as the second and the third forking dates, respectively. All of the fully expanded leaves without petiole were harvested from six plants of each experimental plot at 90 and 270 DAP. The leaves were then sub-sampled for about 10% of the total leaf fresh weight, and this sub-sample was then used to measure the leaf area using a leaf area meter (LI-Cor 3100, LI-COR Inc., Lincoln, NE, USA). The other six destructive plants in each plot were also sampled at 300 DAP, and the storage roots and remaining crop organs were sampled for about 10% of the total of each organ of fresh weight. All of the plant samples were oven-dried at 80 °C (BF 720, INDER GmbH (Headquarters), Tuttlingen, Germany) until a constant weight to determine the leaf, storage root, and total dry weights. The LAI was calculated as the ratio of the canopy leaf area to the ground area. At 300 DAP, each storage root was cut into small pieces and then put it into the Reimann scale balance equipment in order to obtain the starch content score [18]. The harvest index (HI) values were determined by the proportion of the storage root’s dry weight to the total crop dry weight. The daily maximum and minimum temperatures, total solar radiation, and rainfall were recorded by a weather station (WatchDog 2000, Spectrum Technologies Inc., Lincoln, NE, USA) that was installed next to the experimental field, and the data for the daylength for Khon Kaen province were obtained from the Meteorological Department of Thailand.
The analysis of variance (ANOVA) for each planting date, the combined analysis of variance for all eight of the planting dates, and the mean comparisons using the Least Significant Difference Test were conducted for the forking dates, LAI, and leaf dry weight at 90 and 270 DAP, as well as the total dry weight, storage root dry weight, HI, and starch content at 300 DAP. A stepwise regression analysis was used to examine the relationship between the forking dates and weather data, including the maximum and minimum temperatures, solar radiation, and daylength. All of the statistical analyses were performed using Statistix 10 program [19] and by following the procedure described by Gomez and Gomez [20].

3. Results and Discussion

3.1. Combined Analysis

The visual observation results from the experimental plots showed that there was no forking in the Rayong 9 genotype for all eight of the planting dates. Therefore, the combined analysis for all of the planting dates for the dates at which 50% of plants showed forking in the main stem was conducted using the observations for the Kasetsart 50, Rayong 11, and CMR38–125–77 genotypes. For the other crop traits, however, a combined analysis was performed, using the crop data of all four of the cassava genotypes. The results from the combined analysis of variance showed that there were highly significant effects (p ≤ 0.01) of the planting date, genotype, and genotype × planting date for all of the crop traits (Table 2). The interaction between the genotype and planting date indicated that there were different responses of the cassava genotypes for the different planting dates. The variations due to the planting date and genotype × planting date for the days until the first forking shared the largest portion of total variation (36.7% and 32.5% for the planting date and genotype × planting date, respectively). Similar results were found for the days until the second forking, with variations of 54.0% and 32.1% for planting date and genotype × planting date, respectively. The planting dates contributed to the largest variations for the total dry weight (39.4%), HI (45.5%), starch content (59.3%), LAI at 90 DAP (88.6%) and at 270 DAP (53.7%), and leaf dry weight at 90 DAP (93.8%) and at 270 DAP (52.6%). For the storage root dry weight, however, the contribution of the planting date was second, with a variation value of 16.5%. The significant shares of the variations for the planting dates indicate that the effects of the planting dates differed in almost all of the crop traits. Therefore, choosing appropriate crop management practices for specific planting dates can increase cassava productivity.

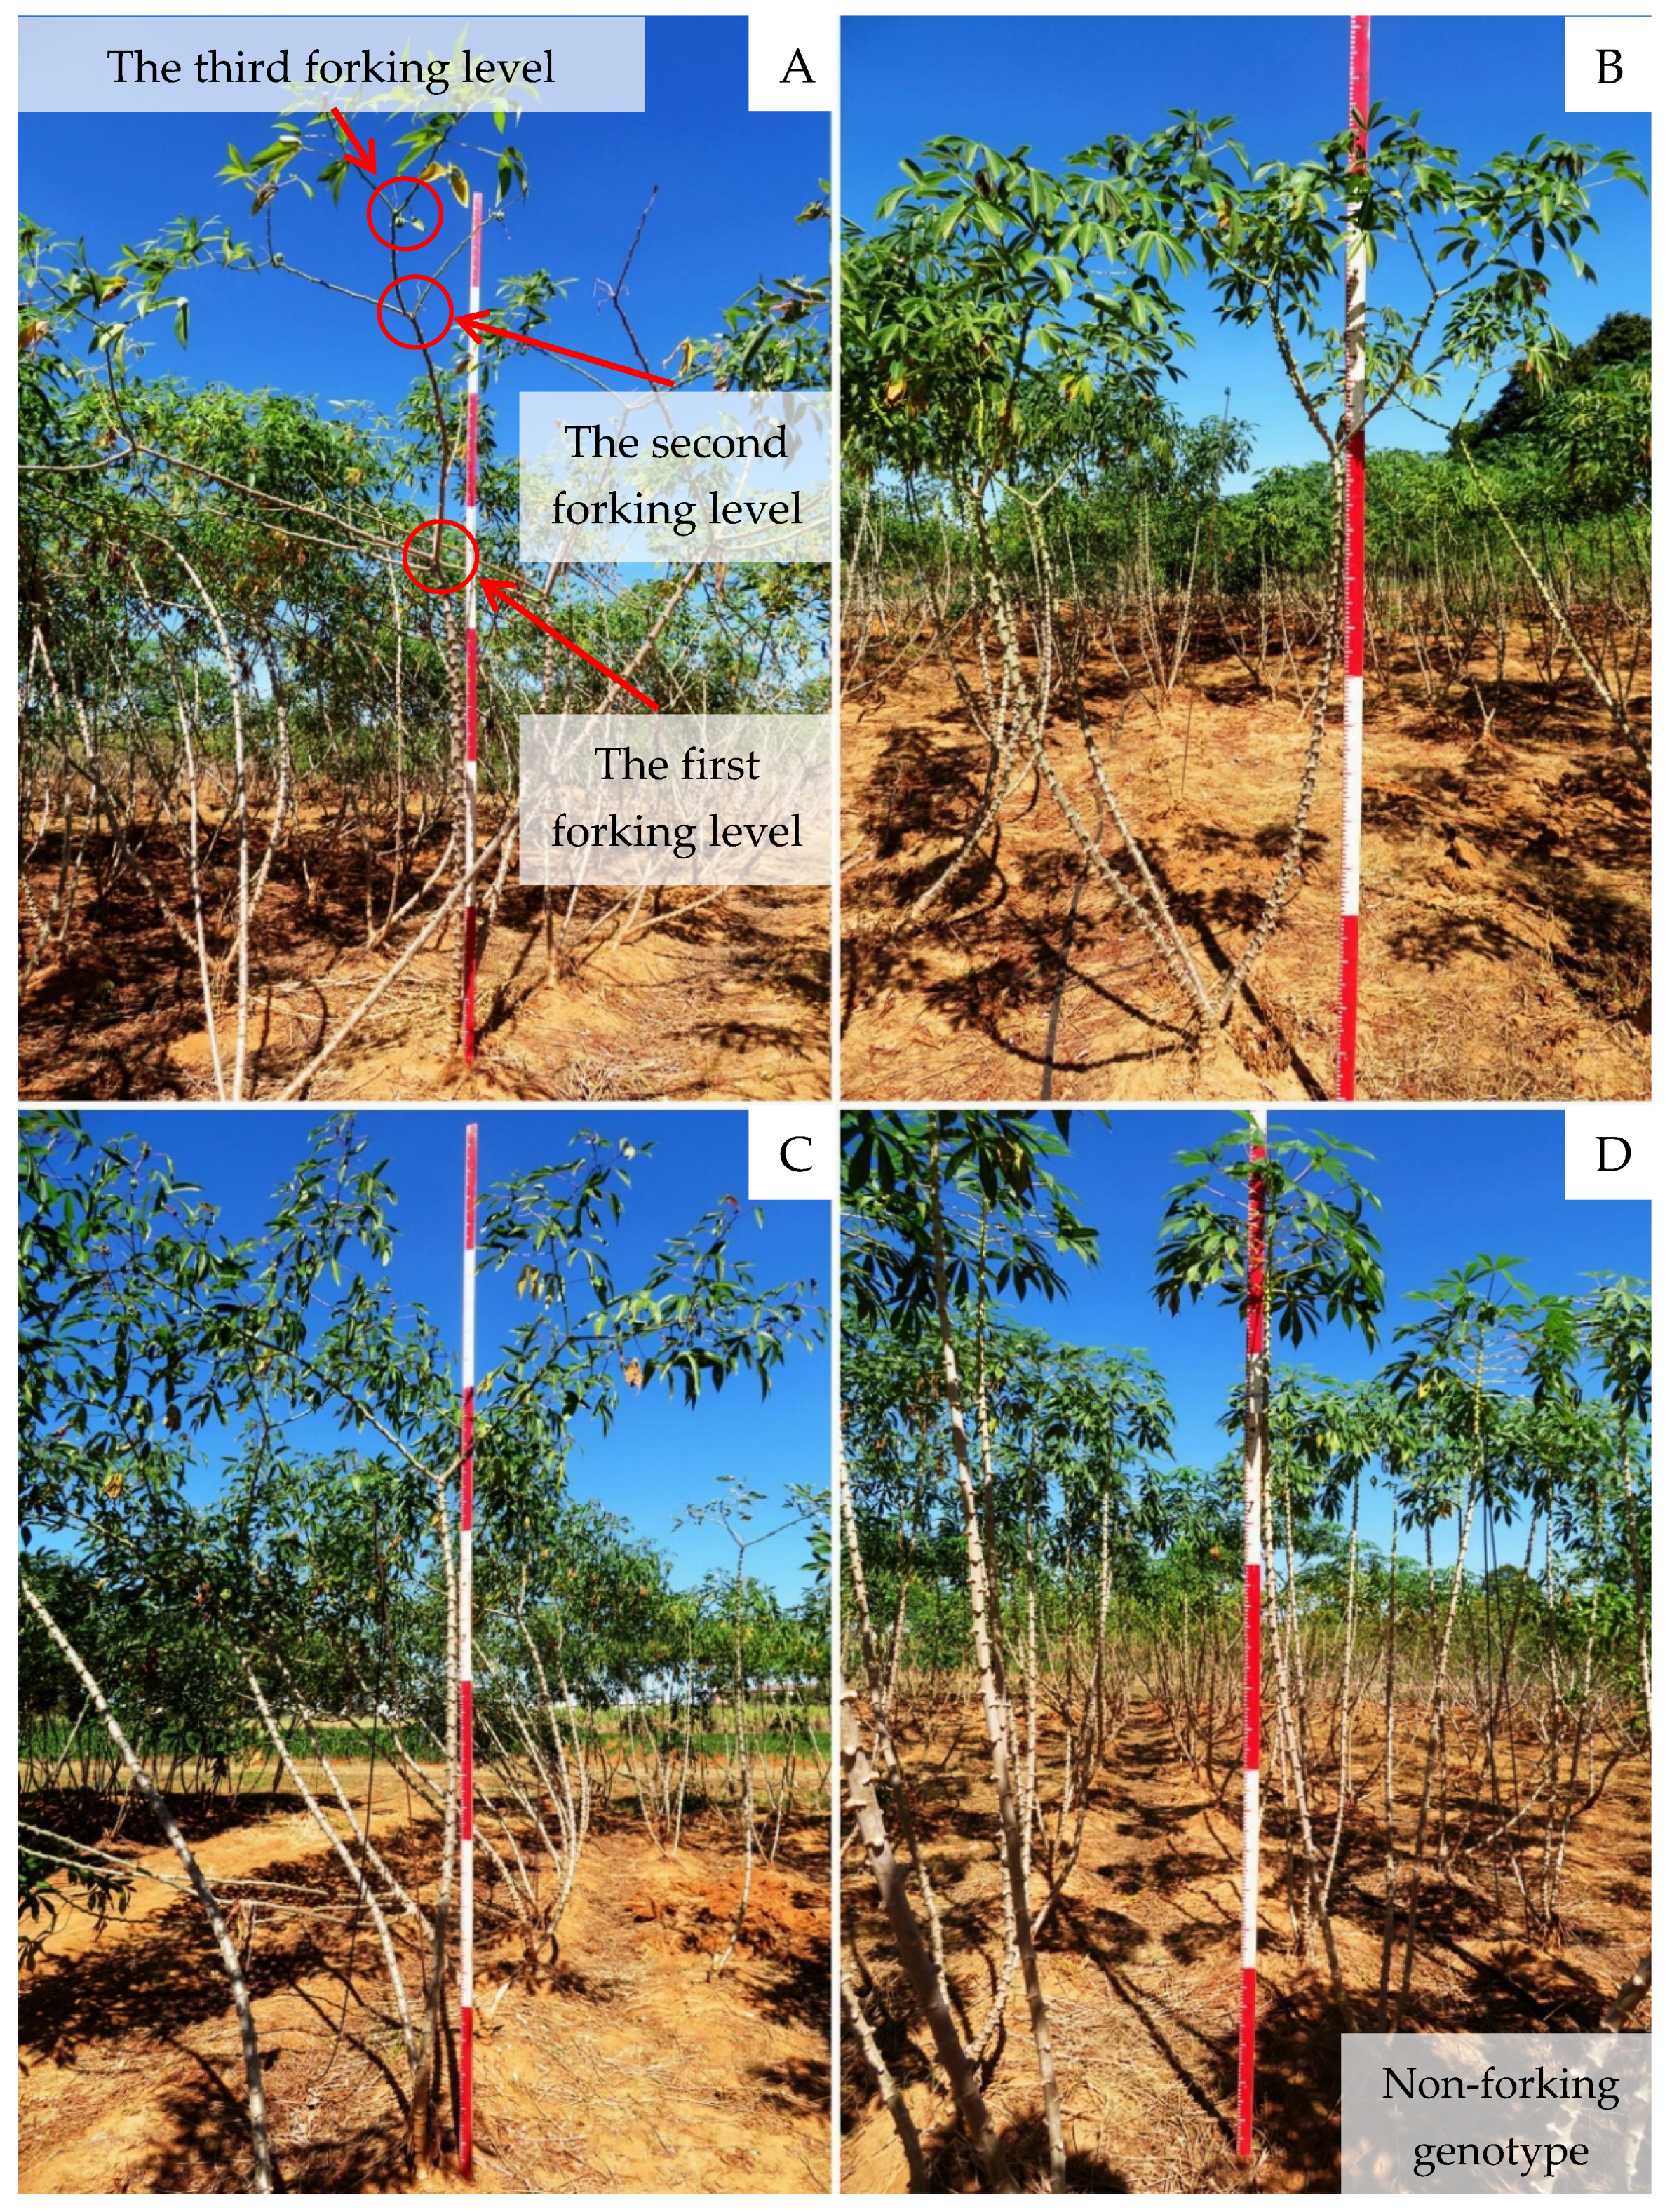
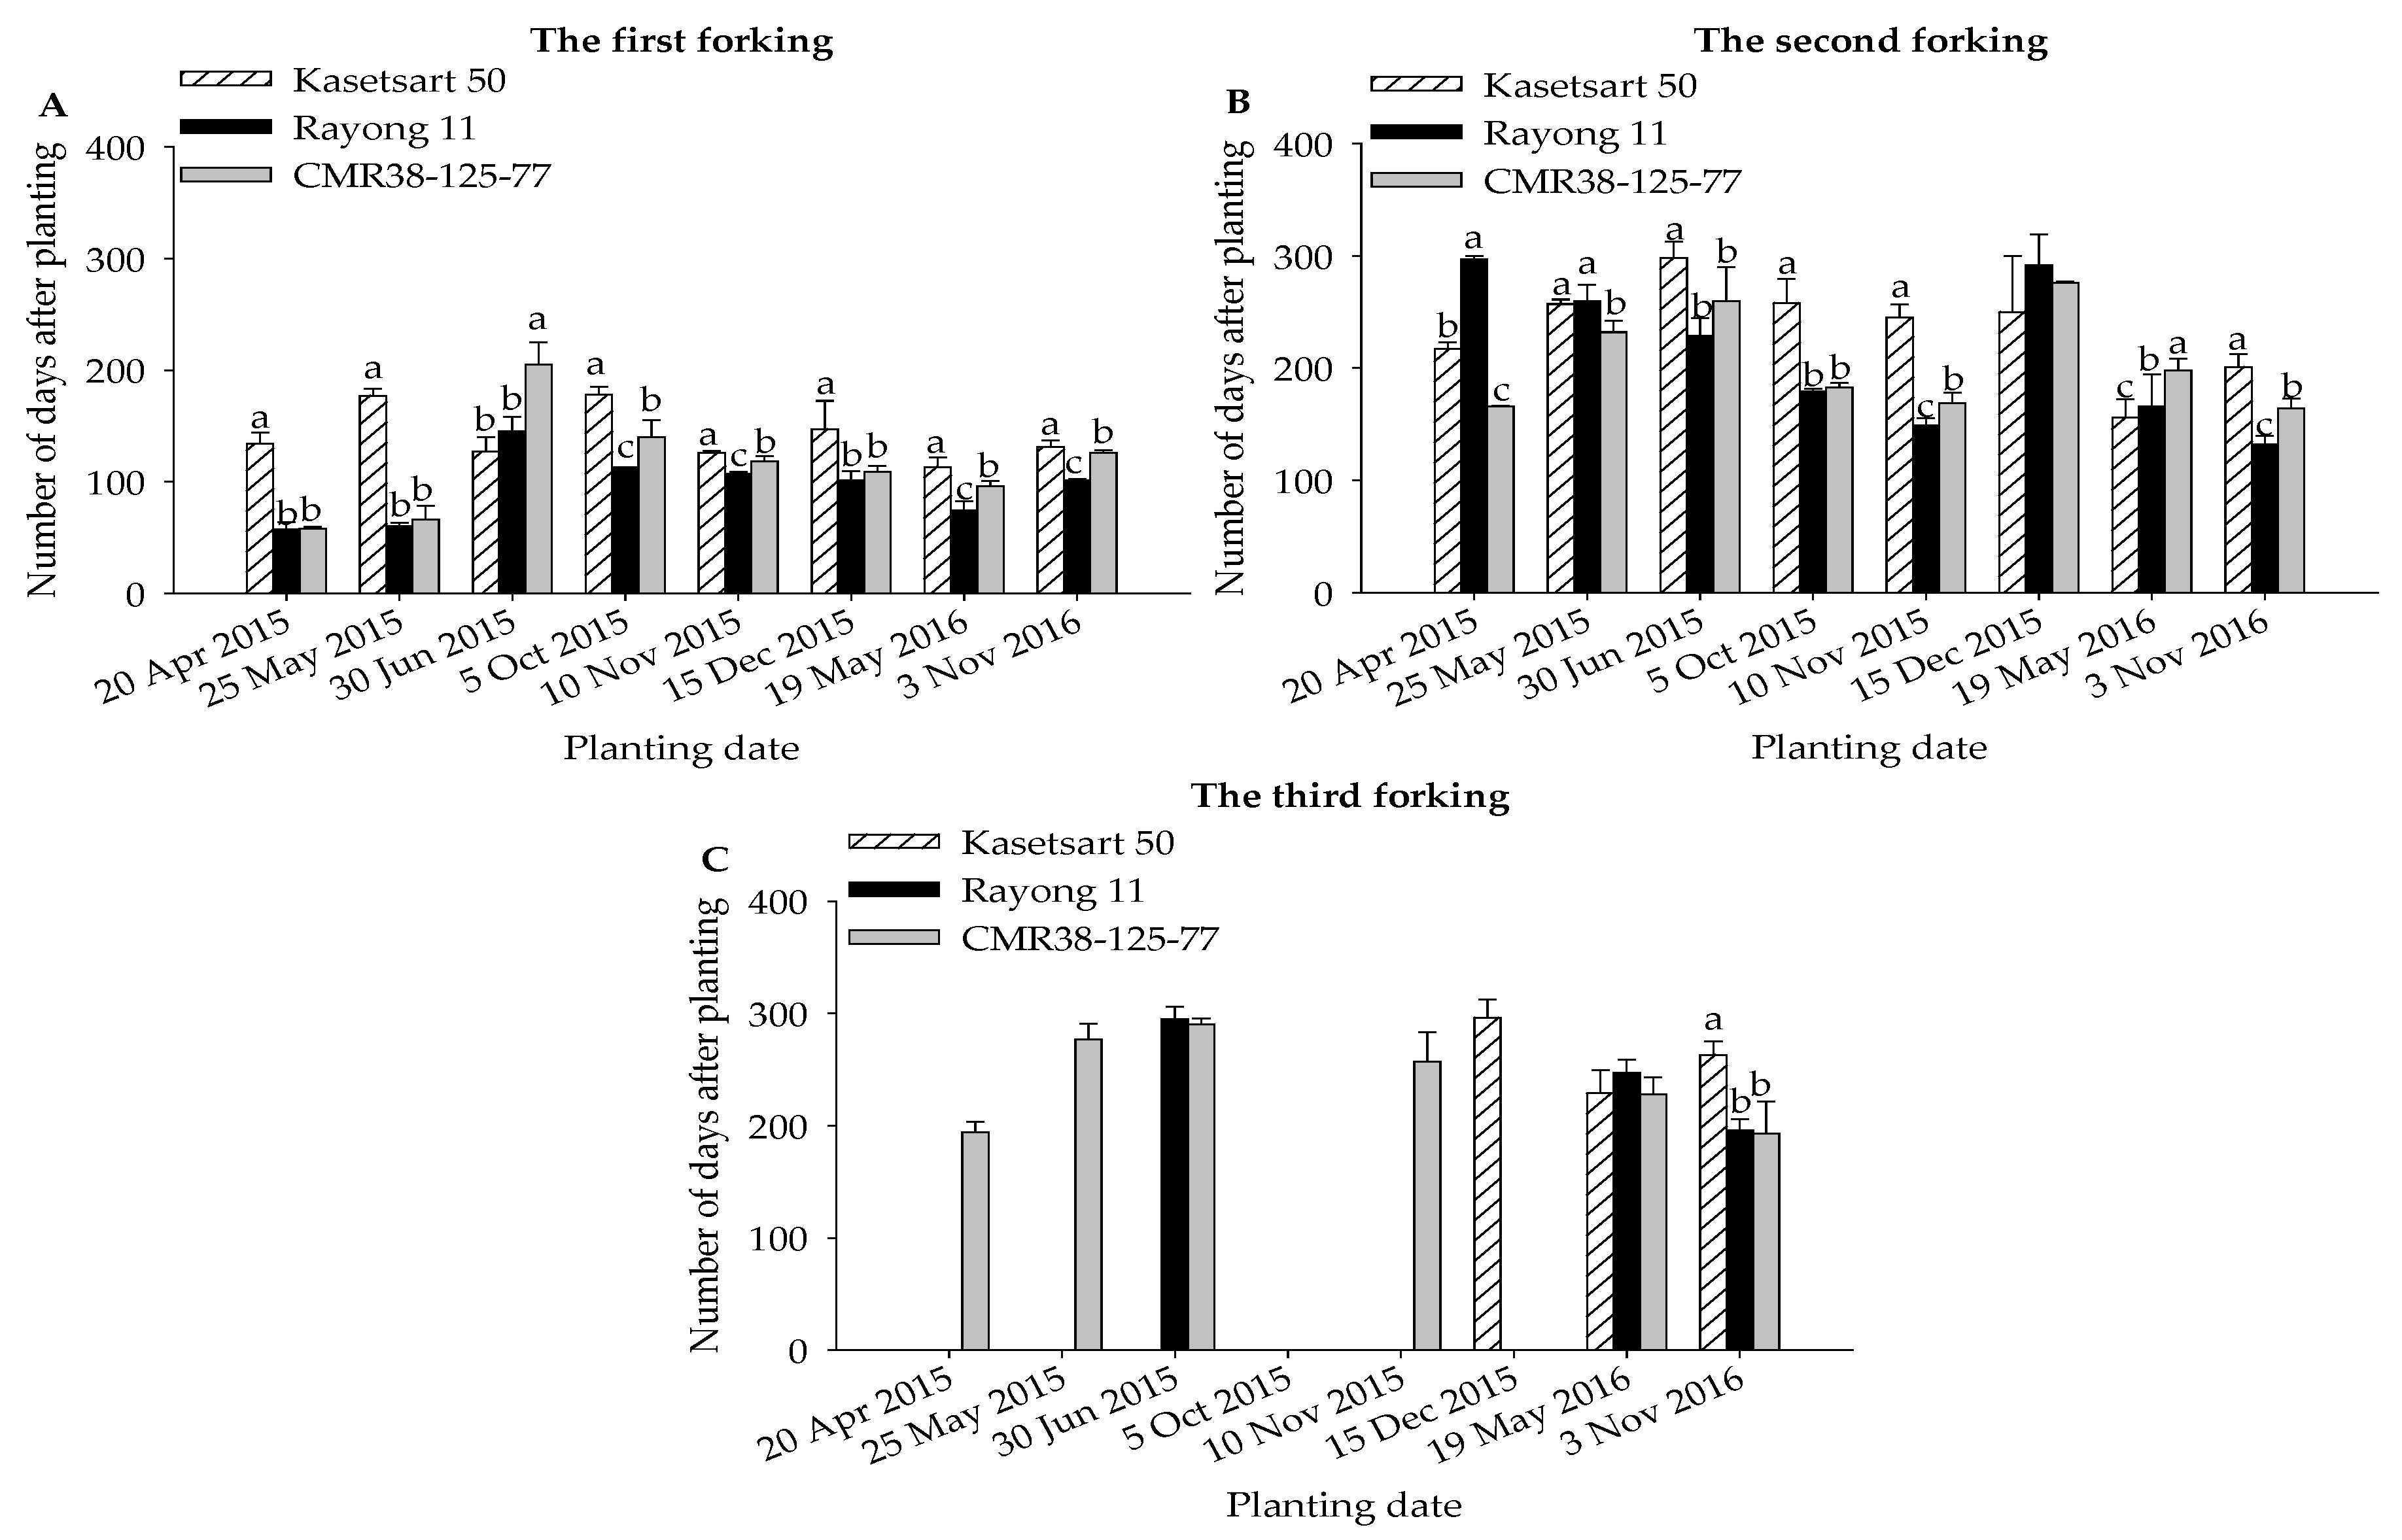
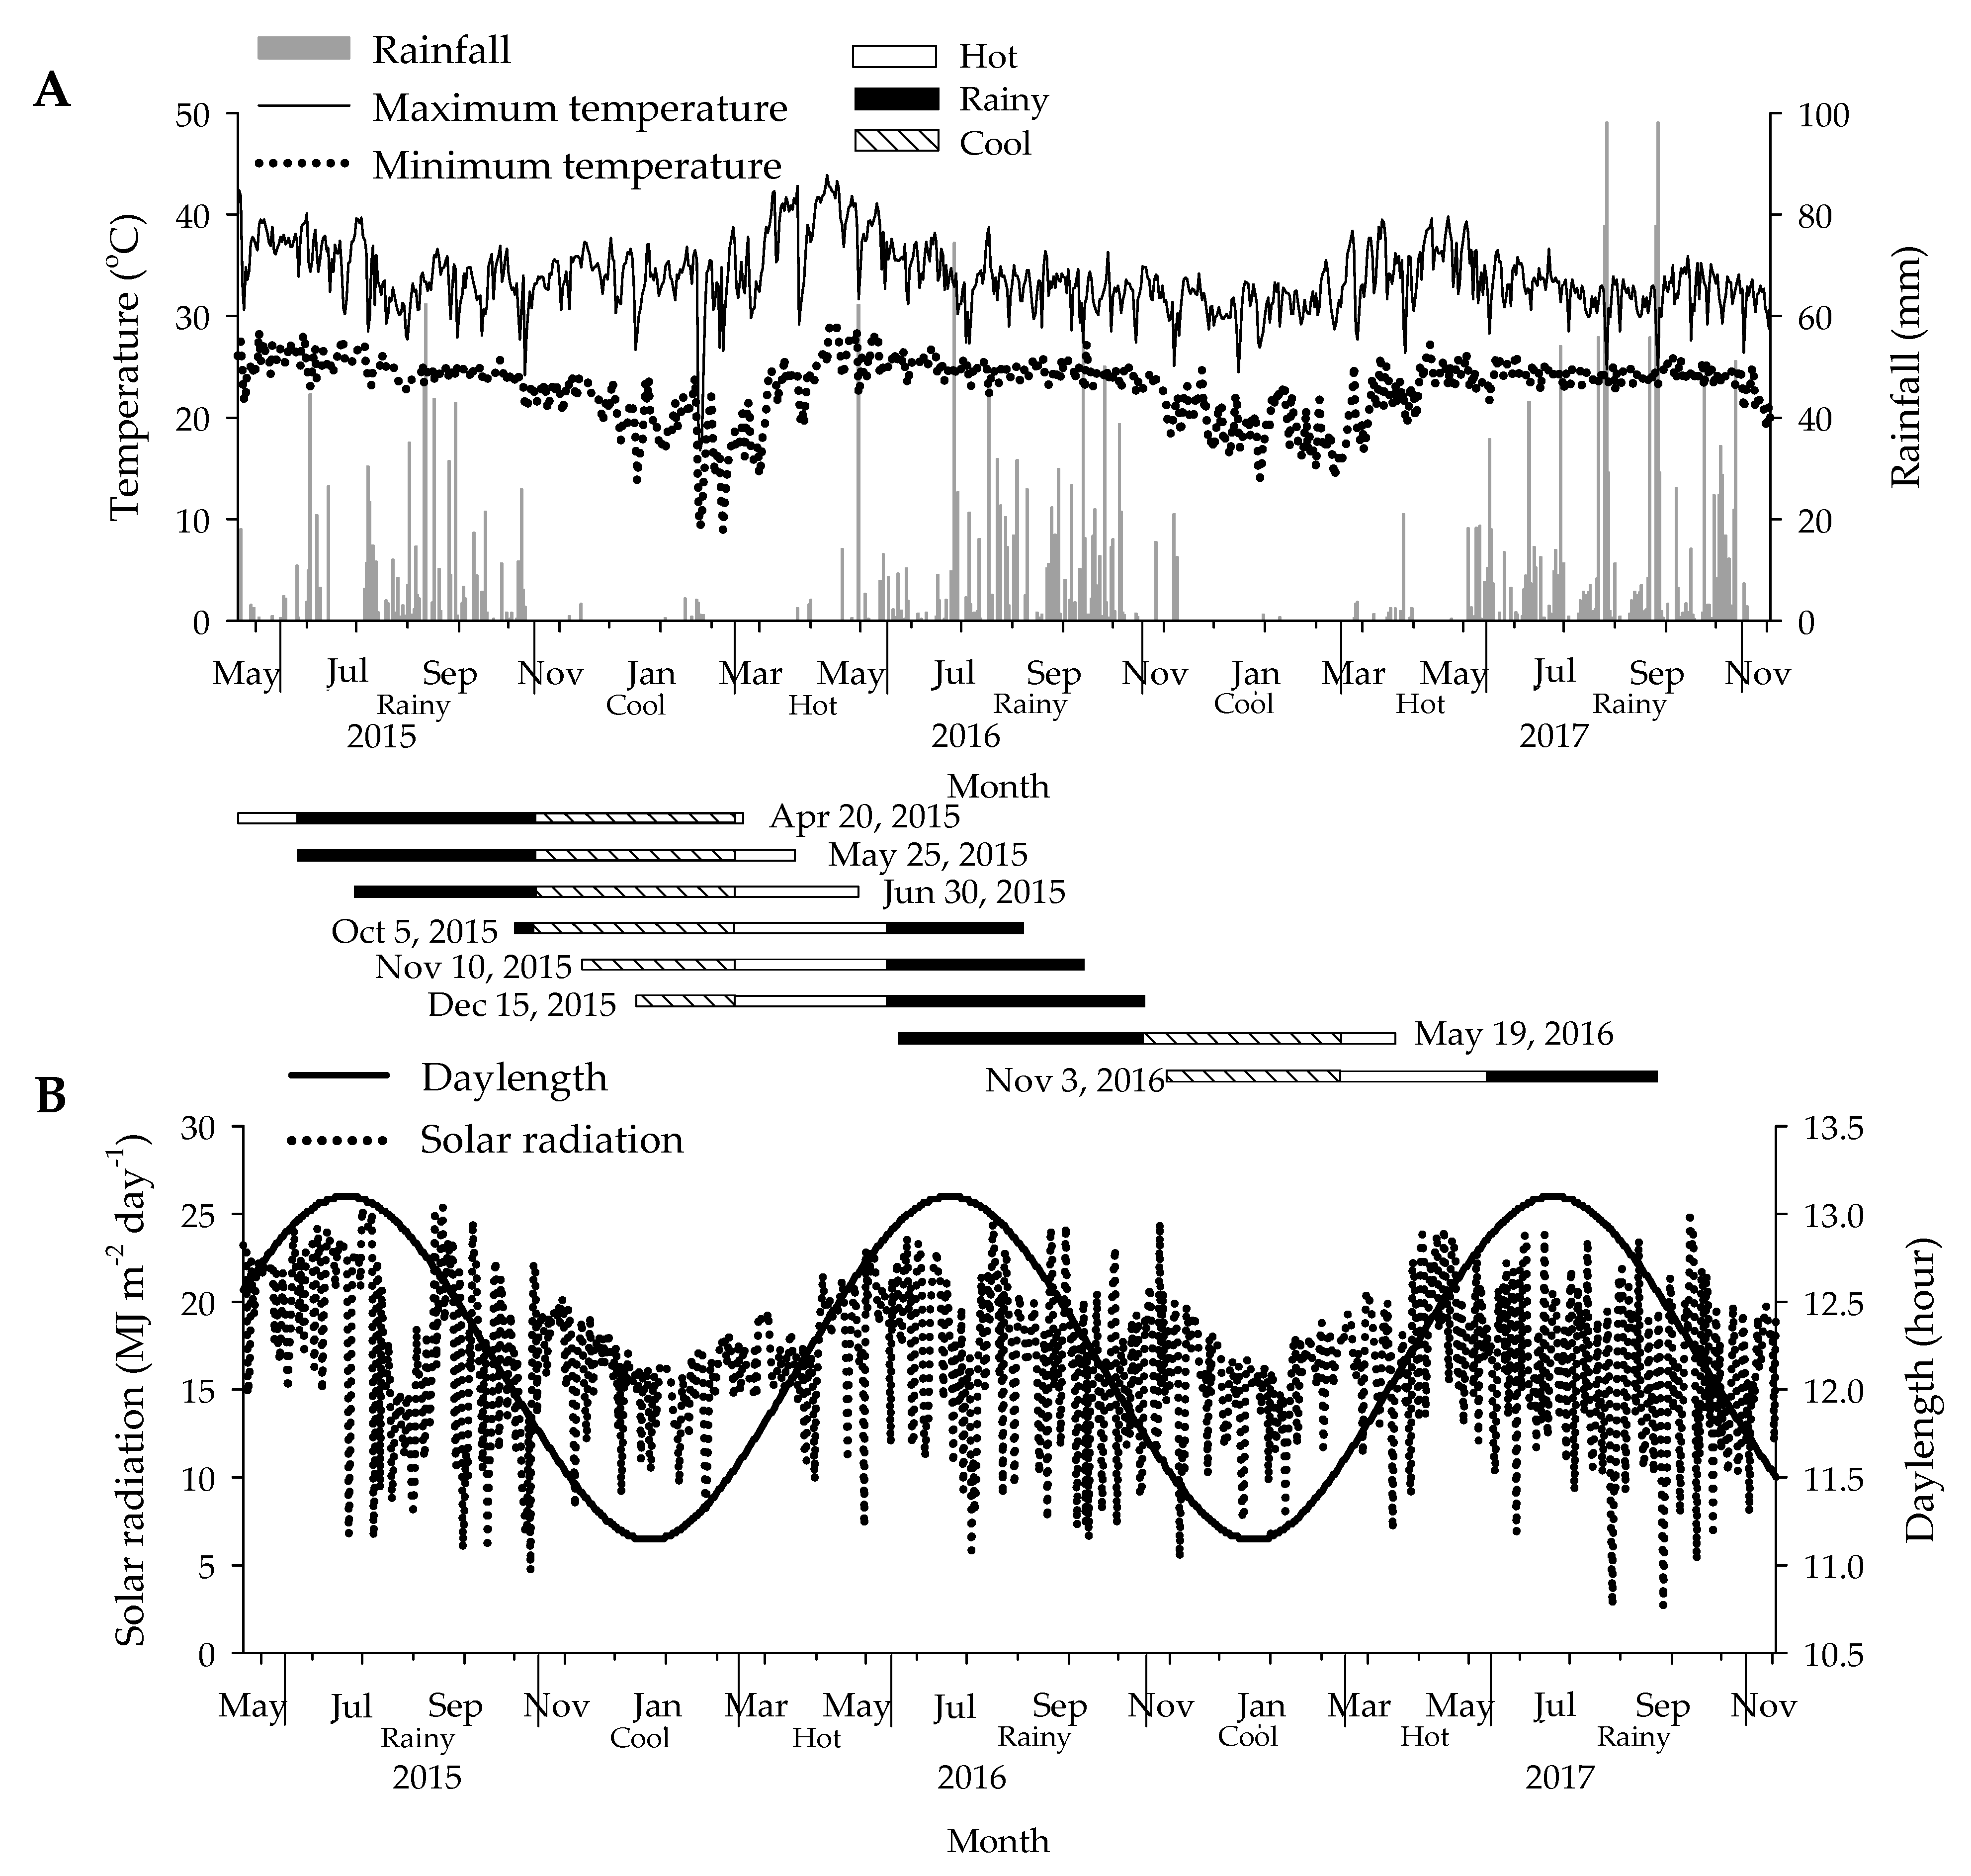
3.2. Forking Dates, Leaf Performances, and Final Harvest Data

For each planting date, the individual analysis of variance for the number of days until the first forking was performed using the data from the Kasetsart 50, Rayong 11, and CMR38–125–77 genotypes. The results indicate that there were significant differences among the three forking genotypes in terms of the days until the first forking (p ≤ 0.01) and the second forking (p ≤ 0.05 and p ≤ 0.01) for most of the planting dates, except for the second forking for the 15 December 2015 planting date (Figure 2A,B). The first forking dates varied from 57 DAP (Rayong 11 for the 20 April 2015 planting date) to 205 DAP (CMR38–125–77 for the 30 June 2015 planting date). The genotypes of Rayong 11 and CMR38–125–77 had an earlier forking for most of the planting dates when compared with Kasetsart 50, except for the 30 June 2015 planting date. The first forking dates for Rayong 11 and CMR38–125–77 for the planting dates of 20 April and 25 May 2015 were earlier than for the other planting dates. However, the first forking dates of the Kasetsart 50 genotype for all eight of the planting dates were uncertain. The number of days until the second forking for Rayong 11 and CMR38–125–77 were earlier than those for Kasetsart 50, except for the 20 April 2015, 25 May 2015, 15 December 2015, and 19 May 2016 planting dates. For the number of days until the third forking, all the three of the forking type genotypes showed inconsistent behavior for all eight of the planting dates; therefore, an analysis of variance was not performed. For example, Kasetsart 50 showed third forking for the planting dates of 15 December 2015, 19 May 2016, and 3 November 2016, but not for the other planting dates. This study, therefore, pointed out that our tested genotypes had different forking habits in different planting dates, and the environmental conditions during the growing period could also be the reason for the variation of the forking dates.
As the four cassava genotypes for all eight of the different planting dates were planted under irrigated conditions so as to avoid drought stress during the growing seasons, rainfall could not be considered as a limiting factor in this study. The differences in the climatic factors during the growing seasons, such as the temperature, solar radiation, and daylength (Figure 3A,B), are the key driving forces for the different cassava performances [4,10,15,21,22]. The results from the stepwise regression analysis in Table 3 indicate that there were different responses to the climatic conditions in terms of the forking dates of the cassava genotypes. The first forking date for the genotype of Rayong 11 could be explained by a combination of solar radiation, minimum temperature, and daylength with the determination coefficient of 0.81 (p ≤ 0.05). Solar radiation was the single important factor for the variation of the second forking for Rayong 11, with a determination coefficient of 0.50 (p ≤ 0.05). The solar radiation, minimum temperature, and daylength were identified as the factors affecting the first forking of CMR38–125–77, with a determination coefficient of 0.83 (p ≤ 0.05). According to the first forking date for the 30 June 2015 planting date (Figure 2A), a delay in the forking date for Rayong 11 and CMR38–125–77 seemed to relate to lesser solar radiation (16.6 and 16.1 MJ m−2 day−1, respectively), lower minimum temperature (23.6 and 22.7 °C, respectively), and shorter daylength (12.1 and 12.0 h, respectively) (Figure 3). However, no effect of solar radiation, temperature, and daylength was found on the first forking for Kasetsart 50. Weather seems to affect the second forking for Kasetsart 50 and CMR38–125–77. Previous research indicated that the time until the first branching of the different cassava genotypes grown in Colombia depended on both the crop genetics and on the average temperature; mean temperatures at lower than 24 °C caused a delay in the first branching [7]. A report from Keating et al. [4] demonstrated that the time until the first forking of the cassava genotype M Aus 10, grown under the high latitude (27°37′ S and 153°19′ E, 45 m above sea level) environment of Southeast Queensland, Australia, was reduced by a longer photoperiod (greater than 13.5 h). Veltkamp [23] reported that the three cassava genotypes (MCol l684, MCol 22, and MPtr 26) planted in Palmira, Colombia, with a constant daylength of 16 h during their growing period, showed their first forking earlier than those experiencing the natural days (lower daylength). Fewer forks are also produced under undesirable growing conditions, such as when experiencing water or nutrient stresses [24]. In this study, however, cassava was grown under satisfactory water, fertilizer, pest, and disease managements. The forking of cassava causes the initiation of inflorescence at the forking point, which is essential for the cassava crossing program [5], and this also affects the canopy development, growth, and yield of cassava [4,7].
The results in Table 4 show significant differences (p ≤ 0.05 and p ≤ 0.01) among the four cassava genotypes in terms of LAI at 90 DAP for almost all eight of the planting dates, except for 3 November 2016. These results revealed that the forking genotypes had generally higher LAI values at 90 DAP than the non-forking type genotype or Rayong 9 (CMR38–125–77 for the 20 April, 25 May, 30 June, 5 October, 10 November, and 15 December 2015 planting dates, and Kasetsart 50 for the 5 October 2015 and 19 May 2016 planting dates). For LAI at 270 DAP, a non-significant difference was found only for LAI at 270 DAP for the 19 May 2016 planting date. A forking Rayong 11 genotype had the highest values for almost all of the planting dates, except for 19 May 2016 planting date. Significant differences among the four cassava genotypes in the leaf dry weight at 90 DAP (p ≤ 0.05 and p ≤ 0.01) were observed for the 30 June, 5 October, and 15 December in 2015, and 19 May 2016 planting dates, and at 270 DAP (p ≤ 0.05 and p ≤ 0.01) for the 20 April, 25 May, 30 June, 5 October, 10 November, and 15 December in 2015, and 3 November 2016 planting dates. The forking genotypes also produced a higher leaf dry weight at both 90 and 270 DAP than the non-forking Rayong 9 genotype. Our results clearly showed that the three forking cassava genotypes had mostly more leaf growth and larger LAI values at 90 and 270 DAP than the Rayong 9 genotype.
The forking CMR38–125–77 genotype also had higher total dry weights at 300 DAP or at final harvest than the non-forking Rayong 9 genotype (Table 5). There were significant differences for the total dry weight among the four cassava genotypes (p ≤ 0.05 and p ≤ 0.01) for almost all of the planting dates, except for 19 May 2016. For most of the planting dates, except for 20 April 2015 and 19 May 2016, CMR38–125–77 produced a significantly (p ≤ 0.05 and p ≤ 0.01) higher total dry weight than the other genotypes. For the storage root dry weights, a forking genotype CMR38–125–77 had the highest storage root dry weights for the planting dates of 25 May, 30 June, 5 October, 10 November, and 15 December in 2015 (p ≤ 0.01), and 3 November 2016 (p ≤ 0.05) (Table 5). The variation of the forking dates for each genotype in the different planting dates (Figure 2A–C), however, was not clearly associate with a change in storage root yield at 300 DAP (Table 5), and this may involve a small variation between the planting dates with respect to the forking and final yield of each cassava genotype used in this study.
The results indicated that each of the four cassava genotypes was suitable for a specific planting date, and that selecting the appropriate genotype and planting date would result in increased cassava productivity. The genotype CMR38–125–77 showed forking at the first, second, and third levels (Figure 2A–C), and had higher values of LAI and a leaf dry weight at 90 and 270 DAP, as well as storage root and total dry weights for most planting dates, except for 20 April 2015 and 19 May 2016 (Table 4 and Table 5). A positive relationship between the LAI and cassava biomass has previously been reported [21,25,26,27,28], and a LAI of 2.5–3.5 is optimum for the light interception and utilization of cassava, which allows for a balance between the top and storage root growth for maximum yield [29]. The performances of the Kasetsart 50, Rayong 9, Rayong 11, and CMR38–125–77 genotypes for a crop duration of 180 DAP have been evaluated under different upper paddy fields during the off-season of rice in Thailand, and CMR38–125–77 was found to be outstanding when compared with the other three cassava genotypes for the total biomass and storage root yield recorded [22,30]. A report by Phoncharoen et al. [15] on the performances of these four cassava genotypes for the six different plating dates at Khon Kaen University, Thailand, showed that CMR38–125–77 is likely to be a good genotype with respect to the total crop and storage root dry weights at 360 DAP, for almost all of growing dates. This indicates the potential of CMR38–125–77 as an alternative genotype for cassava production in Thailand, and it could be useful as a new parental source for further cassava breeding.
There were significant differences (p ≤ 0.05 and p ≤ 0.01) among the four cassava genotypes in HI, and the Rayong 9 genotype had the highest values for almost all of the planting dates (Table 5). The value of HI indicates that the total photosynthate amount from the leaves (sources) has been diverted to the storage roots (sinks) [31]. Significant differences (p ≤ 0.05 and p ≤ 0.01) among the four cassava genotypes in the starch content were recorded for the planting dates of 20 April, 25 May, and 30 June in 2015, and 3 November 2016 (Table 5). A non-forking Rayong 9 genotype showed a high value of starch content for the 20 April, 25 May, and 30 June 2015 planting dates. Although Rayong 9 did not show forking and had lower values of LAI, as well as a leaf dry weight at 90 and 270 DAP compared with the other three forking genotypes (Table 4), the higher HI values for Rayong 9 (Table 5) indicate that this genotype had a higher capability of partitioning photosynthates to sink. A previous study on the performances of Kasetsart 50, Rayong 9, and Rayong 11 grown under three different nitrogen rates in Ban Kham Pom (16°08′50.8″ N, 102°46′34.9″ E, 199.4 m above sea level, during 2015/2016) Khon Kaen province, Thailand, also indicated that Rayong 9 had a lower LAI with a higher HI when compared to the other two forking genotypes [22]. Kawano [32] reported that the increased partitioning of photosynthetic assimilates to storage root is also one of the fundamental traits for promoting the cassava yield. Whereas Tan and Cock [6] suggested that it is necessary to obtain a balance between the roots and shoot growth in order to increase the cassava yield. Phoncharoen et al. [15] pointed out that the Rayong 9 genotype grown under the six different planting dates at Khon Kaen University, Thailand, preformed well in terms of both HI and starch content at 360 DAP, when compared with the other three forking genotypes. Therefore, the Rayong 9 genotype provides an alternative genetic resource for a further breeding program, to increase both the photosynthate partitioning to storage root and starch content. Although the absence of forking for Rayong 9 during a crop duration of 300 DAP resulted in no inflorescence formation, which hinders the cassava crossing program, growing this genotype under controlled conditions, such as at a lower temperature and using suitable fertilizer management, can help induce forking and flowering, and make it useful as a good genetic resource. In general, cassava has a genetic background as a heterozygous clone [33]. Both the forking and non-forking progenies could possibly appear in the early generation for a crossing between the forking and non-forking genotypes. The new cassava progenies with appropriate leaf growth, possessing a high partitioning to storage root, and being outstanding in starch content, are the preferable genotypes for breeding to improve both the storage root and starch yields. In addition, in order to increase the land use efficiency with these desirable progenies, cultivation through wider plant spacing would be more advisable for the forking genotypes than the non-forking genotypes.
Our results also revealed that Rayong 11 was a forking genotype with higher values of LAI and a leaf dry weight at 270 DAP, but lower values of the total dry weight (for the 15 December 2015 planting date) and storage root dry weights (for the 20 April, 5 October, 10 November, and 15 December 2015 planting dates), as well as HI compared to a non-forking genotype (Rayong 9) (Table 4 and Table 5), indicating a lower leaf photosynthesis efficiency of Rayong 11, and lesser partitioning from the sources to the storage organs [25,28,31]. Therefore, the storage root yield of Rayong 11 could be improved through management practices, such as using wider spacing than that used in this experiment, which would optimize light interception and enhance the suitable proportion between the top and storage root for maximum yield. To better understand the physiological basis of cassava growth, further investigations are needed into other crop traits, such as leaf and canopy growth, light transmission, light use efficiency, photosynthesis, biomass accumulations, and so on, for the different cassava branching types planted at different planting dates and the relationship of these traits to storage root yield.

4. Conclusions

Weather conditions affected the first and the second forking of Rayong 11 and the first forking of CMR38–125–77, but not the first forking of Kasetsart 50. Solar radiation, minimum temperature, and daylength were the factors that contributed significantly to the variations of the first forking dates for Rayong 11 and CMR38–125–77, and solar radiation was a single largest factor for the second forking dates for Rayong 11. Lesser solar radiation (16.4 MJ m−2 day−1), lower minimum temperature (23.2 °C), and shorter daylength (12.1 h) for the 30 June 2015 planting date delayed the first forking date for the Rayong 11 and CMR38–125–77 genotypes. The forking type genotypes produced more LAI and a leaf dry weight at 90 and 270 DAP, but only CMR38–125–77 had a higher total dry weight at 300 DAP than the non-forking type genotype. Increases in the yield could be achieved in different ways, depending on the genetic predisposition to forking. CMR38–125–77 was a desirable genotype for the storage root yield for almost all of the planting dates, except for 20 April 2015 and 19 May 2016. For Rayong 11 with a highly forked genotype, wider spacing is an alternative management strategy in order to improve productivity. Furthermore, a non-forking Rayong 9 genotype is good as a parental source for high partitioning to storage root and starch content.

Author Contributions

Conceptualization, P.P., P.B., N.V., S.J., and P.T.; data curation, P.P.; formal analysis, P.P. and P.B.; methodology, P.P., P.B., N.V., S.J., and P.T.; supervision, P.B.; investigation, P.P. and P.B.; writing (original draft preparation), P.P. and P.B.; writing (review and editing), P.P., P.B., N.V., S.J., P.T., and G.H.

Funding

This study was supported by the Thai Royal Golden Jubilee Ph.D. Program (grant no. PHD/0012/2557) and the National Science and Technology Development Agency (NSTDA), Thailand. Assistance for conducting the field research was provided by the Plant Breeding Research Center for Sustainable Agriculture, Khon Kaen University, Thailand.

Acknowledgments

The authors appreciate the editing support provided by Carol J. Wilkerson.

Conflicts of Interest

The authors declare no conflict of interest.

References

  1. Howeler, R.H. Save and Grow: Cassava, A guide to sustainable production intensification; Food and Agriculture Organization of the United Nations: Rome, Italy, 2013. [Google Scholar]
  2. ASEAN Food Security Information System. ASEAN Agricultural Commodity Outlook; Office of Agricultural Economics, Ministry of Agriculture and Cooperatives: Bangkok, Thailand, 2015. [Google Scholar]
  3. Manrique, L.A. Leaf area development and dry matter production of cassava. Agron. J. 1990, 82, 887–891. [Google Scholar] [CrossRef]
  4. Keating, B.A.; Evenson, J.P.; Fukai, S. Environmental effects on growth and development of cassava (Manihot Esculenta Crantz.) I. Crop development. Field Crops Res. 1982, 5, 271–281. [Google Scholar] [CrossRef]
  5. Alves, A.A.C. Cassava Botany and Physiology. In Cassava: Biology, Production and Utilization; Hillocks, R.J., Thresh, J.M., Bellotti, A.C., Eds.; CABI Publishing: New York, NY, USA, 2002; pp. 67–89. [Google Scholar] [CrossRef]
  6. Tan, S.L.; Cock, J.H. Branching habit as a yield determinant in cassava. Field Crops Res. 1979, 2, 281–289. [Google Scholar] [CrossRef]
  7. Irikura, V.; Cock, J.H.; Kawano, K. The physiological basis of genotype–temperature interactions in cassava. Field Crops Res. 1979, 2, 227–239. [Google Scholar] [CrossRef]
  8. Cock, J.H.  Cassava. In The Physiology of Tropical Field Crops; Goldsworthy, P.R., Fisher, N.M., Eds.; Wiley: New York, NY, USA, 1984; pp. 529–549. [Google Scholar] [CrossRef]
  9. El-Sharkawy, M.A. Cassava biology and physiology. Plant Mol. Biol. 2003, 53, 621–641. [Google Scholar] [CrossRef]
  10. Fukai, S.; Alcoy, A.B.; Llamelo, A.B.; Patterson, R.D. Effects of solar radiation on growth of cassava (Manihot esculenta Crantz.). I. Canopy development and dry matter growth. Field Crops Res. 1984, 9, 347–360. [Google Scholar] [CrossRef]
  11. El-Sharkawy, M.A. International research on cassava photosynthesis, productivity, eco–physiology, and responses to environmental stresses in the tropics. Photosynthetica 2006, 44, 481–512. [Google Scholar] [CrossRef]
  12. Howeler, R.H. Cassava Research and Development in Asia: Exploring New Opportunities for an Ancient Crop. In Proceedings of the 7th Regional Workshop, Bangkok, Thailand, 28 October–1 November 2002; Centro Internacional de Agricultura Tropical (CIAT), Cassava Office for Asia: Bangkok, Thailand, 2007. [Google Scholar]
  13. Meteorological Department. The Climate of Thailand. Available online: https://www.tmd.go.th/en/archive/thailand_climate.pdf (accessed on 4 September 2018).
  14. Department of Agriculture. Good Agricultural Practices for Cassava; National Bureau of Agricultural Commodity and Food Standards Ministry of Agriculture and Cooperatives: Bangkok, Thailand, 2008.
  15. Phoncharoen, P.; Banterng, P.; Vorasoot, N.; Jogloy, S.; Theerakulpisut, P.; Hoogenboom, G. Growth rates and yields of cassava at different planting dates in a tropical savanna climate. Sci. Agric 2018, in press. [Google Scholar]
  16. Howeler, R.H. Cassava mineral nutrition and fertilization. In Cassava: Biology, Production and Utilization; Hillocks, R.J., Thresh, J.M., Bellotti, A.C., Eds.; CABI Publishing: New York, NY, USA, 2002; pp. 115–147. [Google Scholar] [CrossRef]
  17. Richards, L.A.; Weaver, L.R. Moisture retention by some irrigated soils as related to soil moisture tension. J. Agric. Res. 1944, 69, 215–235. [Google Scholar]
  18. Wholey, D.W.; Booth, R.H. A comparison of simple methods for estimating starch content of cassava roots. J. Sci. Food Agric. 1979, 30, 158–164. [Google Scholar] [CrossRef]
  19. Statistix, version 10; Analytical Software: Tallahassee, FL, USA, 2013.
  20. Gomez, K.A.; Gomez, A.A. Statistical Procedures for Agricultural Research; John Wiley and Sons: New York, NY, USA, 1984. [Google Scholar]
  21. Phuntupan, K.; Banterng, P. Physiological determinants of storage root yield in three cassava genotypes under different nitrogen supply. J. Agr. Sci. Cambridge. 2017, 155, 978–992. [Google Scholar] [CrossRef]
  22. Sawatraksa, N.; Banterng, P.; Jogloy, S.; Vorasoot, N.; Hoogenboom, G. Chlorophyll fluorescence and biomass of four cassava genotypes grown under rain–fed upper paddy field conditions in the tropics. J. Agron. Crop Sci. 2018, 204, 554–565. [Google Scholar] [CrossRef]
  23. Veltkamp, H.J. Growth, total dry matter yield and its partitioning in cassava at different daylengths. Agric. Univ. Wageningen Papers 1985, 85, 73–86. [Google Scholar]
  24. Connor, D.J.; Cock, J.H. Response of cassava to water shortage. II. Canopy dynamics. Field Crops Res. 1981, 4, 285–296. [Google Scholar] [CrossRef]
  25. Lahai, M.T.; George, J.B.; Ekanayake, I.J. Cassava (Manihot esculenta Crantz) growth indices, root yield and its components in upland and inland valley ecologies of Sierra Leone. J. Agron. Crop Sci. 1999, 182, 239–247. [Google Scholar] [CrossRef]
  26. Lebot, V. Tropical Root and Tuber Crops: Cassava, Sweet Potato, Yam and Aroids; CABI: Wallingford, UK, 2009. [Google Scholar]
  27. El-Sharkawy, M.A.; De Tafur, S.M. Comparative photosynthesis, growth, productivity, and nutrient use efficiency among tall– and short–stemmed rain–fed cassava cultivars. Photosynthetica 2010, 48, 173–188. [Google Scholar] [CrossRef]
  28. Lahai, M.T.; Ekanayake, I.J.; Koroma, J.P.C. Influence of canopy structure on yield of cassava cultivars at various toposequences of an inland valley agro ecosystem. J. Agric. Biotech. Sustain. Dev. 2013, 5, 36–47. [Google Scholar] [CrossRef]
  29. Ramanujam, T. Leaf density profile and efficiency in partitioning dry matter among high and low yielding cultivars of cassava (Manihot esculenta Crantz). Field Crops Res. 1985, 10, 291–303. [Google Scholar] [CrossRef]
  30. Sawatraksa, N.; Banterng, P.; Jogloy, S.; Vorasoot, N.; Hoogenboom, G. cassava growth analysis of production during the off–season of paddy rice. Crop Sci. 2018, in press. [Google Scholar] [CrossRef]
  31. Lemoine, R.; Camera, S.L.; Atanassova, R.; Dédaldéchamp, F.; Allario, T.; Pourtau, N.; Bonnemain, J.-L.; Laloi, M.; Coutos-Thévenot, P.; Maurousset, L.; et al. Source–to–sink transport of sugar and regulation by environmental factors. Front Plant Sci. 2013, 4, 1–21. [Google Scholar] [CrossRef]
  32. Kawano, K. Harvest index and evoluation of major food crop cultivars in the tropics. Euphytica 1990, 46, 195–202. [Google Scholar] [CrossRef]
  33. Ceballos, H.; Iglesias, C.A.; Pérez, J.C.; Dixon, A.G. Cassava breeding: Opportunities and challenges. Plant Mol. Biol. 2004, 56, 503–516. [Google Scholar] [CrossRef] [PubMed]
Figure 1. Forking pattern at 300 days after planting (DAP) for the Kasetsart 50 (A), Rayong 11 (B), CMR38–125–77 (C), and Rayong 9 genotypes (D) grown at the Khon Kaen University, Thailand.
Agronomy 09 00019 g001
Figure 2. Mean values for the first forking date (A), the second forking date (B), and the third forking date (C) for four cassava genotypes grown on eight planting dates. The same letters (in each planting date) are not significantly different by the Least Significant Difference Test at p ≤ 0.01, except for the second forking date on 19 May 2016 (p ≤ 0.05). Error bars indicate the standard deviation of the means. The forking dates were observed from ten non-destructive plants for each experimental plot. The forking for Rayong 9 was not detected within 300 days after planting (DAP). The third forking for Kasetsart 50 was not detected within 300 DAP for the April, May, June, October, and November 2015 planting dates. For Rayong 11, the third forking was not detected within 300 DAP for the April, May, October, November, and December 2015 planting dates. CMR38–125–77 did not show the third forking within 300 DAP for the October and December 2015 planting dates.
Agronomy 09 00019 g002
Figure 3. Daily maximum and minimum temperatures and rainfall (A), and solar radiation and daylength (B) for eight planting dates at the experimental site in Khon Kaen University, Thailand. The weather data (except daylength) for the experiments in 2015 were revealed by Phoncharoen et al. [15].
Agronomy 09 00019 g003
Table 1. Soil properties at a depth of 0–30 cm of the experimental plot for the eight planting dates.
Soil CharacteristicPlanting Date
20 April 201525 May 201530 June 20155 October 201510 November 201515 December 201519 May 20163 November 2016
pH7.306.275.045.295.645.397.257.37
Cation exchange capacity (cmol kg−1)6.627.803.524.606.386.992.892.83
Organic matter
(g kg−1)
3.712.702.864.793.082.744.765.14
Total nitrogen
(g kg−1)
0.180.150.140.210.130.140.240.35
Available phosphorus
(mg kg−1)
56.8545.029.8916.1032.6015.4582.2685.13
Exchangeable potassium
(mg kg−1)
27.6327.7017.8636.4252.3121.8233.4631.48
The soil properties are described by Phoncharoen et al. [15].
Table 2. Mean squares (MS) and percentage of sum squares (%SS) from the combined analysis of the physiological traits for four cassava genotypes grown on eight planting dates.
Crop TraitSource of Variation
Planting Date (PD)Replication/PDGenotype (G)GxPDPool Error
MS%SSMS%SSMS%SSMS%SSMS%SS
The first forking date a7524.536.7 **95.91.618609.826.0 **3327.332.5 **95.03.2
The second forking date a20300.754.0 **431.83.97480.05.7 **6042.732.1 **232.84.2
TDW at 300 DAP (t ha−1)248.739.4 **12.97.0156.010.6 **60.428.7 **8.814.3
SRDW at 300 DAP (t ha−1)54.516.5 **6.56.8116.515.1 **50.145.5 **5.216.1
HI at 300 DAP0.145.5 **0.06.70.117.7 **0.021.3 **0.08.7
Starch content at 300 DAP (%)147.059.3 **2.33.244.27.6 **13.616.5 **3.213.4
LAI at 90 DAP (cm2 cm−2)45.988.6 **0.31.73.22.6 **0.84.5 **0.12.5
LAI at 270 DAP (cm2 cm−2)17.653.7 **0.22.617.723.2 **1.19.9 **0.310.5
LDW at 90 DAP (t ha−1)21.593.8 **0.12.00.40.7 **0.11.7 **0.01.8
LDW at 270 DAP (t ha−1)2.552.6 **0.03.22.522.7 **0.210.1 **0.111.4
a = combined analysis for forking dates of Kasetsart 50, Rayong 11, and CMR38–125–77 (without Rayong 9); ** = statistical significance on p ≤ 0.01; TDW = total dry weight; SRDW = storage root dry weight; HI = harvest index; LAI = leaf area index; DAP = days after planting; LDW = leaf dry weight.
Table 3. Stepwise regression analysis of the forking dates and weather factors for three cassava genotypes (Kasetsart 50, Rayong 11, and CMR38–125–77) grown on eight different planting dates.
GenotypeVariableCoefficienttDetermination Coefficient (R2)
Kasetsart 50The first forking
Constant142.2232.54 **0.00
The second forking
Constant78.140.23 ns0.34
Solar radiation−36.87−2.36 **
Maximum temperature22.743.19 **
Rayong 11The first forking
Constant578.348.19 **0.81
Solar radiation−14.50−5.49 **
Minimum temperature17.285.84 **
Daylength−51.38−4.63 **
The second forking
Constant−1110.15−4.62 **0.50
Solar radiation80.025.52 **
CMR38–125–77The first forking
Constant1210.638.37 **0.83
Solar radiation−24.20−6.77 **
Minimum temperature41.057.04 **
Daylength−121.53−5.92 **
The second forking
Constant−293.64−1.46 ns0.35
Solar radiation−70.24−3.74 **
Daylength138.963.90 **
t = t-(or Student’s) test; ns = non-significance; ** = statistical significance at p ≤ 0.01.
Table 4. Leaf area index (LAI) and leaf dry weight at 90 and 270 days after planting (DAP) for four genotypes grown on eight planting dates.
Planting DateGenotypeLAI ± SD (cm2 cm−2)Leaf dry weight ± SD (t ha−1)
90 DAP270 DAP90 DAP270 DAP
20 April 2015Kasetsart 505.7 ± 0.92 b2.9 ± 0.79 ab4.0 ± 0.771.1 ± 0.28 ab
Rayong 95.6 ± 0.63 b2.2 ± 0.64 bc3.5 ± 0.640.9 ± 0.20 b
Rayong 116.5 ± 0.56 ab3.3 ± 0.58 a4.2 ± 0.691.4 ± 0.07 a
CMR38–125–777.3 ± 0.53 a1.7 ± 0.35 c4.4 ± 0.200.7 ± 0.21 b
F ***ns**
25 May 2015Kasetsart 503.4 ± 0.30 b2.9 ± 0.44 b1.3 ± 0.121.5 ± 0.37 ab
Rayong 93.2 ± 0.15 b2.4 ± 0.46 b1.3 ± 0.161.2 ± 0.10 b
Rayong 113.3 ± 0.55 b4.1 ± 0.97 a1.1 ± 0.162.0 ± 0.36 a
CMR38–125–774.3 ± 0.69 a2.8 ± 0.65 b1.4 ± 0.111.3 ± 0.25 b
F **ns*
30 June 2015Kasetsart 501.6 ± 0.41 b2.6 ± 0.50 ab0.6 ± 0.11 b1.4 ± 0.23 a
Rayong 91.5 ± 0.31 b1.4 ± 0.14 c0.6 ± 0.10 b0.7 ± 0.08 b
Rayong 112.1 ± 0.47 b3.8 ± 0.88 a0.8 ± 0.12 ab1.7 ± 0.37 a
CMR38–125–773.2 ± 0.37 a1.6 ± 0.24 bc1.0 ± 0.14 a0.8 ± 0.12 b
F ********
5 October 2015Kasetsart 501.7 ± 0.12 a4.0 ± 0.46 ab0.9 ± 0.05 a1.9 ± 0.09 a
Rayong 91.2 ± 0.05 b2.8 ± 0.49 b0.6 ± 0.04 b1.3 ± 0.12 b
Rayong 111.5 ± 0.35 ab4.7 ± 0.75 a0.7 ± 0.18 ab1.8 ± 0.33 a
CMR38–125–771.7 ± 0.23 a4.3 ± 0.64 a0.9 ± 0.09 a1.7 ± 0.23 ab
F *****
10 November 2015Kasetsart 501.7 ± 0.51 b5.5 ± 0.70 a0.9 ± 0.272.3 ± 0.31 a
Rayong 91.8 ± 0.04 b3.2 ± 0.30 b0.9 ± 0.101.5 ± 0.05 b
Rayong 112.5 ± 0.12 a5.9 ± 0.37 a1.2 ± 0.052.3 ± 0.16 a
CMR38–125–772.5 ± 0.61 a4.0 ± 0.41 b1.2 ± 0.301.7 ± 0.26 b
F ***ns**
15 December 2015Kasetsart 501.3 ± 0.11 ab3.7 ± 0.61 ab0.7 ± 0.09 a1.7 ± 0.21 a
Rayong 91.1 ± 0.22 b2.9 ± 0.50 b0.5 ± 0.09 b1.2 ± 0.26 b
Rayong 111.3 ± 0.10 ab4.6 ± 0.43 a0.7 ± 0.04 a1.9 ± 0.13 a
CMR38–125–771.5 ± 0.18 a3.5 ± 0.54 b0.7 ± 0.10 a1.4 ± 0.19 ab
F ******
19 May 2016Kasetsart 502.4 ± 0.38 a0.8 ± 0.141.1 ± 0.16 a0.5 ± 0.07
Rayong 91.2 ± 0.47 b1.6 ± 0.400.5 ± 0.20 b0.9 ± 0.21
Rayong 111.3 ± 0.32 b1.6 ± 0.960.6 ± 0.14 b0.8 ± 0.44
CMR38–125–771.0 ± 0.43 b1.1 ± 0.360.4 ± 0.17 b0.6 ± 0.18
F **ns**ns
3 November 2016Kasetsart 501.2 ± 0.153.1 ± 0.36 bc0.6 ± 0.051.2 ± 0.13 b
Rayong 91.1 ± 0.182.0 ± 0.27 c0.5 ± 0.080.9 ± 0.22 c
Rayong 111.2 ± 0.214.6 ± 0.09 a0.6 ± 0.091.5 ± 0.10 a
CMR38–125–771.2 ± 0.123.4 ± 0.91 b0.6 ± 0.081.0 ± 0.09 bc
F ns**ns**
SD = standard deviation; F = F-distribution; * and ** = statistical significance on p ≤ 0.05 and p ≤ 0.01, respectively; ns = non-significance in statistics. Values followed by the same letter (in each planting date) are not significantly different from the Least Significant Difference Test.
Table 5. Total crop dry weight, storage root dry weight, harvest index (HI), and starch content at 300 days after planting (DAP) of four cassava genotypes grown at different planting dates.
Planting DateGenotypeTotal crop dry weight ± SD
(t ha−1)
Storage root dry weight ± SD
(t ha−1)
HI ± SDStarch content ± SD (%)
20 April 2015Kasetsart 5036.2 ± 3.95 ab11.6 ± 2.69 bc0.32 ± 0.05 c30.7 ± 1.25 a
Rayong 941.1 ± 3.03 a21.6 ± 2.04 a0.53 ± 0.03 a32.3 ± 0.70 a
Rayong 1133.9 ± 2.88 bc14.5 ± 1.54 b0.43 ± 0.02 b29.6 ± 1.46 ab
CMR38–125–7728.8 ± 2.60 c7.9 ± 1.69 c0.27 ± 0.04 c27.0 ± 1.44 b
F ********
25 May 2015Kasetsart 5027.0 ± 2.80 b10.7 ± 0.72 b0.40 ± 0.03 ab21.8 ± 1.01 b
Rayong 929.9 ± 4.09 b13.4 ± 2.21 b0.45 ± 0.02 ab28.8 ± 1.95 a
Rayong 1130.9 ± 1.52 ab11.4 ± 1.51 b0.37 ± 0.06 b27.5 ± 0.47 a
CMR38–125–7735.8 ± 1.76 a17.4 ± 0.43 a0.49 ± 0.04 a28.9 ± 2.37 a
F ********
30 June 2015Kasetsart 5020.9 ± 2.74 ab7.9 ± 1.04 b0.38 ± 0.02 c22.5 ± 1.42 b
Rayong 919.4 ± 2.65 b12.3 ± 1.24 a0.64 ± 0.03 a25.4 ± 1.01 a
Rayong 1123.2 ± 0.47 ab12.0 ± 1.39 a0.52 ± 0.70 b24.3 ± 0.65 a
CMR38–125–7725.4 ± 0.94 a14.8 ± 0.83 a0.58 ± 0.02 ab24.2 ± 0.74 ab
F *******
5 October 2015Kasetsart 5026.4 ± 1.96 b12.8 ± 1.35 b0.48 ± 0.02 b21.3 ± 0.62
Rayong 925.0 ± 1.62 bc13.6 ± 1.29 b0.54 ± 0.05 a22.7 ± 2.60
Rayong 1124.2 ± 1.31 c10.8 ± 0.57 c0.45 ± 0.02 b22.7 ± 1.25
CMR38–125–7729.3 ± 1.51 a15.8 ± 0.99 a0.54 ± 0.02 a23.7 ± 1.89
F ******ns
10 November 2015Kasetsart 5032.6 ± 1.32 a15.6 ± 1.36 ab0.48 ± 0.04 b24.6 ± 1.92
Rayong 930.0 ± 2.02 ab17.9 ± 1.89 a0.60 ± 0.03 a26.1 ± 0.59
Rayong 1125.1 ± 3.87 b11.3 ± 2.34 b0.45 ± 0.04 b23.9 ± 1.80
CMR38–125–7734.0 ± 1.86 a18.2 ± 1.54 a0.54 ± 0.03 ab24.2 ± 1.41
F ******ns
15 December 2015Kasetsart 5029.9 ± 1.85 b13.9 ± 1.51 b0.47 ± 0.08 bc23.7 ± 1.80
Rayong 927.0 ± 1.15 b14.0 ± 1.28 b0.52 ± 0.04 ab26.0 ± 2.70
Rayong 1122.1 ± 1.53 c9.5 ± 0.96 c0.43 ± 0.04 c23.8 ± 2.02
CMR38–125–7734.6 ± 3.36 a18.5 ± 2.80 a0.54 ± 0.10 a24.1 ± 1.92
F *****ns
19 May 2016Kasetsart 5023.1 ± 5.7711.7 ± 4.870.49 ± 0.13 b29.5 ± 3.21
Rayong 921.2 ± 4.3715.2 ± 3.070.72 ± 0.03 a31.2 ± 1.30
Rayong 1127.4 ± 3.4718.2 ± 1.880.67 ± 0.02 a31.2 ± 1.48
CMR38–125–7728.0 ± 4.3817.0 ± 3.160.61 ± 0.04 ab33.0 ± 0.71
F nsns**ns
3 November 2016Kasetsart 5034.1 ± 4.94 a21.6 ± 4.86 a0.63 ± 0.05 a21.0 ± 1.65 b
Rayong 923.5 ± 5.45 b14.8 ± 4.56 b0.62 ± 0.09 a23.3 ± 4.06 ab
Rayong 1122.4 ± 4.74 b11.5 ± 4.09 b0.50 ± 0.08 b27.6 ± 0.78 a
CMR38–125–7733.5 ± 3.91 a22.8 ± 2.81 a0.68 ± 0.04 a28.2 ± 0.98 a
F *****
SD = standard deviation; F = F-distribution; * and ** = statistical significance on p ≤ 0.05 and p ≤ 0.01, respectively; ns = non-significance in statistics. Values followed by the same letter (in each planting date) are not significantly different from the Least Significant Difference Test.

