Article

Value Chain of Charcoal Production and Implications for Forest Degradation: Case Study of Bié Province, Angola

1
Faculty of Forestry and Wood Sciences, Czech University of Life Sciences Prague, Kamýcká 129, CZ-16500 Prague, Czech Republic
2
Faculty of Tropical AgriSciences, Czech University of Life Sciences Prague, Kamýcká 129, CZ-16500 Prague, Czech Republic
3
Institute of Ethnology, Academy of Sciences of the Czech Republic, Na Florenci 3, CZ-11000 Prague, Czech Republic
*
Authors to whom correspondence should be addressed.
Environments 2018, 5(11), 113; https://doi.org/10.3390/environments5110113
Submission received: 31 August 2018 / Revised: 9 October 2018 / Accepted: 23 October 2018 / Published: 26 October 2018

Abstract

:
Forest degradation and forest loss threaten the survival of many species and reduce the ability of forests to provide vital services. Clearing for agriculture in Angola is an important driver of forest degradation and deforestation. Charcoal production for urban consumption as a driver of forest degradation has had alarming impacts on natural forests, as well as on the social and economic livelihood of the rural population. The charcoal impact on forest cover change is in the same order of magnitude as deforestation caused by agricultural expansion. However, there is a need to monitor the linkage between charcoal production and forest degradation. The aim of this paper is to investigate the sequence of the charcoal value chain as a systematic key to identify policies to reduce forest degradation in the province of Bié. It is a detailed study of the charcoal value chain that does not stop on the production and the consumption side. The primary data of this study came from 330 respondents obtained through different methods (semi-structured questionnaire survey and market observation conducted in June to September 2013–2014). A logistic regression (logit) model in IBM SPSS Statistics 24 (IBM Corp, Armonk, NY, USA) was used to analyze the factors influencing the decision of the households to use charcoal for domestic purposes. The finding indicates that 21 to 27 thousand hectares were degraded due to charcoal production. By describing the chain of charcoal, it was possible to access the driving factors for charcoal production and to obtain the first-time overview flow of charcoal from producers to consumers in Bié province. The demand for charcoal in this province is more likely to remain strong if government policies do not aim to employ alternative sources of domestic energy.

1. Introduction

The main source of energy for cooking and heating used by the majority of the urban and suburban population in Africa is wood-fuels (e.g., charcoal and firewood). These account for more than 80% of the primary energy supply in sub-Saharan Africa and are an important source of household income [1,2]. The production and utilization of these wood-fuels have been growing in line with population growth, thus changing the pace of deforestation in sub-Saharan Africa [3,4]. The chain of charcoal production is linked to rural population growth and motivated by the urban consumption of charcoal. The consumption of charcoal is mainly motivated by the cultural behavior of people living in the cities in terms of use of charcoal to cook their food. As African cities grow, the request for charcoal production has increased as well. The increase in the demand for charcoal always means cutting down more trees to get wood for charcoal making, which may increase the rate of deforestation.
The charcoal sector in Africa is weakened by a lack of reliable information, because a very small fraction of charcoal produced is assessed and recorded. Therefore, the actual magnitude of use, and impacts on forest degradation or rural livelihoods has been a subject of debate [5,6]. The attempt to capture the impact of charcoal production on deforestation in Africa has been addressed by many scholars [7,8]. In Tanzania, charcoal production accounted for 30,000 ha per year of degraded closed woodland in 2005 and 2006 [9,10]. In Malawi, about 15,000 ha of forest have been cut down yearly due to charcoal production [5,11]. Commercial agriculture, followed by subsistence agriculture, are the main drivers of deforestation, while timber extraction followed by fuel wood collection, charcoal production, uncontrolled fires, and livestock grazing are the drivers of forest degradation. The link between charcoal production and deforestation have been demonstrated by several studies since the early 90s and this linkage is due to fact that deforestation frequently occurs in areas with intense charcoal production [1]. The common reason is that deforestation was always a result of agricultural expansion and logging. The need for new agricultural lands causes more damage than the charcoal production itself. Charcoal production is considered as merely a by-product of the deforestation process [12,13]. On the other hand, it is also a derision to believe that deforestation is not due to charcoal production. In Ethiopia, for instance, about 230,000 tons of charcoal is used for domestic purposes annually, while in Zambia, the consumption of charcoal reaches 700,000 tons per year [14,15,16,17].
The data on charcoal production are usually generated from surveys, which focus either on consumption or production, and rarely on both [1]. The estimation of quantities of charcoal produced in certain regions is misleading and the differences between recorded and reported data are enormous [18]. The consensus to assess deforestation and degradation due to charcoal goes from assessing historic data adjusted to national circumstances to spatial analysis of the land use changes [19].
In Angola, about 80% of the population relies on charcoal and firewood to meet their residential energy needs. The attempt to capture charcoal production and its influence on forest degradation is a new issue [20]. The production of charcoal is regulated by annual licenses issued by the Institute for Forest Development (IFD) in Angola. The request for licenses must include the following information: a description of the type of vegetation cover verified by IFD, a map of the area to be licensed, tree species in the area, and indication of the utilization of the finished and unfinished product. However, the producers of charcoal do not follow the mentioned criteria, so charcoal is produced illegally and clandestinely.
Before the independence of Angola in 1975, the production of charcoal was not a financially feasible activity among farmers, because at that time, farmers focused on agricultural activities to generate income. Therefore, no serious degradation of natural forests was registered. Today, wood extraction for charcoal and firewood is responsible for an annual deforestation rate of 0.9 to 1.0 percent in Angola [21,22]. There is much pressure on existing natural forests, especially in places with high fuel-wood production and charcoal consumption. REDD (Reducing Emissions from Deforestation and Forest Degradation) + initiatives are at a starting point in Angola, to monitor and improve forestry information in the country [23].
Charcoal is normally produced by applying a selective logging system based on preferred tree species or by a clear cut during the extension of agricultural land [24,25]. It also targets a specific tree size using trees above a minimum cutting diameter of 15 cm. The most common species used include Brachystegia spiciformis, Brachystegia boehmii, Cordyla africana, and Combretum imberbe. Moreover, in areas where the preferred trees are scarce, several fruit trees are used to produce charcoal. It is difficult for the forestry sector in Angola to generate data that capture production and consumption volumes of charcoal [26]. The production of charcoal has far-reaching impacts on forest degradation and extends across a range of social-economic and environmental issues of people. The methodology used to describe the flow of charcoal production and its impacts starts from the producers of charcoal up to the consumers. The obtained data from interviews with the involved agents in each step of the value chain was important to achieve the set objectives. The objective of the study is to describe the value chain of charcoal, to analyze social causes of charcoal production and consumption, and to obtain new information for improving charcoal policies. It is assumed that investigating the sequence of the charcoal chain is the key for a systematic description of forest degradation and improvement policies. The specific objectives of the study are:
  • to investigate tree species used for charcoal production;
  • to analyze deforestation by following the chain of charcoal from production to the consumption level.

2. Materials and Methods

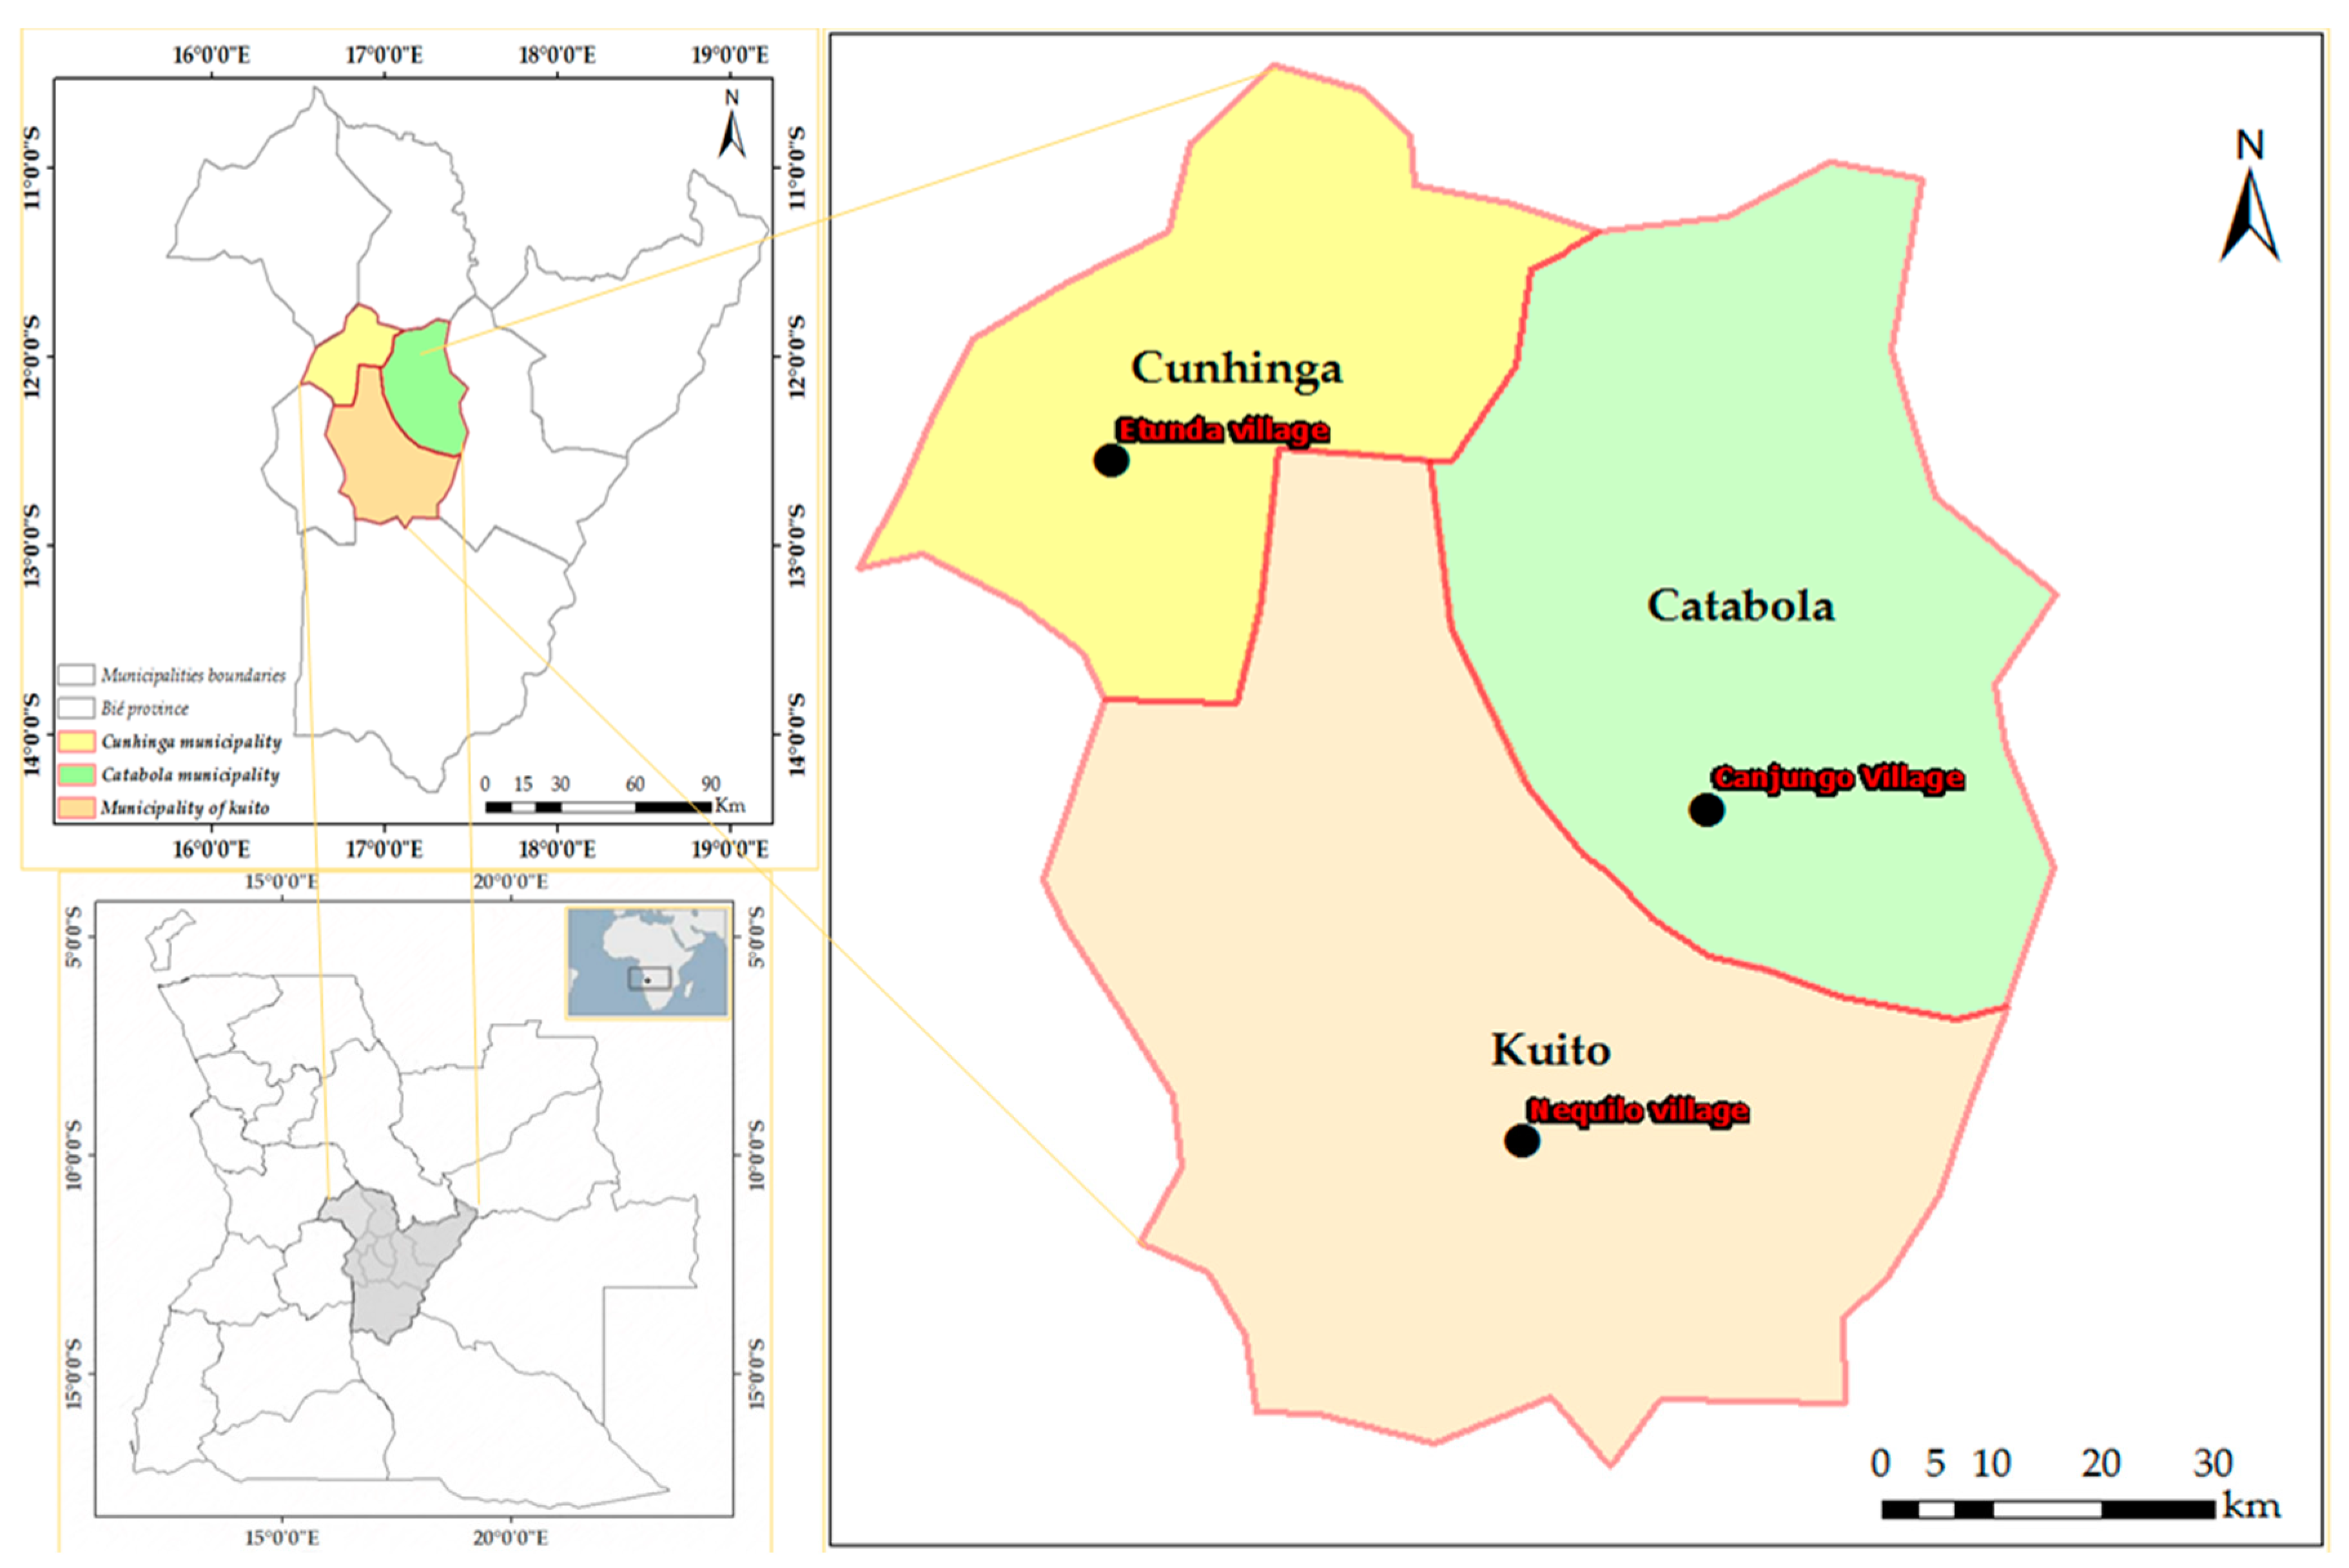
2.1. Characteristics of the Study Area

Angola (Figure 1) is one of the largest countries in southern Africa (1.24 million km2), covering a variety of climatic characteristics. It corresponds to five climate types classified by the Köppen-Geiger system [27]. There are 32 vegetation units identified in the country, ranging from rainforests in the northwest to desert in the southwest [28].
Bié province is located on a plateau in the central part of Angola between 10°34″–14°18″ S and 15°42″–19°13″ E (Figure 1). The climate ranges from tropical wet/humid in the north and north-west dominated by Congolian forest-savanna mosaics to extremely arid climate in the south-west, occupied by dry savanna woodlands/Miombo and the desert [29]. The mean altitude is about 1500 m a.s.l., ranging from 1350 m a.s.l. in wetlands to 1650 m a.s.l. on the tree-covered summits [30]. It has moderate temperatures, with a mean annual average of 20.4 °C and rainfall of 987 mm from November to April. The province of Bié constitute a landmass of 70,314 km2 with nine administrative municipalities (Figure 1). The main socio-economic activities are agriculture and fishery. The predominant tree species in Bié province are Brachystegia spiciformis, Isoberlinia angolensis, and Julbernardia paniculata, which represents typical vegetation in Miombo forests [31].
For the analysis, three study areas were selected for ground data collection and assessment. A combination of field observations, questionnaire survey, and literature review was used to quantify the deforested areas and access the consumption of charcoal. The municipalities were chosen based on the questionnaire assessment of the main areas for charcoal production in the province.

2.2. Data Collection

The target groups were classified into four stakeholders involved in the charcoal chain that included producers (farmers), transporters, traders, and consumers. Each of these actor groups was surveyed separately with a different semi-structured questionnaire. In addition, a market observation was conducted over two periods: June to September of the year 2013 and 2014, targeting the beginning of the coldest month and beginning of the rainy season.
Data from producers of charcoal were obtained through a semi-structured questionnaire survey and field observations. The total number of producers (farmers) surveyed was 98; the respondents came from Nequilo (n = 26), Canjungo (n = 45), and Etunda (n = 27) villages. The respondents were selected by snowball sampling and the sample size depended on the willingness of the respondents to cooperate. The snowball sampling yields a study sample through referrals made among people who share or know of others who possess some characteristics that are of research interest, meaning farmers that produce charcoal [32]. A random sample of individuals is drawn from a given finite population. Each individual in the sample is asked to name k different individuals in the population, where k is a specified integer; for example, each individual may be asked to name his “k best friends” or individuals with a similar association on the topic [33]. The survey began by accessing major components of households, like agriculture and agro-forestry activities, livestock, income assessment, and forest and non-forest products. The survey also assessed the species used for charcoal in each producing area and recorded names of the species (see File S1 of Supplementary Materials).
The transporters were stopped on the road and they came from Nequilo (n = 9), Canjungo (n = 8), and Etunda (n = 5) villages; questions on price charged per bag of charcoal, quantities of bags carried, and the distances from where charcoal has been transported were enquired. The sample size depended on the willingness of the transporters (drivers) to stop and cooperate; therefore, the questionnaire was designed not to take more than 10 min.
For the traders, the data were obtained in Kuito market (the main market in the Bié province) through a participatory rural appraisal approach. The number of vehicles (trucks, bicycles, and pick-ups) carrying sacks of charcoal to this market was counted and recorded once in two periods between June and November 2013 and 2014. The observation was conducted three days per week (Mondays, Wednesdays, and Fridays), and then the order was changed the following week (except Sundays). Finally, the data among consumers of charcoal were obtained from Kuito municipality (the capital of the province), representing Camalaia and Piloto districts with 105 and 250 families, respectively. The selection of consumers was also based on snowball sampling.

2.3. Data Analysis

The analysis of the charcoal value chain followed a vertical structure (from producers to consumers of charcoal). The one-way ANOVA (a method commonly used to determine whether there are any statistically significant differences between the means of two or more independent (unrelated) groups) was applied to test the average prices of charcoal in the selected villages. Spearman correlation was applied to find the relationship between the transportation costs to the cities and the distance from where charcoal was produced. A logistic (logit) regression model in IBM SPSS Statistics for Windows, Version 24.0 (IBM Corp, Armonk, NY, USA), was used to study the variables influencing the decision of the households to use or not to use charcoal. The dependent variable was defined whether a household uses or does not use charcoal to cook meals. The code’s variables were one (1) = use and two (2) = none use. The independent variables were: household size; purchasing price of charcoal; frequency a household used charcoal per week; the quantity of charcoal consumed per month per household; and the use of other alternative sources of energy, for example, liquefied petroleum gas (LPG). Rather than calculating income, we calculated the gross margin for a better comparison. For the calculation of gross margin, we used the amount of charcoal recorded at the production site. The gross margin (GMi) was calculated as the difference of total revenue (TRi) and the total variable costs (VCi), which included transportation costs, packaging, loading and unloading [34,35].
For the calculation of charcoal consumption per capita, we adapted the equation used by [3] when calculating the total annual per capita consumption (Equation (1)).
C c = 12 S H
where H is the average household size; S is the quantity of charcoal consumed (in kg) by the household per month; 12 represents not the missing values as per [3], but the months of the year; and Cc is the consumption per capita.
The degradation caused by charcoal production was estimated using the amount of charcoal accessed on the provincial charcoal market. The parameters used in Equation (2) were obtained from the literature, where 0.19 percent represents [8] the wood conversion rate (in traditional kilns) chosen [8,36,37], and the above ground biomass (AGB) density for Miombo forest was 75 t/ha. The wood AGB was picked from the Global Forest Watch source and the last number of the fourth-class value in the classification was chosen, which is appropriate to study the municipality sites where the data were collected [38]. This is a higher-resolution data product that expands the methodology presented by [38] to generate a pantropical map of AGB density at a 30 m resolution. Moreover, it was also necessary to estimate the amount of charcoal that fits into one bag in kg. Therefore, the total amount of charcoal collected (number of bags) in the charcoal market was converted into kilograms (kg) (the estimated average weight of one bag of charcoal is 38 kg) and subsequently to tonnes (t), then multiplied by 12 (months of the year) and divided by four (number of months the charcoal in market was recorded), and finally applied to Equation (2). The weight of 38 kg represents the average weight of bags accessed in the market. For the calculation, it was assumed that communities sell at least 70% of the charcoal in this market. This assumption was possible because rural populations normally use firewood as cooking energy and charcoal is sold in the city markets [39,40]. The provincial market of Kuito is the main market in the province where charcoal from different municipalities is sold. The amount of charcoal recorded in the market was used in the estimation of Equation (2). The evidence of this argument is supported by the responses of the questionnaire survey that was carried out in the areas of charcoal production and in Kuito market (see File S1 of Supplementary Materials).
Forest   degradation   ( h a ) = Quantity   of   charcoal   produced   ( t ) × 1 0.19 Biomass   ( t h a )

3. Results and Discussion

The stakeholders participating in the charcoal value chain range between 31 to 40 years old, with a maximum educational level of not more than five years of schooling. Charcoal was produced for two main reasons: (i) income generation (96%); and domestic uses (4%), for example, grilling and ironing clothes. The general characteristics of the respondents are summarized in Table 1.

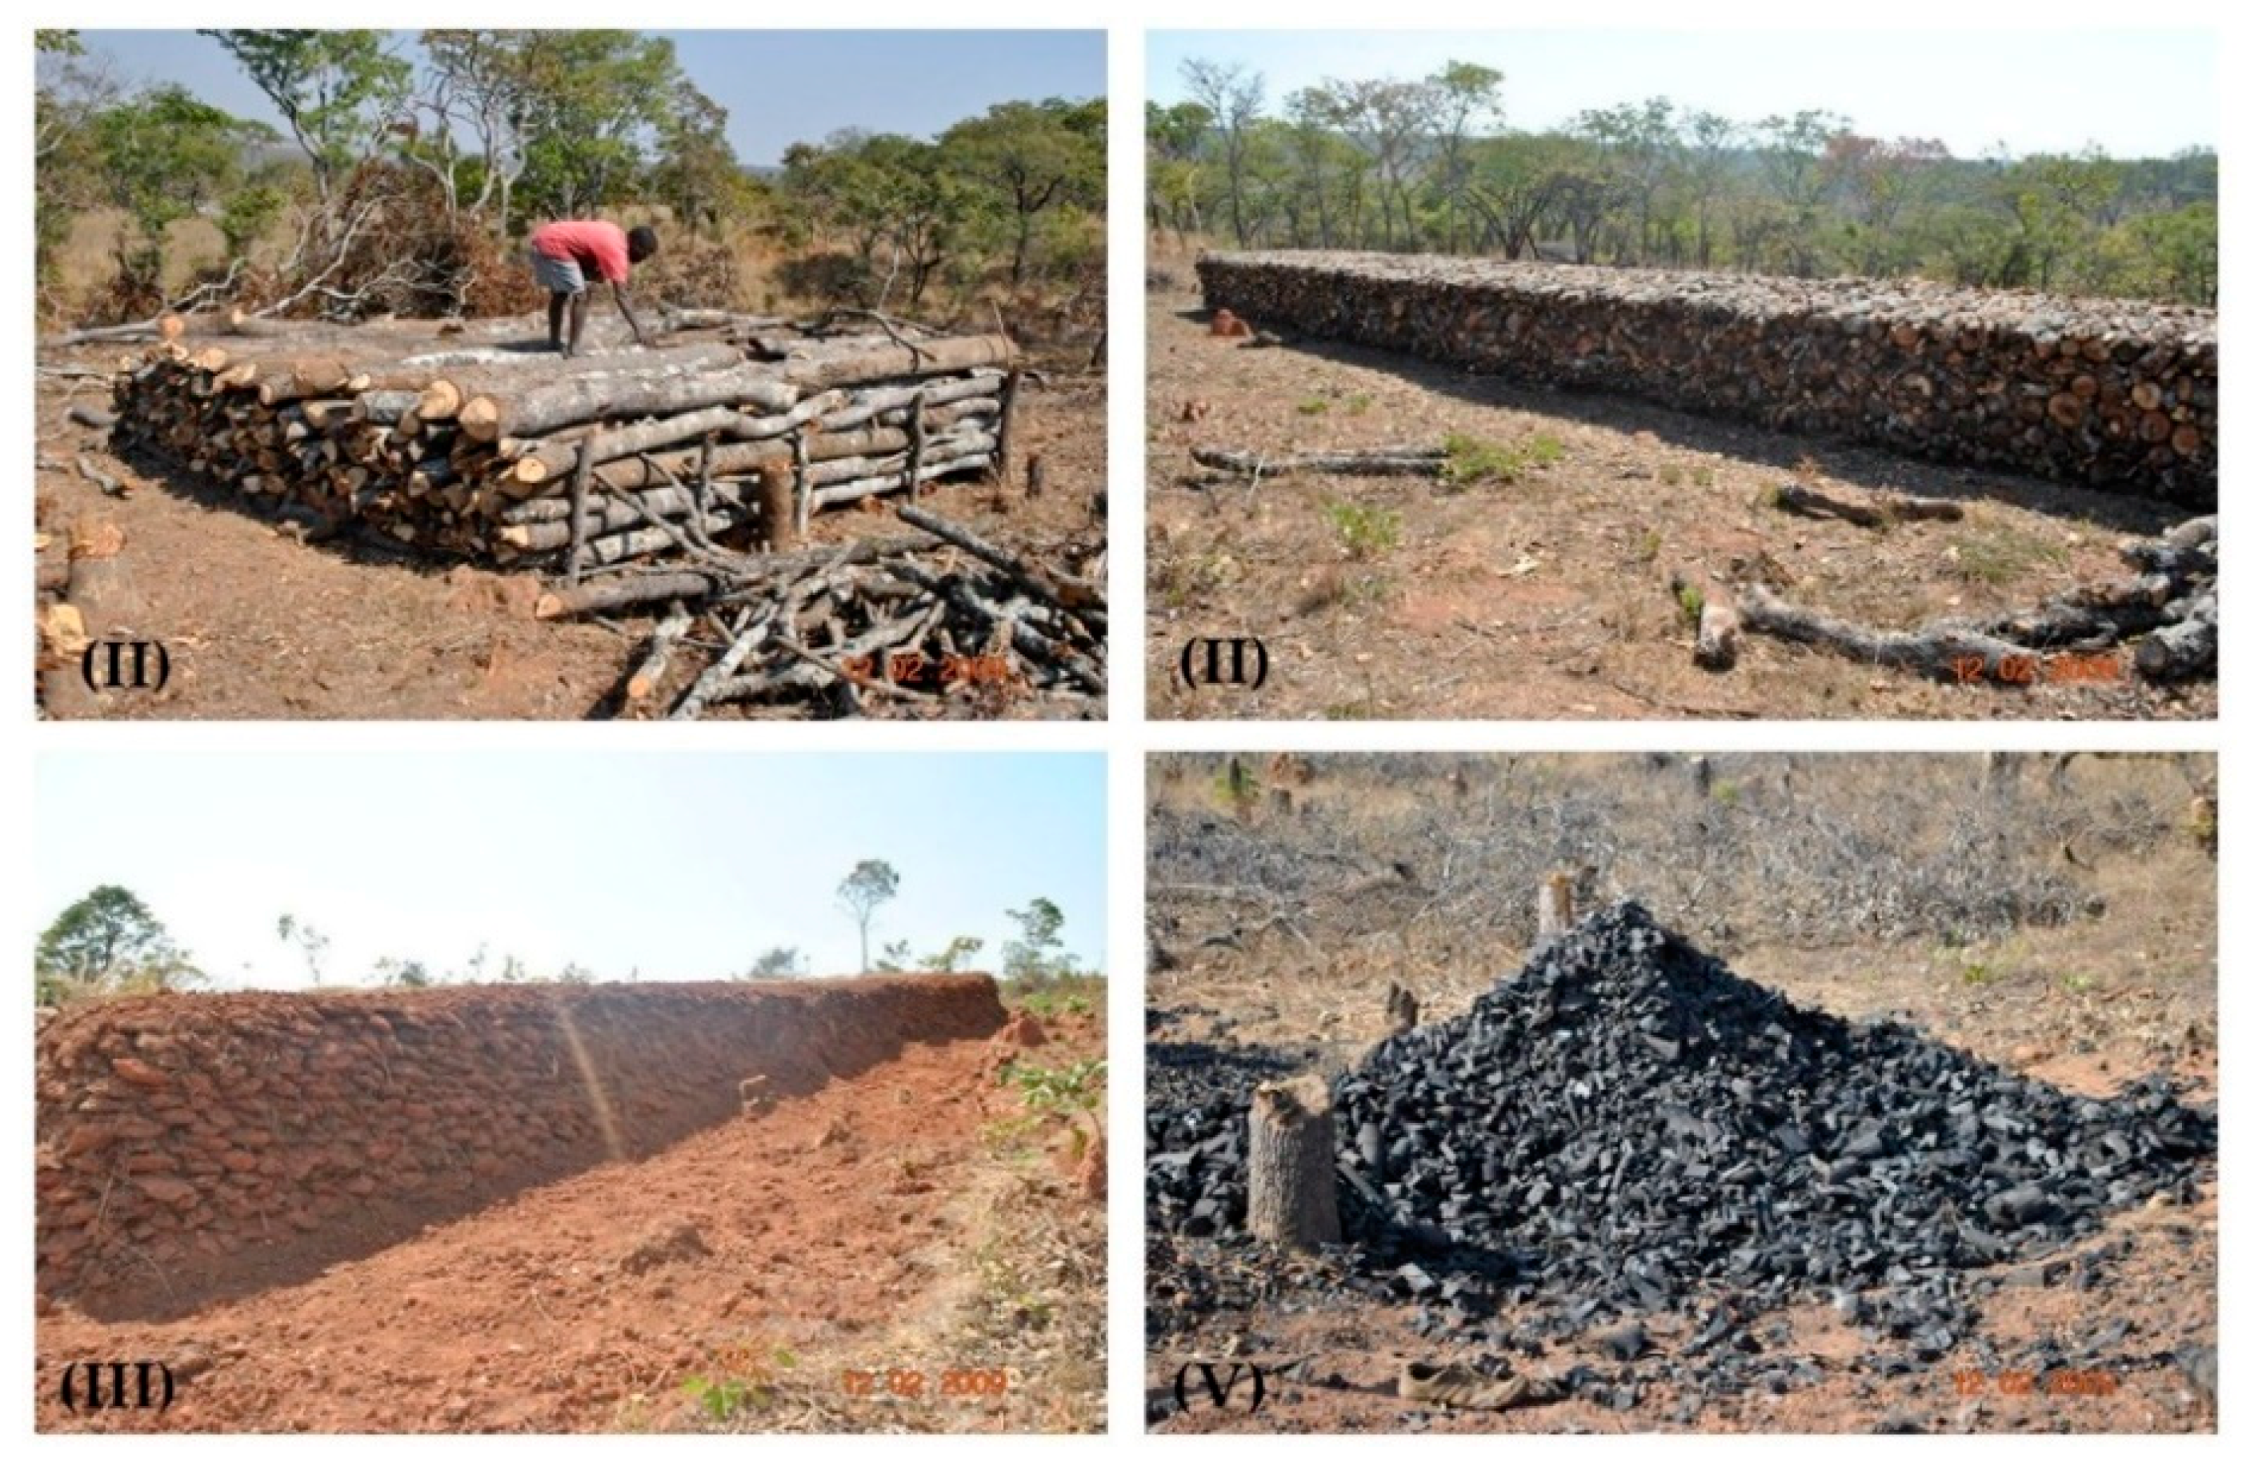
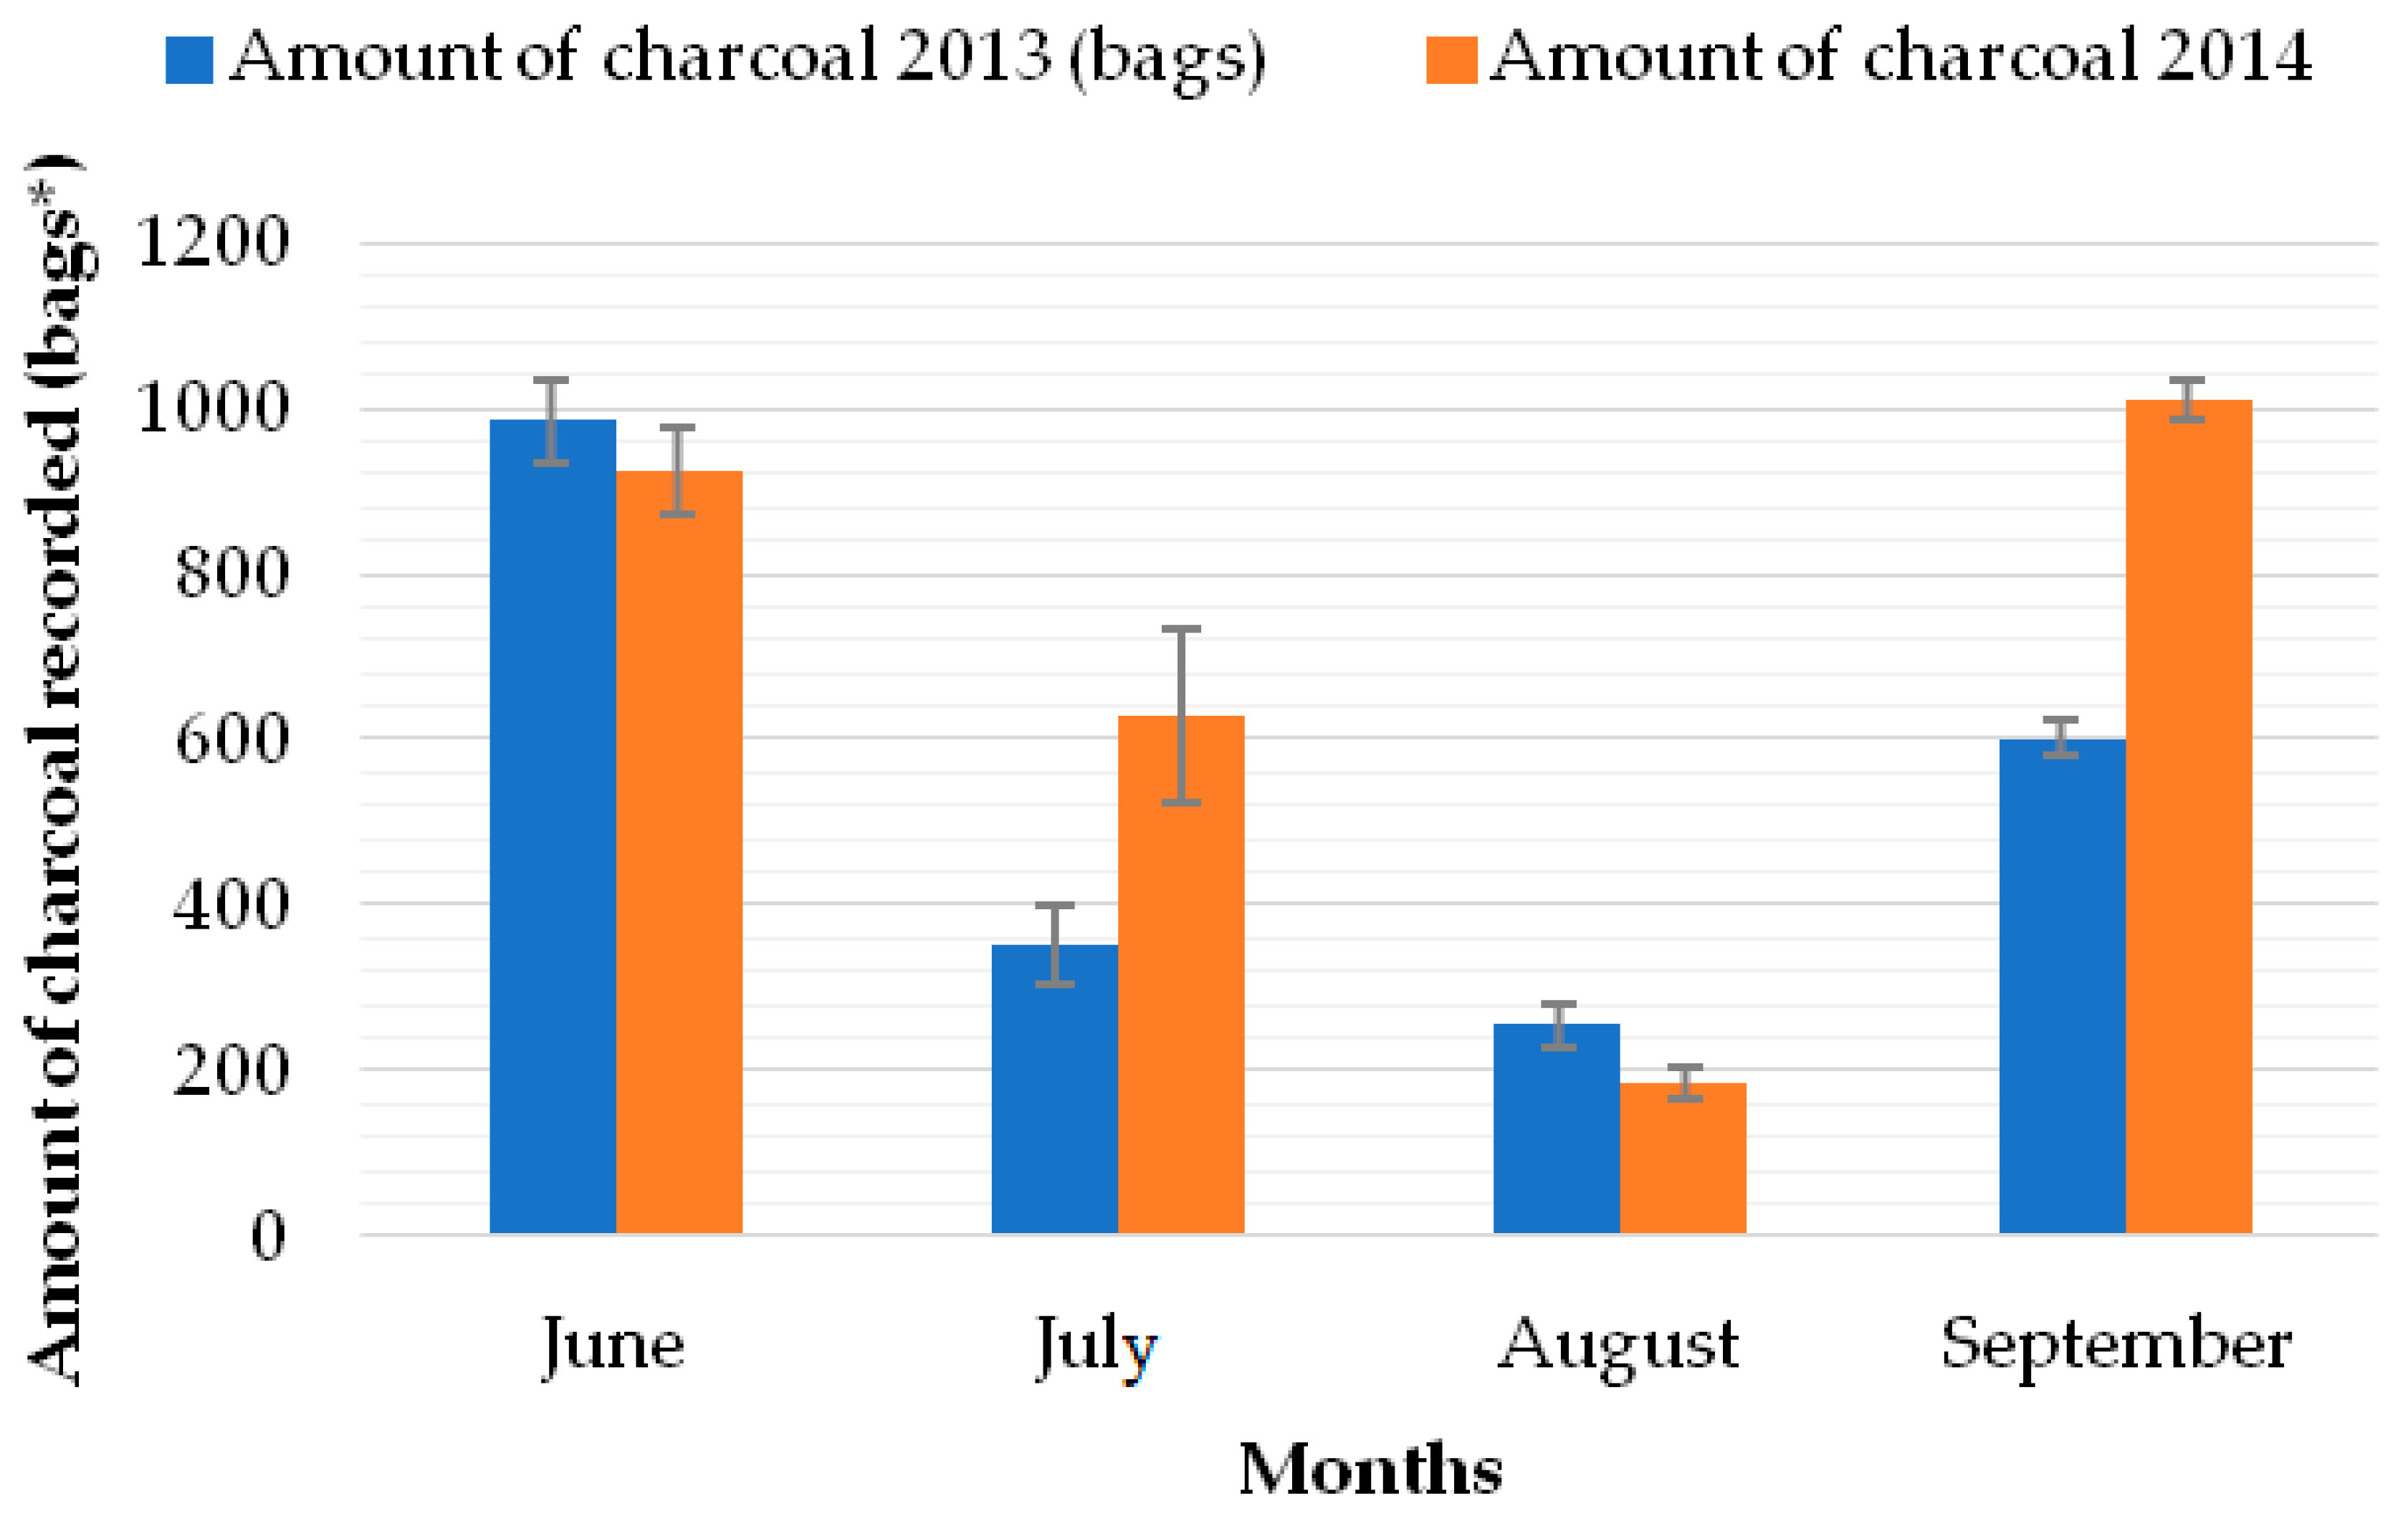
3.1. Production of Charcoal

From the producer’s side, two major sub-groups emerged; charcoal-dependent and farmer-dependent households. Charcoal-dependent was the most reliant group on charcoal production for income generation, and they were in the range of 25 to 35 years old. Most of them were farmers that had abandoned agricultural activities, got to know the opportunities of the charcoal business in the cities, and decided to exploit the forest from their villages.
The other group (farmers dependent) was dependent on agricultural production, who from time to time, produce charcoal as their secondary source of income. The crops cultivated by these farmers are maize, beans, and potatoes. This group (farmer-dependent) had on average six family members and they used the family labor force to produce charcoal. Moreover, they were producing charcoal only when they were opening new agricultural land (the so-called “Alunda” in the local language of Umbundu). The production of charcoal forces farmers to spend several hours every day sourcing wood for charcoaling, which reduces the time they devote to other activities, such as agriculture or education of the children. On the other hand, the differences between the two groups in terms of profits generated from charcoal can be seen in terms of domestic goods ownership, such as TV, bicycles or motorbikes, and mobile phones (Table 1 and Table 2).
The logging for the production of charcoal was done selectively when conducted by the charcoal-dependent group (foresters); on average the preferred size for cut stems was between 10 to 90 cm in diameter. However, the farmer-dependent group do not apply selective logging. The latter must open the agriculture field, so they cut any tree inside the area to be cultivated. The most predominant species were Brachystegia spiciformis (local name is Omanda), Brachystegia ssp. (local name is Usamba), Isoberlinia angolensis (local name is moné), and Julbernardia paniculata. However, the preference of each species depends on its availability and tree sizes. The process of charcoal production in the province follows five steps: (i) felling/cutting of trees; (ii) piling of the logs into a clamp; (iii) covering the clamp with dung and soil; (iv) carbonization of the wood; and (v) harvesting of charcoal and packaging it into bags (Figure 2). The amount of charcoal produced from a kiln depends on several factors related to the carbonization efficiency [41].

3.2. Charcoal Transportation

The transporters were mainly younger and better educated than the producers. The average distance from the kilns to the main road was 3 km; therefore, bicycles were used to carry charcoal to the roadside or closer to the points where it could be easily loaded onto trucks (see Figure S1 of Supplementary Materials). Most transporters were born in the villages where they practiced their business activities. About 40% of the transporters own the business and play the role of the intermediary. They sell the charcoal to the traders in Kuito market. The price of one bag of charcoal and the transportation costs (to the provincial market) was intrinsically inversely proportional to the distance from where charcoal was produced (r = −0.353, p = 0.002). Transportation costs were more expensive if the locality was far from the provincial market of Kuito (Table 3).

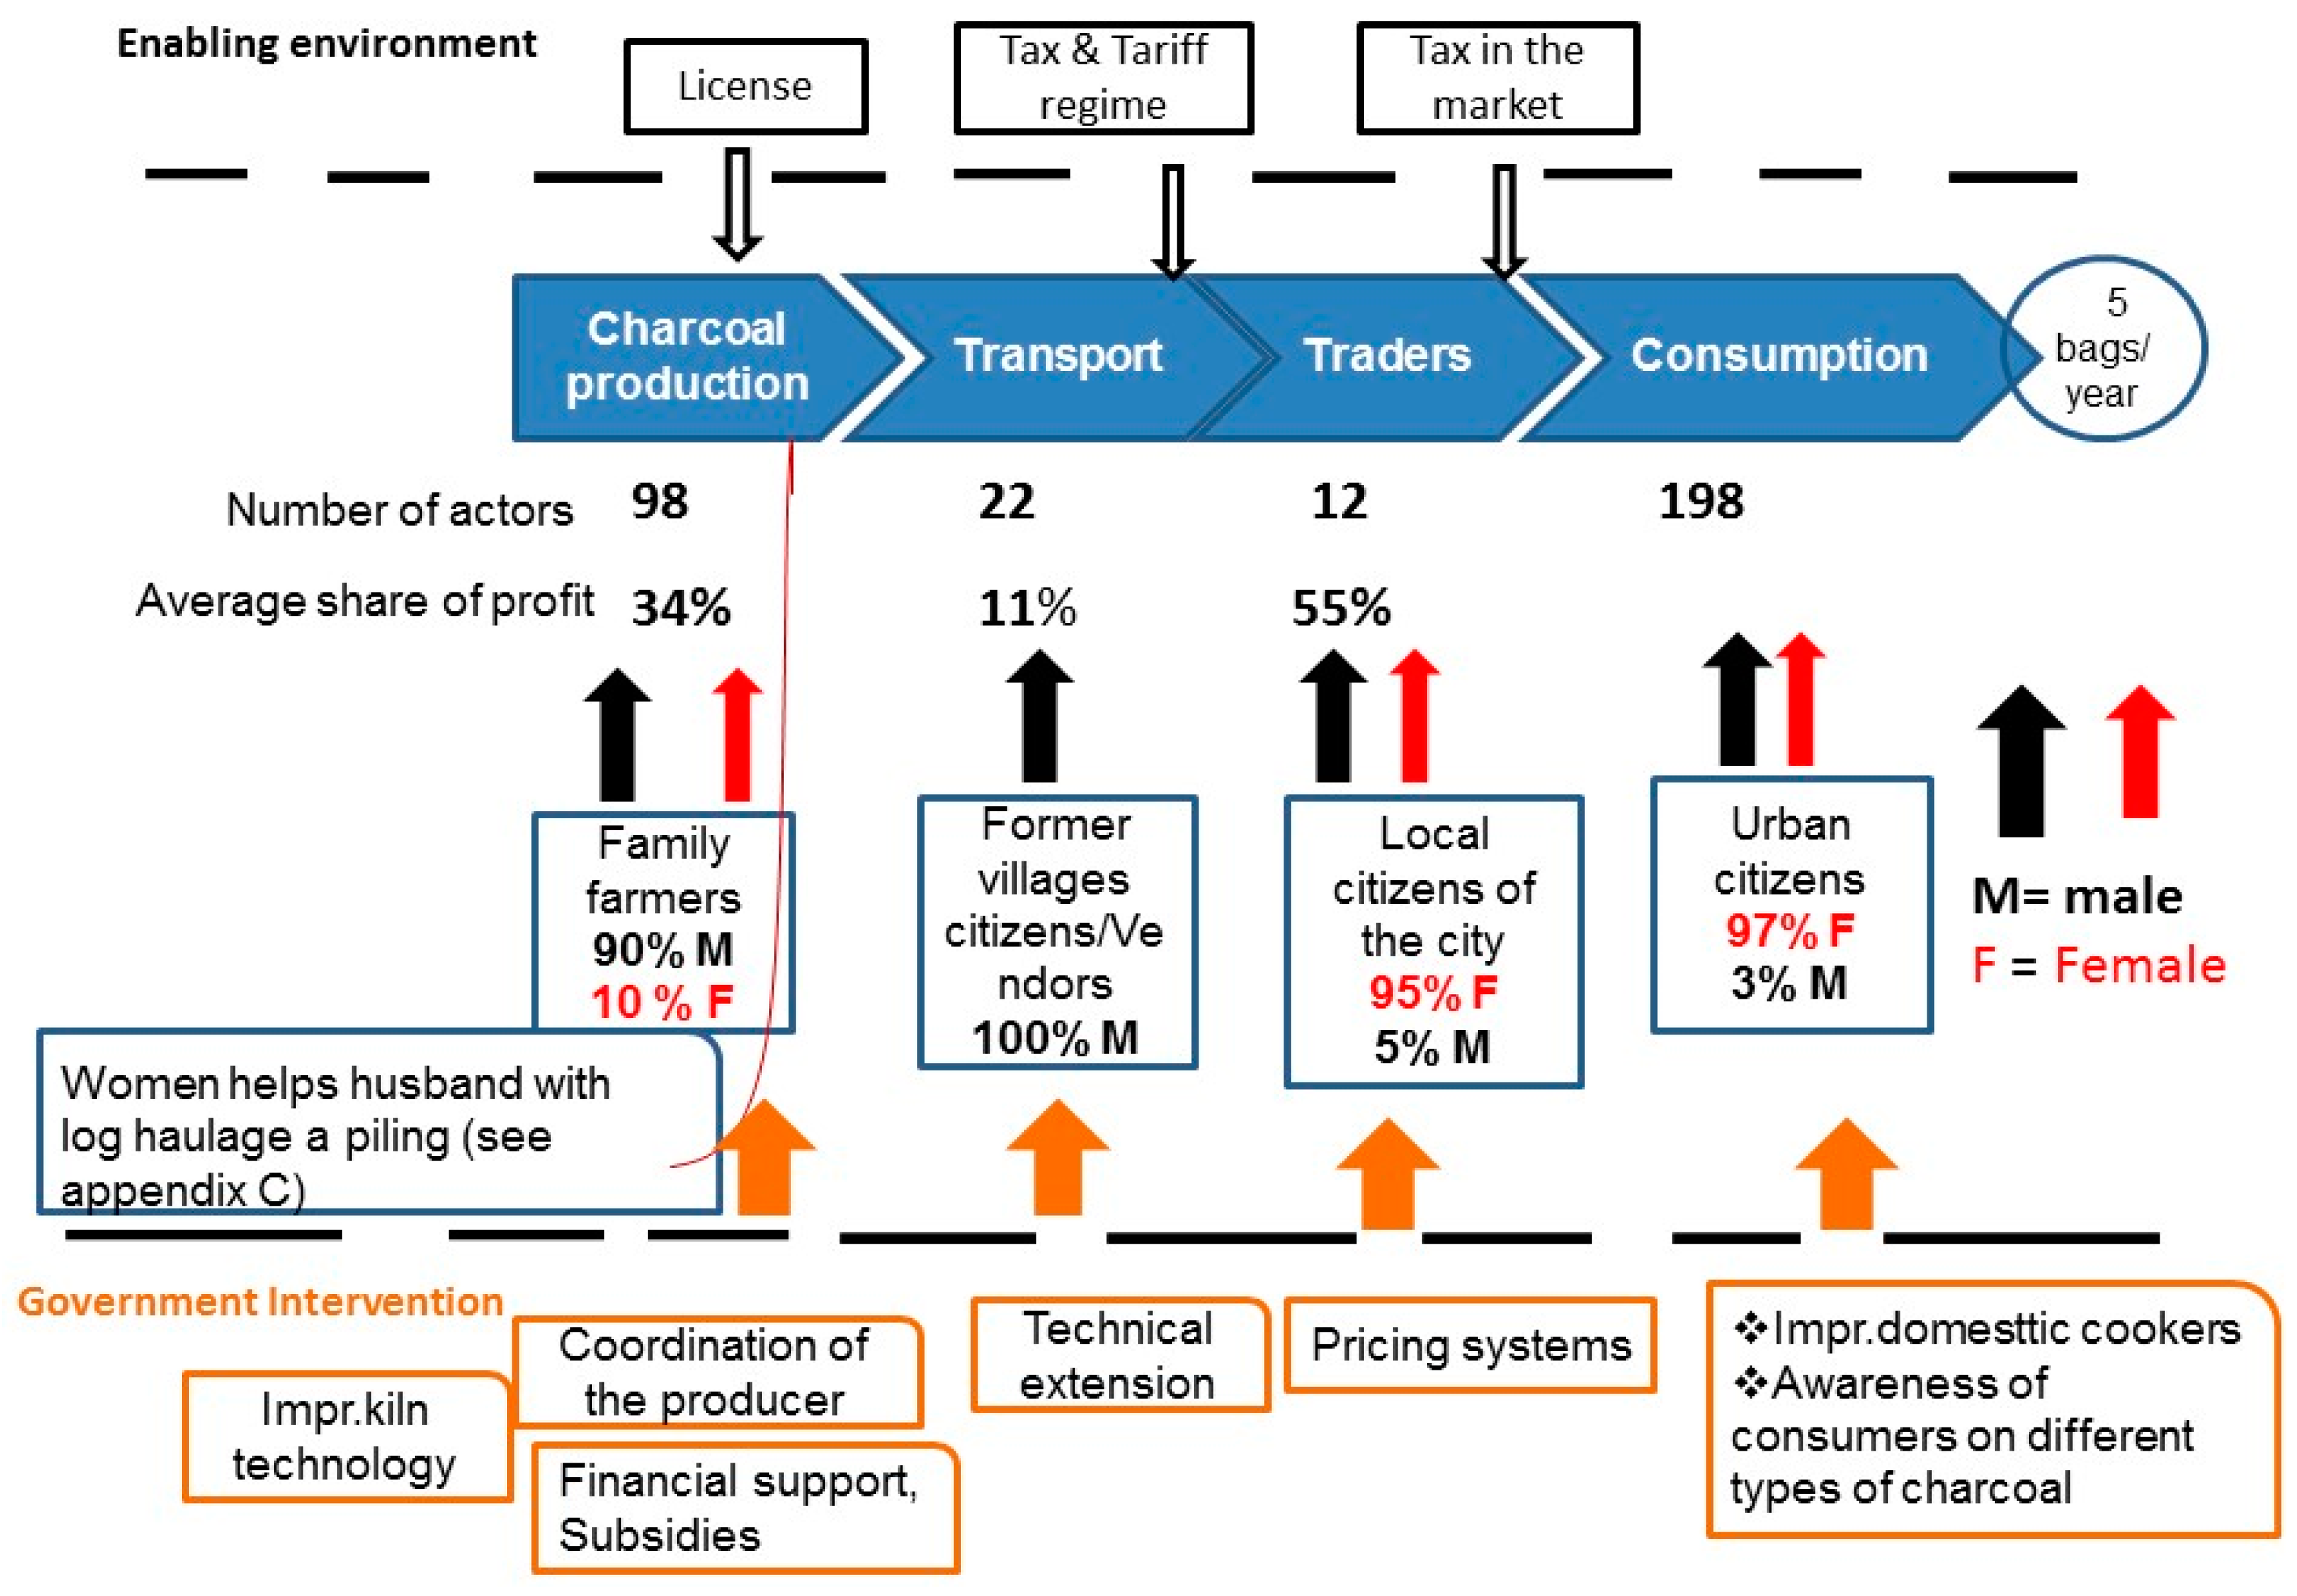
3.3. Charcoal Trading

Charcoal is traded in the market and along the roadside (see Figure S1 of Supplementary Materials). Women mainly represented the traders and they had a higher profit share along the charcoal value chain. The results of interviews and observation in the market indicate that in June, the quantities of charcoal going to the market were higher, and then gradually tend to decrease until August (Figure 3). Due to the limited data we collected, it was only possible to accept the seasonal trend that predicts that during the rainy and cold months, there is a higher demand for charcoal in the market.
Figure 4 summarizes the actors along the value chain and the interventions that are taken at each stage of the chain. It also evaluates the share of profit of the participants along the value chain. Government intervention is recommended at each phase of the value chain. Enabling the environment (e.g., licenses for producers of charcoal and tax for traders and transporters) are means that the actors need to make the business legal. Government intervention can concentrate on the improvement of technologies for charcoal production, technical extension for appropriate vehicles to transport charcoal, and the establishment of a prices system for traders in the main market of Kuito. The enabling environment (license, tax for transports and traders) is not actively applied, and only the license at production sites is incentivized. Taxes in the market of charcoal could help the IFD to build financial capital to add the intervention at each phase of the chain of charcoal. On the consumption side, the use of improved cooking stoves is of great importance to economize charcoal and avoid losses of energy [42]. The production of charcoal in Bié province is, and will be for a long time, one of the main sources of income for the rural population and a source of domestic energy for urban households in the province, until alternatives sources of energy for urban citizens are at their disposal.

3.4. Consumption of Charcoal

The consumption per capita was found to be an average of five bags (171 kg of charcoal) per household per year. About 60% of respondents interviewed in Kuito used charcoal in combination with LPG. There was a positive correlation (r = 0.67; p = 0.04) between these two variables (utilization of charcoal and LPG). This explains the cultural behavior of consumers in terms of charcoal. Even people who apparently had a high economic and social status in the society were found to use charcoal for cooking their food.
The variables influencing the decision of households to use or not use charcoal were significant for frequency of using charcoal and the household size (Table 4). The most interesting result was the negative regression coefficient value, which essentially means that the probability of charcoal use decreases by 8.6%, with a one-person increase in household size. In other terms, households with more family members were more likely to use LPG than charcoal. This can be attributed to the efficiency and time saving for larger households when using LPG or a combination of the two (utilization of charcoal and LPG) compared with just charcoal. Other studies have also shown that the factors influencing the household expenditure on charcoal are related to household income, the charcoal price, household size, and the number of cooking sessions per day in the household [42,43,44].

3.5. Effects of Charcoal Production on Forest Degradation

The amount of charcoal produced from a kiln depends on factors related to carbonization and types of kilns used to burn charcoal. The most evident effects of deforestation were tree felling and road appearance in the forests where charcoal was produced. By using the country ground biomass density (GBD) (in average 75 t/ha) for the year 2000 [38] and the total quantity of charcoal collected in the market of Kuito (57,015,000 t/year), and applying this quantity to the model (2) of [8], about 21,000 hectares of forest was degraded due to charcoal production in the period from 2013 to 2014.
The accepted charcoal conversion ratio for Angola is that 9.6 m³ of wood produces 1 t of charcoal [20]. By extrapolating this assumption (9.6 m3 produce 1000 kg of charcoal) and using this same amount of charcoal (57,015,000 t/year), we obtained about 27,000 hectares of forest degraded due to charcoal in the province. Despite the importance of this study, the limitation is in the calculation of the degradation rate due to charcoal production. This is because the study does not comprise all producing and market points of charcoal in the province; therefore, the degradation calculated does not reflect the province, but only the areas where the data were collected. The data of the questionnaire survey of 2013–2014 gave an overview of the actual charcoal production situation in Bie, and characterized the processes that govern the improvements of the production of charcoal.
The judgment of the actual situation of charcoal production is limited by the availability of ground data due to the historical civil war-related research difficulties and the remote location of those areas where charcoal is being produced. The increase of agricultural land represents the most evident sign of forest degradation, justified by the need of the local population to increase their agricultural land following the civil war (1975–2002) [30,45]. Opportunities for improving the management of Miombo forest have been suggested as follows: First, be active in managing local natural resources and land reforms; and second, enhance forest-based markets by removing restrictive legislation and supporting local producers and forest enterprises. It consists of adjusting the legal framework to make it easier for small-scale charcoal producers to participate in the trade of charcoal legally [6,46,47].

4. Conclusions

The aim of this study was to assess the impact of charcoal production by following the chain of charcoal from production to the consumption level. The chain of charcoal production in the Bié province is linked to rural population growth and is motivated by the urban consumption of charcoal. The consumption of charcoal in Bié is mainly motivated by the cultural behavior of people living in the cities in relation using charcoal for cooking. Another motivation is related to the availability and cheapness of the resources to all. The consumers in urban areas are motivated by the lack of other cheaper alternative sources of domestic energy.
The description of the chain of charcoal in the province gave an overview of the situation of charcoal production and the effects on natural forest, where the main economically active group in the value chain were the traders (in Kuito markets), who were mainly women.
The subgroups identified used different channels to bring charcoal to the provincial market. Charcoal reaches consumers through three channels. These channels are summarized into: (i) Channel 1: Producers (farmer-dependent) sell charcoal to other producers (charcoal-dependent). This happens when a producer (farmer-dependent) has small quantities of charcoal and cannot afford transportation costs to the main market; (ii) Channel 2: Producers (charcoal-dependent) to transporters. This group accumulates large quantities of charcoal along the roadside and waits for transporters to buy it. Transporters sell to retailers in the main provincial market and these retailers usually sell it to final consumers in plastic bags of 2 to 4 kg; (iii) Channel 3: Producers to consumers. This happens when consumers go directly to producers in the villages where charcoal has been produced and where the prices are lower when compared to those in the city market.
The most predominant species used for charcoal production was Brachystegia spiciformis; the local community do not use Eucalyptus spp. for charcoal production. Therefore, it is recommended that Eucalyptus could be an alternative tree species for charcoal production due to its rapid growth characteristic and energy value. Moreover, this would reduce the pressure on natural forests.
The 21 to 27 thousand hectares of degraded forest, the road appearance, and the land use changes in the area represent a good indicator of the impact of charcoal production on natural forests. From this point of view, we recommend that practical strategies to reduce the degradation arising out of charcoal production shall be solved from short- and long-term perspectives. From the short-term perspective, it is possible by offering the local market charcoal produced from faster growing tree species, e.g., Eucalyptus. This can be attained through awareness and improvement of the efficiency of cooking stoves to minimize energy losses. In the long-term, we suggest establishing a timeframe of about 20 years, during which other fast-growing trees should be planted as a communal forest project in combination with agro-forestry systems. The degraded land could be used to plant fast-growing species for charcoal production to minimize the impact of charcoal production on natural forest.
From a very long-term perspective, this activity (production of charcoal) can take alarming directions due to the rising demand of charcoal for domestic uses in urban areas. The recommended strategies to set a community forest plantation with fast growing tree species can give another understanding to local farmers on how charcoal shall be burned in a sustainable way, as well as help REDD+ initiatives to select the appropriate areas to focus on. Charcoal policy innovations should address the negative images and controversial image of charcoal through concerted and targeted evidence-based advocacy, highlighting the wood-fuel sector’s benefit as an important productive economic sector, deserving higher prominence in key economic development proposals.

Supplementary Materials

The following are available online at https://www.mdpi.com/2076-3298/5/11/113/s1, File S1: Questionnaire survey; Figure S1: Illustration of the charcoal chain in Bié province-Angola.

Author Contributions

V.C. collected the data and wrote the manuscript; L.B. and V.V. supervised the manuscript and analyzed the data; P.S. supervised the manuscript and D.P. analyzed the remotely sensed data; J.W. corrected the methodology of the manuscript.

Funding

This research received no external funding.

Acknowledgments

We are grateful to the director of the Institute for Forest Development (IFD) for his support during the data collection. We thank the Faculty of Tropical AgriSciences of the Czech University of Life Sciences (CULS) in Prague for the financial mobility support during data collection in Angola. In Angola, we would like to thank the community of Canjungo, Nequilo, and Etunda for their cooperation and hospitality and for guiding us to locate the kilns in the forests.

Conflicts of Interest

The authors declare no conflict of interest.

References

  1. Mwampamba, T.H.; Ghilardi, A.; Sander, K.; Chaix, K.J. Dispelling common misconceptions to improve attitudes and policy outlook on charcoal in developing countries. Energy Sustain. Dev. 2013, 17, 75–85. [Google Scholar] [CrossRef]
  2. Jones, D.; Ryan, C.M.; Fisher, J. Charcoal as a diversification strategy: The flexible role of charcoal production in the livelihoods of smallholders in central Mozambique. Energy Sustain. Dev. 2016, 32, 14–21. [Google Scholar] [CrossRef] [Green Version]
  3. Mwampamba, T.H. Has the woodfuel crisis returned? Urban charcoal consumption in Tanzania and its implications to present and future forest availability. Energy Policy 2007, 35, 4221–4234. [Google Scholar] [CrossRef]
  4. Labarta, R.A.; White, D.S.; Swinton, S.M. Does Charcoal Production Slow Agricultural Expansion into the Peruvian Amazon Rainforest? World Dev. 2008, 36, 527–540. [Google Scholar] [CrossRef]
  5. Zulu, L.C. The forbidden fuel: Charcoal, urban woodfuel demand and supply dynamics, community forest management and woodfuel policy in Malawi. Energy Policy 2010, 38, 3717–3730. [Google Scholar] [CrossRef]
  6. Zulu, L.C.; Richardson, R.B. Charcoal, livelihoods, and poverty reduction: Evidence from sub-Saharan Africa. Energy Sustain. Dev. 2013, 17, 127–137. [Google Scholar] [CrossRef]
  7. Hosonuma, N.; Herold, M.; De Sy, V.; De Fries, R.S.; Brockhaus, M.; Verchot, L.; Angelsen, A.; Romijn, E. An assessment of deforestation and forest degradation drivers in developing countries. Environ. Res. Lett. 2012, 7. [Google Scholar] [CrossRef]
  8. Chidumayo, E.N.; Gumbo, D.J. The environmental impacts of charcoal production in tropical ecosystems of the world: A synthesis. Energy Sustain. Dev. 2013, 17, 86–94. [Google Scholar] [CrossRef]
  9. Abdallah, J.; Monela, G. Overview of Miombo woodlands in Tanzania. In Proceedings of the First MITMIOMBO Project Workshop, Morogoro, Tanzania, 6–12 February 2007; Volume 50, pp. 9–23. [Google Scholar]
  10. Schaafsma, M.; Morse-Jones, S.; Posen, P.; Swetnam, R.D.; Balmford, A.; Bateman, I.J.; Burgess, N.D.; Chamshama, S.A.O.; Fisher, B.; Green, R.E.; et al. Towards transferable functions for extraction of Non-timber Forest Products: A case study on charcoal production in Tanzania. Ecol. Econ. 2012, 80, 48–62. [Google Scholar] [CrossRef]
  11. Kambewa, P.S.; Mataya, B.F.; Sichinga, W.K.; Johnson, T.R. Charcoal: The Reality—A Study of Charcoal Consuption, Trade and Production in Malawi; International Institute for Environment and Development: London, UK, 2007; ISBN 978-1-84369-678-0. [Google Scholar]
  12. French, D. Confronting an unsolvable problem: Deforestation in Malawi. World Dev. 1986, 14, 531–540. [Google Scholar] [CrossRef]
  13. Combes Motel, P.; Pirard, R.; Combes, J.L. A methodology to estimate impacts of domestic policies on deforestation: Compensated Successful Efforts for “avoided deforestation” (REDD). Ecol. Econ. 2009, 68, 680–691. [Google Scholar] [CrossRef] [Green Version]
  14. Malimbwi, C. Contribution of Charcoal Extraction to Deforestation: Experience from CHAPOSA Research Project; Sokoine University of Agriculture: Morogoro, Tanzania, 2005; pp. 1–14. [Google Scholar]
  15. Mugo, F.; Ong, C. Lessons from Eastern Africa’s Unsustainable Charcoal Business; World Agroforestry Centre: Nairobi, Kenya, 2006; p. 34. [Google Scholar]
  16. Al-Hamdan, M.Z.; Oduor, P.; Flores, A.I.; Kotikot, S.M.; Mugo, R.; Ababu, J.; Farah, H. Evaluating land cover changes in Eastern and Southern Africa from 2000 to 2010 using validated Landsat and MODIS data. Int. J. Appl. Earth Obs. Geoinf. 2017, 62, 8–26. [Google Scholar] [CrossRef]
  17. Alem, Y.; Beyene, A.D.; Kohlin, G.; Mekonnen, A. Household Fuel Choice in Urban Ethiopia: A Random Effects Multinomial Logit Analysis. Environment for Development. 2013. Available online: http://www.efdinitiative.org/sites/default/files/publications/efd-dp-13-12.pdf (accessed on 20 October 2017).
  18. Shackleton, C.M.; Clarke, J.M.; Genesis Analytics (Pty) Ltd. Paper I: Research and Management of Miombo Woodlands for Products in Support of Local Livelihoods; World Bank: Washington, DC, USA, 2007; pp. 1–58. [Google Scholar]
  19. Ryan, C.M.; Hill, T.; Woollen, E.; Ghee, C.; Mitchard, E.; Cassells, G.; Grace, J.; Woodhouse, I.H.; Williams, M. Quantifying small-scale deforestation and forest degradation in African woodlands using radar imagery. Glob. Chang. Biol. 2012, 18, 243–257. [Google Scholar] [CrossRef]
  20. Agency, I.E. Angola towards an Energy Strategy; International Energy Agency: Paris, France, 2006. [Google Scholar]
  21. USAID. Biodiversity and Tropical Forest Assessment for Angola. 2008. Available online: http://www.encapafrica.org/documents/biofor/BATS_118_119_Assessment_Angola_May_2008.pdf (accessed on 15 August 2018).
  22. Cabral, A.I.R.; Vasconcelos, M.J.; Oom, D.; Sardinha, R. Spatial dynamics and quantification of deforestation in the central-plateau woodlands of Angola (1990–2009). Appl. Geogr. 2011, 31, 1185–1193. [Google Scholar] [CrossRef]
  23. (CIFOR), C. for I. F. R. The Collaborative Partnership on Forest. Available online: https://www.cifor.org/partners/collaborative-partnership-forests-cpf/ (accessed on 23 April 2018).
  24. Kiruki, H.M.; van der Zanden, E.H.; Gikuma-Njuru, P.; Verburg, P.H. The effect of charcoal production and other land uses on diversity, structure and regeneration of woodlands in a semi-arid area in Kenya. For. Ecol. Manag. 2017, 391, 282–295. [Google Scholar] [CrossRef]
  25. Luoga, E.J.; Witkowski, E.T.F.; Balkwill, K. Harvested and standing wood stocks in protected and communal miombo woodlands of eastern Tanzania. For. Ecol. Manag. 2002, 164, 15–30. [Google Scholar] [CrossRef]
  26. FAO. Angola: Country Report to the International Conference and Programme; FAO: Roman, Italy, 1996. [Google Scholar]
  27. Peel, M.C.; Finlayson, B.L.; Mcmahon, T.A.; Peel, M.C.; Finlayson, B.L.; Updated, T.A.M. Updated world map of the Köppen-Geiger climate classification To cite this version: HAL Id: Hal-00298818 Updated world map of the K oppen-Geiger climate classification. Hydrol. Earth Syst. Sci. 2007, 11, 1633–1644. [Google Scholar] [CrossRef]
  28. Romeiras, M.M.; Figueira, R.; Duarte, M.C.; Beja, P.; Darbyshire, I. Documenting biogeographical patterns of African timber species using herbarium records: A conservation perspective based on native trees from Angola. PLoS ONE 2014, 9, e0103403. [Google Scholar] [CrossRef] [PubMed]
  29. Catarina, A.; Leite, M. The Potential of REDD + as a Conservation Opportunity for the Angolan Scarp Forests: Lessons from the Unique Kumbira Forest; Universidade do Porto: Porto, Portugal, 2015. [Google Scholar]
  30. Schneibel, A.; Stellmes, M.; Röder, A.; Finckh, M.; Revermann, R.; Frantz, D.; Hill, J. Evaluating the trade-off between food and timber resulting from the conversion of Miombo forests to agricultural land in Angola using multi-temporal Landsat data. Sci. Total Environ. 2016, 548–549, 390–401. [Google Scholar] [CrossRef] [PubMed]
  31. Gonçalves, F.M.P.; Revermann, R.; Gomes, A.L.; Aidar, M.P.; Finckh, M.; Jürgens, N. Tree species diversity and composition of Miombo woodlands in south-central Angola, a chronosequence of forest recovery after shifting cultivation. Int. J. For. Res. 2017, 2017. [Google Scholar] [CrossRef]
  32. Biernacki, P.; Waldorf, D. Snowball sampling: Problems and techniques of Chain Referral Sampling. Sociol. Methods Res. 1981, 10, 141–163. [Google Scholar] [CrossRef]
  33. Goodman, L.A. Snowball Sampling. Ann. Math. Stat. 1961, 32, 148–170. [Google Scholar] [CrossRef]
  34. Firth, C. The use of gross and net margins in the economic analysis of organic farms. In Proceedings of the UK Organic Research 2002 Conference, Aberystwyth, UK, 26–28 March 2002; pp. 285–288. [Google Scholar]
  35. AA International. Gross Margin Training Notes. 2013. Available online: http://www.techtalk-international.com/documents/gmcalc_training_notes.pdf (accessed on 28 August 2018).
  36. Adam, J.C. Improved and more environmentally friendly charcoal production system using a low-cost retort-kiln (Eco-charcoal). Renew. Energy 2009, 34, 1923–1925. [Google Scholar] [CrossRef]
  37. Okello, B.D.; O’Connor, T.G.; Young, T.P. Growth, biomass estimates, and charcoal production of Acacia drepanolobium in Laikipia, Kenya. For. Ecol. Manag. 2001, 142, 143–153. [Google Scholar] [CrossRef] [Green Version]
  38. Baccini, A.; Laporte, N.; Goetz, S.J.; Sum, M.; Dong, H. A First Map of Tropical Africa’s Above-Ground Biomass Derived from Satellite Imagery. Available online: https://link.springer.com/chapter/10.1007/978-94-007-7076-8_15 (accessed on 16 August 2018).
  39. Elijah, A.A.; Balikis, L.I.; Ambali, O.I. Comparative Analysis of Access, and Preferences of Rural and Urban Households for Cooking Energy, and the Determinants in Nigeria: A Case of Ogun State. Agric. Trop. Subtrop. 2017, 50, 45–53. [Google Scholar] [CrossRef] [Green Version]
  40. Uhunamure, S.E.; Nethengwe, N.S.; Musyoki, A. Driving forces for fuelwood use in households in the Thulamela municipality, South Africa. J. Energy S. Afr. 2017, 28, 25. [Google Scholar] [CrossRef] [Green Version]
  41. Hibajene, S.H.; Kalumiana, O.S. Manual for Charcoal Production in Earth Kilns in Zambia; Ministry of Energy and Water Development: Lusaka, Zambia, 1994; Volume 66. Available online: http://www.moe.gov.zm/?wpfb_dl=47 (accessed on 25 October 2018).
  42. Gaspard, S.E.; Ndimanya, P.; Lebailly, P. An Analysis of the Urban Consumption of Charcoal by Household: The Case of the City of Bujumbura in Burundi. Int. Rev. Res. Emerg. Mark. Glob. Econ. 2015, 1, 430–440. [Google Scholar]
  43. Nyembe, M. An Econometric Analysis of Factors Determining Charcoal Consumption by Urban Households: The Case of Zambia. Master’s Thesis, Swedish University of Agricultural Sciences, Uppsala, Sweden, February 2011. Available online: https://stud.epsilon.slu.se/2274/ (accessed on 25 October 2018).
  44. Babalola, F.; Opii, E. Factors influencing consumption of charcoal as household energy in Benue State, Nigeria. Int. J. Org. Agric. Res. Dev. 2012, 6, 68–81. [Google Scholar]
  45. Chiteculo, V.; Surovy, P. Dynamic Patterns of Trees Species in Miombo Forest and Management Perspectives for Sustainable Production—Case Study in Huambo Province, Angola. Forests 2018, 9, 321. [Google Scholar] [CrossRef]
  46. Dewees, P.A.; Campbell, B.M.; Katerere, Y.; Sitoe, A.; Cunningham, A.B.; Angelsen, A.; Wunder, S. Managing the miombo woodlands of Southern Africa: Policies, incentives and options for the rural poor. J. Nat. Resour. Policy Res. 2010, 2, 57–73. [Google Scholar] [CrossRef]
  47. Baumert, S.; Luz, A.C.; Fisher, J.; Vollmer, F.; Ryan, C.M.; Patenaude, G.; Zorrilla-Miras, P.; Artur, L.; Nhantumbo, I.; Macqueen, D. Charcoal supply chains from Mabalane to Maputo: Who benefits? Energy Sustain. Dev. 2016, 33, 129–138. [Google Scholar] [CrossRef]
Figure 1. Study area and selected municipalities in Bié province–Angola.
Environments 05 00113 g001
Figure 2. Processes of charcoal production by traditional earth kiln. Upper images (II) show the process of log piling into clamp, and the lower left image (III) shows covering of the clamp with dung and soil lumps, while the lower right image (V) shows the harvesting of charcoal and packaging it into bags. The steps number (I,IV) are not represented in this figure.
Environments 05 00113 g002
Figure 3. Seasonal trend of charcoal supplied in charcoal market of Bié province (2013–2014). * 1 bag of charcoal weighed about 38 kg.
Environments 05 00113 g003
Figure 4. Illustration of the charcoal value chain in Bié province of Angola.
Environments 05 00113 g004
Table 1. Characteristics of the respondents.
VariablesProducers (n = 93)Transporters (n = 22)
Gender (% female)100
Age (average year)4137
Household size (number of person)6*
Number of household engaged in the charcoal business21
Education (average year of schooling)26
Mobile phone (% ownership)15100
Radio, TV (% ownership)60*
Motorbike (% ownership)13
Bicycle (% ownership)18*
Truck (% ownership)032
Average n sales per days (number of bags)832
* The questions were not included in the survey for this group; the reason for this was to avoid personal questions, which could diminish the willingness of respondents to cooperate.
Table 2. Comparison of profit margin between farmer-dependent and charcoal-dependent group.
LocationNumber of Sacks/KilnPrices (Kwanzas/Sack)Profit Margin (Kwanzas/Month *)
ProducersAt MarketFarmer DependentCharcoal Dependent
Catabola70770150052, 30085,915
Kuito31980150023, 75041,210
Cunhinga251100150023, 00031,250
(*) 1 USD = 216.4 Kwanzas, exchange rate May 2018). There was a big difference in the profit between Catabola and the other areas, due to the greater amount of charcoal produced in this area.
Table 3. Distance of the production sites from Kuito market and differences in transportation costs.
VillagesDistance * (Hours)Species RecordedTransportation Costs (Kwanza)/Bag
Canjungo (45)3Brachystegia speciformis, Cominphon molli250
Nequilo (26)2Brachystegia boehmii150
Etunda (27)1Brachystegia spiciformis, Eucalyptus grandis100
* The distance is average driving time from the provincial market to the selected villages.
Table 4. Factors influencing the urban citizens to use charcoal for domestic purposes.
Variables in the EquationB (Logit Coefficient)p-ValueExp (B)
Frequency of using charcoal0.210.044 *1.234
Household size−0.0860.021 *0.918
* Indicates significance at the 5% level. Exp (B) is the exponential coefficient, which represents an odds ratio.

