Dynamics of Bacterial Communities in a 30-Year Fertilized Paddy Field under Different Organic–Inorganic Fertilization Strategies


College of Agronomy and Biotechnology, China Agricultural University/Key Laboratory of Farming System, Ministry of Agriculture of China, Yuanmingyuan West Road 2, Beijing 100193, China
*
Author to whom correspondence should be addressed.
Agronomy 2019, 9(1), 14; https://doi.org/10.3390/agronomy9010014
Submission received: 6 November 2018
/
Revised: 24 December 2018
/
Accepted: 25 December 2018
/
Published: 1 January 2019
(This article belongs to the Special Issue Soil Microbial Diversity in Prairie and Agricultural Ecosystems)
Abstract
:Fertilization plays important roles in improving soil fertility and in increasing crop yield. Soil microbial communities are sensitive indicators of soil quality and health, which could be affected by fertilization strategy. However, our knowledge on how organic–inorganic fertilizers application affects soil bacterial communities remains largely poorly understood. In this study, we investigated the long-term effects of different organic–inorganic fertilization strategies: without fertilizer (CK), fertilizers NPK (CF), fertilizers NPK, plus 30% organic manure (CFM1), and fertilizers NPK plus 60% organic manure (CFM2) on soil bacterial communities in paddy fields. Results showed that the bacterial 16S ribosomal DNA (rDNA) gene abundances in treatments CF, CFM1, and CFM2 were 1.44, 1.54, and 1.28 times higher than that in CK and the ACE index in treatment CFM1 was 9.0% greater than that in treatment CFM2, respectively. Fertilization strategy significantly changed the relative abundance of Nitrospirae, Gemmatimonadetes, and unclassified bacteria at the phylum level and bacteria belonging to order Nitrospira, candidate bacterium SBR2076, unclassified bacteria, Syntrophobacterales, and Solibacterales at the order level, respectively. High organic–inorganic fertilizer application rates inhibited the growth of Nitrospirae by 20–35%, and stimulated the growth of Gemmatimonadetes by 14–77%, relative to the rest of the treatments, respectively. Hierarchical cluster and principal coordinate analysis (PCoA) showed that the fertilization strategy affected the bacterial community structures, and the organic–inorganic fertilized treatments possessed similar bacterial community structures. Furthermore, soil pH, total nitrogen (TN), and soil organic carbon (SOC) were the main driving factors altering the bacterial communities. Our results suggested that combined organic–inorganic fertilizers application increased soil nutrient contents and bacterial abundances, and this could be an optimized fertilization strategy in regulating soil bacterial communities for rice production.
1. Introduction
Fertilization is the most commonly used agricultural practice worldwide for improving soil fertility and increasing grain yield in crop production [1,2]. Farmers normally apply high amounts of fertilizers into agricultural fields, in order to obtain high crop grain yield, and to maintain soil productivity. However, long-term application of over-doses of synthetic fertilizers has decreased soil quality and productivity, and meanwhile, this has led to a series of environmental issues; for instance, the leaching of nitrate and emission of greenhouse gases (GHGs) [3,4,5]. Application of organic fertilizers has been supposed to be an effective way to increase soil organic matter and to improve soil fertility [6], and which has been wildly recommended by the Chinese government since the 1980s [7].
Soil microbes play significant importance roles in energy flow and nutrient cycling, such as soil organic matter decomposition, soil biogeochemical cycling of nitrogen, carbon, and other elements [8,9,10], and simultaneously, they can mitigate soil pollution and regulate GHGs emissions [10,11]. In addition, soil microbial communities can supply some essential nutrients for crop growth [12] and their biomasses, diversities, and activities are sensitive indicators of soil quality, productivity, and sustainability in terrestrial ecosystems [5,13,14]. Meanwhile, the growth, activity, and functional diversity of soil bacterial communities can be affected by various factors, including climatic, vegetation, soil type, land use strategy, and fertilization practices [10,11,15].
Plenty of studies have been explored to investigate the impacts of fertilization on soil microbial communities [3,11,16,17]. Inorganic fertilization generally decreased soil bacterial diversity and activity [18,19,20], and on the contrary, organic manure amendment was reported to increase the biomass, diversity, and activity of soil bacterial communities [12,16,21,22,23]. However, some other findings indicated that the application of both inorganic and organic fertilizers rarely influenced the bacterial diversity and activity [24]. Published data of organic and inorganic fertilizers applications on the abundance, diversity, and structure of soil bacterial communities have been not always consistent [16,20,23] and the effects varied with soil type, land use pattern, and other factors [10,20,23,25]. Thus, the impacts of organic and inorganic fertilization on the bacterial communities were subject to special soil conditions.
Rice is one of the most important cultured and grain crops in China. The rice planting land (30 million ha) accounts for approximately one-fifth of the world’s total rice planting area, and it produces approximately one-third of the global rice production [26]. Nowadays, the application of combined organic–inorganic fertilizers has becoming an effective fertilization strategy for both economic and environmental benefits in rice cultivation, and an increasing number of studies have revealed the discrepant effects of organic and inorganic fertilizers amendments on soil bacterial communities [4,6,7,12,22,27]. Hence, it is of great importance to point out how combined organic–inorganic fertilization affected soil bacterial communities and the underlying mechanisms in paddy fields.
In the present study, soil samples were collected from a 30-year fertilized paddy field under different fertilization strategies in a typical double-rice cropping region of southern China. We used quantitative PCR and Illumina MiSeq sequencing approaches to investigate the abundance, diversity, and structure of soil bacterial communities. The objectives were (1) to investigate the responses of soil bacterial communities to organic–inorganic fertilization regimes, and (2) to determine the relationships between soil bacterial communities and soil properties. We hypothesized that (1) fertilization could increase the bacterial abundances and change the structures of soil bacterial communities and (2) organic manure amendments might increase the bacterial alpha diversity and maintain more stabilized bacterial communities.
2. Materials and Methods
2.1. Field Site Description
The field experiment was started in 1986 at the Agricultural Technology Extension Center of Ningxiang (28°07′ N, 112°18′ E) in Hunan Province, China. This region has a sub-tropical continental monsoon climate, with an average annual temperature, precipitation, and a frost-free period of 16.8 °C, 1553 mm, and 274 d, respectively. The soil is derived from quaternary red clay [28] and contains 13.7% of sand, 57.7% of silt, and 28.6% of clay, respectively. In this area, rice was cropped with a double-cropping system for decades before the field experiment started. The basic properties of the top soil (0–20 cm) layer were: soil organic matter (SOM) 29.39 g kg−1, total nitrogen (TN) 2.01 g kg−1, available phosphorus (AP) 12.87 mg kg−1, available potassium (AK) 33.0 mg kg−1, and pH 6.85 (H2O), before the experiment started.
The experiment contained four treatments: without fertilizer (CK), fertilizers NPK (CF), fertilizers NPK plus 30% organic manure (CFM1), and fertilizers NPK, plus 60% organic manure (CFM2); and the same fertilization regimes have been maintained every year since then. The plot size was 66.7 m2 (10 m × 6.67 m), and each plot was separated by a cement ridge 1.0 m in depth (35 cm above and 65 cm below the surface). All of the fertilized treatments received an amount of 300 kg N ha−1, 81 kg P2O5 ha−1, and 144 kg K2O ha−1 during the double rice growing seasons (142.5 kg N ha−1, 54.0 kg P2O5 ha−1, and 63.0 kg K2O ha−1 in the early rice growing season and 157.5 kg N ha−1, 27.0 kg P2O5 ha−1, and 81.0 kg K2O ha−1 in the later rice growing season). Fertilizers NPK were applied in form of urea, calcium superphosphate, and potassium chloride, and manure fertilizer was applied with chicken manure (N 1.77%, P2O5 0.80%, and K2O 1.12%), respectively. The P fertilizer was applied as base fertilizer and the N and K fertilizers were applied with base fertilizer (70%) and top application (30%) at the seventh day after transplanting for both rice growing seasons, respectively. Irrigation, field drying, pest, disease, and other managements were the same as the local practices.
2.2. Soil Sampling and Chemical Properties Analysis
Soil samples were taken from the upper 20 cm depth in later October 2016 when the later rice was harvested. Five soil cores were randomly taken for three sampling sites from each plot, and mixed to obtain three representative samples for each treatment. All of the soil samples were sieved with a 2.0 mm sieve, and then divided into two parts: one for the soil chemical properties measurement, and the other was stored in the −80 °C refrigerator for further DNA extraction.
Soil pH was measured using a pH meter (FE28, Mettler Toledo, Shanghai, China) at a soil-to-water ratio of 1:2.5 (w/v). Soil NH4+-N and NO3−-N were extracted from fresh soil at a soil to 2 M KCl solution ratio of 1:2.5 (w/v) and their concentrations were determined using a Continuous Flow Analyzer (Skalar+Analytical, Breda, The Netherlands). Soil organic carbon (SOC) and total nitrogen (TN) were determined using the K2Cr2O7 oxidation–reduction titration and Kjeldahl digestion methods [29], respectively.
2.3. DNA Extraction and Real-Time PCR
Soil microbial DNA was extracted from 0.3 g of frozen soil using the E.Z.N.A.® Soil DNA Kit (Omega, GA, USA) according to the manufacturer’s instructions. Extracted DNA solutions were checked on 1% agarose gel, and the DNA concentrations were determined by using a NANO Quant (Tecan, Männedorf, Switzerland).
Real-time PCR amplification of the bacterial 16S rDNA gene was performed on an ABI 7500 thermocycler (Applied Biosystems, Foster City, CA, USA) using the SYBR® Premix Ex TaqTM (Takara, Dalian, China), according to the manufacturer’s instructions. The 25 μL reaction mixtures contained 1×SYBR Premix Ex Taq, 10 μM of each primer (1369F: 5’-CGG TGA ATA CGT TCY CGG-3’, and 1541R: 5’-AAG GAG GTG ATC CRG CCG CA-3’) [30], and 1 μL of DNA extract (1–10 ng) as the template. The amplification profile was 95 °C (2 min), followed by 40 cycles of 95 °C (10 s), 60 °C (1 min), and 1 cycle of 95 °C (10 s), 60 °C (1 min). Threshold cycle (Ct) values were determined with the thermocycler internal software (7500 System SDS software, V1.5.1, Applied Biosystems, Foster City, CA, USA).
A standard curve for the bacterial 16S rDNA gene was developed, as described previously [23]. Briefly, the bacterial 16S rDNA gene was PCR-amplified and cloned into the pMD18-T vector, and then positive plasmid containing the bacterial 16S rDNA gene was extracted and sequenced, and finally, a 10-fold dilution series (ranged from 108 to 103) of positive plasmid with the bacterial 16S rDNA gene sequence were used as standards to generate the bacterial 16S rDNA gene standard curve. The amplification efficiency was 94.4% and R2 value was 0.999.
2.4. Illumina MiSeq Sequencing
PCR amplification of the bacterial 16S rDNA gene V3–V4 region was performed on an ABI GeneAmp® 9700 PCR thermocycler (Applied Biosystems, Foster City, CA, USA), using primers 338F (5’-ACT CCT ACG GGA GGC AGC A-3’) [31] and 806R (5’-GGA CTA CHV GGG TWT CTA AT-3’) [32]. The 5’ end of primer 338F contained an eight-base sequence barcode unique to each sample. The PCR mixtures contain 5×TransStart FastPfu Buffer 10 μL, forward primer (10 μM) 1 μL, reverse primer (10 μM) 1 μL, 2.5 mM dNTPs 5 μL, TransStart FastPfu DNA Polymerase 1 μL, template DNA <0.5 μg, and finally ddH2O up to 50 μL (TransGen, Beijing, China). The PCR condition was 5 min at 94 °C for initial denaturing, followed by 35 cycles of 94 °C (30 s), 56 °C (30 s) and 72 °C (30 s), and a final extension for 5 min at 72 °C.
PCR products of the bacterial 16S rDNA gene V3–V4 region were extracted from 2% agarose gel and purified using the AxyPrep DNA Gel Extraction Kit (Axygen Biosciences, Union City, CA, USA) according to the manufacturer’s instructions. Purified PCR products were quantified using QuantiFluor™-ST (Promega, Madison, WI, USA) and pooled in equimolar and paired-end sequenced (2 × 300) on an Illumina MiSeq platform (Majorbio, Shanghai, China) with the standard protocols.
2.5. Processing of Sequencing Data
Raw fastq files were de-multiplexed and quality-filtered using QIIME (version 1.17) [33], with the criteria as previously described [11]. Operational taxonomic units (OTUs) with 97% similarity cutoff were clustered using the UPARSE pipeline (version 7.1) [34], and chimeric sequences were identified and removed, using UCHIME [35]. The taxonomy of each 16S rDNA gene sequence was analyzed by the RDP Classifier (http://rdp.cme.msu.edu/html/) [36] against the Silva (SSU115) 16S rDNA database, using a confidence threshold of 70% [37]. All of the samples were normalized to the same sequencing depth, using MOTHUR software (version 1.30.1) [38]. The diversity indices (Shannon and inverse Simpson) and richness estimators (ACE and Chao1) were chosen to evaluate the alpha diversity of bacterial communities using MOTHUR software (version 1.30.1) [20,25]. The hierarchical cluster and principal coordinate analysis (PCoA) were selected to compared the differences in bacterial community structures among different treatments; the analysis of similarities (ANOSIM) was performed to test the bacterial community differences between treatments; and the redundancy analysis (RDA) was chosen to reveal the relationships between soil properties and bacterial community structures [39].
2.6. Statistical Analysis
The abundance of the bacterial 16S rDNA gene was created using SigmaPlot 12.5 (Systat Software Inc., San Jose, CA, USA). An analysis of variance (ANOVA) was performed at the 0.05 probability level, to compare the effects of fertilization regimes on soil properties, abundance, and the alpha diversity index of the bacterial communities using IBM SPSS Statistics (version 20.0) using the least significant difference test (LSD, p = 0.05). A Pearson correlation analysis was performed to reveal the relationships between soil properties, abundance, and alpha diversity index of the bacterial communities using IBM SPSS Statistics (version 20.0). Hierarchical cluster, principal coordinate analysis (PCoA), analysis of similarities (ANOSIM), Mental test, and redundancy analysis (RDA) were performed using the ‘vegan’ package in R statistical software (version 3.2.1) [40].
3. Results
3.1. Soil Chemical Properties
After 30 years, soil properties varied greatly among different fertilization treatments (Table 1). Soil pH values in treatments fertilizers NPK plus 30% organic manure (CFM1) and fertilizers NPK plus 60% organic manure (CFM2) were 0.08–0.09 units lower than that in CK (p < 0.01). The NH4+-N concentrations in treatments fertilizers NPK (CF), CFM1, and CFM2 were 22.5%, 17.7%, and 22.8% lower than that in without fertilizer control (CK) (p < 0.05), respectively. The NO3−-N concentration and total nitrogen (TN) content in treatment CFM2 were 0.42–1.96- and 0.51–0.63-fold higher than those in treatments CK and CF, respectively. Additionally, the soil organic carbon (SOC) content in treatments CFM1 and CFM2 were 1.51–1.69 and 1.40–1.56 times as much as those in CK and CF (Table 1), respectively.
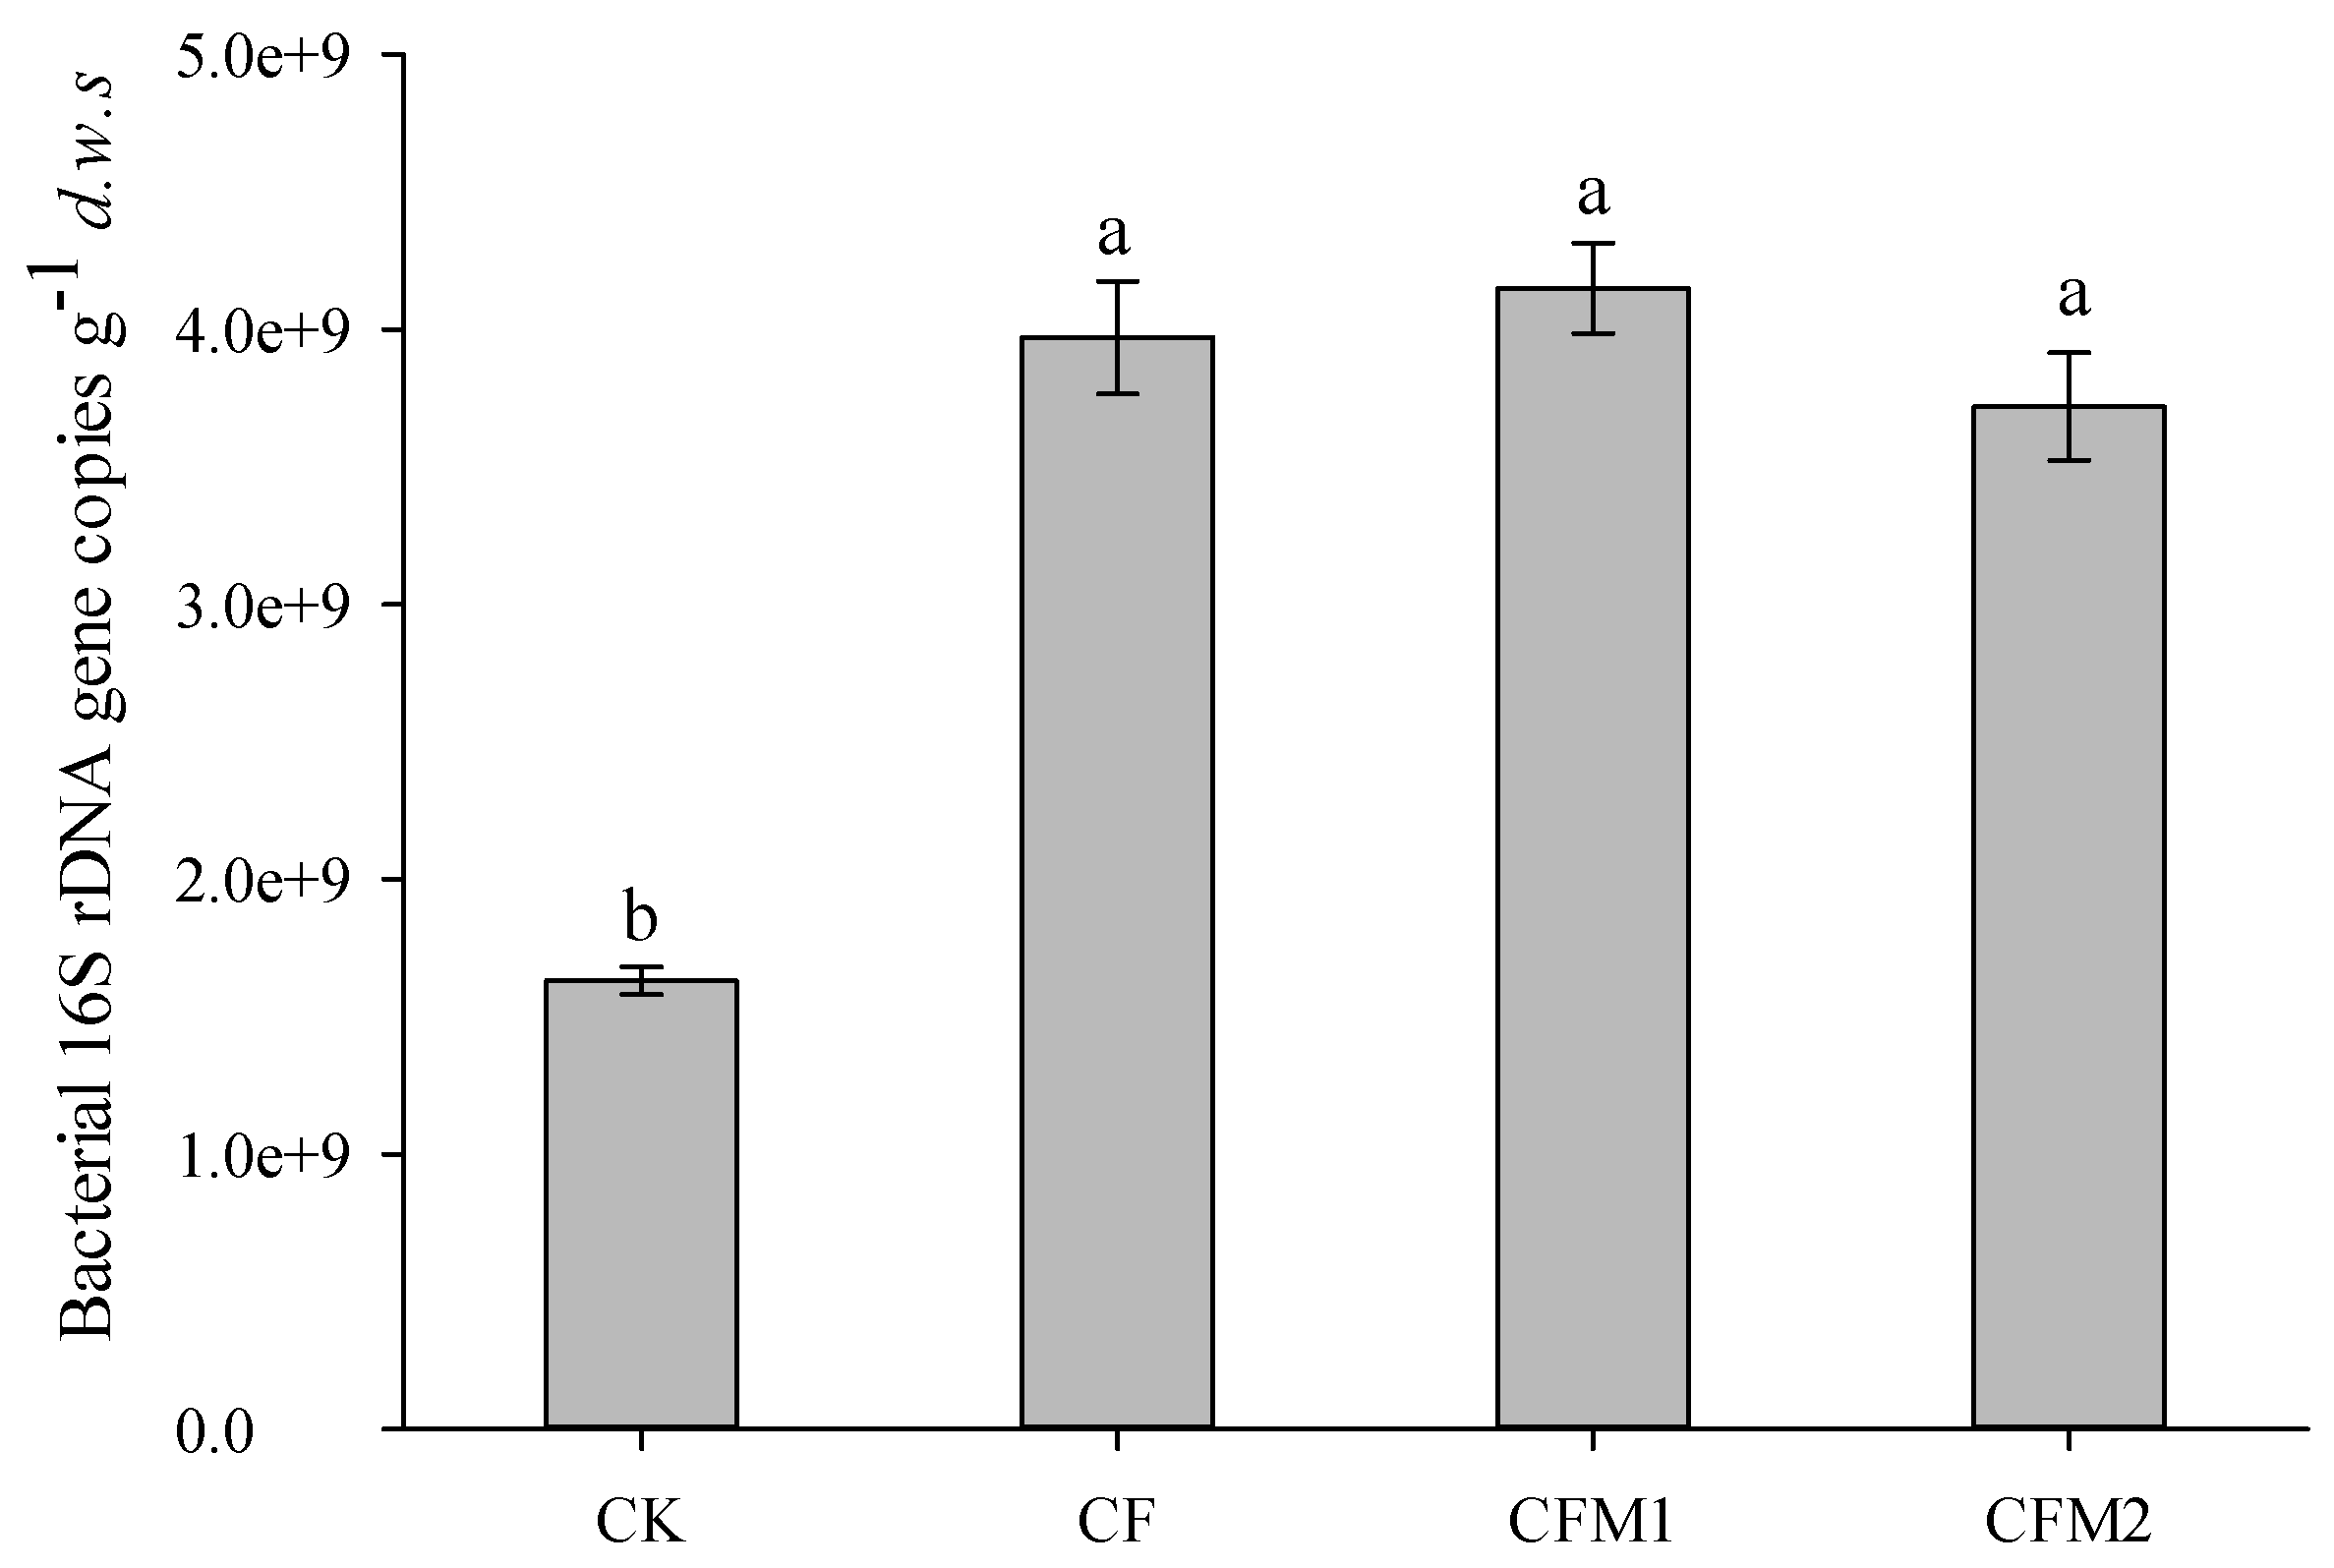
3.2. Abundance of the Bacterial 16S rDNA Gene
The bacterial 16S rDNA gene abundances ranged from 1.63 × 10⁹ to 4.15 × 10⁹ copies g−1 dry weight soil (d.w.s) (Figure 1). The bacterial 16S rDNA gene copy numbers in treatments CF, CFM1, and CFM2 were 1.44, 1.54, and 1.28 times greater than that in CK (p < 0.05), respectively. Additionally, the bacterial 16S rDNA gene abundance was positively correlated with the NO3−-N concentration (r = 0.855, p < 0.001), TN content (r = 0.581, p < 0.05), and SOC content (r = 0.579, p < 0.05), but negatively correlated with soil pH value (r = −0.705, p < 0.05) and NH4+-N concentration (r = −0.740, p < 0.01) (Table 2).
3.3. Bacterial Community Alpha Diversity
Low quality reads were removed, and each library produced 18,728 to 29,302 high-quality sequences. A total of 18,728 reads, after normalization, was obtained for each sample which generated a range of 1908 to 2465 operational taxonomic units (OTUs) at the 97% similarity level (Table S1), respectively. Rarefaction curves tended to approach the saturation plateau (Figure S1), and good coverage values ranged from 0.9674 to 0.9692 (Table S1), indicating that the sequencing results were sufficient and reliable to accommodate the bacterial communities.
The abundance-based coverage estimator (ACE) index in treatment CFM1 was 9.0% higher than that in treatment CFM2 (p < 0.05). However, no significant difference was obtained in the Chao1 index, Shannon index, and the inverse Simpson index among all of the treatments (Table S1). Furthermore, the bacterial community alpha diversity index was not significantly correlated with any soil properties (Table 2).
3.4. Bacterial Community Composition
A total of 46 phyla were obtained, and 13 phyla of them belonged to the dominant groups (mean proportion > 1%). Proteobacteria was the preponderant phylum, which represented 26.32–32.19% of the total reads, followed by Chloroflexi (17.7–21.2%), Acidobacteria (12.2–18.7%), Nitrospirae (7.4–11.2%), and Gemmatimonadetes (3.3–5.9%) in different fertilization treatments (Table S2). Fertilization significantly decreased the relative abundance of unclassified bacteria by 44.0–57.0%, compared with CK (p < 0.05). The proportion of Nitrospirae in treatment CFM2 was 0.32–0.35 times lower than those in CK and CFM1, and the Gemmatimonadetes abundance in treatment CFM2 was 1.77 times as much as that in CK (Table S2), respectively.
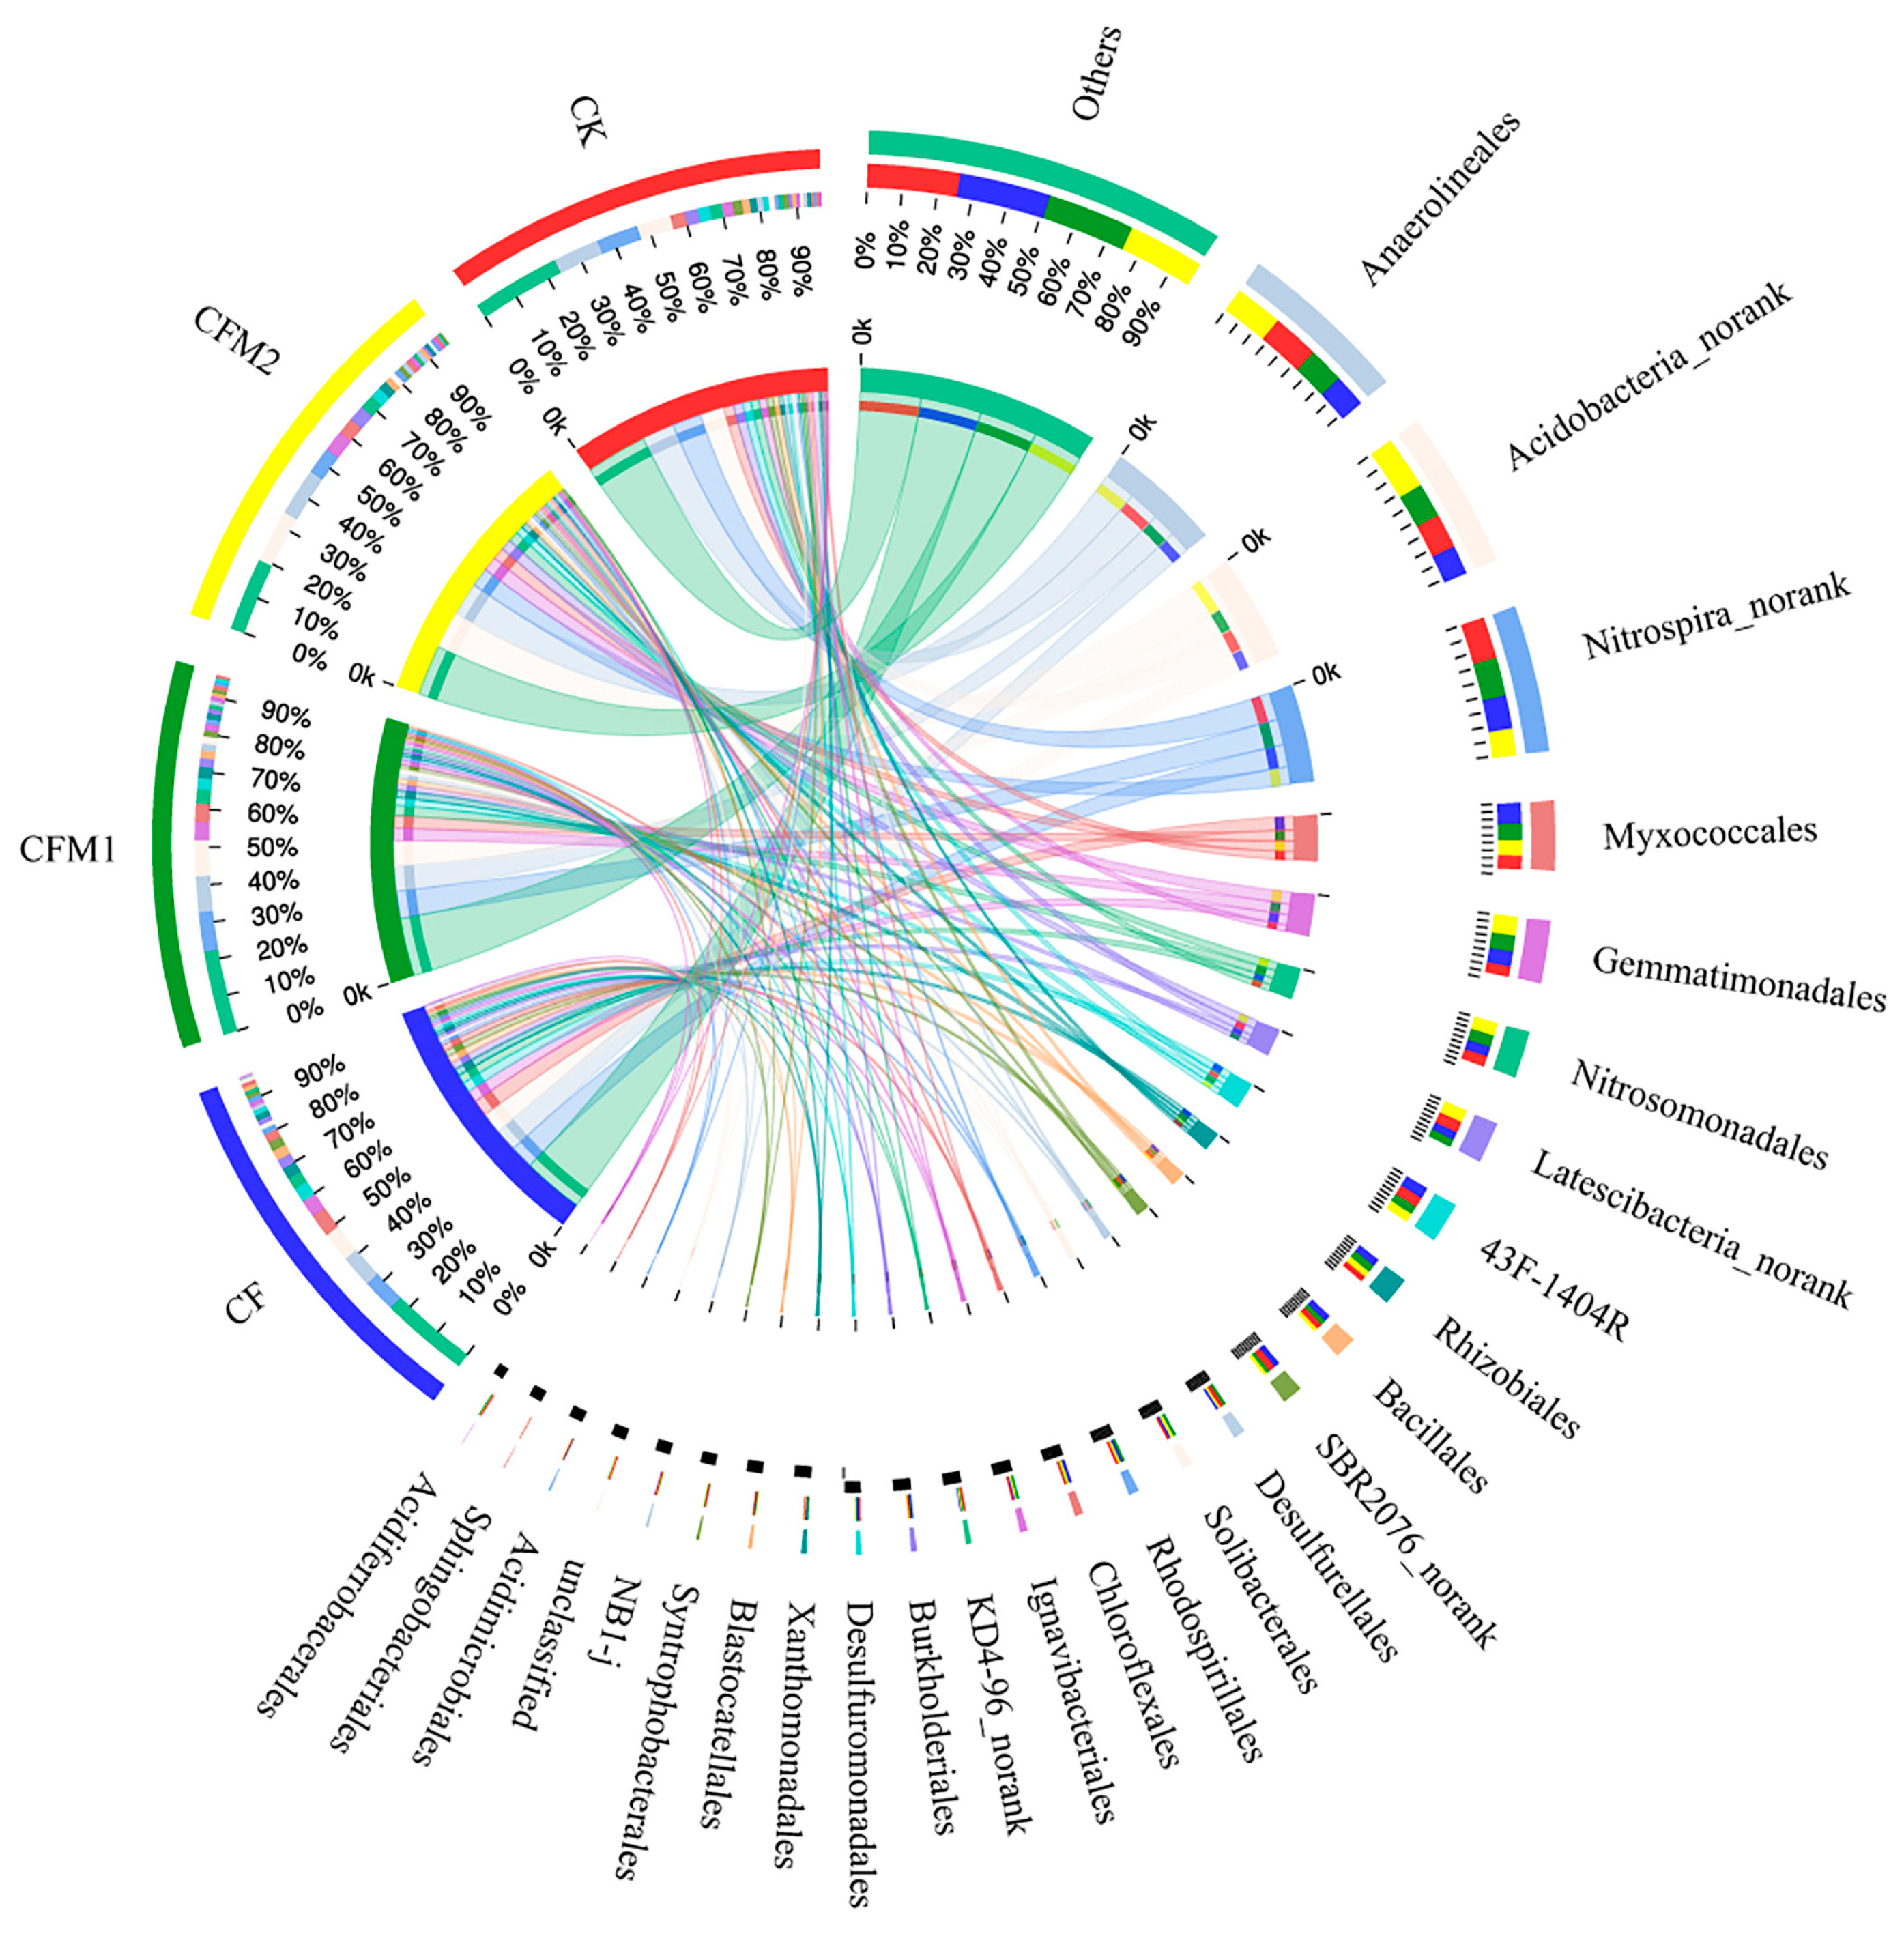
At the order level, the relative abundance of the dominant groups were indicated in Figure 2. All the treatments were dominated by the order Anaerolineales, which accounted for 9.1–13.2% of the total reads, followed by bacterial taxa belonging to Acidobacteria (8.0–14.5%), bacterial taxa belonging to Nitrospira (7.4–11.2%), Myxococcales (4.0–6.4%), and Gemmatimonadales (3.1–5.7%). Treatment CFM2 resulted in the highest abundance of Anaerolineales, bacterial taxa belonging to Acidobacteria, and Gemmatimonadales, while treatments CF and CK possessed the highest abundance of Myxococcales and bacterial taxa belonging to Nitrospira, respectively. A high rate of organic fertilizer amendment greatly decreased the relative abundance of bacterial taxa belonging to Nitrospira, candidate bacterium SBR2076, unclassified bacteria, and Syntrophobacterales, by 34.6%, 43.6%, 44.0%, and 45.3%, compared to CK. The proportions of Solibacterales in treatments CFM1 and CFM2 were 1.55 and 1.77 times as much as that in CK, respectively. However, few difference was detected in order distribution among different fertilization treatments, approximately 90% of the total order groups were shared by all the treatments as shown in the Venn diagram (Figure S2). Furthermore, significant correlations were observed between most soil properties and the relative abundance of some dominant order groups, especially those with noteworthy differences in relative abundance among different fertilization treatments (Table S3).
3.5. Bacterial Community Beta Diversity
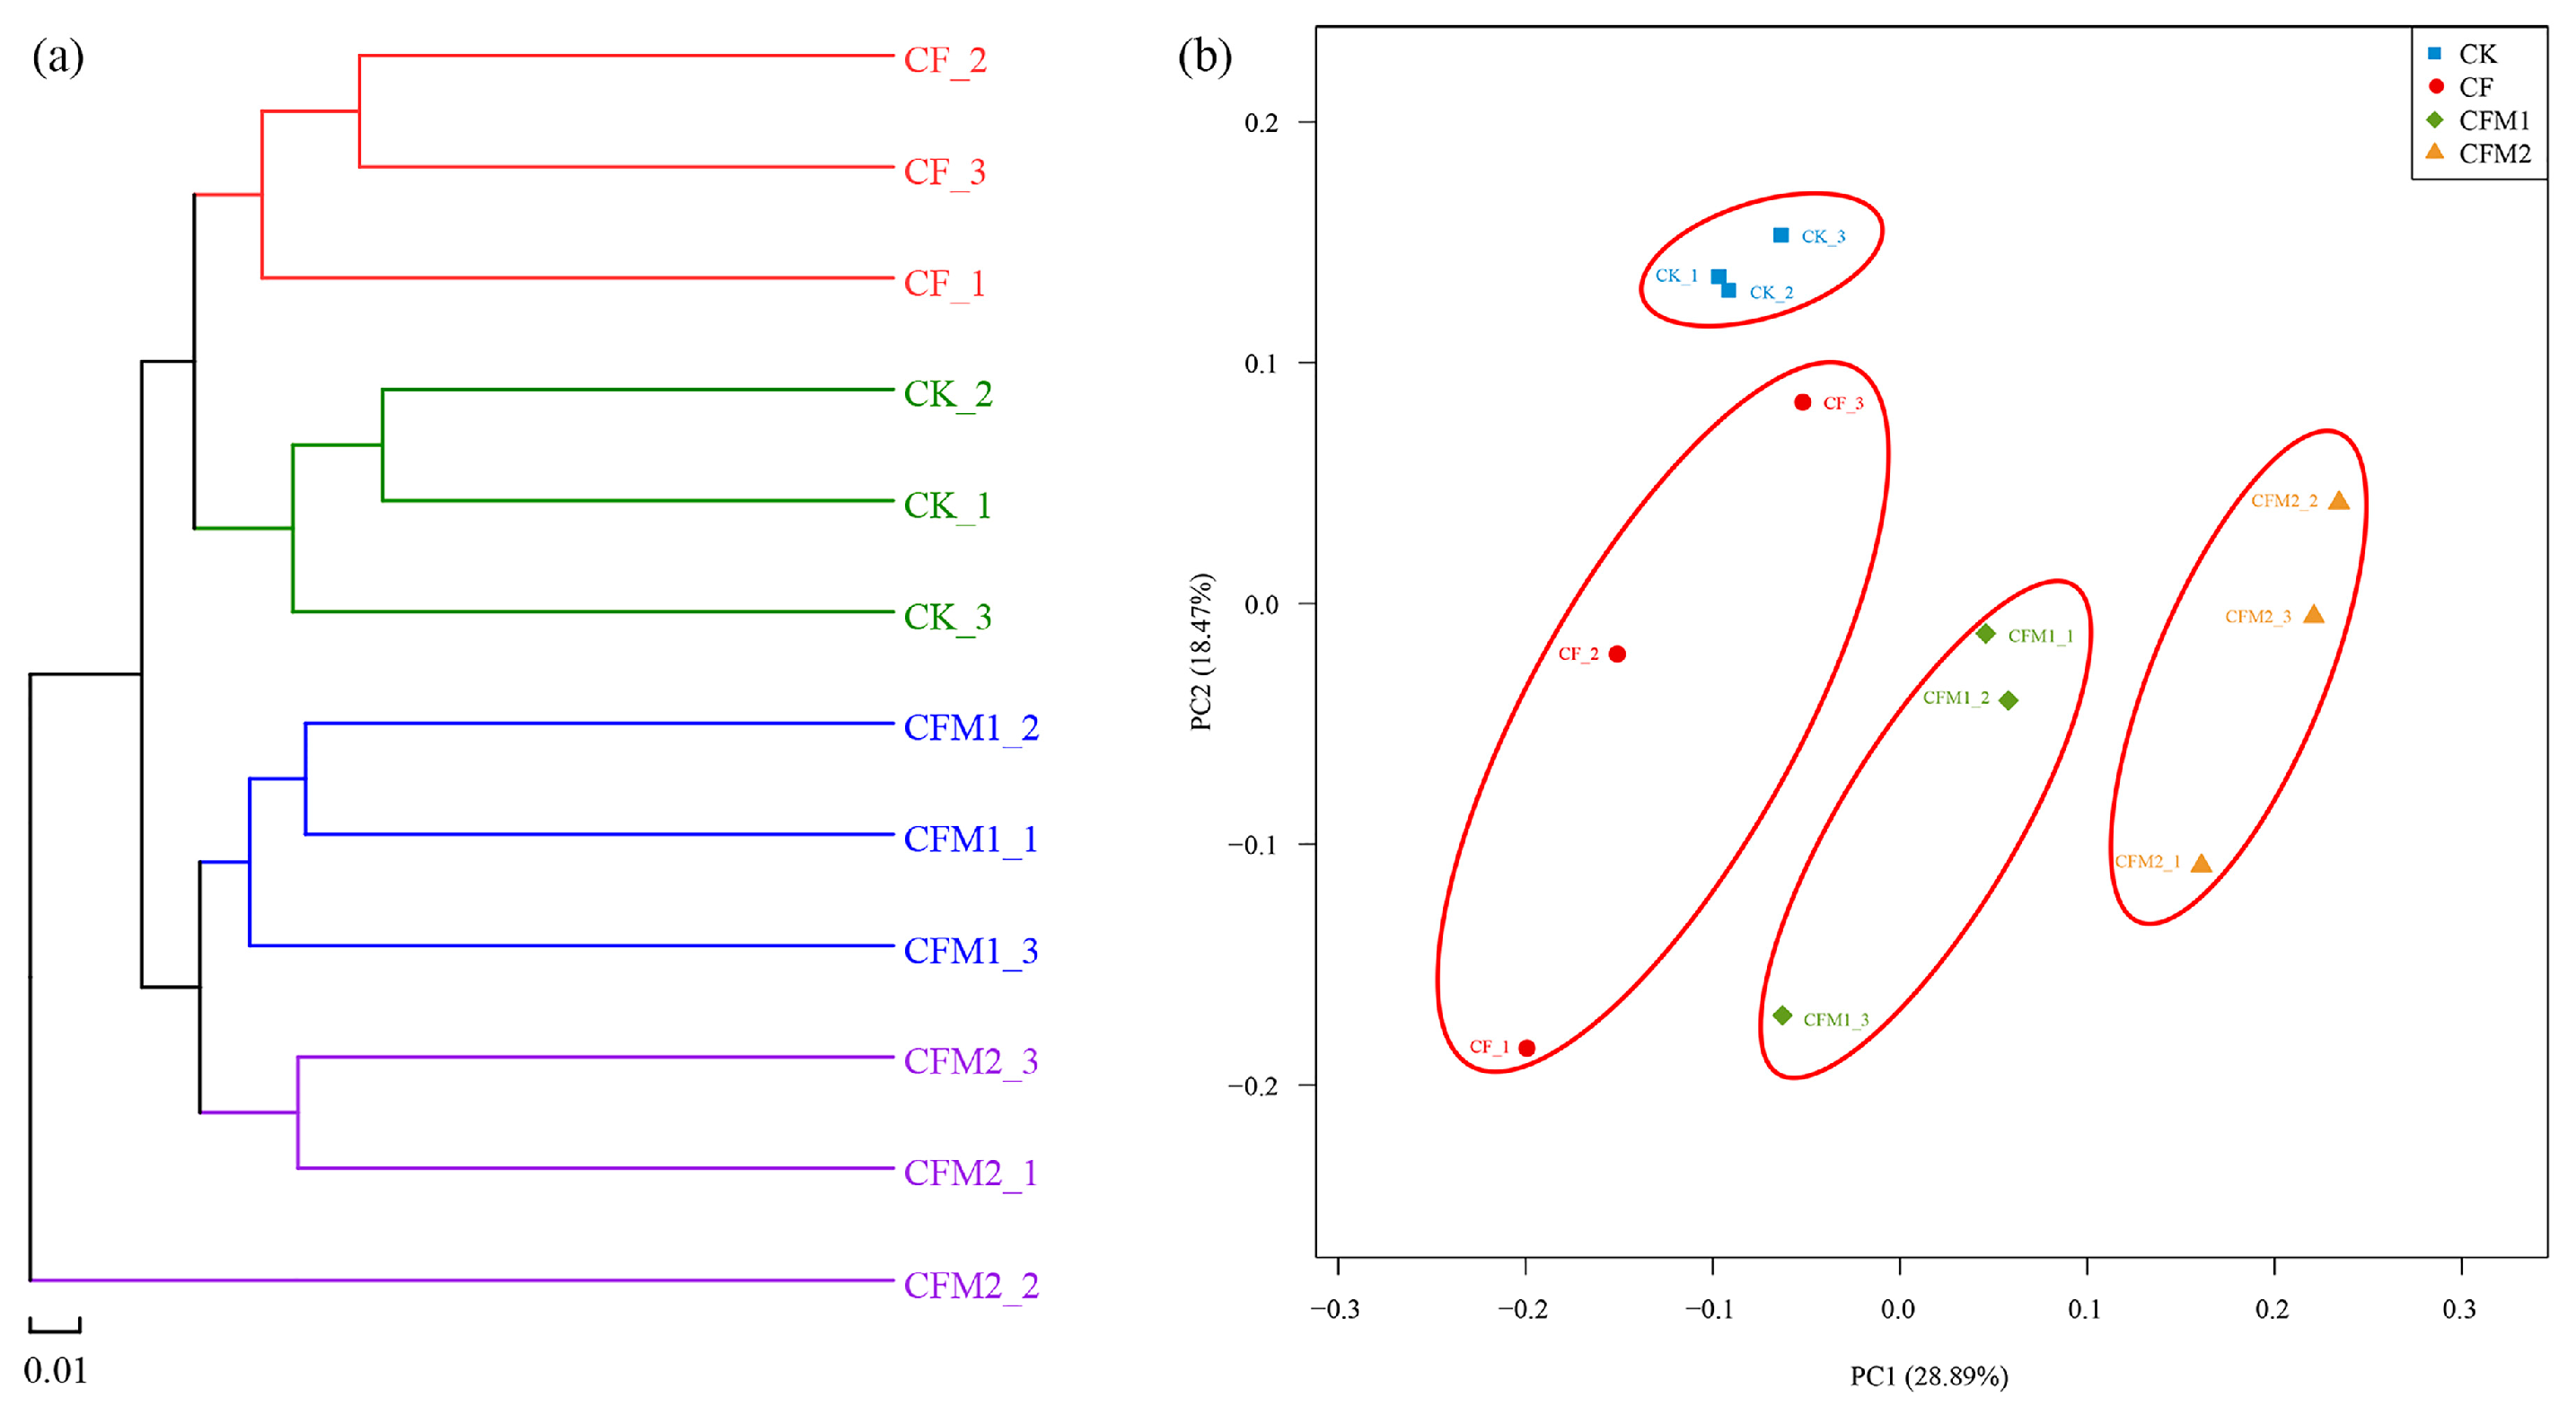
Hierarchical cluster analysis and principal coordinate analysis (PCoA) were performed to identify the differences in structure of the bacterial communities in different fertilization treatments based on the OTU level (Figure 3). The hierarchical cluster showed that the bacterial communities from different treatments formed four respective clusters, with the exception of sample CFM2_2, and the bacterial communities from treatment CFM2 were closed to those from treatment CFM1 (Figure 3a). Consistent with the hierarchical cluster tree, the PCoA profile revealed that the bacterial community structures separated clearly among different fertilization treatments and samples from treatments CFM1 and CFM2 were not far apart with each other (Figure 3b). Additionally, we performed an analysis of similarities (ANOSIM) to further expound the differences in the bacterial community structures and result showed that significant differences were found between different fertilization treatments, and the R value was 0.6096 with p < 0.01.
3.6. Environmental Effects on the Bacterial Community Structure
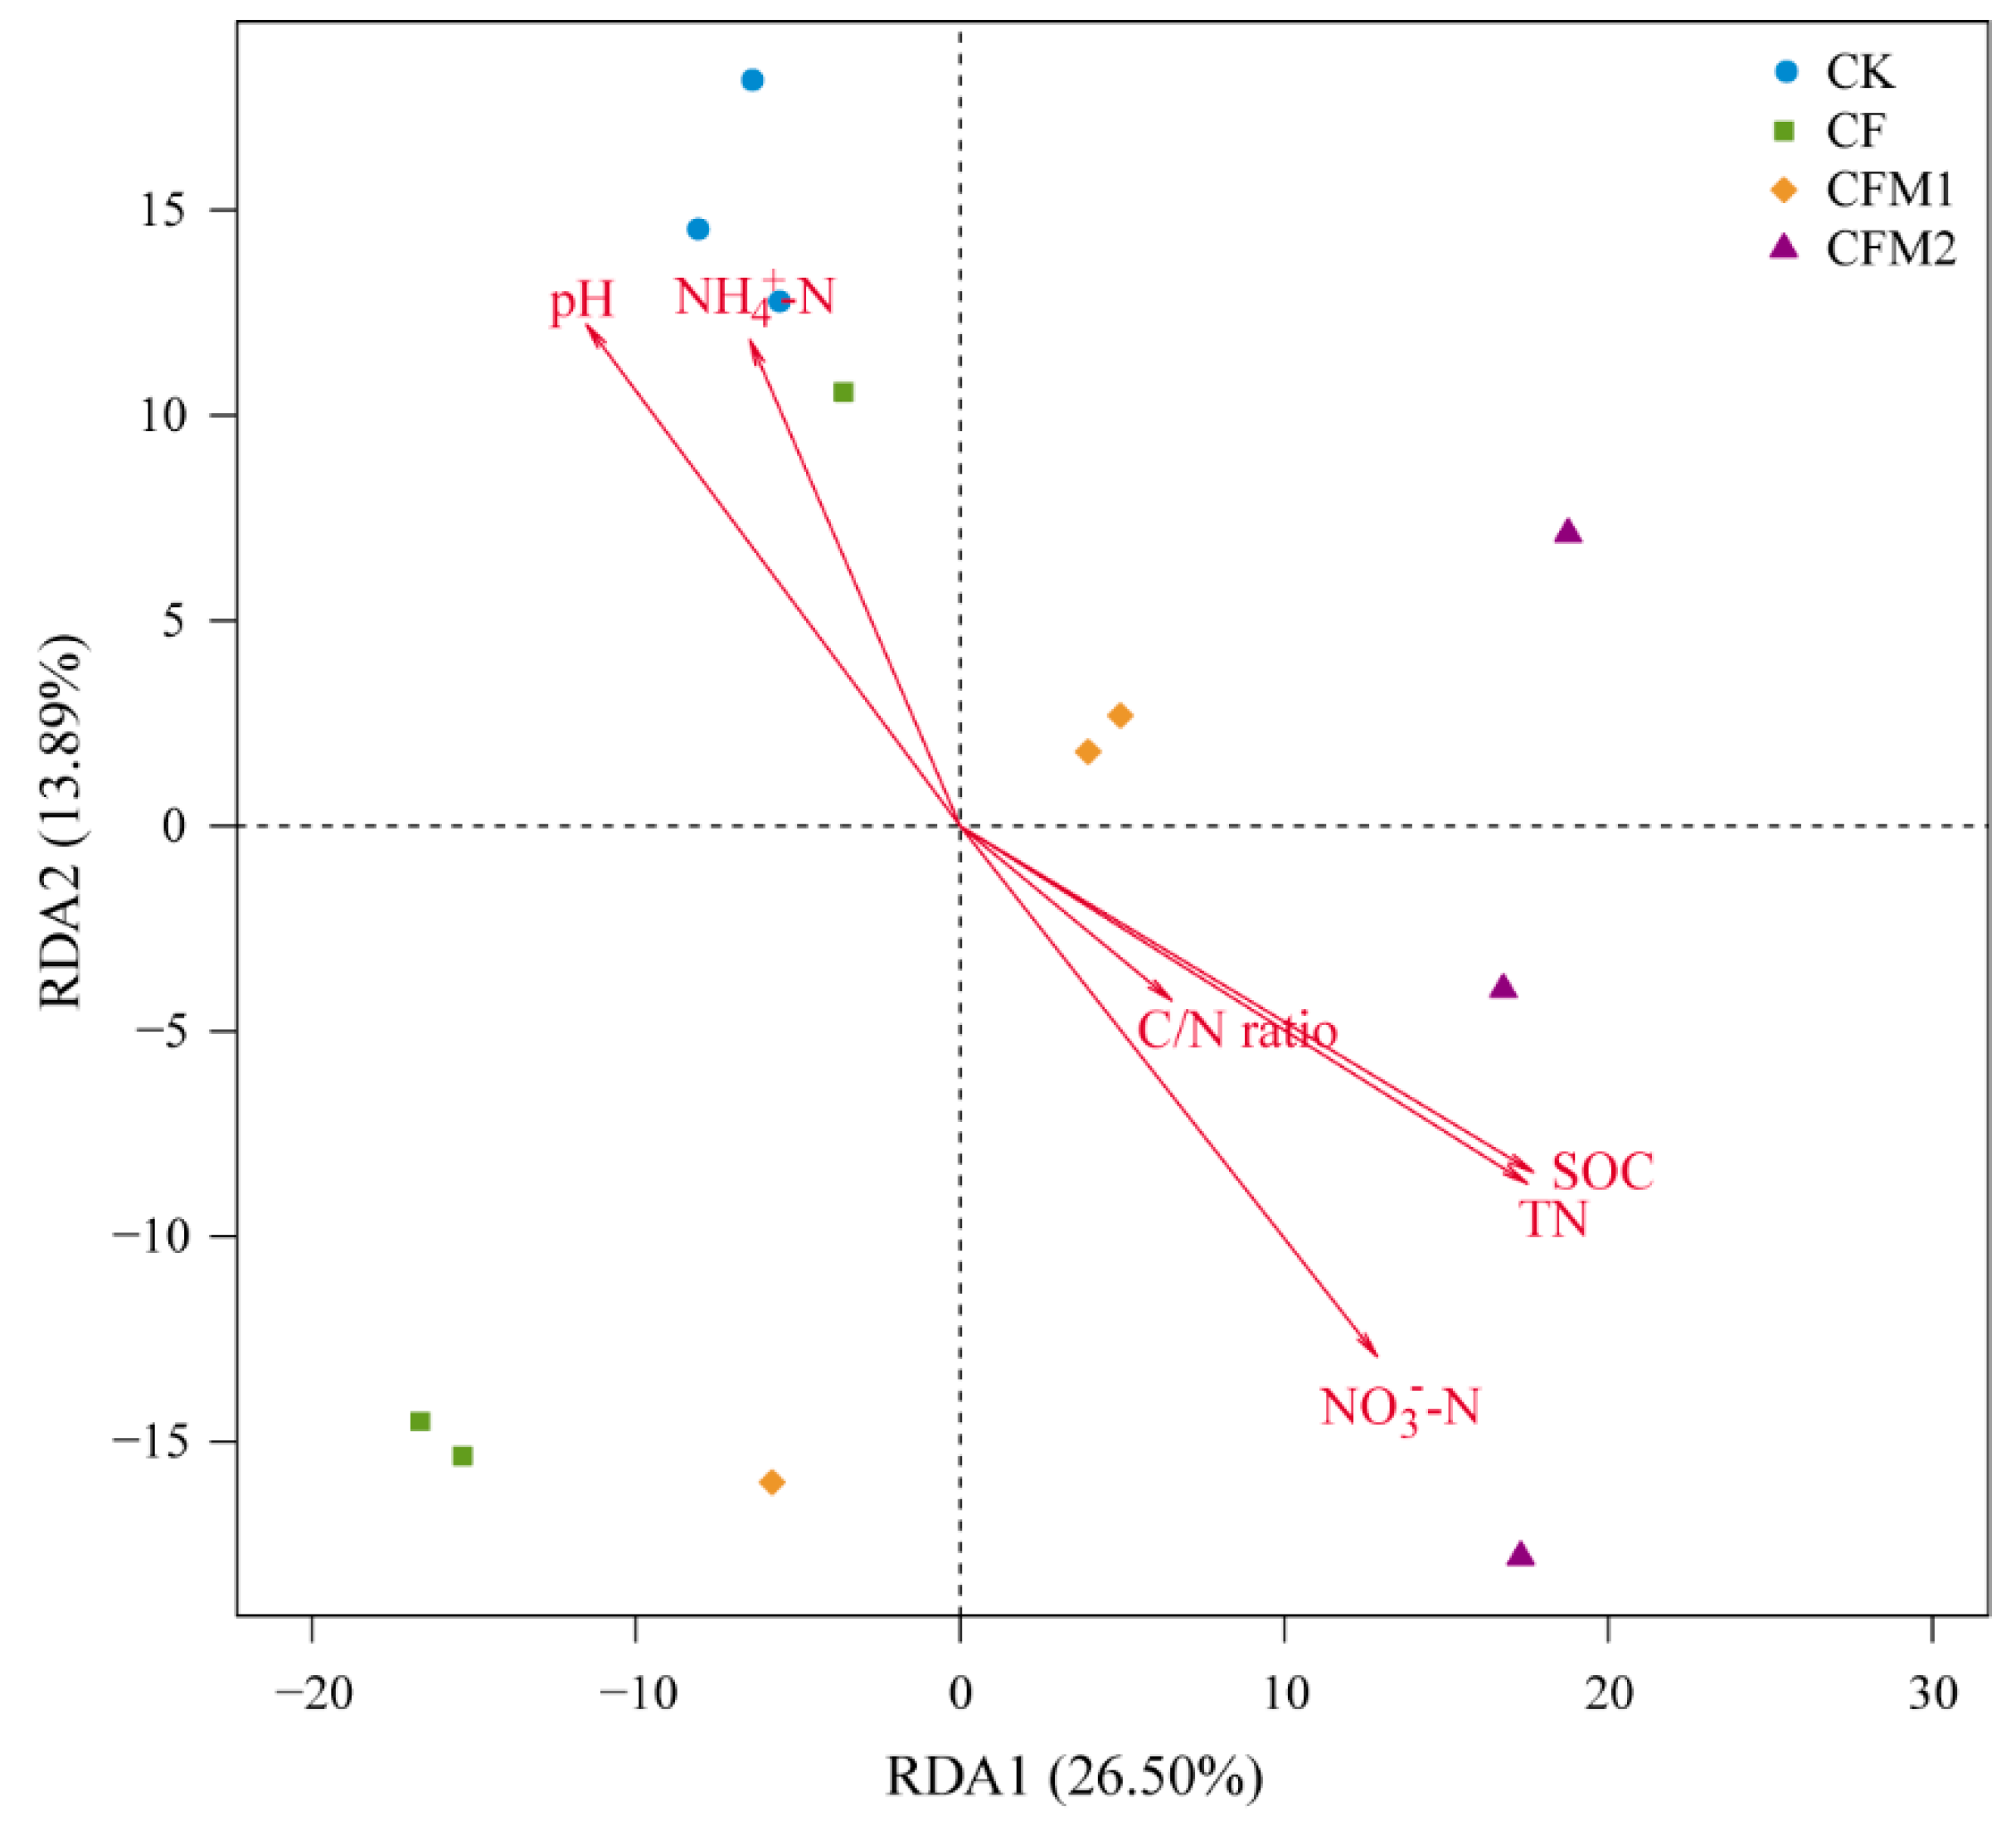
The redundancy analysis (RDA) was performed to reveal the relationships between the bacterial community structures and soil properties based on the OTU level. The RDA profile indicated that the first Axis 1 (RDA1) and second Axis 2 (RDA2) explained 26.5% and 13.9% of the total variations (Figure 4), respectively. Soil pH (p < 0.01), NO3−-N (p < 0.01), TN (p < 0.01), and SOC (p < 0.01) were significantly correlated to the bacterial community structures, and TN and SOC might be the predominant soil properties which had the largest correlation coefficients of 0.8760 and 0.8816 (Table S4), respectively. Similar with the RDA result, the Mental test showed that TN (p < 0.01) and SOC (p < 0.01) were the two main factors that have significant impacts on the bacterial community structures.
4. Discussion
In the present study, soils from the fertilized treatments had significantly higher bacterial 16S rDNA gene abundances than that from CK, indicating that fertilization can increase the bacterial abundance, even though there were some differences in the 16S rDNA gene copies among different bacterial strains, and these results supported our first hypothesis. In accord with our findings, He et al. [27] and Shen et al. [23] reported that application of inorganic and organic fertilizers significantly increased the bacterial 16S rDNA gene abundance in paddy fields. This may be explained by the lower pH and higher TN and SOC contents in the fertilized soils than that in CK. It has been reported that the bacterial abundance had a strong relationship with soil pH across a gradient of soil pH in arable soils [1,41,42], and fertilizer addition can supply N and C resources for bacteria [12,17]. Additionally, there were significant correlations between the bacterial 16S rDNA gene abundance and soil pH, TN content, and SOC content, which further indicated that these soil properties might be the key factors affecting the bacterial abundance in this study. Bacteria played important roles in soil nutrient cycles [8,10,13], and higher bacterial 16S rDNA gene abundance implied that there might be more bacteria participating in soil N, P, and K cycling and supplying more available N, P, and K resources for rice plants and indirectly influencing the rice production.
Some studies demonstrated that inorganic fertilizer application decreased the bacterial community diversity [12,25], while organic fertilizer amendment increased the bacterial community diversity [17]. In this study, inorganic and organic fertilizers amendments rarely altered the bacterial community alpha diversity index, and similar findings were observed in paddy soil [19] and in upland soil [20]. In general, organic manure amendments were supposed to increase soil bacterial community diversity; however, the organic manure contained antibiotics [43], which might inhibit the effects of organic manure amendments on soil bacterial diversity. In addition, the paddy fields were experiencing alternations of flooding and drying [19], which could weaken the effects of fertilization on bacterial diversity, and cause the rare difference in alpha diversity among different fertilization treatments. Compared with CK, neither treatments CF, CFM1, nor CFM2 had a significantly different Chao1, Shannon, and inverse Simpson indexes, which was in accordance with the findings in a southern Chinese paddy soil [12], indicating that the bacterial community structures might be influenced by other factors, but not fertilization practices, in these soil conditions. Soil pH and spatial distance were reported to be the dominant factors exerted the bacterial community alpha diversity [44,45]. However, the soils were collected at the same field site, and soil pH varied only 0.09 units, which could explain the slight difference in the bacterial community alpha diversity. It was noteworthy that no significant correlation was found between bacterial alpha diversity index and any soil properties, although there were great variations in soil properties, which can explain the few difference in bacterial alpha diversity in this study.
In this study, the phyla Proteobacteria, Chloroflexi, Acidobacteria, and Nitrospirae accounted for more than 70% of the total bacterial reads among all the treatments. Similarly, Wang et al. [12] demonstrated that phyla Proteobacteria, Acidobacteria, Chloroflexi, and Actinobacteria represented 74.3% on average, of the total bacterial reads in paddy soils. These results indicated that the bacterial dominant phyla remained relatively stable in the same-use-pattern soils. Proteobacteria was the highest abundant phylum in all the treatments, which can be explained by the high SOC and TN contents in the soils, because they were mostly copiotroph-attributed, and were favored by high SOC content conditions [46,47]. Acidobacteria, known as oligotrophic bacteria with slow growth and K-selected life strategies, played vital roles in degrading ancient or older SOM, and higher abundances of Acidobacteria were normally found in the soils with low SOC content conditions [46]. In our study, higher abundances of Acidobacteria were observed in the fertilized treatments with more SOC storage, indicating that there might be high alternative C resources for other microbes in these soils. Acidobacteria were reported to negatively correlated to soil pH [48], but this correlation was not significant in our study. The small range of soil pH and lower pH values in the fertilized treatments may be attributed to the inconsistent results. The relative abundance of Nitrospirae was significantly higher in the non-fertilized soil, and which was similar to the findings in previous studies [25,49], even though the relative abundance of Nitrospirae was significantly higher in our soils than those soils [12,20,25]. It could be explained that CK had a significantly higher NH4+-N concentration and neutral soil pH than the fertilized treatments, which provided a more suitable environment condition to stimulate the growth of Nitrospirae. Lower abundances of Nitrospirae in the fertilized soils implied that there might less N loss from soil nitrification, and rice plants could absorb more N resources, which benefited rice production for both economic and environmental effects.
As mention above, soil pH, TN, and SOC were the major factors affecting the bacterial composition at other taxonomic levels [20,46,50]. Organic manure application greatly decreased the relative abundance of bacteria belonging to order Nitrospira, candidate bacterium SBR2076, unclassified bacteria, and Syntrophobacterales and it might be caused by the decrease in soil pH and increase in TN and SOC contents, as there were negative correlations between these soil properties and their abundances (Table S3). Moreover, organic fertilization significantly increased soil TN and SOC contents and the Solibacterales abundances, indicating organic manure amendment favored the growth of Solibacterales through increased soil TN and SOC contents in soils [51]. A Venn diagram showed that less difference was detected in order distribution in different fertilization treatments, and the shared order groups accounted for approximately 90% of the total order groups (Figure S2), whereas the relative abundance of dominant order groups presented great variations among different fertilization treatments, suggesting that organic–inorganic fertilization might preferentially induce the growth of some bacterial species, but cause only minor changes to the bacterial varieties among different fertilization treatments.
The slight differences in alpha diversity were not always coupled to the variations in the beta diversity of the bacterial communities [20]. In this study, we observed evident differences in bacterial community structures among different fertilization treatments. The bacterial communities in treatments CFM1 and CFM2 grouped closely together but distinctly from those in CK and CF (Figure 3). Similar to our findings, Shen et al. [23] found that the bacterial community structures in the organic manure fertilized soils grouped closely together but distinctly from the non-fertilized and inorganic fertilized soils in paddy soils. Additionally, the bacterial community structures were reported to be closely correlated to soil pH [23,27], TN content [27], and SOC content [5,19]. In accordance with previous studies, the bacterial community structures significantly correlated with soil pH, TN content, and the SOC content in this study (Table S5; Mental test, not shown), indicating that soil pH, TN content, and SOC content were the main responsible factors influencing the bacterial communities [52] and organic manure amendment could maintain more stabilized bacterial community structures. For all this, the RDA profile showed that the first two Axis only explained 40.4% of the total variations, and large reasons could not be further explained for the differences in the bacterial community structures. Thus, the impacts of fertilization on the bacterial communities should be weighed, considering not only the increase in soil nutrients (TN and SOC) and the decrease in soil pH, but also the other changes of soil properties and other biotic factors under different fertilization conditions.
5. Conclusions
In conclusion, our results demonstrated that long-term fertilization significantly increased the bacterial 16S rDNA gene abundances by 1.28–1.54 fold, and rarely affected the bacterial alpha diversity, with the exception of the ACE index. Fertilization strategy influenced the relative abundance of some dominant groups at both the phylum and order levels, and the bacterial community structures. Inorganic fertilization alone had a minor effect compared to combined organic–inorganic fertilizer application on the bacterial community composition and structure. Soil pH, TN, and SOC played important roles in driving the changes of soil bacterial communities. Furthermore, a high rate of organic manure amendment suppressed the growth of Nitrospirae by 20–35%, compared with the rest of the treatments, indicating there might be a potential lower activity of ammonia oxidation and less N loss from soil nitrification, and rice plants could absorb more N resources from the soils. We suggested that a combined inorganic–organic fertilization strategy could supply better nutrition conditions, via the function of the bacteria involved in N and C cycles, for rice production.
Supplementary Materials
The following are available online at https://www.mdpi.com/2073-4395/9/1/14/s1. Figure S1: Rarefaction curve of the bacterial communities at 97% similarity, Figure S2: Venn drawing showing the shared bacterial community order in the soils under different fertilization regimes, Table S1: Sequencing results and alpha diversity of the bacterial communities in different fertilization treatments, Table S2: Relative abundance of bacterial phylum in different fertilization treatments (mean proportion >1%), Table S3: Pearson’s correlation coefficients between soil properties and relative abundance of dominant order (mean proportion >1%) of the bacterial communities, Table S4: Significance of environmental variables in explaining the differences of bacterial community structures obtained from the RDA results.
Author Contributions
Y.Y. and Z.Z. designed the experiments. Y.Y. and P.W. performed the experiments. Y.Y. analyzed the data and wrote the manuscript. All authors approved the submission.
Funding
This work was supported by the National Key Research and Development Program of China (2016YFD0300205-01) and the National Natural Science Foundation of China (31671640).
Acknowledgments
We would like to thank the staff of Soil and Fertilizer Institute of Hunan Province for field management. Special thanks go to the anonymous reviewers for their constructive comments in improving this manuscript.
Conflicts of Interest
The authors declare no conflict of interest.
References
- Ahn, J.H.; Song, J.; Kim, B.Y.; Kim, M.S.; Joa, J.H.; Weon, H.Y. Characterization of the bacterial and archaeal communities in rice field soils subjected to long-term fertilization practices. J. Microbiol. 2012, 50, 754–765. [Google Scholar] [CrossRef] [PubMed]
- Shang, Q.Y.; Ling, N.; Feng, X.M.; Yang, X.X.; Wu, P.P.; Zou, J.W.; Shen, Q.R.; Guo, S.W. Soil fertility and its significance to crop productivity and sustainability in typical agroecosystem: A summary of long-term fertilizer experiments in China. Plant Soil 2014, 381, 13–23. [Google Scholar] [CrossRef]
- Balasooriya, W.K.; Huygens, D.; Rajapaksha, R.M.C.P.; Boeckx, P. Effect of rice variety and fertilizer type on the active microbial community structure in tropical paddy fields in Sri Lanka. Geoderma 2016, 265, 87–95. [Google Scholar] [CrossRef]
- Chen, C.; Zhang, J.N.; Lu, M.; Qin, C.; Chen, Y.H.; Yang, L.; Huang, Q.W.; Wang, J.C.; Shen, Z.G.; Shen, Q.R. Microbial communities of an arable soil treated for 8 years with organic and inorganic fertilizers. Biol. Fertil. Soils 2016, 52, 455–467. [Google Scholar] [CrossRef]
- Li, C.H.; Yan, K.; Tang, L.S.; Jia, Z.J.; Li, Y. Change in deep soil microbial communities due to long term fertilization. Soil Biol. Biochem. 2014, 75, 264–272. [Google Scholar] [CrossRef]
- Lazcano, C.; Gómez-Brandón, M.; Revilla, P.; Domínguez, J. Short-term effects of organic and inorganic fertilizers on soil microbial community structure and function. Biol. Fertil. Soils 2013, 49, 723–733. [Google Scholar] [CrossRef]
- Wei, M.; Hu, G.Q.; Wang, H.; Bai, E.; Luo, Y.H.; Zhang, A.J.; Zhuge, Y.P. 35 years of manure and chemical fertilizer application alters soil microbial community composition in a Fluvo-aquic soil in Northern China. Eur. J. Soil Biol. 2017, 82, 27–34. [Google Scholar] [CrossRef]
- Nannipieri, P.; Ascher, J.; Ceccherini, M.T.; Landi, L.; Pietramellara, G.; Renella, G. Microbial diversity and soil functions. Eur. J. Soil Sci. 2003, 54, 655–670. [Google Scholar] [CrossRef] [Green Version]
- Brussaard, L.; de Ruiter, P.C.; Brown, G.G. Soil biodiversity for agricultural sustainability. Agric. Ecosyst. Environ. 2007, 121, 233–244. [Google Scholar] [CrossRef]
- Lynn, T.M.; Liu, Q.; Hu, Y.J.; Yuan, H.Z.; Wu, X.H.; Khai, A.A.; Wu, J.H.; Ge, T.D. Influence of land use on bacterial and archaeal diversity and community structures in three natural ecosystems and one agricultural soil. Arch. Microbiol. 2017, 199, 711–721. [Google Scholar] [CrossRef]
- Yang, Y.D.; Ren, Y.F.; Wang, X.Q.; Hu, Y.G.; Wang, Z.M.; Zeng, Z.H. Ammonia-oxidizing archaea and bacteria responding differently to fertilizer type and irrigation frequency as revealed by Illumina Miseq sequencing. J. Soils Sediments 2018, 18, 1029–1040. [Google Scholar] [CrossRef]
- Wang, J.C.; Song, Y.; Ma, T.F.; Raza, W.; Li, J.; Howland, J.G.; Huang, Q.W.; Shen, Q.R. Impacts of inorganic and organic fertilization treatments on bacterial and fungal communities in a paddy soil. Appl. Soil Ecol. 2017, 112, 42–50. [Google Scholar] [CrossRef]
- Kennedy, A.C.; Smith, K.L. Soil microbial diversity and the sustainability of agricultural soils. Plant Soil 1995, 170, 75–86. [Google Scholar] [CrossRef]
- Saleem, M. Microbiome Community Ecology: Fundamentals and Applications; Springer: Berlin, Germany, 2015. [Google Scholar]
- Lei, Y.P.; Xiao, Y.L.; Li, L.F.; Jiang, C.Q.; Zu, C.L.; Li, T.; Cao, H. Impact of tillage practices on soil bacterial diversity and composition under the tobacco-rice rotation in China. J. Microbiol. 2017, 55, 349–356. [Google Scholar] [CrossRef] [PubMed]
- Gomez, E.; Ferreras, L.; Toresani, S. Soil bacterial functional diversity as influenced by organic amendment application. Bioresour. Technol. 2006, 97, 1484–1489. [Google Scholar] [CrossRef] [PubMed]
- Bonilla, N.; Cazorla, F.M.; Martínez-Alonso, M.; Hermoso, J.M.; González-Fernández, J.J.; Gaju, N.; Landa, B.B.; de Vicente, A. Organic amendments and land management affect bacterial community composition, diversity and biomass in avocado crop soils. Plant Soil 2012, 357, 215–226. [Google Scholar] [CrossRef] [Green Version]
- Yevdokimov, I.; Gattinger, A.; Buegger, F.; Munch, J.C.; Schloter, M. Changes in microbial community structure in soil as a result of different amounts of nitrogen fertilization. Biol. Fertil. Soils 2008, 44, 1103–11106. [Google Scholar] [CrossRef]
- Wu, M.N.; Qin, H.L.; Chen, Z.; Wu, J.S.; Wei, W.X. Effect of long-term fertilization on bacterial composition in rice paddy soil. Biol. Fertil. Soils 2011, 47, 397–405. [Google Scholar] [CrossRef]
- Xun, W.B.; Xu, Z.H.; Li, W.; Ren, Y.; Huang, T.; Ran, W.; Wang, B.R.; Shen, Q.R.; Zhang, R.F. Long-term organic-inorganic fertilization ensures great soil productivity and bacterial diversity after natural-to-agricultural ecosystem conversion. J. Microbiol. 2016, 54, 611–617. [Google Scholar] [CrossRef]
- Mandal, A.; Patra, A.K.; Singh, D.; Swarup, A.; Ebhin, M.R. Effect of long-term application of manure and fertilizer on biological and biochemical activities in soil during crop development stages. Bioresour. Technol. 2007, 98, 3585–3592. [Google Scholar] [CrossRef]
- Treseder, K.K. Nitrogen additions and microbial biomass: A meta-analysis of ecosystem studies. Ecol. Lett. 2008, 11, 1111–1120. [Google Scholar] [CrossRef] [PubMed]
- Shen, J.P.; Zhang, L.M.; Guo, J.F.; Ray, J.L.; He, J.Z. Impact of long-term fertilization practices on the abundance and composition of soil bacterial communities in northeast China. Appl. Soil Ecol. 2010, 46, 119–124. [Google Scholar] [CrossRef]
- Zhong, W.H.; Gu, T.; Wang, W.; Zhang, B.; Lin, X.G.; Huang, Q.R.; Shen, W.S. The effects of mineral fertilizer and organic manure on soil microbial community and diversity. Plant Soil 2010, 326, 511–522. [Google Scholar] [CrossRef]
- Zhou, J.; Guan, D.W.; Zhou, B.K.; Zhao, B.S.; Ma, M.C.; Qin, J.; Jiang, X.; Chen, S.F.; Cao, F.M.; Shen, D.L.; et al. Influence of 34-years of fertilization on bacterial communities in an intensively cultivated black soil in northeast China. Soil Biol. Biochem. 2015, 90, 42–51. [Google Scholar] [CrossRef]
- FAO. Food and Agriculture Organization Statistical Database. 2013. Available online: http://faostat3.fao.org (accessed on 6 June 2018).
- He, J.Z.; Shen, J.P.; Zhang, L.M.; Zhu, Y.G.; Zheng, Y.M.; Xu, M.G.; Di, H.J. Quantitative analyses of the abundance and composition of ammonia-oxidizing bacteria and ammonia-oxidizing archaea of a Chinese upland red soil under long-term fertilization practices. Environ. Microbiol. 2007, 9, 2364–2374. [Google Scholar] [CrossRef] [PubMed] [Green Version]
- FAO. FAO-Unesco Soil Map of the World; UNESCO: Paris, France, 1974; Volume VIII. [Google Scholar]
- Bao, S.D. Soil Agro-Chemistrical Analysis, 3rd ed.; China Agricultural Press: Beijing, China, 2000. [Google Scholar]
- Suzuki, M.T.; Taylor, L.T.; DeLong, E.F. Quantitative analysis of small-subunit rRNA genes in mixed microbial populations via 5′-nuclease assays. Appl. Environ. Microbiol. 2000, 66, 4605–4614. [Google Scholar] [CrossRef] [PubMed]
- Walter, J.; Tannock, G.W.; Tilsalatimisjarvi, A.; Rodtong, S.; Loach, D.M.; Munro, K.; Alatossava, T. Detection and identification of gastrointestinal Lactobacillus species by using denaturing gradient gel electrophoresis and species-specific PCR primers. Appl. Environ. Microbiol. 2000, 66, 297–303. [Google Scholar] [CrossRef] [PubMed]
- McBain, A.J.; Bartolo, R.G.; Catrenich, C.E.; Charbonneau, D.; Ledder, R.G.; Rickard, A.H.; Symmons, S.A.; Gilbert, P. Microbial characterization of biofilms in domestic drains and the establishment of stable biofilm microcosms. Appl. Environ. Microbiol. 2003, 69, 177–185. [Google Scholar] [CrossRef] [PubMed]
- Caporaso, G.; Kuczynski, J.; Stombaugh, J.; Bittinger, K.; Bushman, F.D.; Costello, E.K.; Fierer, N.; Pea, A.G.; Goodrich, J.K.; Gordon, J.I.; et al. QIIME allows analysis of high-throughput community sequencing data. Nat. Methods 2010, 7, 335–336. [Google Scholar] [CrossRef] [Green Version]
- Edgar, R.C. UPARSE: Highly accurate OTU sequences from microbial amplicon reads. Nat. Methods 2013, 10, 996–998. [Google Scholar] [CrossRef]
- Edgar, R.C.; Haas, B.J.; Clemente, J.C.; Quince, C.; Knight, R. UCHIME improves sensitivity and speed of chimera detection. Bioinformatics 2011, 27, 2194–2200. [Google Scholar] [CrossRef] [PubMed] [Green Version]
- Wang, Q.; Garrity, G.M.; Tiedje, J.M.; Cole, J.R. Naive Bayesian classifier for rapid assignment of rRNA sequences into the new bacterial taxonomy. Appl. Environ. Microbiol. 2007, 73, 5261–5267. [Google Scholar] [CrossRef] [PubMed]
- Amato, K.R.; Yeoman, C.J.; Kent, A.; Righini, N.; Carbonero, F.; Estrada, A.; Gaskins, H.R.; Stumpf, R.M.; Yildirim, S.; Torralba, M.; et al. Habitat degradation impacts black howler monkey (Alouatta pigra) gastrointestinal microbiomes. ISME J. 2013, 7, 1344–1353. [Google Scholar] [CrossRef] [PubMed]
- Schloss, P.D.; Gevers, D.; Westcott, S.L. Reducing the effects of PCR amplification and sequencing artifacts on 16S rRNA-based studies. PLoS ONE 2011, 6, e27310. [Google Scholar] [CrossRef] [PubMed]
- Paliy, O.; Shankar, V. Application of multivariate statistical techniques in microbial ecology. Mol. Ecol. 2016, 25, 1032–1057. [Google Scholar] [CrossRef] [PubMed] [Green Version]
- Team, R.C. R: A Language and Environment for Statistical Computing; R Foundation for Statistical Computing: Vienna, Austria, 2014; Available online: http://cran.r-project.org (accessed on 10 June 2018).
- Rousk, J.; Bååth, E.; Brookes, P.C.; Lauber, C.L.; Lozupone, C.; Caporaso, J.G.; Knight, R.; Fierer, N. Soil bacterial and fungal communities across a pH gradient in an arable soil. ISME J. 2010, 4, 1340–1351. [Google Scholar] [CrossRef] [PubMed] [Green Version]
- Liu, J.J.; Sui, Y.Y.; Yu, Z.H.; Shi, Y.; Chu, H.Y.; Jin, J.; Liu, X.B.; Wang, G.H. High throughput sequencing analysis of biogeographical distribution of bacterial communities in the black soils of northeast China. Soil Biol. Biochem. 2014, 70, 113–122. [Google Scholar] [CrossRef]
- Zhu, Y.G.; Johnson, T.A.; Su, J.Q.; Qiao, M.; Guo, G.X.; Stedtfeld, R.D.; Hashsham, A.S.; Tiedje, J.M. Diverse and abundant antibiotic resistance genes in Chinese swine farms. Proc. Natl. Acad. Sci. USA 2013, 110, 3435–3440. [Google Scholar] [CrossRef] [Green Version]
- Green, J.L.; Holmes, A.J.; Westoby, M.; Oliver, I.; Briscoe, D.; Dangerfield, M.; Gillings, M.; Beattie, A.J. Spatial scaling of microbial eukaryote diversity. Nature 2004, 432, 747–750. [Google Scholar] [CrossRef]
- Fierer, N.; Jackson, R.B. The diversity and biogeography of soil bacterial communities. Proc. Natl. Acad. Sci. USA 2006, 103, 626–631. [Google Scholar] [CrossRef] [Green Version]
- Fierer, N.; Bradford, M.A.; Jackson, R.B. Toward an ecological classification of soil bacteria. Ecology 2007, 88, 1354–1364. [Google Scholar] [CrossRef] [PubMed]
- Eilers, K.G.; Lauber, C.L.; Knight, R.; Fierer, N. Shifts in bacterial community structure associated with inputs of low molecular weight carbon compounds to soil. Soil Biol. Biochem. 2010, 42, 896–903. [Google Scholar] [CrossRef]
- Jones, R.T.; Robeson, M.S.; Lauber, C.L.; Hamady, M.; Knight, R.; Fierer, N. A comprehensive survey of soil acidobacterial diversity using pyrosequencing and clone library analysis. ISME J. 2009, 3, 442–453. [Google Scholar] [CrossRef] [PubMed]
- Ramirez, K.S.; Lauber, C.L.; Knight, R.; Bradford, M.A.; Fierer, N. Consistent effects of nitrogen fertilization on soil bacterial communities in contrasting systems. Ecology 2010, 91, 3463–3470. [Google Scholar] [CrossRef] [PubMed] [Green Version]
- Tian, J.; Lou, Y.L.; Gao, Y.; Fang, H.J.; Liu, S.T.; Xu, M.G.; Blagodatskaya, E.; Kuzyakov, Y. Response of soil organic matter fractions and composition of microbial community to long-term organic and mineral fertilization. Biol. Fertil. Soils 2017, 53, 523–532. [Google Scholar] [CrossRef]
- Sun, R.B.; Zhang, X.X.; Guo, X.S.; Wang, D.Z.; Chu, H.Y. Bacterial diversity in soils subjected to long-term chemical fertilization can be more stably maintained with the addition of livestock manure than wheat straw. Soil Biol. Biochem. 2015, 88, 9–18. [Google Scholar] [CrossRef]
- Chen, D.M.; Xing, W.; Lan, Z.C.; Saleem, M.; Wu, Y.; Hu, S.J.; Bai, Y.F. Direct and indirect effects of nitrogen enrichment on soil organisms and carbon and nitrogen mineralization in a semi-arid grassland. Funct. Ecol. 2018. [Google Scholar] [CrossRef]
Figure 1.
Abundance of the bacterial 16S rDNA gene in the soils under different fertilization regimes. Values are mean ± standard error (n = 3). Different letters indicate significant differences at p < 0.05. d.w.s, dry weight soil. CK, without fertilizer; CF, fertilizers NPK; CFM1, fertilizers NPK plus 30% organic manure; and CFM2, fertilizers NPK plus 60% organic manure.

Figure 2.
Composition of bacterial order groups in different fertilization treatments. Values are means (n = 3). Order groups that accounted for less than 1% in average were combined into one group called “Others” during drafting. CK, without fertilizer; CF, fertilizers NPK; CFM1, fertilizers NPK plus 30% organic manure; and CFM2, fertilizers NPK plus 60% organic manure.

Figure 3.
Hierarchical cluster (a) and principal coordinate analysis (PCoA) (b) of the bacterial community structures. CK, without fertilizer; CF, fertilizers NPK; CFM1, fertilizers NPK plus 30% organic manure; and CFM2, fertilizers NPK plus 60% organic manure.
Figure 3.
Hierarchical cluster (a) and principal coordinate analysis (PCoA) (b) of the bacterial community structures. CK, without fertilizer; CF, fertilizers NPK; CFM1, fertilizers NPK plus 30% organic manure; and CFM2, fertilizers NPK plus 60% organic manure.

Figure 4.
Redundancy analysis (RDA) of bacterial community structures and soil properties. CK, without fertilizer; CF, fertilizers NPK; CFM1, fertilizers NPK plus 30% organic manure; and CFM2, fertilizers NPK plus 60% organic manure.
Figure 4.
Redundancy analysis (RDA) of bacterial community structures and soil properties. CK, without fertilizer; CF, fertilizers NPK; CFM1, fertilizers NPK plus 30% organic manure; and CFM2, fertilizers NPK plus 60% organic manure.


Table 1.
Chemical properties of the soils under different fertilization regimes.
| Treatment | pH (H2O) | NH4+-N (mg kg−1) | NO3−-N (mg kg−1) | TN (g kg−1) | SOC (g kg−1) | C/N Ratio |
|---|---|---|---|---|---|---|
| CK | 6.78 ± 0.02a | 1.99 ± 0.18a | 2.14 ± 0.07c | 2.15 ± 0.04d | 13.23 ± 0.49c | 6.15 ± 0.14a |
| CF | 6.73 ± 0.01ab | 1.55 ± 0.04b | 4.45 ± 0.23b | 2.33 ± 0.06c | 14.33 ± 0.22c | 6.17 ± 0.20a |
| CFM1 | 6.70 ± 0.01b | 1.64 ± 0.07b | 6.20 ± 0.28a | 3.21 ± 0.06b | 20.04 ± 0.25b | 6.26 ± 0.16a |
| CFM2 | 6.69 ± 0.01b | 1.54 ± 0.08b | 6.33 ± 0.40a | 3.51 ± 0.02a | 22.40 ± 0.36a | 6.39 ± 0.12a |
Note: Values are mean ± SE (n = 3). Different letters in the same column indicate significant differences at p < 0.05. TN, total nitrogen; SOC, soil organic carbon; CK, without fertilizer; CF, fertilizers NPK; CFM1, fertilizers NPK plus 30% organic manure; and CFM2, fertilizers NPK plus 60% organic manure.
Table 2.
Pearson’s correlation coefficients between soil properties and the abundance and alpha diversity index of the bacterial communities.
Table 2.
Pearson’s correlation coefficients between soil properties and the abundance and alpha diversity index of the bacterial communities.
| Item | pH | NH4+-N | NO3−-N | TN | SOC | C/N Ratio |
|---|---|---|---|---|---|---|
| Abundance | −0.705 * | −0.740 ** | 0.855 ** | 0.581 * | 0.579 * | 0.229 |
| ACE index | 0.077 | 0.271 | −0.162 | −0.274 | −0.278 | −0.192 |
| Chao1 index | 0.076 | 0.308 | −0.191 | −0.282 | −0.285 | −0.199 |
| Shannon index | 0.249 | 0.400 | −0.395 | −0.299 | −0.283 | −0.088 |
| inverse Simpson index | 0.196 | 0.335 | −0.301 | −0.122 | −0.100 | −0.008 |
Note: * p < 0.05; ** p < 0.01. Significant correlations (p < 0.05) are highlighted in bold. TN, total nitrogen; SOC, soil organic carbon; ACE, abundance-based coverage estimator.
© 2019 by the authors. Licensee MDPI, Basel, Switzerland. This article is an open access article distributed under the terms and conditions of the Creative Commons Attribution (CC BY) license (http://creativecommons.org/licenses/by/4.0/).
Share and Cite
MDPI and ACS Style
Yang, Y.; Wang, P.; Zeng, Z. Dynamics of Bacterial Communities in a 30-Year Fertilized Paddy Field under Different Organic–Inorganic Fertilization Strategies. Agronomy 2019, 9, 14. https://doi.org/10.3390/agronomy9010014
AMA Style
Yang Y, Wang P, Zeng Z. Dynamics of Bacterial Communities in a 30-Year Fertilized Paddy Field under Different Organic–Inorganic Fertilization Strategies. Agronomy. 2019; 9(1):14. https://doi.org/10.3390/agronomy9010014
Chicago/Turabian StyleYang, Yadong, Peixin Wang, and Zhaohai Zeng. 2019. "Dynamics of Bacterial Communities in a 30-Year Fertilized Paddy Field under Different Organic–Inorganic Fertilization Strategies" Agronomy 9, no. 1: 14. https://doi.org/10.3390/agronomy9010014
Note that from the first issue of 2016, this journal uses article numbers instead of page numbers. See further details here.