Impact of Control Measures on Nitrogen Oxides, Sulfur Dioxide and Particulate Matter Emissions from Coal-Fired Power Plants in Anhui Province, China

Abstract
:1. Introduction
2. Data and Methods
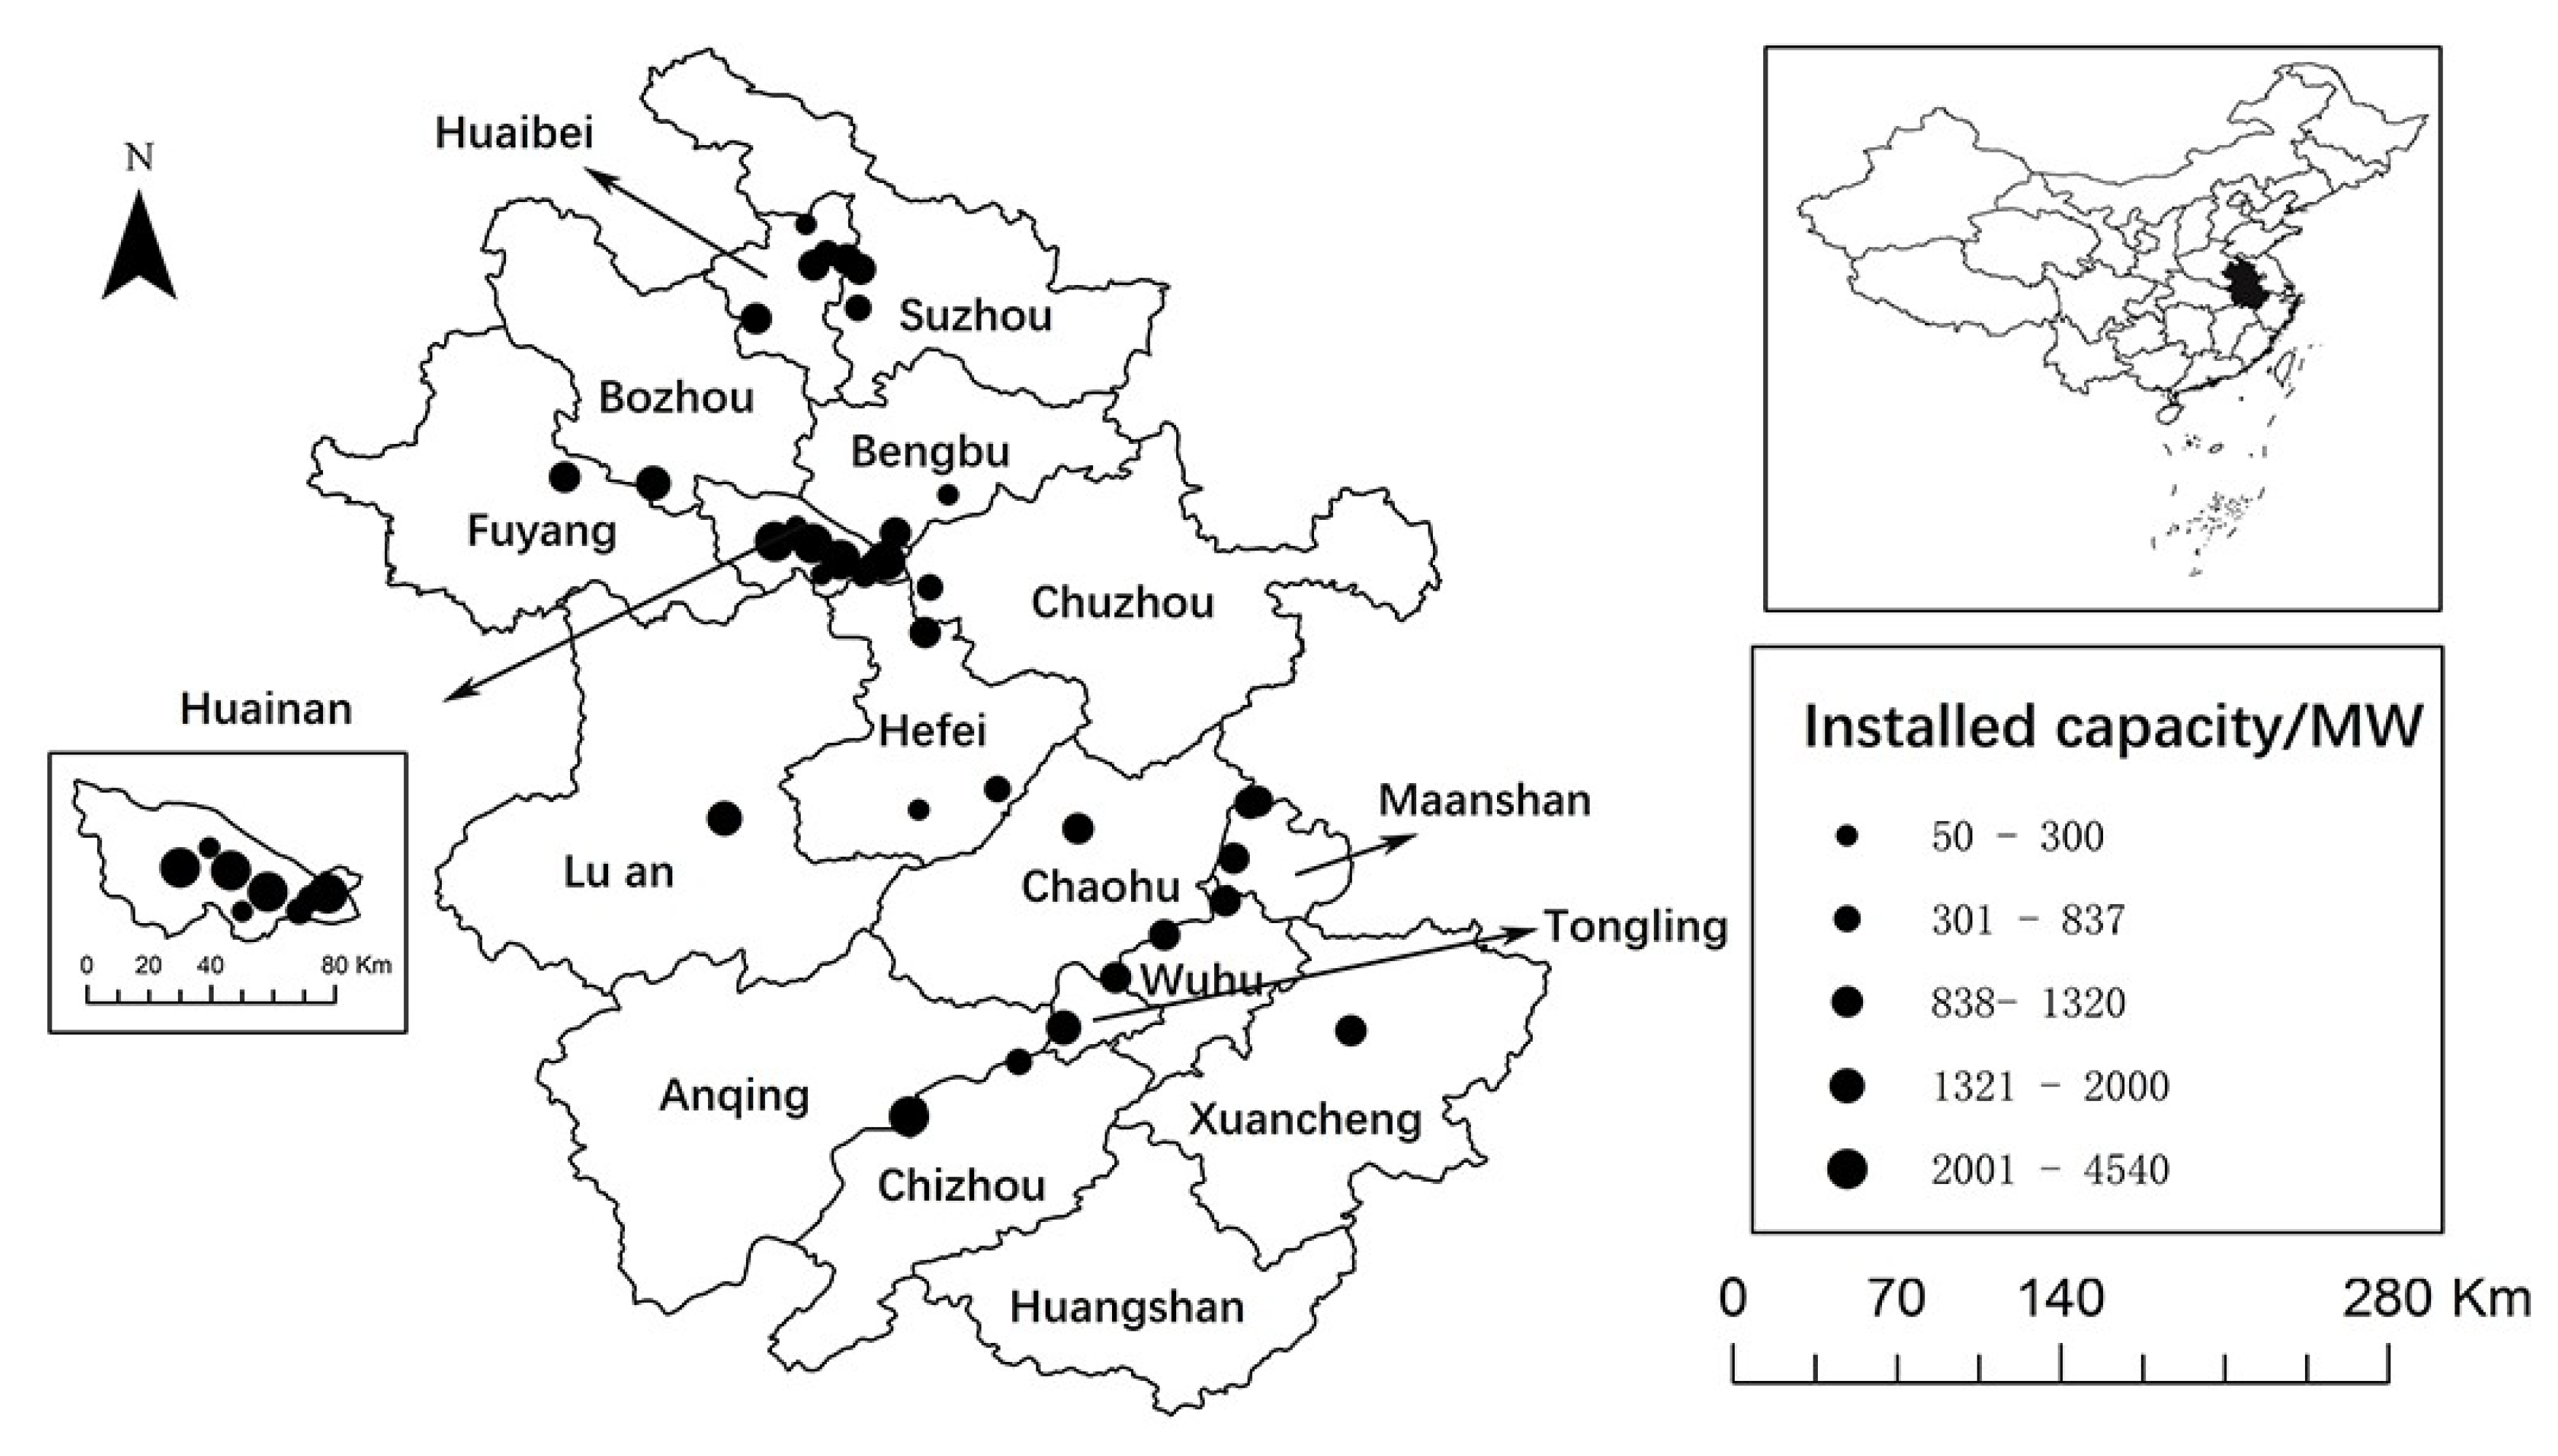
2.1. Study Area
2.2. Measurements of NOx, SO2 and PM Concentrations
2.3. CEMS Validation Using MRU NOVA2000 Flue Gas Analyzer
2.4. Statistical Analyses
3. Results and Discussion
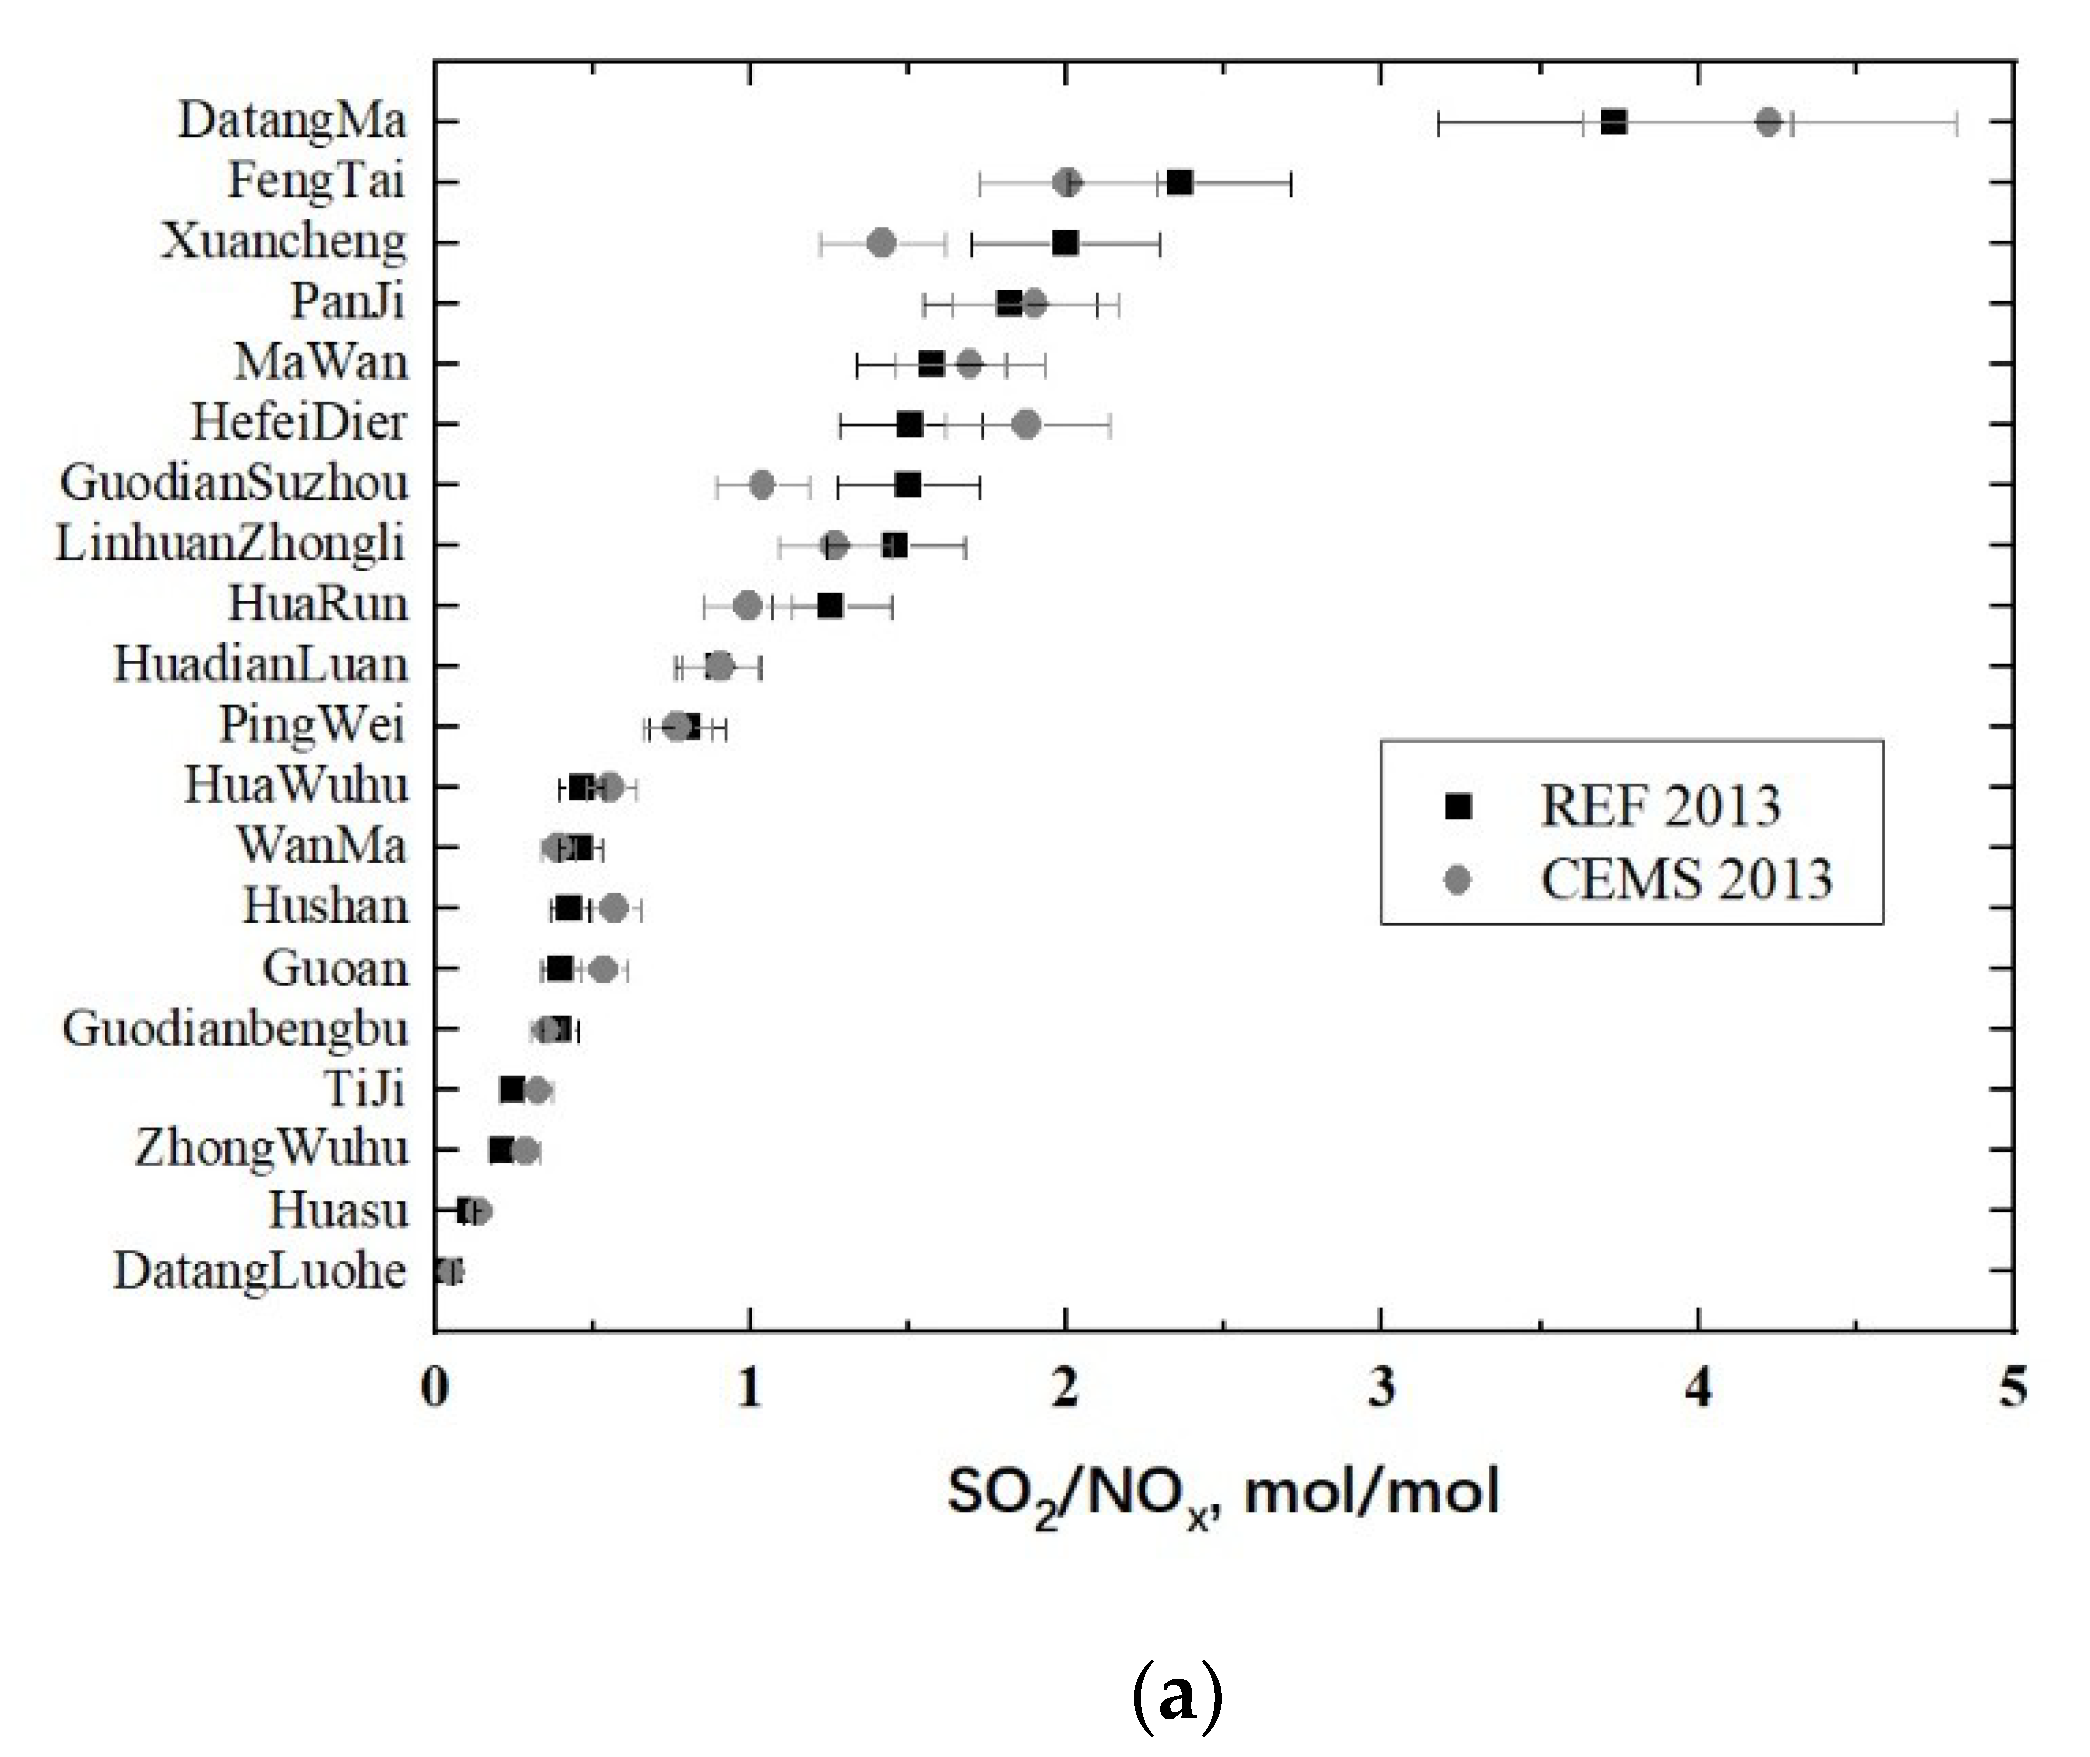
3.1. CEMS Validation
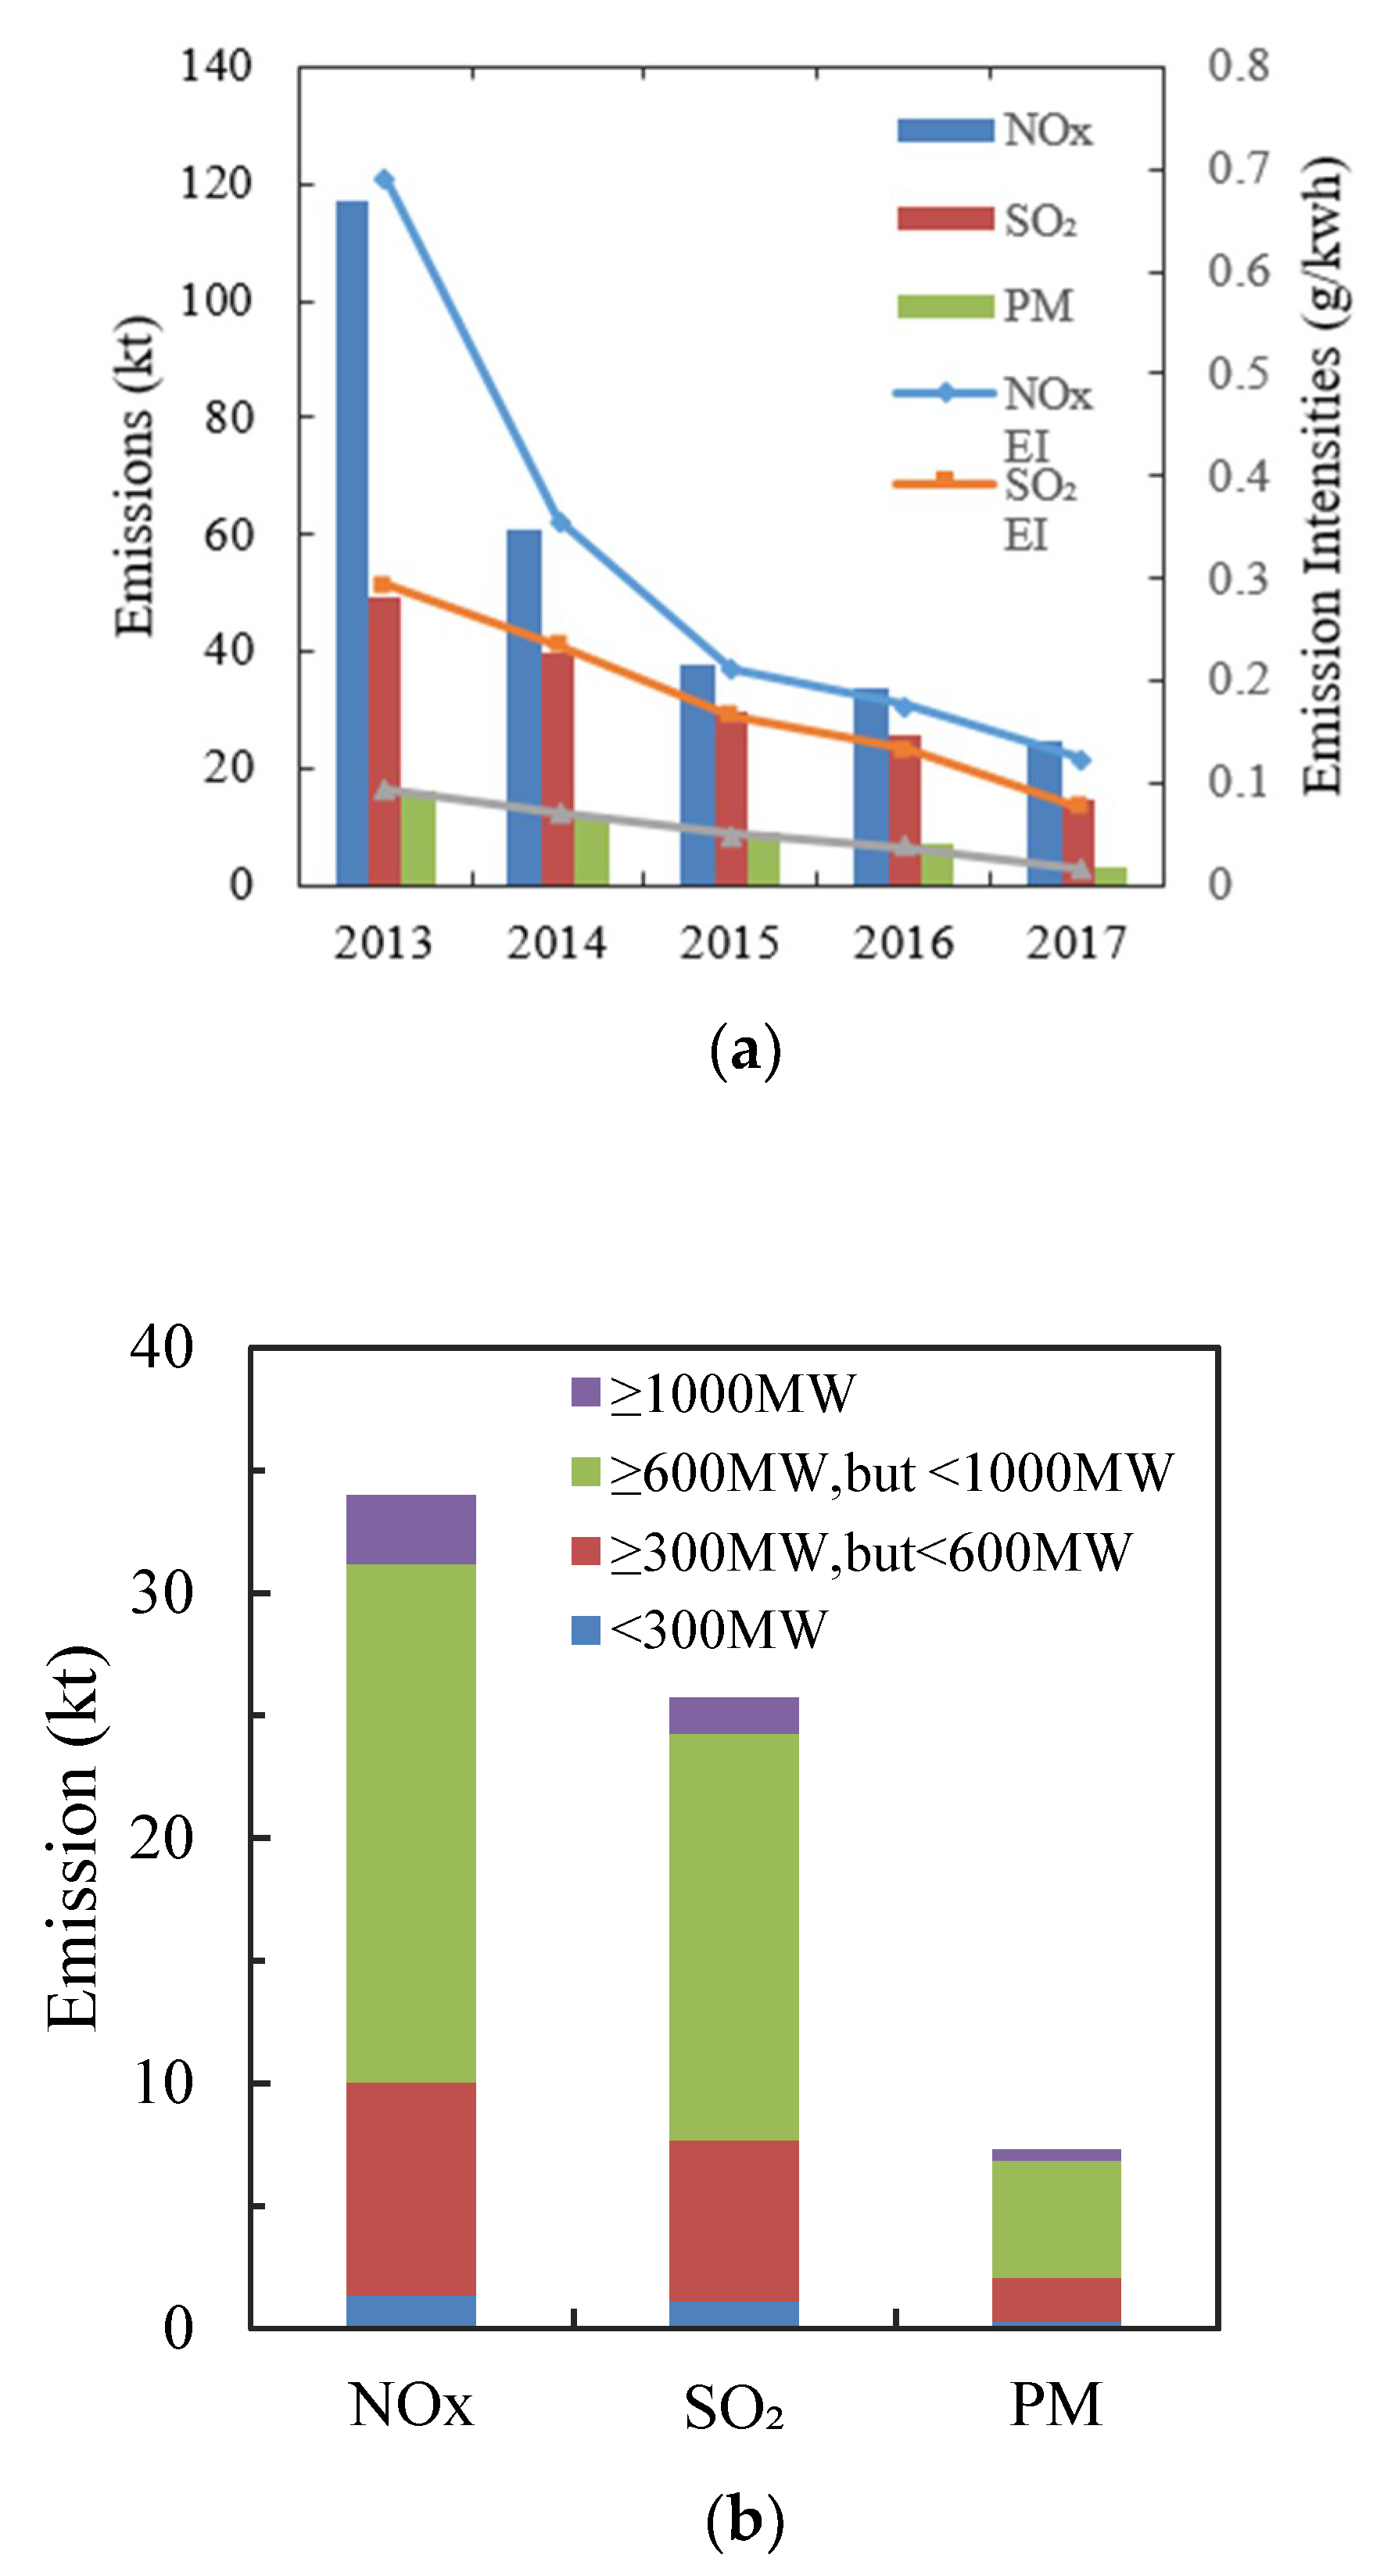
3.2. NOx, SO2 and PM Emissions from Coal-Fired Power Plants under Control Measures
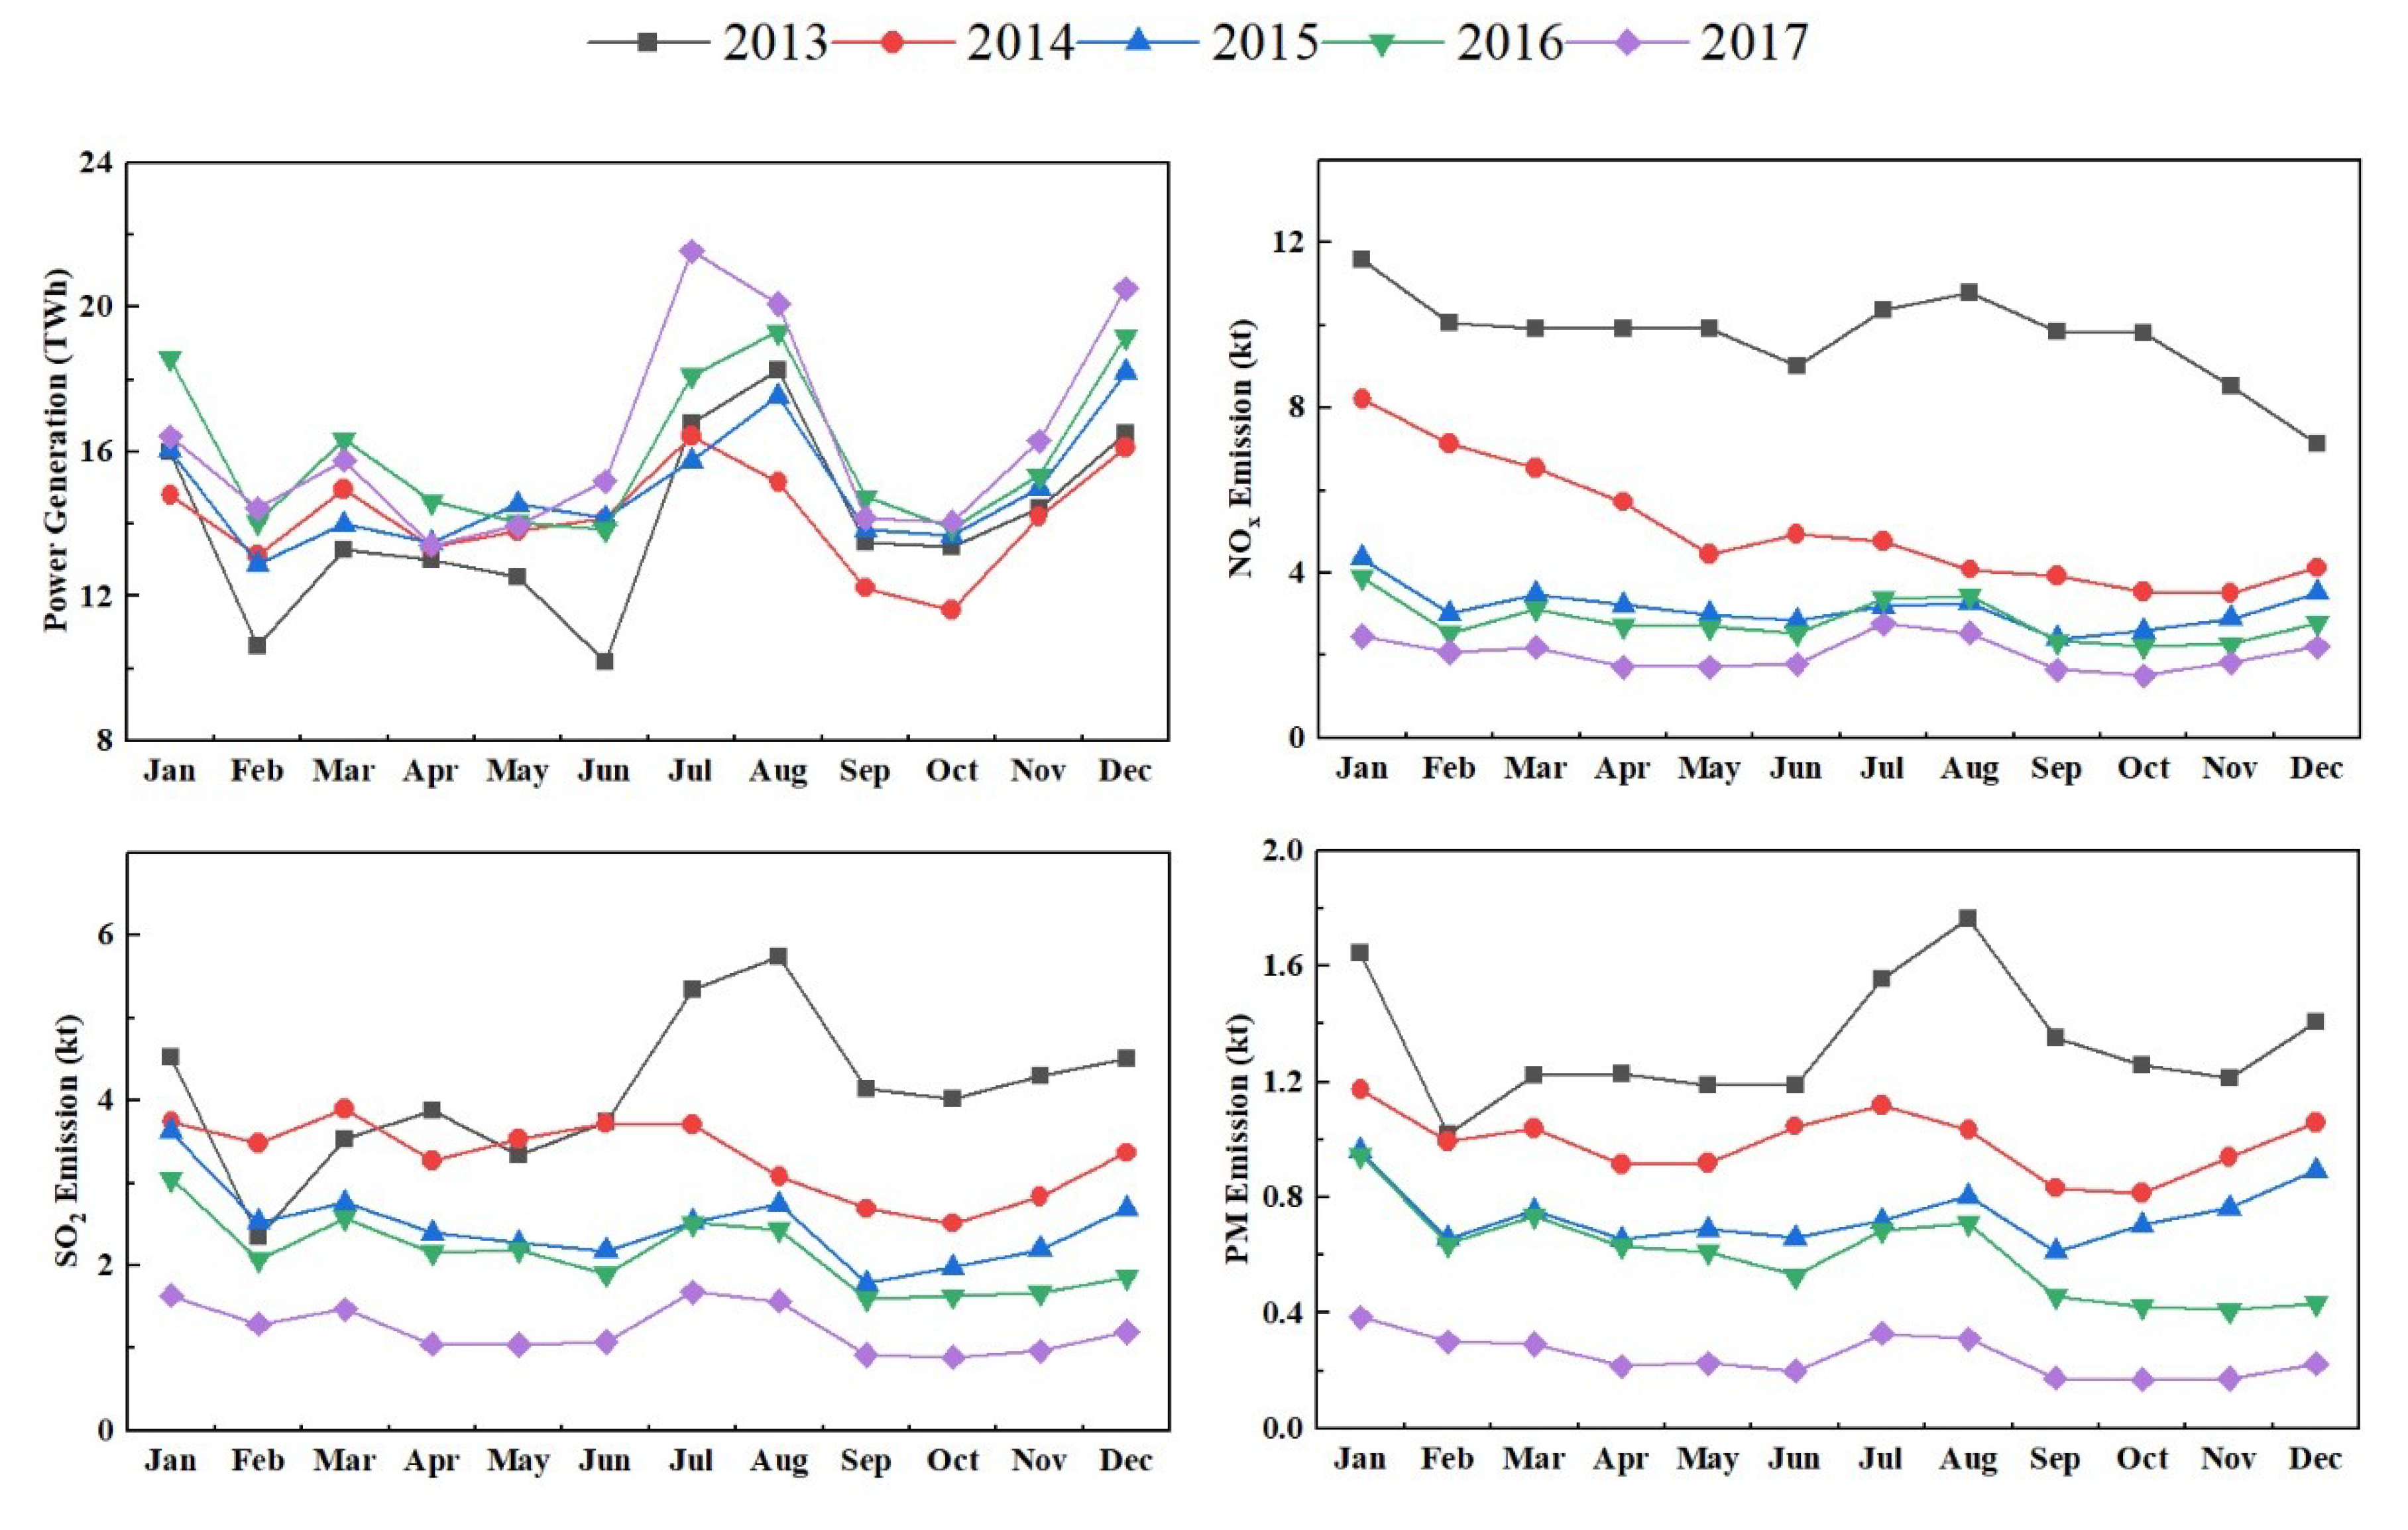
3.3. Temporal Variations of NOx, SO2 and PM Emissions from Coal-Fired Power Plants
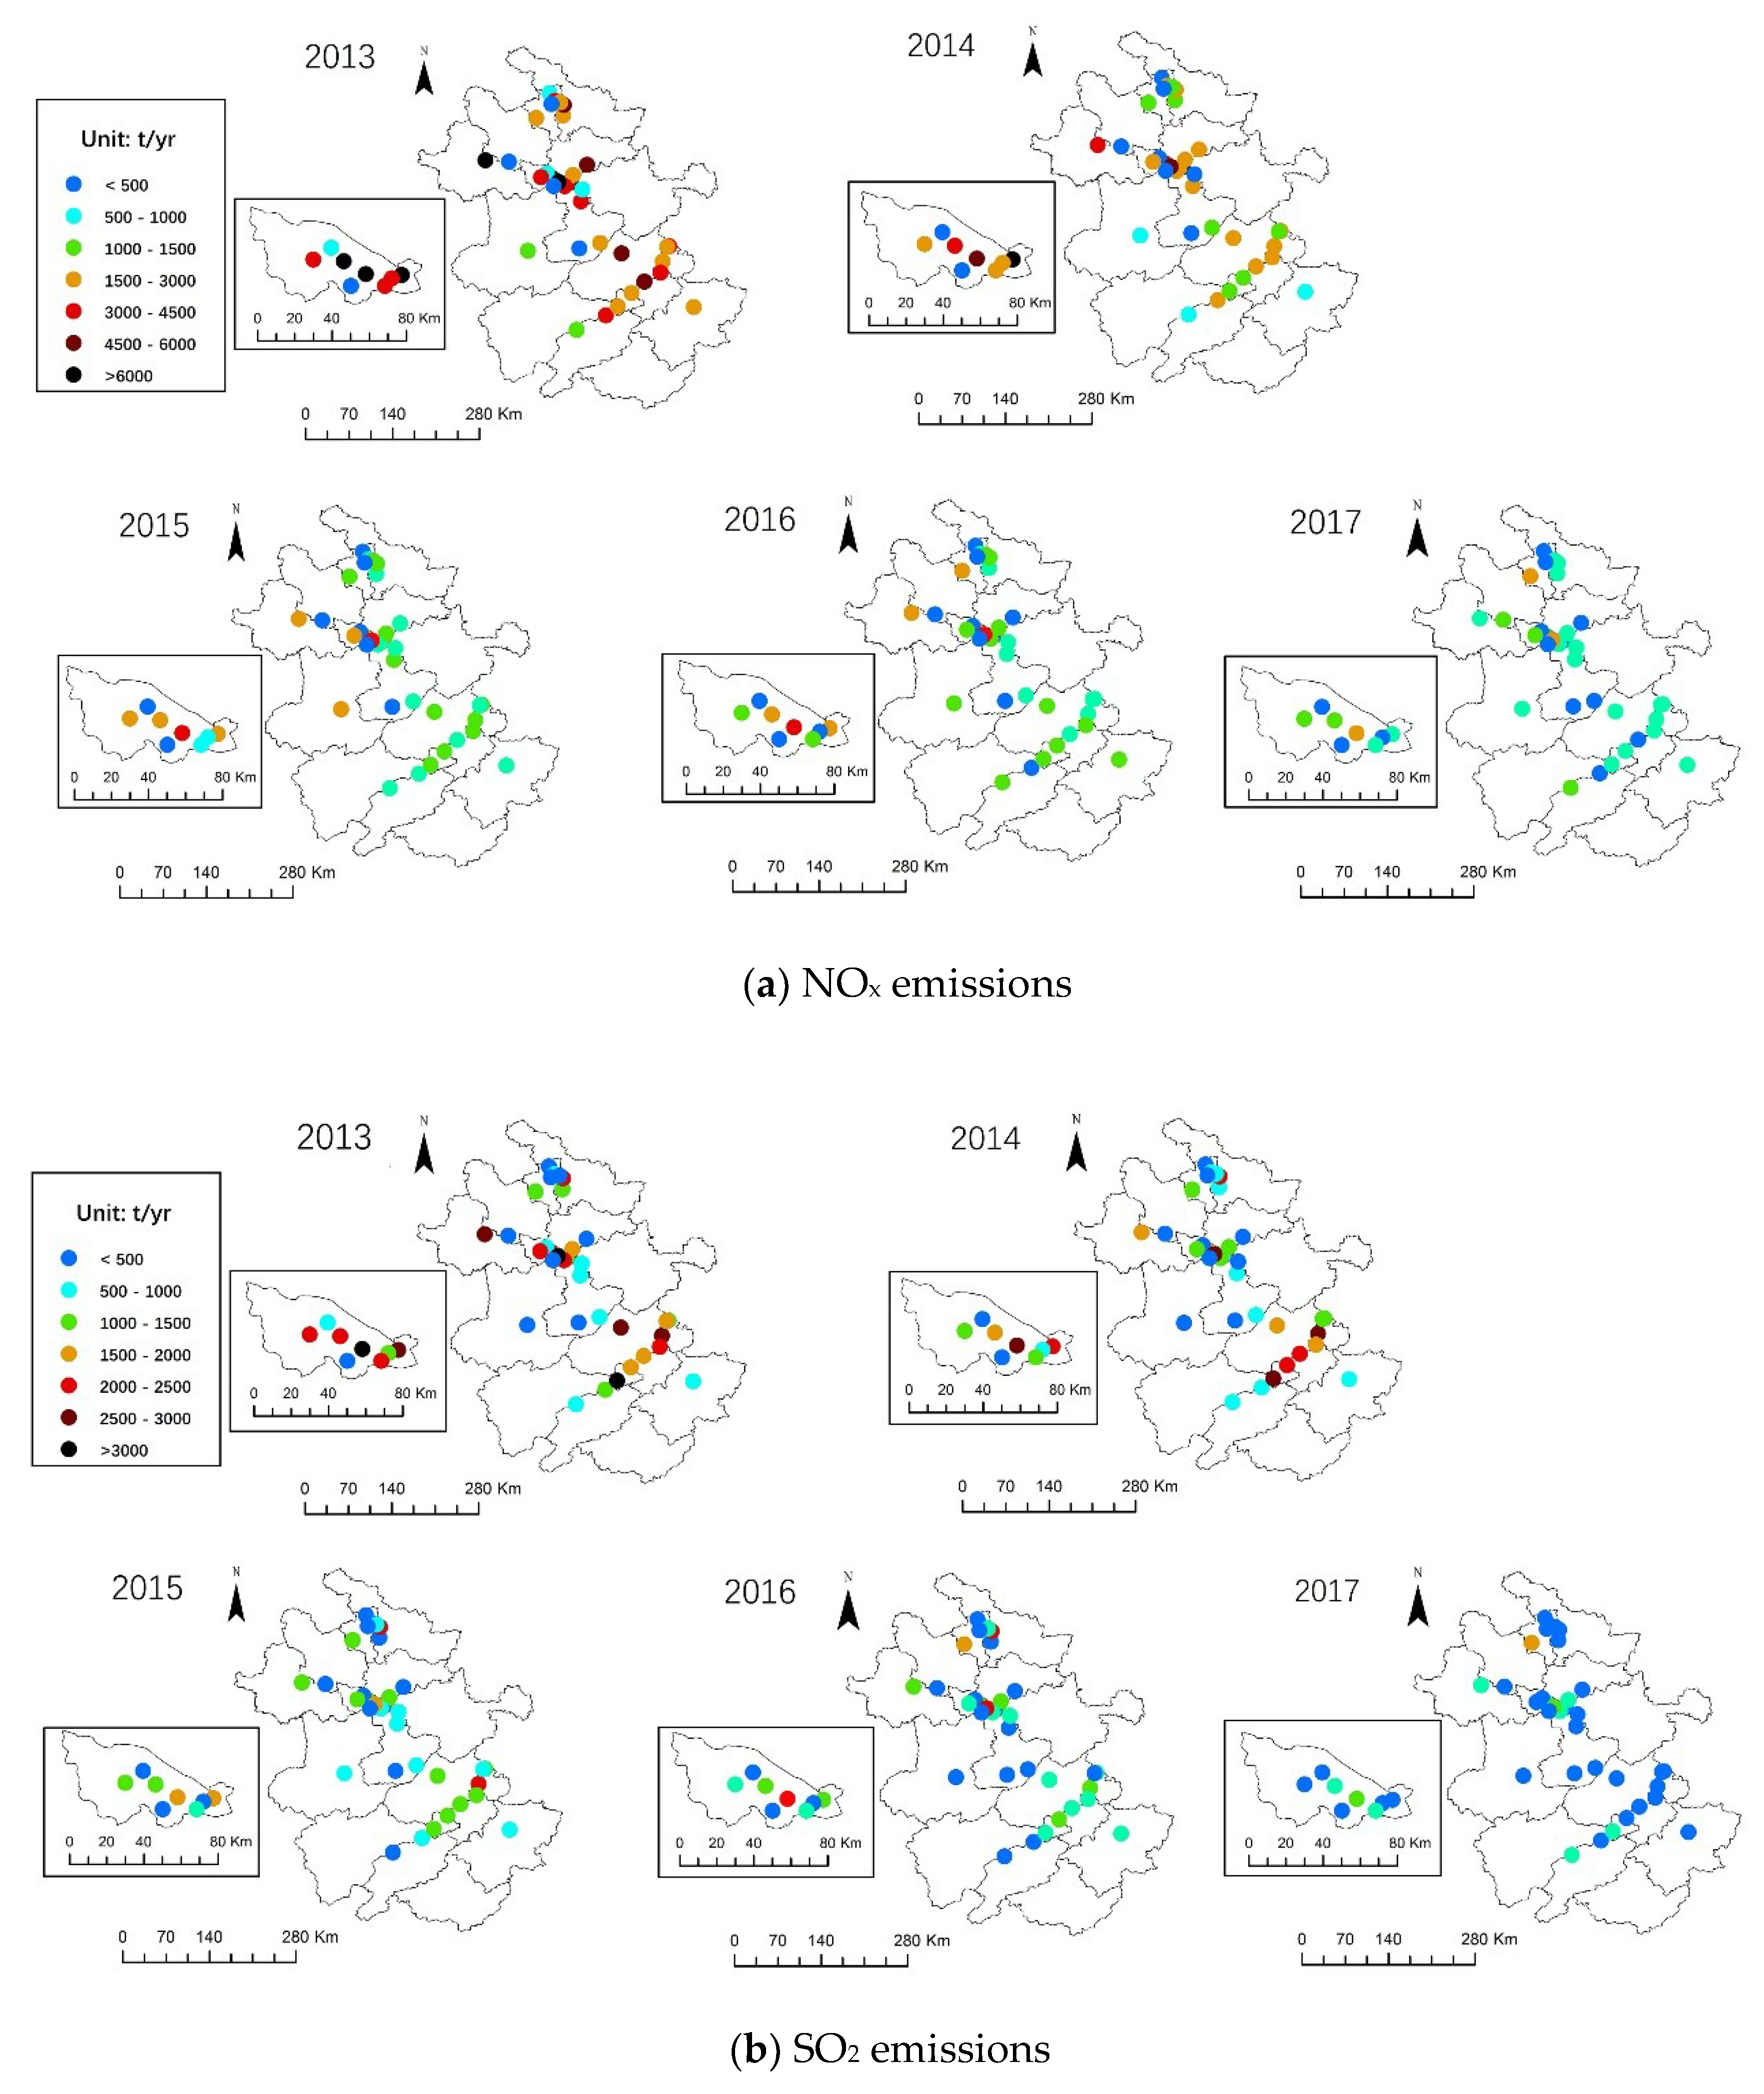
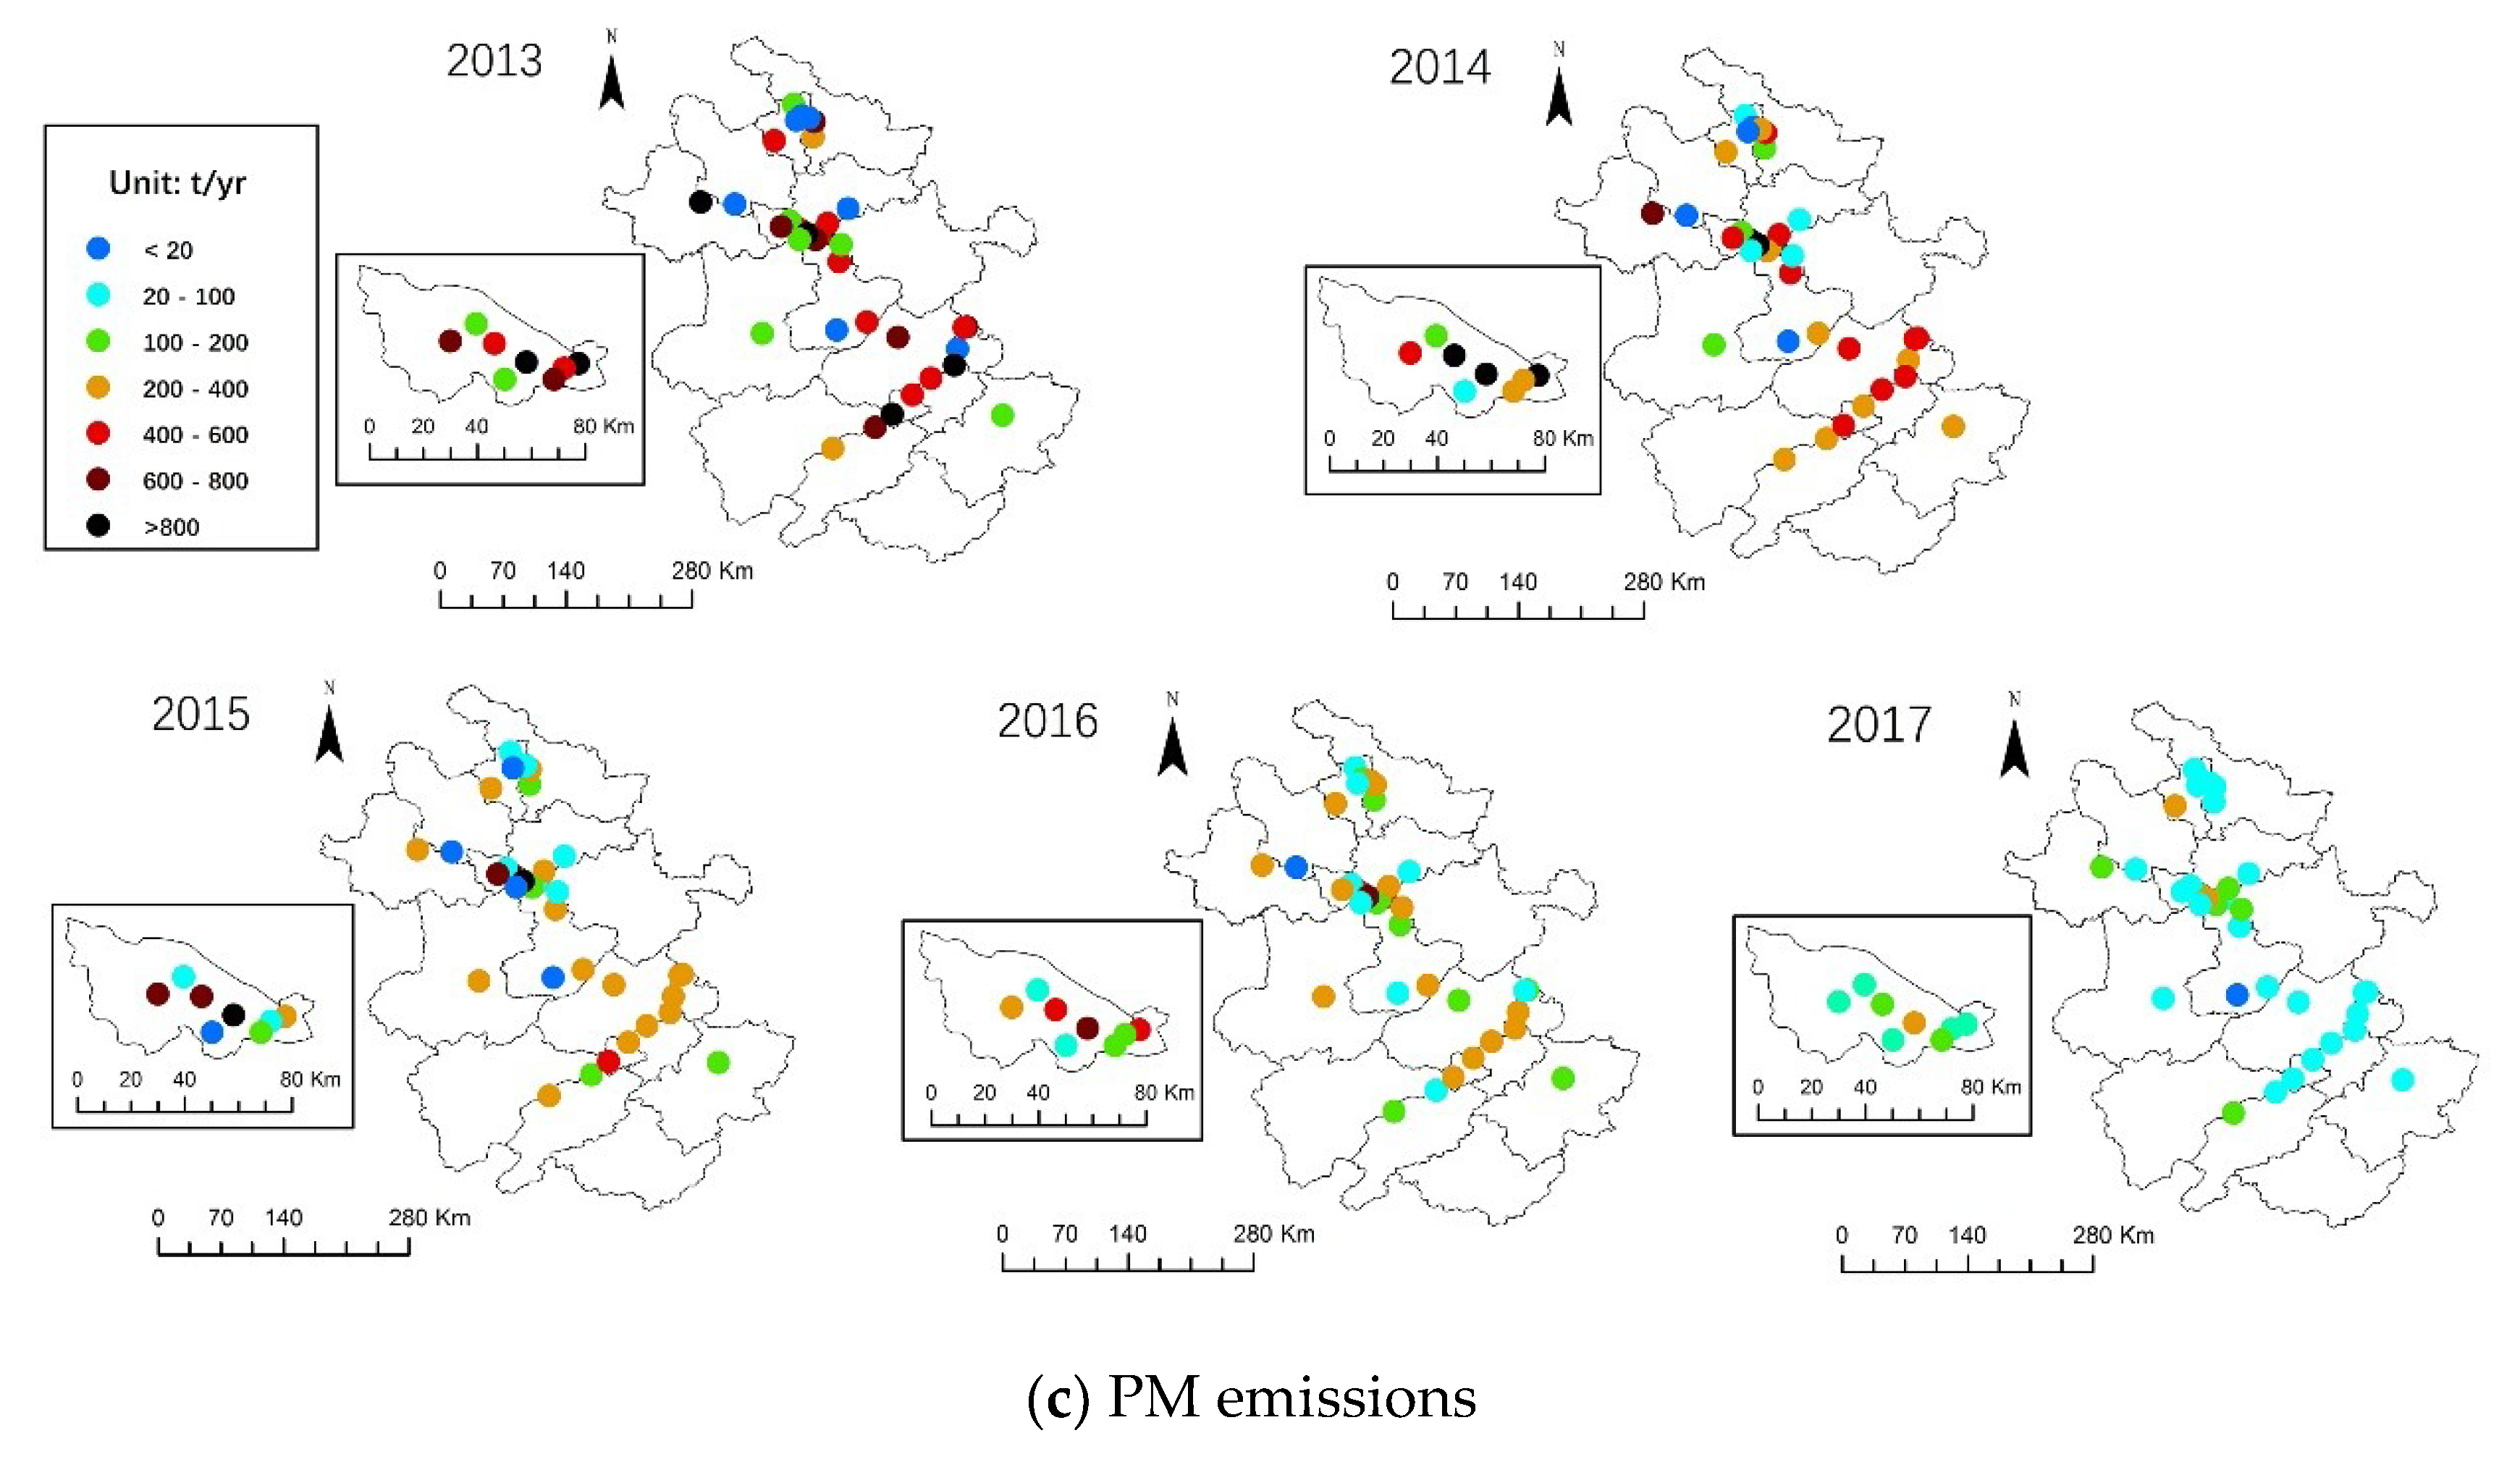
3.4. Spatial Variations of NOx, SO2 and PM Emissions from Coal-Fired Power Plants
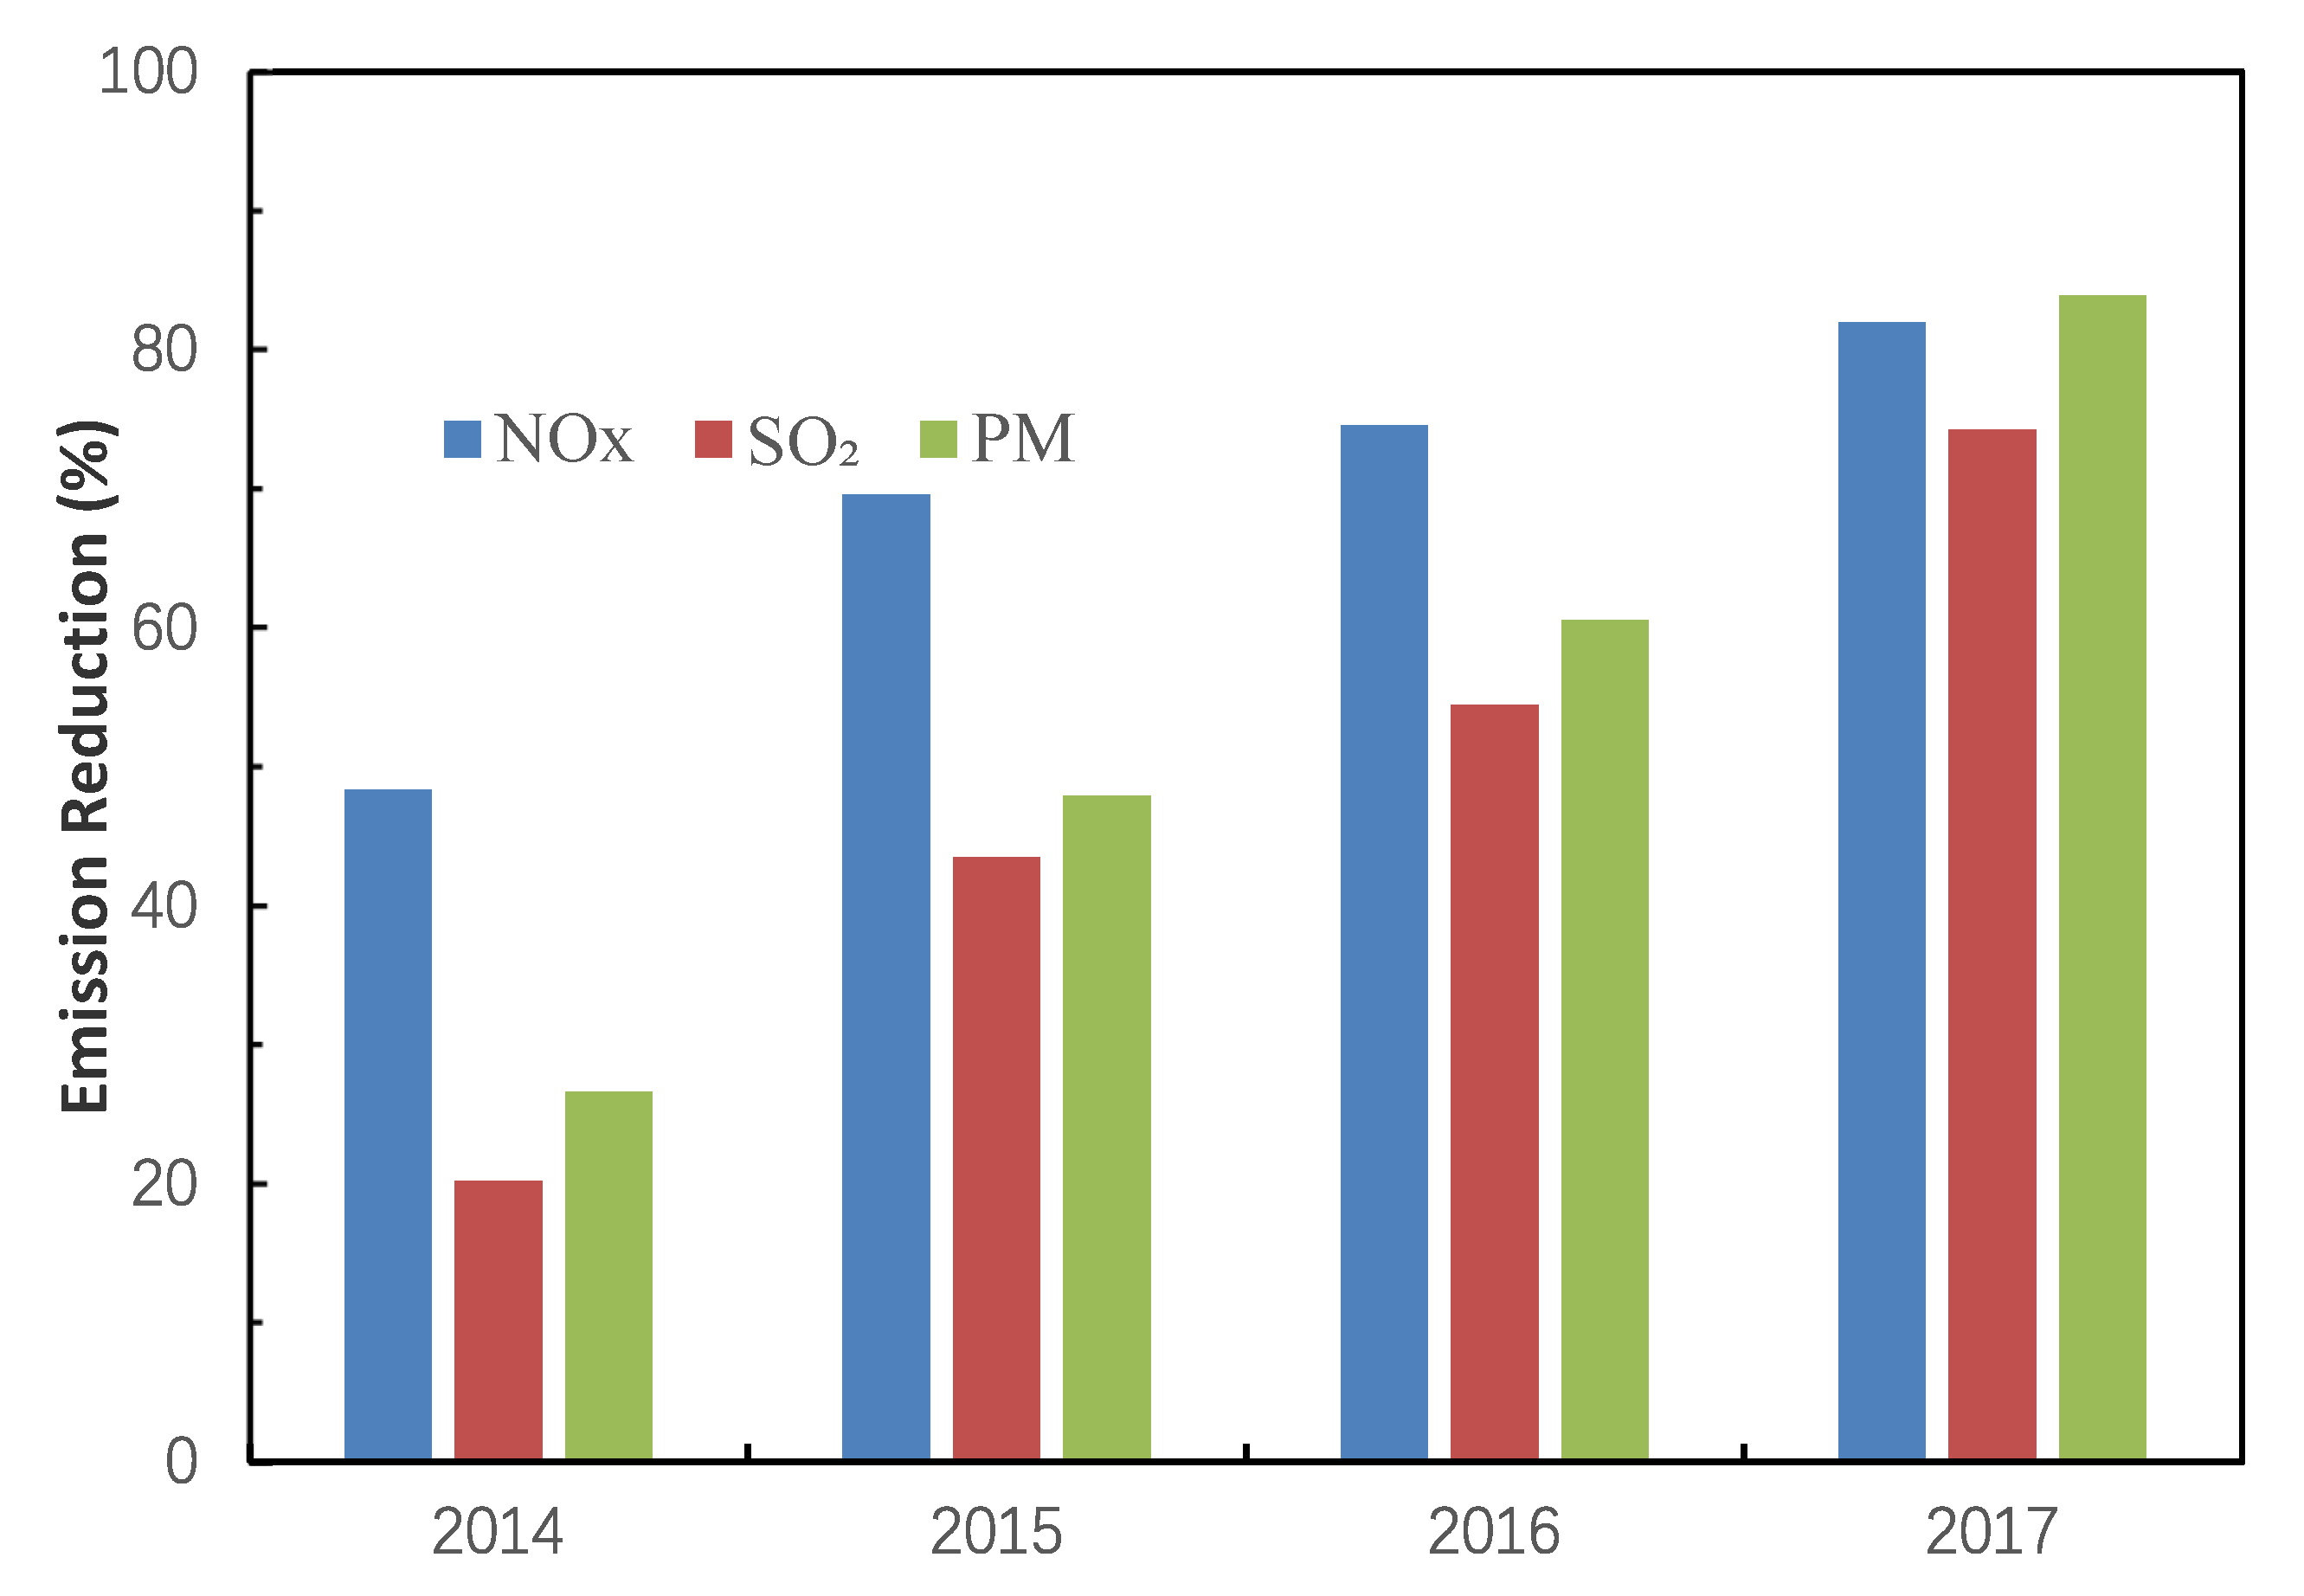
3.5. Contribution of the Control Measures to the Reduction in NOx, SO2 and PM Emissions
4. Conclusions
Supplementary Materials
Author Contributions
Funding
Acknowledgments
Conflicts of Interest
References
- Su, S.; Fang, X.; Zhao, J.; Hu, J. Spatiotemporal characteristics of consumption based CO2 emissions from China’s power sector. Resour. Conserv. Recycl. 2017, 121, 156–163. [Google Scholar] [CrossRef]
- Zhao, Y.; Wang, S.; Duan, L.; Lei, Y.; Cao, P.; Hao, J. Primary air pollutant emissions of coal-fired power plants in China: Current status and future prediction. Atmos. Environ. 2008, 42, 8442–8452. [Google Scholar] [CrossRef]
- Zhao, Y.; Wang, S.; Nielsen, C.P.; Li, X.; Hao, J. Establishment of a database of emission factors for atmospheric pollutants from Chinese coal-fired power plants. Atmos. Environ. 2010, 44, 1515–1523. [Google Scholar] [CrossRef]
- Wang, S.; Xing, J.; Chatani, S.; Hao, J.; Klimont, Z.; Cofala, J.; Amann, M. Verification of anthropogenic emissions of China by satellite and ground observations. Atmos. Environ. 2011, 45, 6347–6358. [Google Scholar] [CrossRef]
- Wang, S.; Hao, J. Air quality management in China: Issues, challenges, and options. J. Environ. Sci. 2012, 24, 2–13. [Google Scholar] [CrossRef]
- CEC. Annual Development Report of China’s Power Industry 2014; China Electricity Council: Beijing, China, 2013–2017. (In Chinese) [Google Scholar]
- Keohane, N.O.; Revesz, R.L.; Stavins, R.N. The Choice of Regulatory Instruments in Environmental Policy. Harv. Environ. Law Rev. 1998, 22, 313–367. [Google Scholar]
- Schreifels, J.J.; Fu, Y.; Wilson, E.J. Sulfur dioxide control in China: Policy evolution during the 10th and 11th Five-year Plans and lessons for the future. Energy Policy 2012, 48, 779–789. [Google Scholar] [CrossRef]
- Liu, X.; Wen, Z. Best available techniques and pollution control: A case study on China’s thermal power industry. J. Clean. Prod. 2012, 23, 113–121. [Google Scholar] [CrossRef]
- Price, L.; Levine, M.D.; Zhou, N.; Fridley, D.; Aden, N.; Lu, H.; McNeil, M.; Zheng, N.; Qin, Y.; Yowargana, P. Assessment of China’s energy-saving and emission-reduction accomplishments and opportunities during the 11th Five Year Plan. Energy Policy 2011, 39, 2165–2178. [Google Scholar] [CrossRef]
- Zhang, X.; Schreifels, J. Continuous emission monitoring systems at power plants in China: Improving SO2 emission measurement. Energy Policy 2011, 39, 7432–7438. [Google Scholar] [CrossRef]
- Wang, Q.; Chen, Y. Energy saving and emission reduction revolutionizing China’s environmental protection. Renew. Sustain. Energy Rev. 2010, 14, 535–539. [Google Scholar] [CrossRef]
- Wang, S.; Xing, J.; Zhao, B.; Jang, C.; Hao, J. Effectiveness of national air pollution control policies on the air quality in metropolitan areas of China. J. Environ. Sci. 2014, 26, 13–22. [Google Scholar] [CrossRef]
- Zhang, M.; Song, Y.; Cai, X.; Zhou, J. Economic assessment of the health effects related to particulate matter pollution in 111 Chinese cities by using economic burden of disease analysis. J. Environ. Manag. 2008, 88, 947–954. [Google Scholar] [CrossRef] [PubMed]
- Xiong, T.; Jiang, W.; Gao, W. Current status and prediction of major atmospheric emissions from coal-fired power plants in Shandong Province, China. Atmos. Environ. 2016, 124, 46–52. [Google Scholar] [CrossRef]
- Wang, S.W.; Zhang, Q.; Streets, D.G.; He, K.B.; Martin, R.V.; Lamsal, L.N.; Chen, D.; Lei, Y.; Lu, Z. Growth in NOx emissions from power plants in China: Bottom-up estimates and satellite observations. Atmos. Chem. Phys. 2012, 12, 4429–4447. [Google Scholar] [CrossRef]
- Tian, H.; Liu, K.; Hao, J.; Wang, Y.; Gao, J.; Qiu, P.; Zhu, C. Nitrogen oxides emissions from thermal power plants in China: Current status and future predictions. Environ. Sci. Technol. 2013, 47, 11350–11357. [Google Scholar] [CrossRef] [PubMed]
- Liu, X.; Lin, B.; Zhang, Y. Sulfur dioxide emission reduction of power plants in China: Current policies and implications. J. Clean. Prod. 2016, 113, 133–143. [Google Scholar] [CrossRef]
- Li, C.; Zhang, Q.; Krotkov, N.A.; Streets, D.G.; He, K.; Tsay, S.-C.; Gleason, J.F. Recent large reduction in sulfur dioxide emissions from Chinese power plants observed by the Ozone Monitoring Instrument. Geophys. Res. Lett. 2010, 37. [Google Scholar] [CrossRef] [Green Version]
- Frost, G.J.; McKeen, S.A.; Trainer, M.; Ryerson, T.B.; Neuman, J.A.; Roberts, J.M.; Swanson, A.; Holloway, J.S.; Sueper, D.T.; Fortin, T.; et al. Effects of changing power plant NOx emissions on ozone in the eastern United States: Proof of concept. J. Geophys. Res. 2006, 111, D12306. [Google Scholar] [CrossRef]
- Peischl, J.; Ryerson, T.B.; Holloway, J.S.; Parrish, D.D.; Trainer, M.; Frost, G.J.; Aikin, K.C.; Brown, S.S.; Dubé, W.P.; Stark, H.; et al. A top-down analysis of emissions from selected Texas power plants during TexAQS 2000 and 2006. J. Geophys. Res. Atmos. 2010, 115. [Google Scholar] [CrossRef] [Green Version]
- Kim, S.-W.; Heckel, A.; McKeen, S.A.; Frost, G.J.; Hsie, E.-Y.; Trainer, M.K.; Richter, A.; Burrows, J.P.; Peckham, S.E.; Grell, G.A. Satellite-observed U.S. power plant NOx emission reductions and their impact on air quality. Geophys. Res. Lett. 2006, 33, L22812. [Google Scholar] [CrossRef]
- Pétron, G.; Tans, P.; Frost, G.; Chao, D.; Trainer, M. High-resolution emissions of CO2 from power generation in the USA. J. Geophys. Res. Biogeosci. 2008, 113. [Google Scholar] [CrossRef]
- Lu, Z.; Streets, D.G.; Zhang, Q.; Wang, S.; Carmichael, G.R.; Cheng, Y.F.; Wei, C.; Chin, M.; Diehl, T.; Tan, Q. Sulfur dioxide emissions in China and sulfur trends in East Asia since 2000. Atmos. Chem. Phys. 2010, 10, 6311–6331. [Google Scholar] [CrossRef] [Green Version]
- Liu, F.; Zhang, Q.; Tong, D.; Zheng, B.; Li, M.; Huo, H.; He, K.B. High-resolution inventory of technologies, activities, and emissions of coal-fired power plants in China from 1990 to 2010. Atmos. Chem. Phys. 2015, 15, 13299–13317. [Google Scholar] [CrossRef]
- Wang, S.; Streets, D.G.; Zhang, Q.; He, K.; Chen, D.; Kang, S.; Lu, Z.; Wang, Y. Satellite detection and model verification of NOx emissions from power plants in Northern China. Environ. Res. Lett. 2010, 5, 044007. [Google Scholar] [CrossRef]
- Zhang, X.; Wang, X.Y.; Bai, Z.P.; Han, B. Co-benefits of integrating PM10 and CO2 reduction in an electricity industry in Tianjin, China. Aerosol Air Qual. Res. 2013, 13, 756–770. [Google Scholar] [CrossRef]
- Cai, W.; Wang, C.; Wang, K.; Zhang, Y.; Chen, J. Scenario analysis on CO2 emissions reduction potential in China’s electricity sector. Energy Policy 2007, 35, 6445–6456. [Google Scholar] [CrossRef]
- Xu, Y. The use of a goal for SO2 mitigation planning and management in China’s 11th Five-Year Plan. J. Environ. Plan. Manag. 2011, 54, 769–783. [Google Scholar] [CrossRef]
- Xu, Y. Improvements in the Operation of SO2 Scrubbers in China’s Coal Power Plants. Environ. Sci. Technol. 2011, 45, 380–385. [Google Scholar] [CrossRef] [PubMed]
- Schakenbach, J.; Vollaro, R.; Forte, R. Fundamentals of Successful Monitoring, Reporting, and Verification under a Cap-and-Trade Program. J. Air Waste Manag. Assoc. 2006, 56, 1576–1583. [Google Scholar] [CrossRef] [PubMed] [Green Version]
- US EPA. CEMS Field Audit Manual; Part 75; United States Environmental Protection Agency (US EPA): Washington, DC, USA, 2003.
- Xu, R.; Mei, Z.M.; Zhao, M.Q.; He, H.X. Inquisition to Several Issues in Performance Test of SCR Flue Gas Denitration System. Adv. Mater. Res. 2012, 610–613, 1610–1615. [Google Scholar] [CrossRef]
- Sun, Y. Study on Emission Inventory and Uncertainty Assessment of Multi-Pollutants from Coal-Fired Power Plants. Master’s Thesis, Zhejiang University, Hangzhou, China, 2015. [Google Scholar]
- Jin, W.Q. Power Plant Boiler; China Waterpower Press: Beijing, China, 2001. [Google Scholar]
- Wang, J.; Wang, Z.G.; Zhao, B.; Wang, S.X.; Hao, J.M. Cost-effectiveness analysis of multi-pollutant emission reduction in power sector of China. Res. Environ. Sci. 2014, 27, 1314–1322. [Google Scholar]
- Elser, M.; Huang, R.-J.; Wolf, R.; Slowik, J.G.; Wang, Q.; Canonaco, F.; Li, G.; Bozzetti, C.; Daellenbach, K.R.; Huang, Y.; et al. New insights into PM2.5 chemical composition and sources in two major cities in China during extreme haze events using aerosol mass spectrometry. Atmos. Chem. Phys. 2016, 16, 3207–3225. [Google Scholar] [CrossRef]
- Zheng, M.; Salmon, L.G.; Schauer, J.J.; Zeng, L.; Kiang, C.S.; Zhang, Y.; Cass, G.R. Seasonal trends in PM2.5 source contributions in Beijing, China. Atmos. Environ. 2005, 39, 3967–3976. [Google Scholar] [CrossRef]
- Huang, R.-J.; Zhang, Y.; Bozzetti, C.; Ho, K.-F.; Cao, J.-J.; Han, Y.; Daellenbach, K.R.; Slowik, J.G.; Platt, S.M.; Canonaco, F.; et al. High secondary aerosol contribution to particulate pollution during haze events in China. Nature 2014, 514, 218–222. [Google Scholar] [CrossRef] [PubMed] [Green Version]
- Liu, D.; Yao, Y.; Tang, D.; Tang, S.; Che, Y.; Huang, W. Coal reservoir characteristics and coalbed methane resource assessment in Huainan and Huaibei coalfields, Southern North China. Int. J. Coal Geol. 2009, 79, 97–112. [Google Scholar] [CrossRef]
- Tian, H.; Wang, Y.; Xue, Z.; Qu, Y.; Chai, F.; Hao, J. Atmospheric emissions estimation of Hg, As, and Se from coal-fired power plants in China, 2007. Sci. Total Environ. 2011, 409, 3078–3081. [Google Scholar] [CrossRef]
- Chen, L.; Sun, Y.; Wu, X.; Zhang, Y.; Zheng, C.; Gao, X.; Cen, K. Unit-based emission inventory and uncertainty assessment of coal-fired power plants. Atmos. Environ. 2014, 99, 527–535. [Google Scholar] [CrossRef]
- Wu, Y.; Streets, D.G.; Wang, S.X.; Hao, J.M. Uncertainties in estimating mercury emissions from coal-fired power plants in China. Atmos. Chem. Phys. 2010, 10, 2937–2946. [Google Scholar] [CrossRef] [Green Version]
- Zhao, Y.; Zhang, J.; Nielsen, C.P. The effects of recent control policies on trends in emissions of anthropogenic atmospheric pollutants and CO2 in China. Atmos. Chem. Phys. 2013, 13, 487–508. [Google Scholar] [CrossRef]


| 2013 SO2/NOx | 2014 SO2/NOx | 2014 PM | |
|---|---|---|---|
| Paired-sample T-test | 0.754 | 0.966 | 0.498 |
| correlation coefficient | 0.964 ** | 0.967 ** | 0.802 ** |
| Unit Capacity (UC) | SO2 | NOx | PM | Gram Coal kWh−1 |
|---|---|---|---|---|
| Emission Intensities (g kWh−1) | ||||
| UC < 300 MW | 0.228 | 0.285 | 0.053 | 321.2 |
| 300 ≤ UC < 600 MW | 0.177 | 0.234 | 0.048 | 312.1 |
| 600 ≤ UC < 1000 MW | 0.107 | 0.137 | 0.031 | 298.4 |
| UC ≥ 1000 MW | 0.063 | 0.120 | 0.019 | 278.3 |
| 2013 | 2014 | 2015 | 2016 | 2017 | |
|---|---|---|---|---|---|
| Determination coefficient (R2) | |||||
| NOx | 0.13 | 0.14 | 0.50 | 0.77 ** | 0.824 ** |
| SO2 | 0.89 * | 0.63 * | 0.48 | 0.56 | 0.65 * |
| PM | 0.89 ** | 0.84 ** | 0.77 ** | 0.42 | 0.44 |
© 2019 by the authors. Licensee MDPI, Basel, Switzerland. This article is an open access article distributed under the terms and conditions of the Creative Commons Attribution (CC BY) license (http://creativecommons.org/licenses/by/4.0/).
Share and Cite
Dai, H.; Ma, D.; Zhu, R.; Sun, B.; He, J. Impact of Control Measures on Nitrogen Oxides, Sulfur Dioxide and Particulate Matter Emissions from Coal-Fired Power Plants in Anhui Province, China. Atmosphere 2019, 10, 35. https://doi.org/10.3390/atmos10010035
Dai H, Ma D, Zhu R, Sun B, He J. Impact of Control Measures on Nitrogen Oxides, Sulfur Dioxide and Particulate Matter Emissions from Coal-Fired Power Plants in Anhui Province, China. Atmosphere. 2019; 10(1):35. https://doi.org/10.3390/atmos10010035
Chicago/Turabian StyleDai, Haitao, Dawei Ma, Renbin Zhu, Bowen Sun, and Jun He. 2019. "Impact of Control Measures on Nitrogen Oxides, Sulfur Dioxide and Particulate Matter Emissions from Coal-Fired Power Plants in Anhui Province, China" Atmosphere 10, no. 1: 35. https://doi.org/10.3390/atmos10010035