Impact of Modified Spacer on Flow Pattern in Narrow Spacer-Filled Channels for Spiral-Wound Membrane Modules


1
Faculty of Environmental Engineering, The University of Kitakyushu, 1-1 Hibikino, Wakamatsu, Kitakyushu 802-8577, Japan
2
School of Municipal and Environmental Engineering, Shandong Jianzhu University, Jinan 250101, China
*
Author to whom correspondence should be addressed.
Environments 2018, 5(11), 116; https://doi.org/10.3390/environments5110116
Submission received: 7 September 2018
/
Revised: 24 October 2018
/
Accepted: 25 October 2018
/
Published: 28 October 2018
(This article belongs to the Special Issue Environmental Applications of Membrane Technology)
Abstract
:A modified spacer, which was constructed with arched filaments and zigzag filaments, was designed to improve vortex shedding and generate a directional change in flow patterns of membrane modules, especially in the vicinity of the feed spacer filament, which is most affected by fouling. A unit cell was investigated by using a three-dimensional computational fluid dynamics (CFD) model for hydrodynamic simulation. The results of CFD simulations were carried out for the fluid flow in order to understand the effect of the modified spacer on vortices to the performance of arched filaments at different distances. From 2D velocity vectors and shear stress contour mixing, the flow pattern and dead zone flushing were depicted. The ratio of low shear stress area to the total area increased with the inlet velocity closed to 20%. The energy consumption with respect to flow direction for the arched filament was 80% lower than that in the zigzag filament. Compared with previous commercial spacers’ simulation, the friction factor was lower when the main flow was normal to the arched filament and the modified friction factor was close to the commercial spacers. The homogenization was realized through the flow pattern created by the modified spacer.
1. Introduction
The increased water demand caused by an increased population, industrial expansion, tourism, and agricultural development urges augmenting the water supply in many water-stressed or arid regions or countries. Reverse osmosis (RO) as a desalination technology has become widely accepted for the purification of water for drinking or other purposes due to the reduction in desalination cost achieved through significant technological advances. In membrane technology, the two most used configurations of commercial membrane elements are spiral wound and hollow fiber. Spiral wound modules (SWM) wrap a leaf around a tube for perforated permeate collection to create a compact structure. Two flat membrane sheets separated by a spacer to form a channel for feed flow are assembled into a leaf.
Concentration polarization and fouling are the inevitable phenomena that are the prime reasons for flux reduction in commercial water treatment processes. Avoiding membrane fouling, pretreatment of feed flow, and so on have been taken into consideration by many researchers [1]. Spacers, as an essential part of SWMs, not only create a feed channel, but also promote the mixing of feed fluid at the same time, which affects the flow patterns near the membrane surface related with the fouling inclination and concentration gradient.
Spacer geometry and the dead zone behind the spacer have been focused on in many numerical and experimental studies. For instance, Boram et al. reported the effect of feed spacer geometry on membrane performance and concentration polarization based on CFD (computational fluid dynamics) simulation [2]. In their study, four types of feed spacer configurations, namely nonwoven, partially woven, middle layer, and fully woven, were investigated through three-dimensional simulations. Their numerical simulation results indicated that fully woven spacers showed better performance than other configurations in mitigating concentration polarization and delivering water flux by the mesh angle of 60°, but a greater pressure drop was caused than with their nonwoven counterparts. Sablani et al. experimentally found [3] a decrease in flux with decreasing spacer thickness, but for the intermediate spacer thickness, the maximum permeate flow was generated. Radu et al. reported that substrate rejection due to concentration polarization increased with biofilm thickness, depending on flow pattern [4].
The study of spacers is a direct method to improve flow patterns to reduce fouling. In previous studies, three kinds of configurations, namely zigzag, submerged, and cavity, have been focused on in two-dimensional configuration simulations for classic spacer geometry (Figure 1). Compared with the submerged configuration and cavity configuration, the zigzag configuration is the most efficient spacer type for a spiral wound membrane module. However, in the open channel, the highest axial pressure drop is found for the submerged configuration. From previous works, mixing improvement is one of the key methods to optimize flux in the separation process. Spacer configuration can be characterized by the distance between spacer filaments; the angle between the spacer filaments, β; and the flow attack angle, α. The distance between the spacer filaments defines the porosity of the feed channel, and the angles define the flow regime and drag force from the spacer. In this study, a modified spacer was designed to enhance the mixing ability, which was constructed with arched filaments and zigzag filaments. In this modified spacer design, the filament, which was parallel to the flow direction, was set as the zigzag configuration, and the transverse filament facing the flow direction was set as the arched filament in order to enhance the mixing between the fluid bulk and fluid elements adjacent to the membrane surface. Furthermore, the conjunction between the arched filament and zigzag filament had a small area of contact with the membrane, which reduced the dead zone caused by the shadow of the filament. The arched filament in the middle of the feed channel enabled the disruption of the solute concentration boundary layer. A schematic diagram of the modified feed spacer is illustrated in Figure 1.
In the separating process, the rejected solute generates a concentration gradient in the boundary layer near the membrane surface, and this phenomenon is known as concentration polarization [5]. In typical net-like feed spacers, both woven and nonwoven, the flow in the feed channel is always divided into the boundary region and the bulk flow region. In the boundary region, concentration polarization is easily attained in the undisturbed condition. To enable the mixing of feed flow in two regions, the design of the spacer configuration is one way to reduce the phenomenon of concentration polarization. Cao et al. reported that the enhancement of mass transfer is closely related to the high shear stress value, velocity fluctuation, and eddy formation, and that the location and interfilament distance of the spacers constrain the shear stress distribution, mass transfer coefficients, and pressure inside the channel [6]. To clarify the characteristics of the modified spacer, the simulation of two flow directions normal to the zigzag filament and normal to the arched filament, detailed in the next section, was considered. Comparison with the experimental results of the commercial spacer was applied to confirm the result of the CFD simulation and understand its quality. As shown in Figure 2, when the main flow was normal to the zigzag filament, from the basic concept of laminar flow, except for the region surrounding the arched filament, the flow pattern was similar to that of the conventional partially woven spacer mentioned in many previous works [2]. Moreover, not only the values of velocity and shear stress affect the concentration on the membrane surface; the distribution of shear stress also plays a key role in disrupting the concentration and creating the concentration layer, which was discussed through the contour plot in this study. However, for comprehensive research, the unit energy consumption and average shear stress should be in a rational range. The dimensionless parameter of friction factor and the modified friction factor were applied to enable comparison with the previous study of the commercial spacers.
The impact of the modified feed spacer on channel hydraulics was focused on through the construction of a 3D CFD model. There were two steps to the model: (i) The geometry was constructed through comparison with conventional geometries; (ii) the incompressible flow in the laminar flow regime was calculated by using commonly employed parameters (friction factor and modified friction factor).
2. Materials and Methods
To compare different feed spacer characteristics, pressure drop can be expressed in terms of the dimensionless power number and friction factor. The dimensionless power number is generally accepted as a dimensionless parameter to find the situation of energy consumption for different spacer geometries with the same Reynolds number. Additionally, the dimensionless power number as a basic parameter is used to compare shear stress, as discussed in the next sections.
2.1. Characterization of the Modified feed Spacer
The geometry of this modified feed spacer was described by the feed channel height, hf; the element length (the distance between arched filaments), L; and the thickness of the zigzag and arched filaments, D, which was equal to one-third of the channel height, considering the fabrication possibility, D = hf/3. The arched filament was designed as a semicircle, and the distance between the zigzag filaments, b, was equal to the circle’s diameter or twice the channel height, b = 2hf, as shown by the three-view diagram in Figure 2 (front view, side view, and vertical view). The feed spacer was characterized by the hydraulic diameter, DH, and the porosity or voidage of the feed channel, ε. A simplified, cylindrical filament, which, in most of the numerical studies, replaced a realistic spacer, was applied in the present study [7].
The arched filament was between the two walls/membranes and through the bulk region to connect the zigzag filaments, and the zigzag filament contacted the membrane with the line, as shown in Figure 1. The basic geometrical characteristic is the ratio of the distance between arched filaments to the thickness of cylinder filaments’ intersection (L/D), which is related to the channel porosity. This key ratio is employed in defining the element size of common conventional spacers. From the CFD viewpoint, it is convenient to define every simulated unit cell and simulate the respective flow field in detail; thus, L/D = 8, 10, 12, and 14 were employed in the present parameter setting. In addition, Shyam et al. focused on the influence of spacer thickness on permeate flux. Their results showed that when the spacer thickness was from 1.168 to 0.508 mm, the observed flux decreased by up to 50%, and the spacer with a thickness of 0.71 mm was found to be the most economical [3]. In this design, D = 0.6 mm, being close to 0.71 mm, was used.
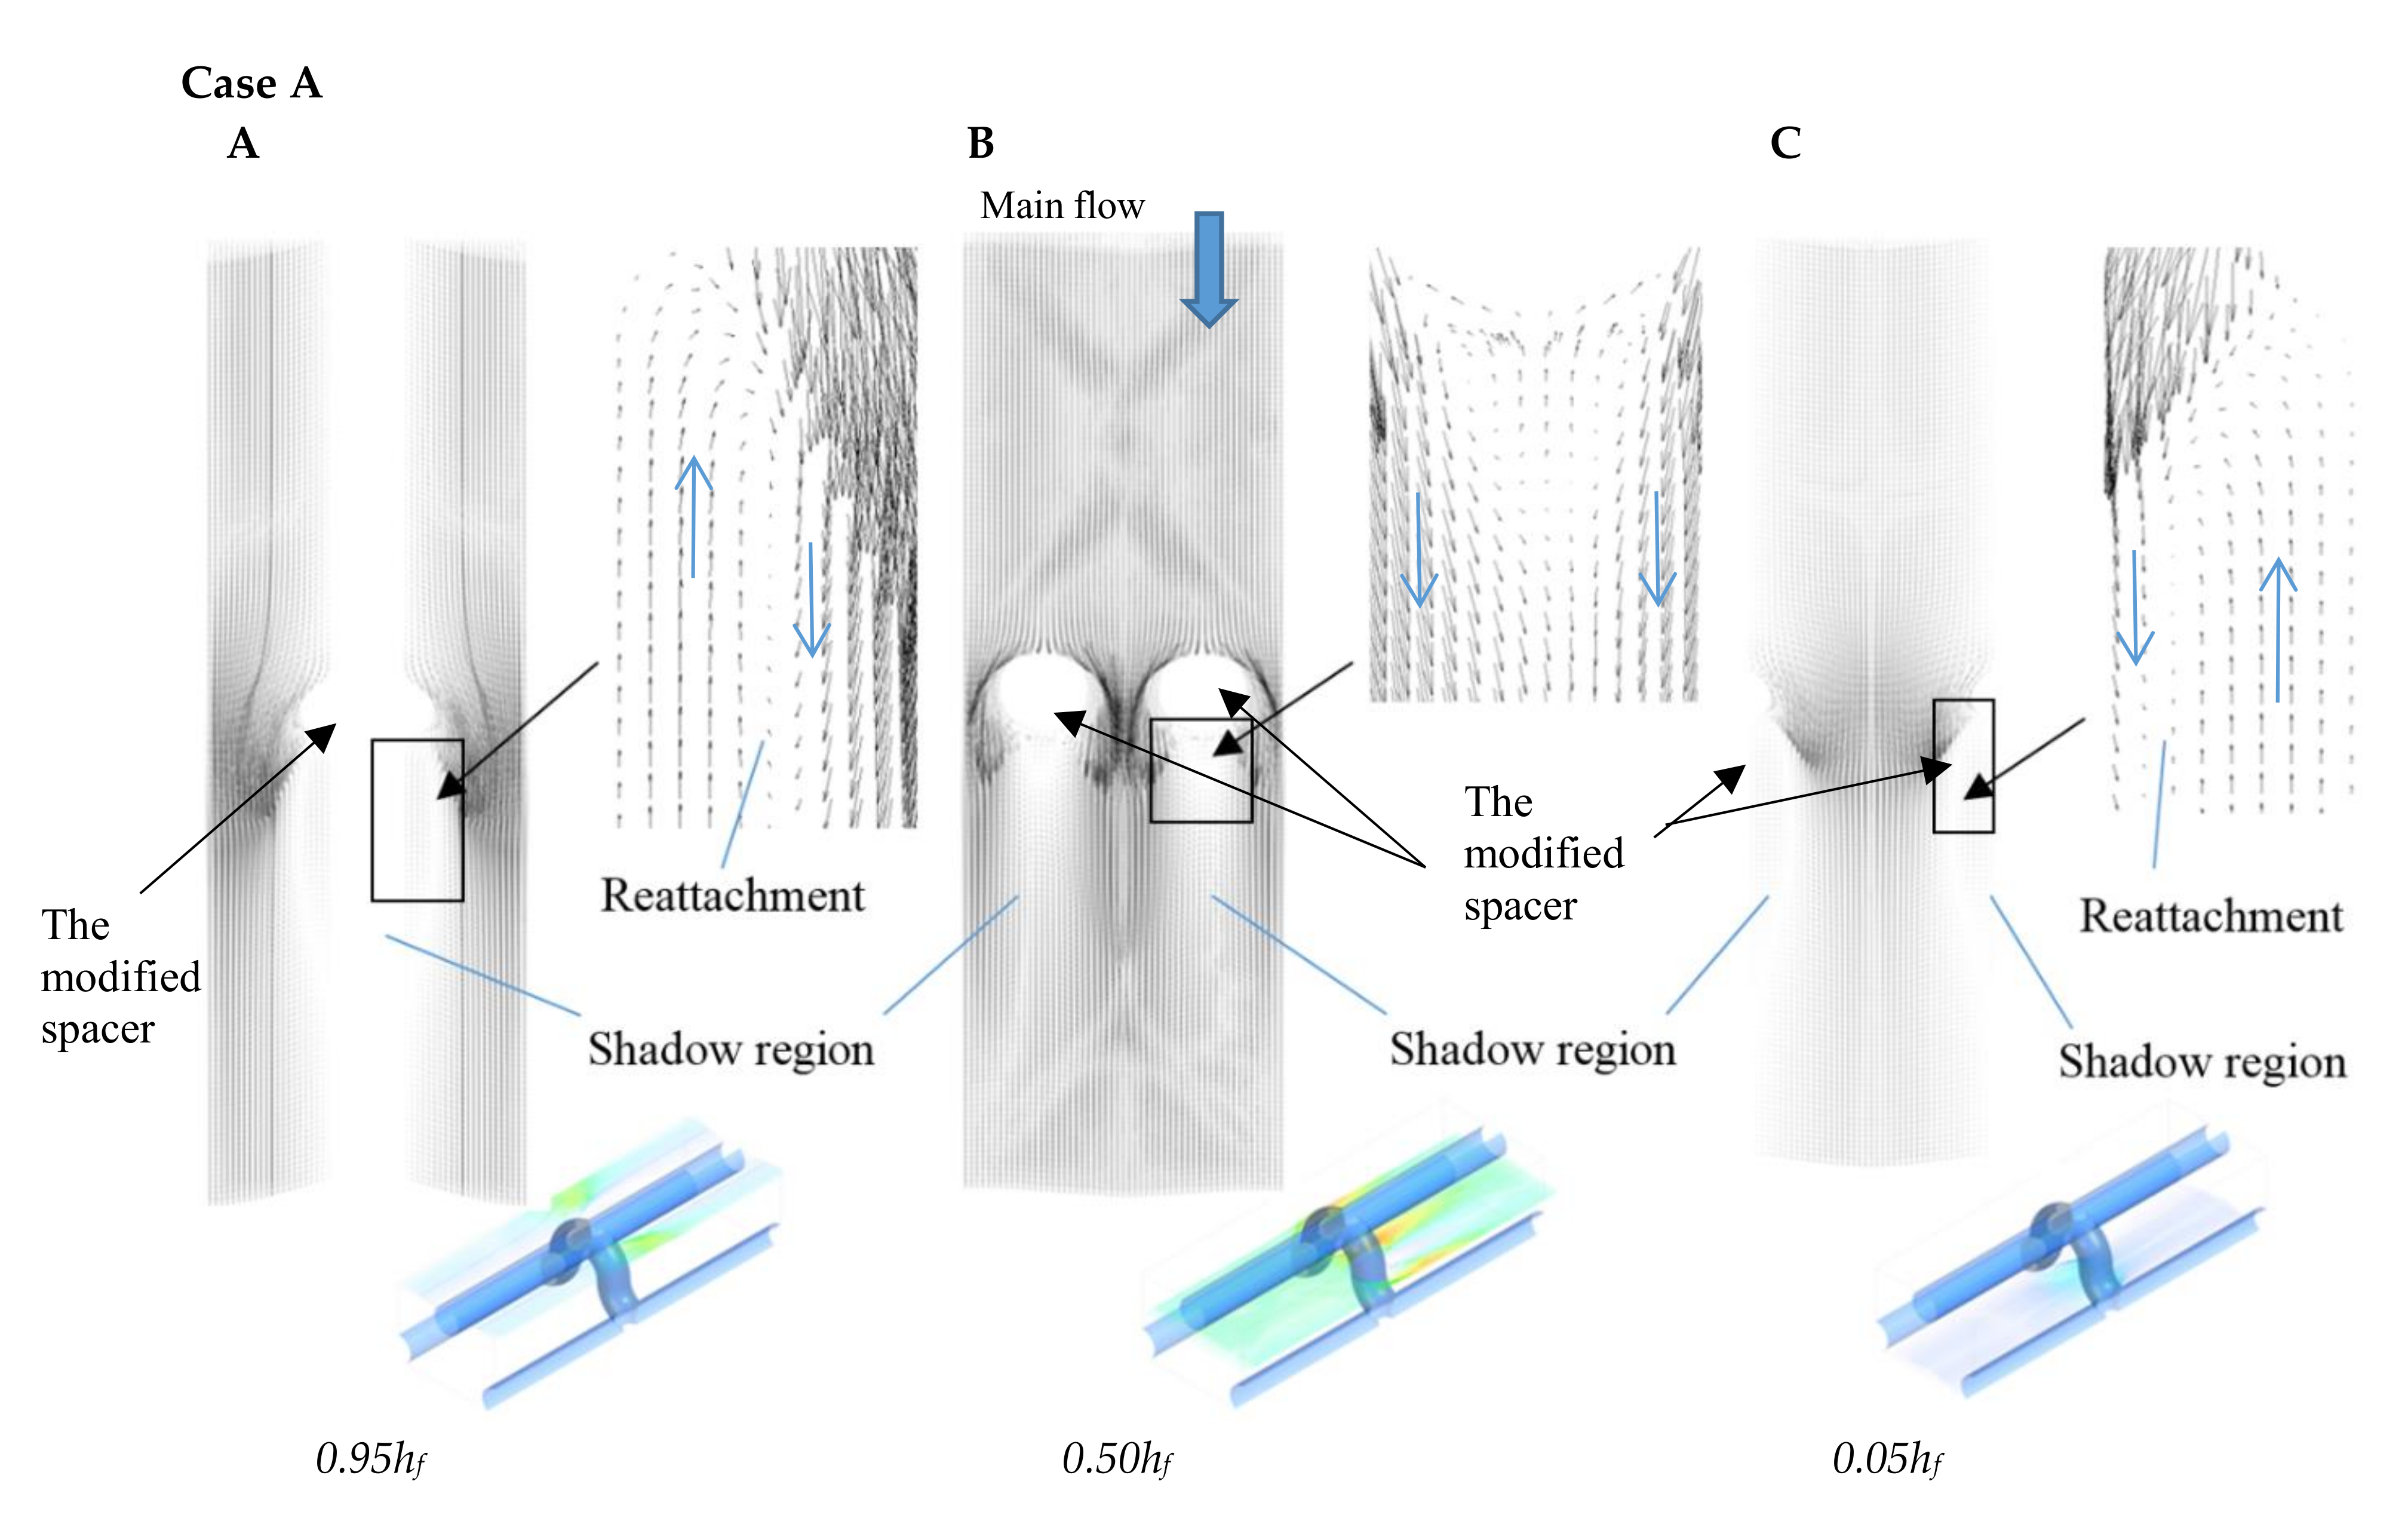
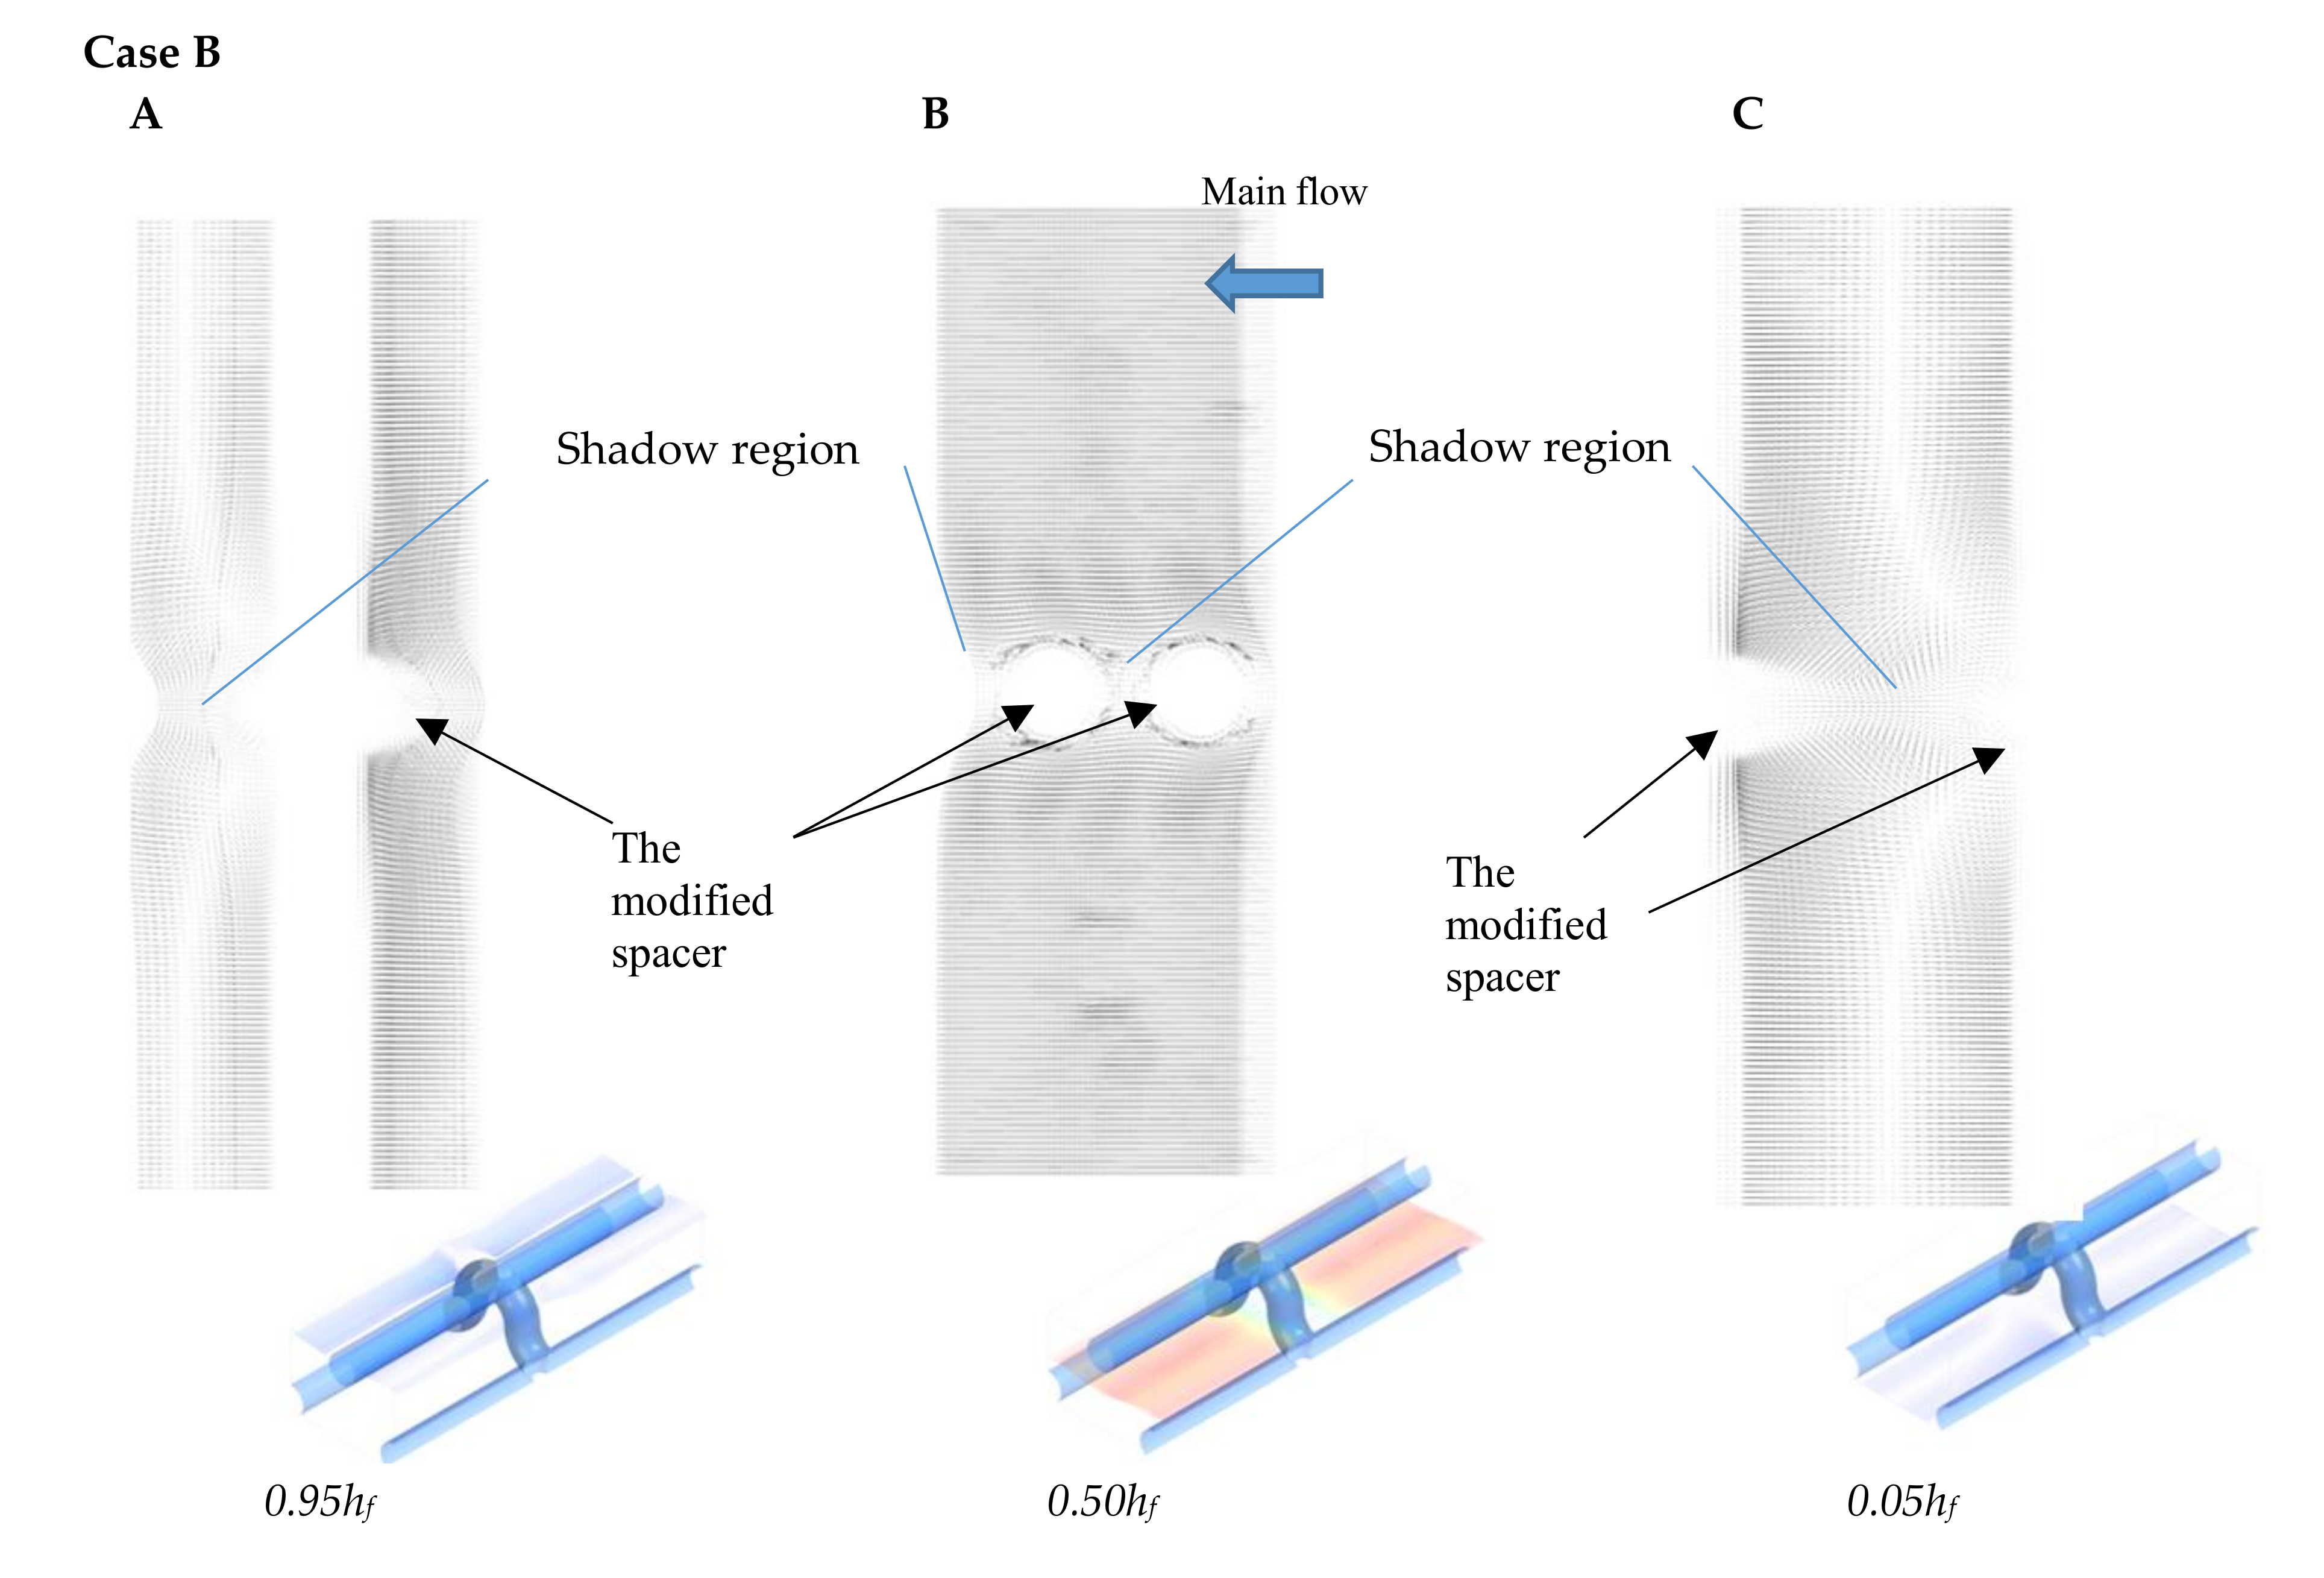
As shown in Figure 2, the main flow direction was normal to the arched filaments (Case A), and for the comparison of vortex induction, the main flow was set as normal to the zigzag filaments (Case B). It is recognized that the model of CFD simulation is defined by the value of the Reynolds number. For identifying the flow regime, Ranade et al. reported that in most of the spacer-filled channel, the transition from a laminar to turbulent flow regime occurs at Reynolds numbers from 300 to 400 for packed beds [8]. In the study by Shakaib et al., the simulation for the onset of unsteady flow takes Reynolds number from 100 to 300 [9]. Haaksman et al. observed differences in experimental and model results when the Reynolds number was from 125 to 200 [10]. In the current study, the Reynolds number was from 8 to 150. On the membrane surface, velocity is equal to zero, according to basic fluid theory. In order to clarify flow pattern near the membrane, 0.05hf and 0.95hf positions were selected. In addition, 0.50hf was selected to interpret vortex shedding in the middle of the feed channel.
Enhancing the efficiency of the membrane module to mitigate fouling is extremely dependent on increasing shear stress at the membrane surface, which is related to the efficacy of the spacers to increase mass transport back to the bulk flow [11]. Wall shear stress, τ, is indicated by the relationship of velocity shear rate: τ = μdu/dy. In this study, wall shear stress simulations for different spacer porosity or element length were considered through comparison of shear stress contours and application of the modified friction factor.
2.2. Model Description
2.2.1. Computational Domain
The middle region was chosen as the study region, for the sake of simplicity. An area of an arched filament was in the center of the study region in order to clarify the flow pattern surrounding the filament. In most RO applications, the permeation velocity has no significant effect on the flow structure in the channel, and in industrial membrane processes, the permeate rate is no more than 0.5% of the total cross-flow velocity in the feed channel [12]; for this reason, the membrane and feed spacer surfaces were set as the no-slip boundary condition, the assumption of the nonpermeable wall was adopted, and the velocity of the fluid on the surface was specified as zero in the CFD model. The spacer was explicitly defined as a solid object. The inlet and outlet flow cross sections were set as periodic boundaries [13], and the boundaries between two near elements were set as symmetrical boundaries [14]. The periodic boundary and symmetrical boundary conditions were employed to enable this study to simulate just one cell of the pattern formed by the modified spacer. Furthermore, in order to clarify the flow pattern for the mixing enhancement, the arched filament was set in the center of the unit cell [8]. In the simulations of case A and case B, the boundary settings were opposite: In case A, when the direction of the bulk flow was normal to the arched filament, the inlet and outlet boundaries were set as period boundaries and modules’ connecting boundaries was set as symmetry boundaries. In case B, when the direction of the bulk flow was normal to the zigzag filament, the boundary setting was opposite to that in case A, as detailed in Figure 3. Considering the scope of the Reynolds number, the standard laminar model was applied following the recommendation in the literature [15] for simulating flows at Reynolds numbers below 150 in a laminar flow regime through a continuous solution. To simplify the simulation, the fluid was assumed to be Newtonian and incompressible at steady state (i.e., no time variations), and no salt source was considered.
2.2.2. Simulation of Flow Patterns
The flow of a Newtonian fluid in the spacer-filled channel is modelled by Navier–Stokes and continuity equations. Simulation equations are listed below.
The channel porosity is:
where VSpacer is the spacer volume and VTotal is the channel space volume in which the mean flow was separated. The hydraulic channel Reynolds number [16] is:
where ρ is the water’s density. Uave is the average velocity, which was known as the effective velocity in a previous study [17]. Uave is calculated by dividing the superficial velocity (for the empty channel) by the porosity (Uave = Usup/ε). μ is the water’s kinematic viscosity. The channel hydraulic diameter, as a geometrical parameter, can be defined as follows for the spacer-filled channel [16]:
where computational volume is the total volume of the element cell. Wet surface area was included in the surface of the spacer and membrane. Pressure drop can be expressed via the friction factor [18]:
where ΔP is the pressure drop in the channel and ΔL is the element length.
The dimensionless power number [19] is calculated as follows:
Salt rejection of the RO membrane increases with pressure and decreases with salt concentration. In the study by Song et al., their results indicated that the salt concentrations in the regions adjacent to transverse filaments are very much higher than others [20]. Shear stress, as a key parameter, is defined by the velocity gradient, given that the shear stress on the membrane surface is believed to lower concentration polarization and enhance mass transfer. The modified friction factor employed to select the best feed spacer for mass transfer efficiency was used as a means to analyze shear stress on the membrane for comparing the results of four groups with different element length data (L/D = 8, 10, 12, and 14) [21].
The modified friction factor for the area average shear stress is represented as [21]:
where τwall is the average shear stress on the membrane surface.
2.2.3. Model Solution
Navier–Stokes equations were solved in ANSYS-CFX (v18.1, ANSYS, Inc. Cecil Township, PA, USA. www.ansys.com) with the finite volume method on the hex mesh generated by the ANSYS-CFX automatic mesh generator. Hex Dominant was applied as the main definition method. According to the literature, the use of hexahedral mesh leads to results being more reliable and closer to the experimental data [8,9,22], since the perfect hexahedral mesh helps to remove the adverse effects of mesh quality variation on different partitions, such as in this study. Gurreri et al. used the same mesh setting in their CFX simulation [23]. The mesh was refined near the membrane surface for the boundary layer simulation and the mesh was expanded smoothly away from the membrane. Various mesh sizes varied from 322,921 to 428,217 min nodes for different cases. The near-wall node on the membrane was at the distance of 0.2 mm. The thickness of the first mesh element layer was 2.5 μm, i.e., below 1% of the channel height [24]. The mesh independence of the solution was checked to make sure that there were sufficient cells in the boundary layer. As indicated in Figure 4, no significant changes were recorded while meshing the domain with smaller cells. Moreover, the changes of the friction factor were less than 1% [25,26].
3. Results and Discussion
3.1. Flow Pattern and Shear Stress Distribution
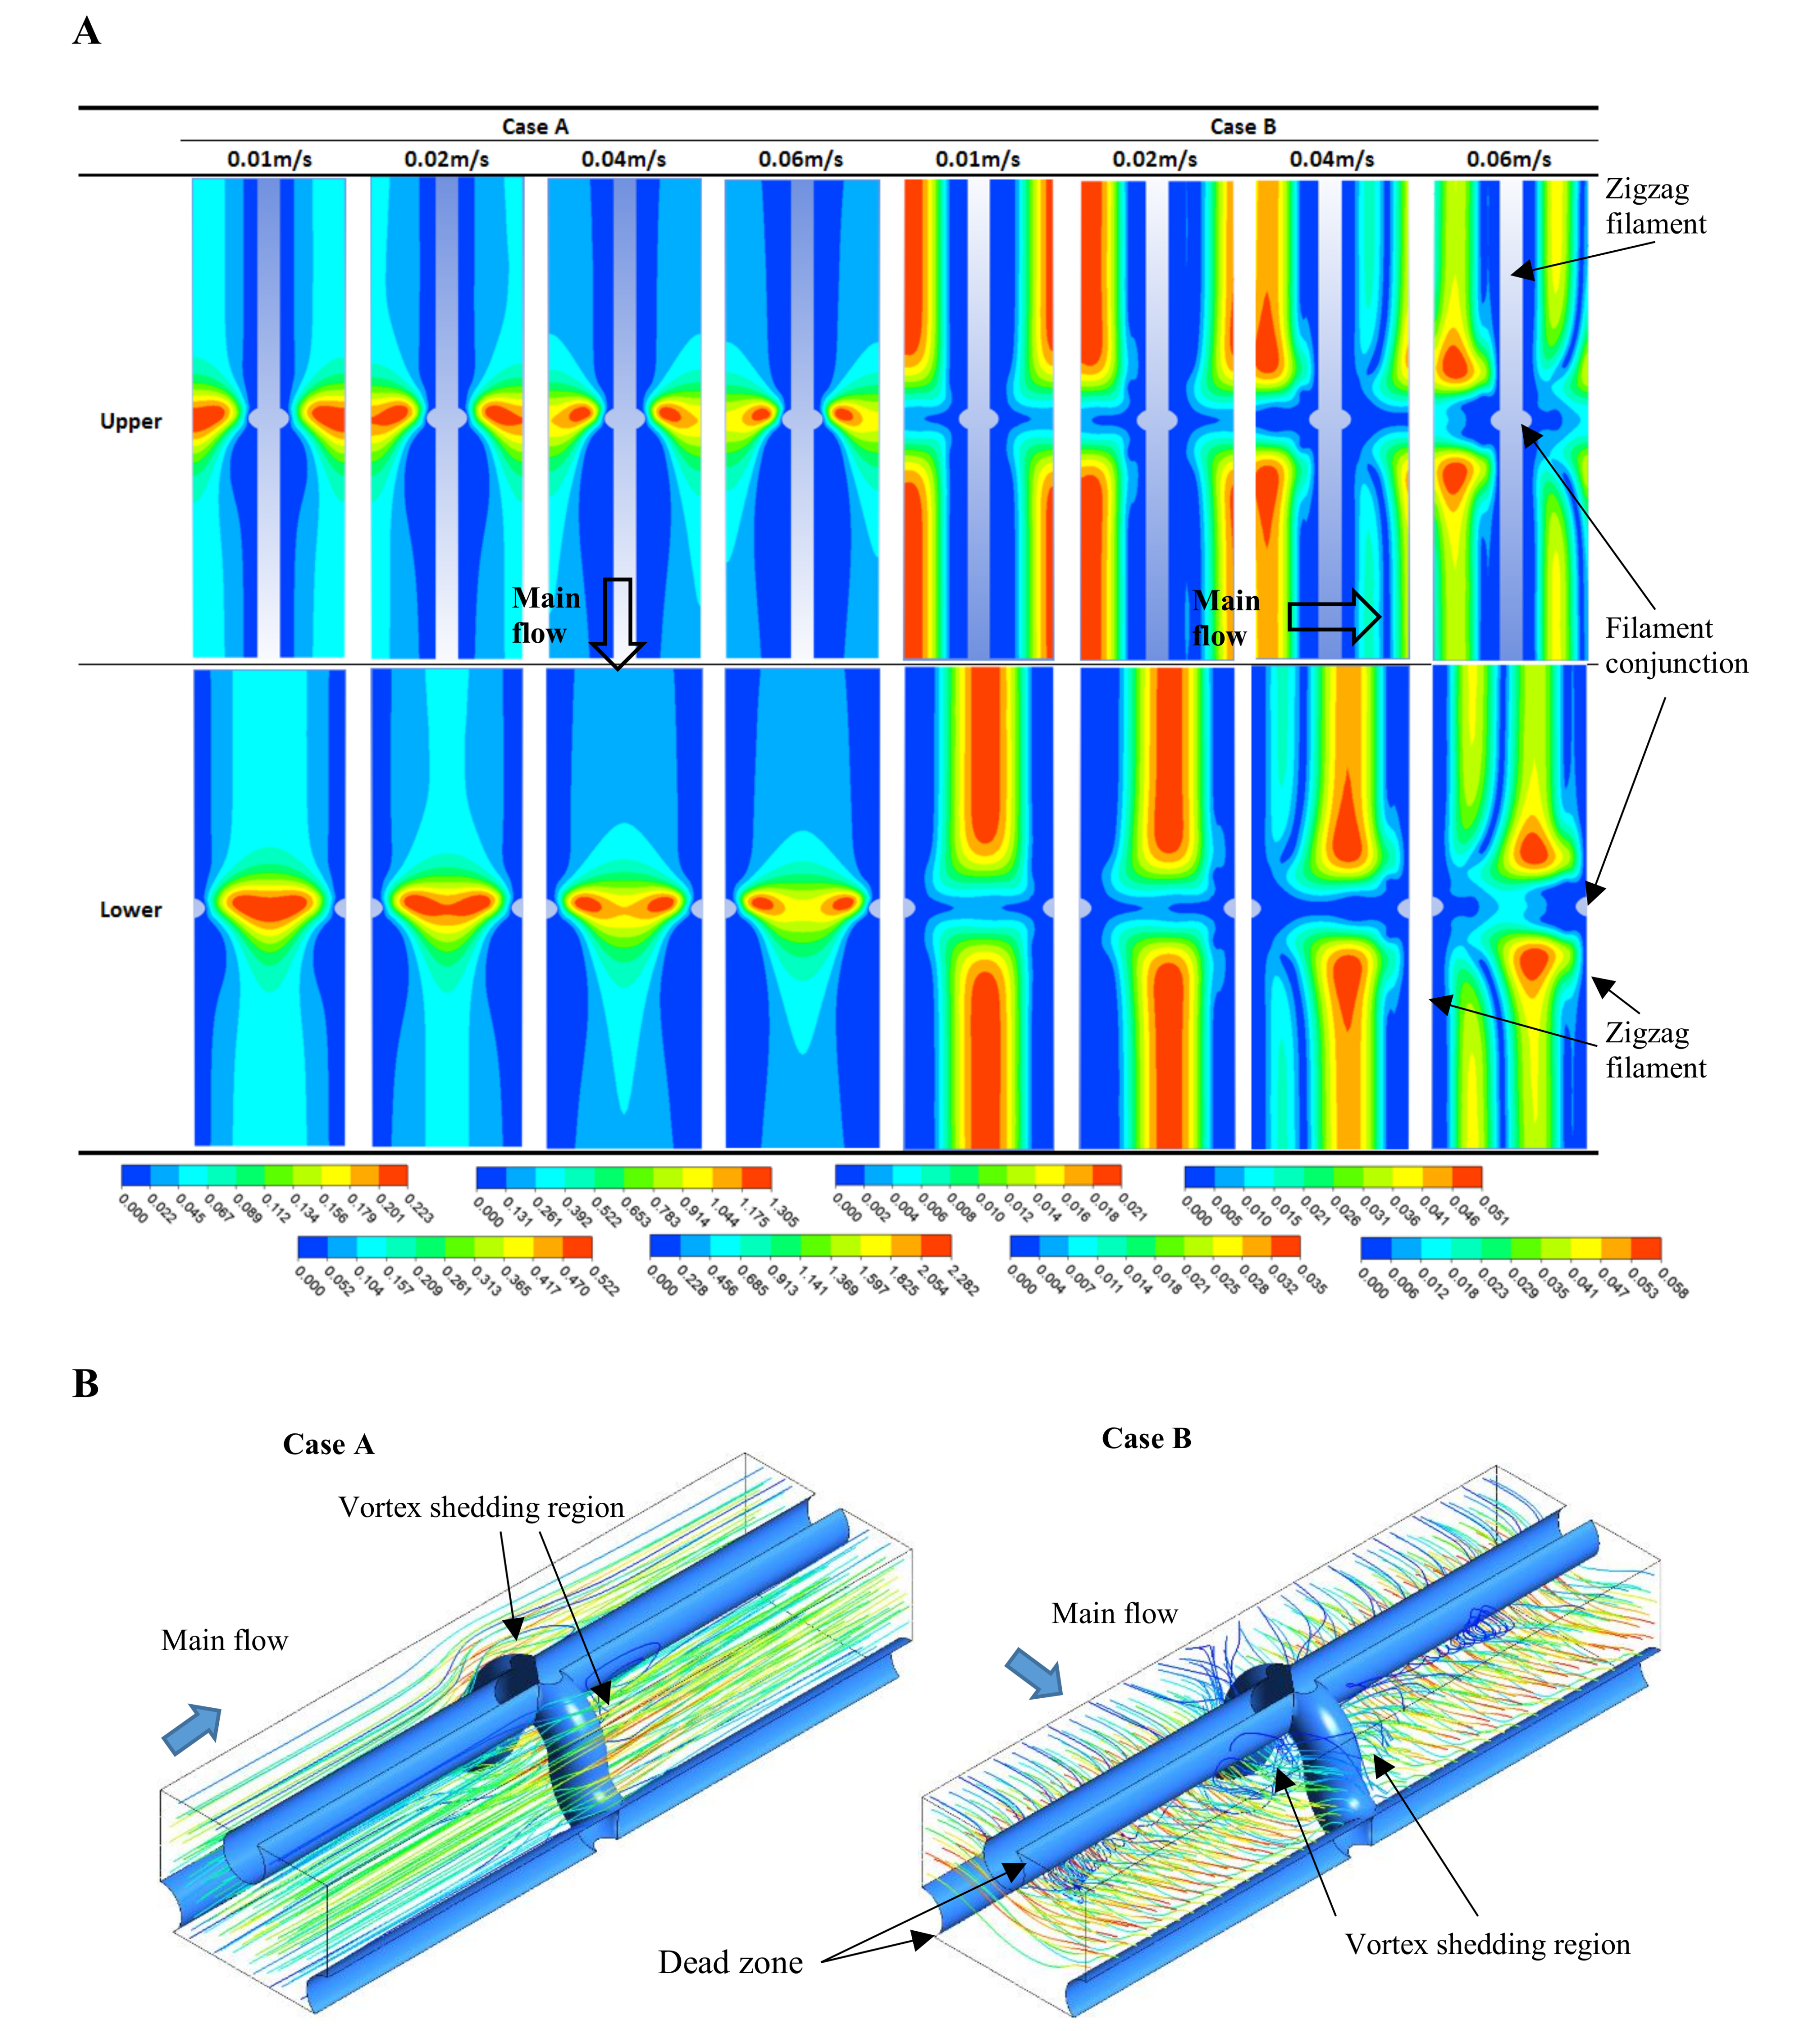
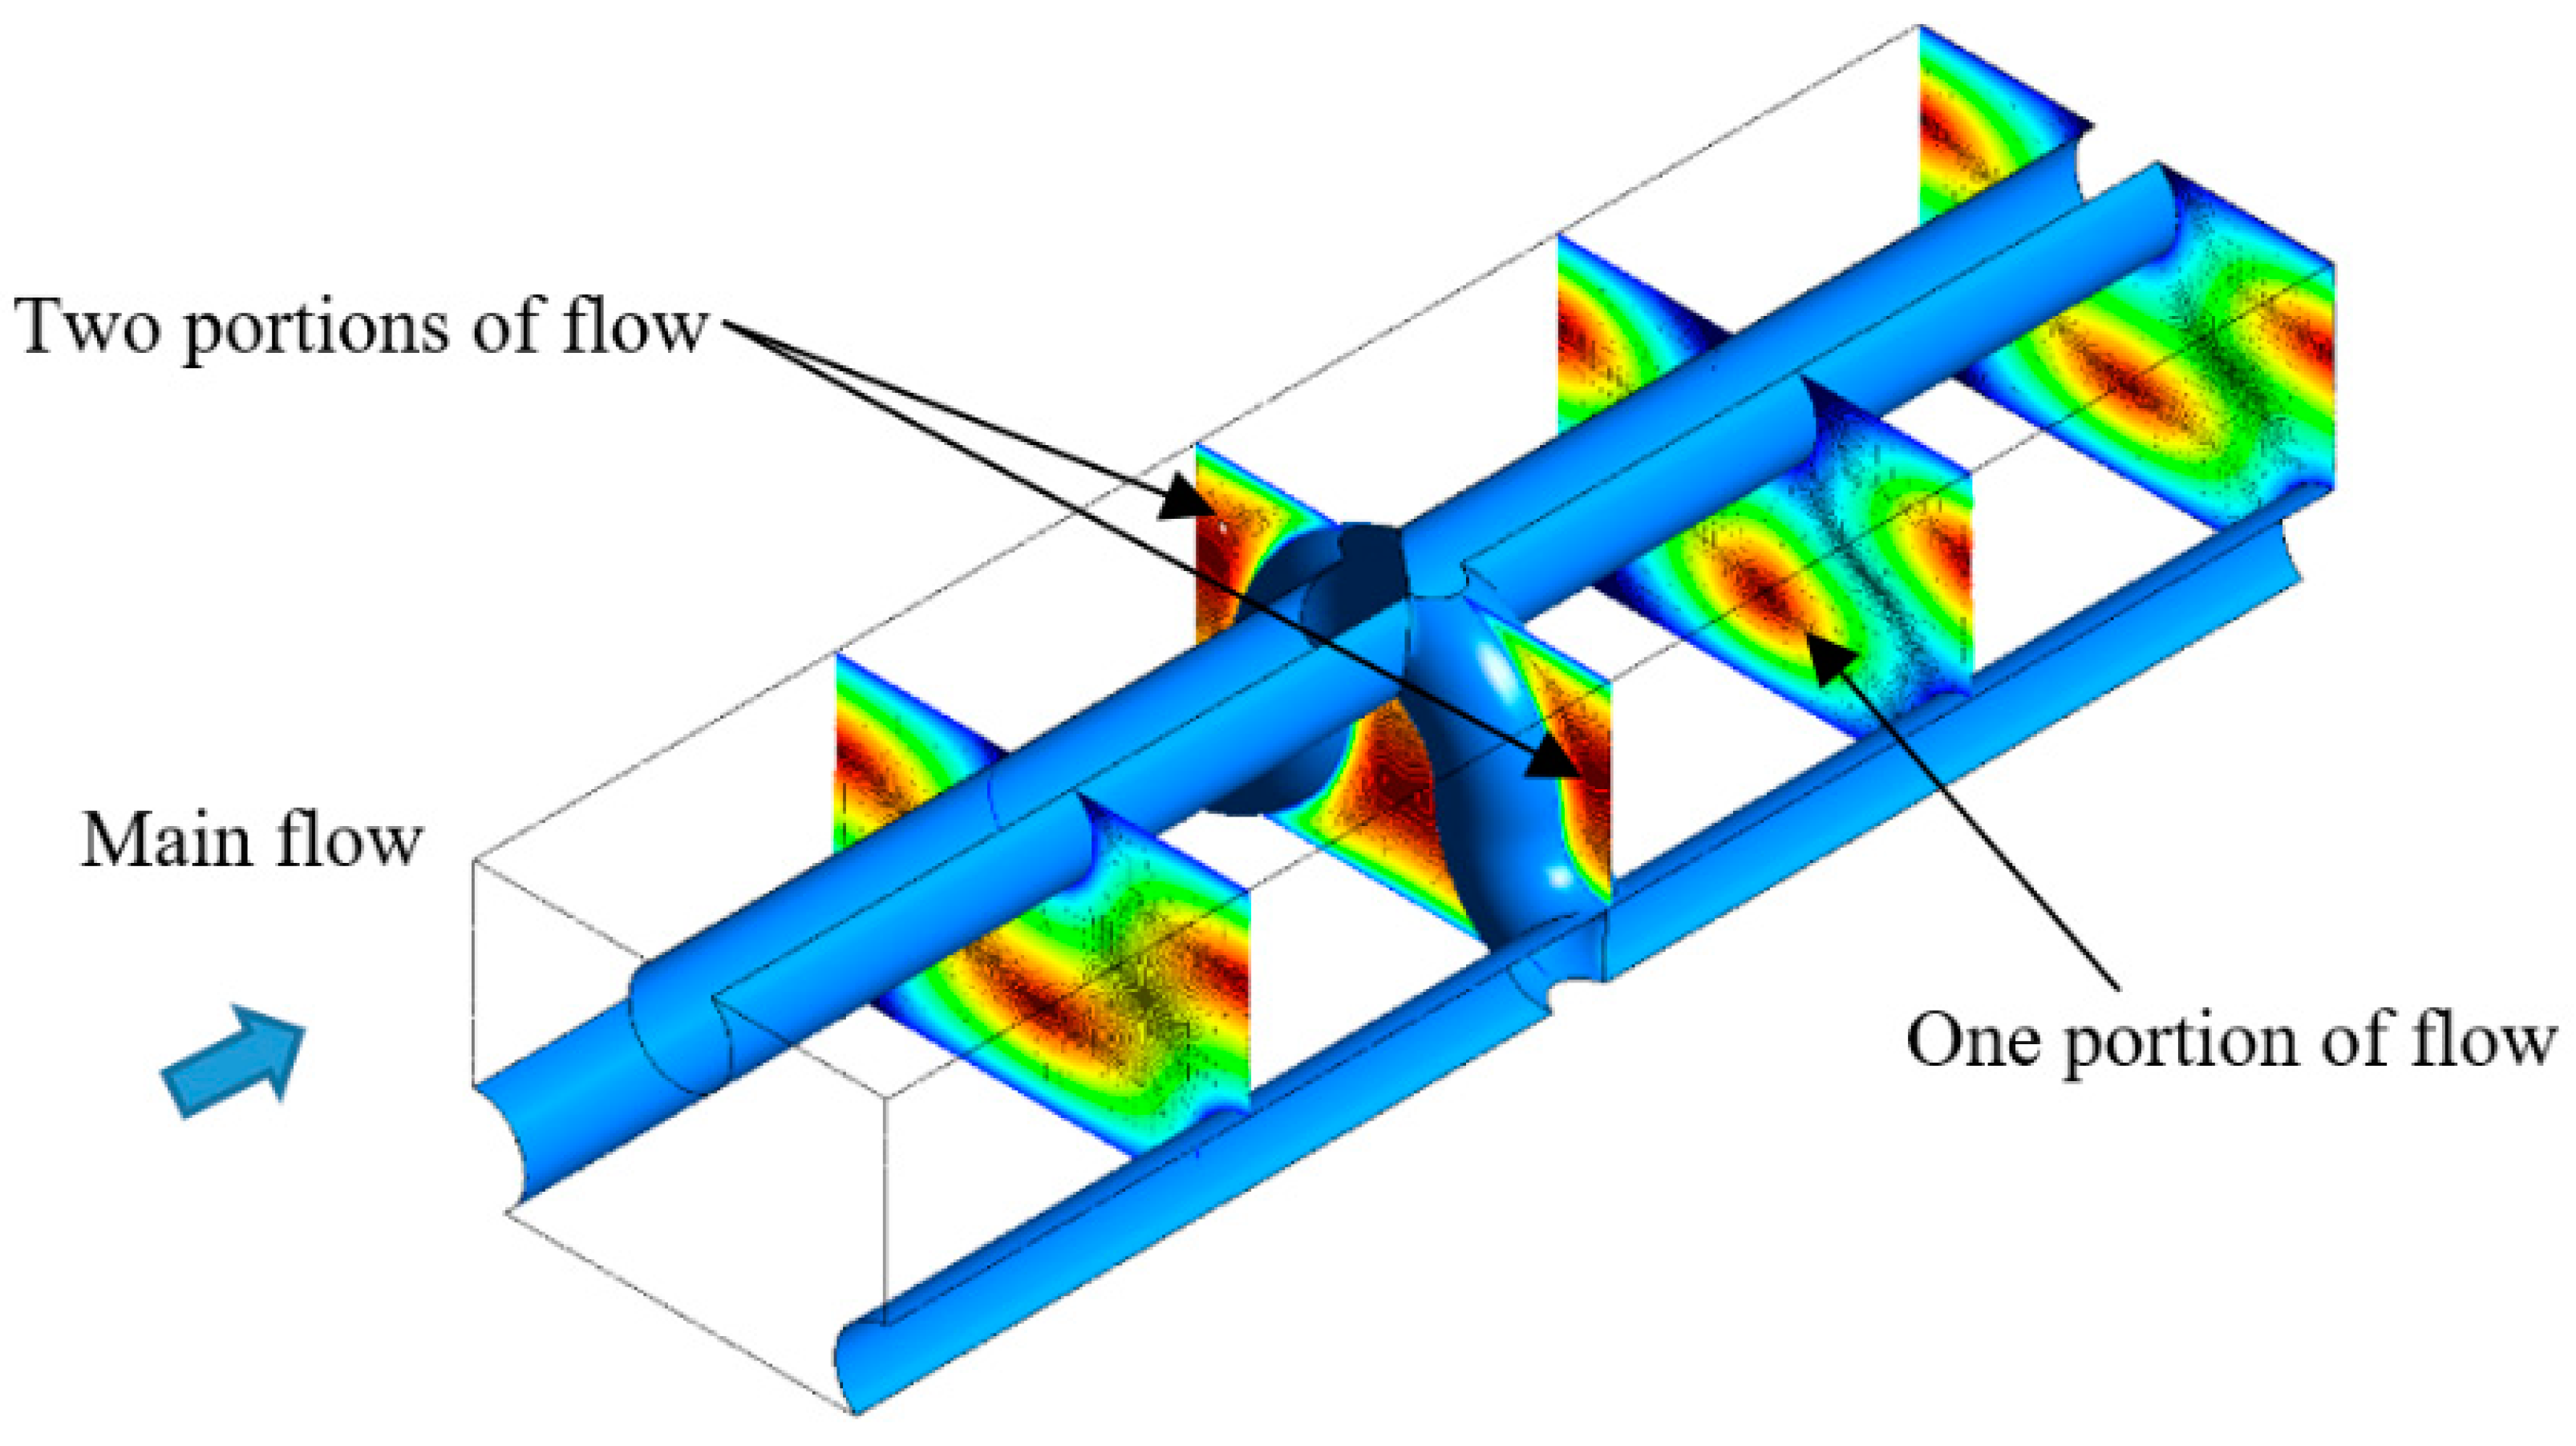
In the present study, the laminar model has been used, the Reynolds number was up to 150, and the filament spacing was L/D = 8, 10, 12, and 14. With the purpose of comparing with a commercial spacer, four different flow rates were relayed, with superficial inlet velocities of 0.01 m s−1, 0.02 m s−1, 0.04 m s−1, and 0.06 m s−1 for the situation where the main flow was normal to the arched filament (when the main flow is vertical to the zigzag filament, the same flow rate was applied, respectively) in the running of the CFD simulation. Through periodic cross-section setting, a fully developed flow can be obtained. In Figure 5A, the variation of shear stress on the upper and lower membrane surface is shown by a contour plot. Figure 6 shows the velocity vector of the planes in the middle of the channel and in the vicinity of the membranes, for which the position height of the selected planes were 0.05, 0.50, and 0.95 of the channel height for each of case A and case B. In Figure 5A, three parts of the figure are used to delve into the flow pattern in case A and case B: The middle lower small figure is the location of the selected plane in the unit cell, the left figure is the velocity vector of the selected plane, and the right top small figure is the enlargement of part of the image of the left figure in case A. Furthermore, in Figure 5A and Figure 6, the value ranges of shear stress and velocity used the default ranges in the CFX-post to clarify the difference for qualitative analysis. The shear stress distribution is closely related to the velocity field, thus Figure 5A and Figure 6 were discussed together. Being beneficial for comparing case A and case B, the ratio, L/D = 12, was selected for featuring apparently. The mixing enhancement was shown in this subsection by flow (reverse flow, reflecting flow, and difference of velocity) and shear stress (shear stress distribution and control area).
For Figure 5A upper, the vertical blank in the middle of the contour was the region in which the zigzag filament connected with the membrane surface. From the streamline shown in Figure 5B, in case B, the main flow cannot reach the zone behind the zigzag filament, hence this corner was called the dead zone, which is mentioned in some conventional woven spacer or nonwoven spacer studies [27,28]. However, for case A, the main flow can flush it directly. The small region in the center of the contour was the conjunction in which the arched filament connects with the zigzag filament. The red contour (maximum value of shear stress) near the conjunction was above the narrow spacer between the membrane and arched filament. For case A (Figure 5B), the region in which the zigzag filament connected with the membrane surface was located at the vertical boundary of the contour, shown in Figure 5A. The region was the same as that in the middle vertical region of the contour plot for case A because of the model’s simulation of the symmetrical boundary setting. According to these settings, the left half of the region in the upper diagram was same as the right half of the region in the lower diagram, and the right half of the region in the upper diagram was same as the left half of the region in the lower diagram. For case B’s upper and lower diagrams, the shear stress contour obeyed the same settings.
In case A, the flow can be divided into two portions in the present unit cell: One portion of the flow is in the middle of the arched filament, which was between the arched filament and the lower membrane; another portion of the flow is the symmetrical flow between the arched filament and the upper membrane, pointed out in Figure 6. Two vortex-shedding regions behind the arched filament were caused by the separation of the flow into two portions and their combining back together at the region near the conjunction of the arched filament and zigzag filament (Figure 5B). As the streamline of velocity shows in Figure 5B, the flow continually flushed the dead zone in the vicinity of the region in which the zigzag filament connects with the membrane, forming a line through the two portions of the bulk flow. In Figure 7, case A, the right top small enlarged figures of 0.05hf and 0.95hf show the velocity close to the filament connecting line. This was of benefit to diminish the construction of concentration. In case B, the main flow at the middle of the channel was surrounded by arched filaments, which caused a vortex-shedding region in the arc circle, but for other portions of the flow, was similar with the zigzag configuration of the conventional nonwoven spacer [22,29]. This is the reason why in case B, a lower porosity or longer element length gave more similar flow patterns to those reported by previous studies for conventional spacers [19,30].
In basic hydrodynamic theory, shear stress represents the velocity gradient in the laminar flow, which was applied in a real process. The variation of the velocity value and direction causes the shear stress to change on a solid surface or in the flow regime. In simulations of conventional woven and nonwoven spacers, because of the impact from the boundary layer in the region near the spacer, the velocity is very small. The shear stress in this region, which was defined from the velocity gradient, was similar to zero, but in the center of the unit cell, the shear stress reaches the maximum value due to higher velocity values. Velocity is high for the flow moving through the narrow cross section, so shear stress is higher on the area of the membrane surface that is in the region above or below filaments; Figure 5A shows the regions of higher shear stress in red color. In Figure 5A, case B shows the details of this inclination, which Lau et al. reported in their 2D study [31]. In case A, at the near region in which the filament was connected with the membrane surface, velocity was higher and shear stress reached the maximum value. In the region near the zigzag filament connected with the membrane surface, velocity was the lowest value and shear stress reached the minimum value. In case B, on the upper membrane in the region near the top filament where the line connects with the membrane surface, shear stress was equal to zero, as shown in the middle of the figure, and in the region of the left and right sides of the figure above the bottom filament, velocity was higher and shear stress reached the maximum value. On the lower membrane in the two regions that were near the two bottom filaments at the left and right sides of the figure, shear stress was equal to zero, and for the middle of the figure below the top filament, velocity was higher and shear stress reached the maximum value. From the symmetrical boundary setting mentioned in the ‘Materials and Methods’ section, the shear stress distribution on the upper membrane and lower membrane had the same description from different angles. Compared with case B, in case A, the area of low shear stress was smaller. With increasing inlet velocity, the area of the region surrounding the minimum value of shear stress was enhanced, and the area of the region surrounding the maximum value of shear stress was decreased. Shear stress, which increased with velocity, extended to the region near the filaments (in case B, this region was the dead zone indicated by prior studies). The control area was applied to clarify the distribution of shear stress, as shown in Figure 5A, and the absolute value of shear stress can be checked using the legends. In Table 1, the ratios of the control area to total membrane area are listed. The control area was the area dominated by the value of shear stress, which was lower and higher than 10% maximum shear stress and 90% maximum shear stress, respectively, for L/D = 12. In case A, the ratio of low shear stress increased with increasing inlet velocity, but in case B, the ratio of low shear stress decreased with increasing inlet velocity. Laminar vortex shedding was one of the instabilities indicated in the study by Fibres-Weihs et al. [17]. Koutsou et al. focused on the periodic array of cylindrical turbulence promoters in a plane channel, and their result showed that when the cylinder is inserted in the middle of the channel, the flow becomes unstable, with Reynolds numbers beyond 60 [13]. Arched filaments from the upper membrane to the lower membrane were in the middle of the channel, and the Reynolds numbers were in the laminar flow range. The hydrodynamic boundary layer, which is closely related with permeate flux and fouling processes, was considered for the effect of the instability. In this study, laminar vortex shedding was detailed in Figure 7; for case A (A and C), it is shown that near the connecting region of the filament joined to the membrane surface, there was a larger affected zone in the downflow of the feed solution. In the two enlarged images in Figure 7, between the two flow directions—upward direction and downward direction—there are small arrows, which represent the reflected flow prevented from reattaching to the membrane surface because when the main flow was surrounding the arched filament, the flow direction had a vertical inclination. One portion of the flow was reflected back after striking the membrane surface. The small enlarged images for 0.05hf and 0.95hf point out the flow reattachment clearly. In Figure 7, case A (B), two vortex-shedding zones were developed behind the arched filament in the middle of the feed channel and the flow direction was reversed. From the different vortex-shedding areas in Figure 6, case A (A), (B), and (C), the 3D vortex-shedding zone behind the arched filament was extrapolated. This 3D zone was from two boundary layers near the membrane and from across the middle main flow zone. The region between the arched filaments was a narrow cross section of the feed flow, and velocity in this region was higher. For this kind of situation, a steeper velocity gradient between the low velocity in the shadow region and the high velocity in the narrowly arched filament region was caused. This flow pattern created by the arched filament directly enhanced mixing. Figure 7 showed the same inclination in case B, but compared with case A, the affected region behind the filament was smaller.
3.2. Validation of Modified Spacer Simulation
3.2.1. Friction Factor
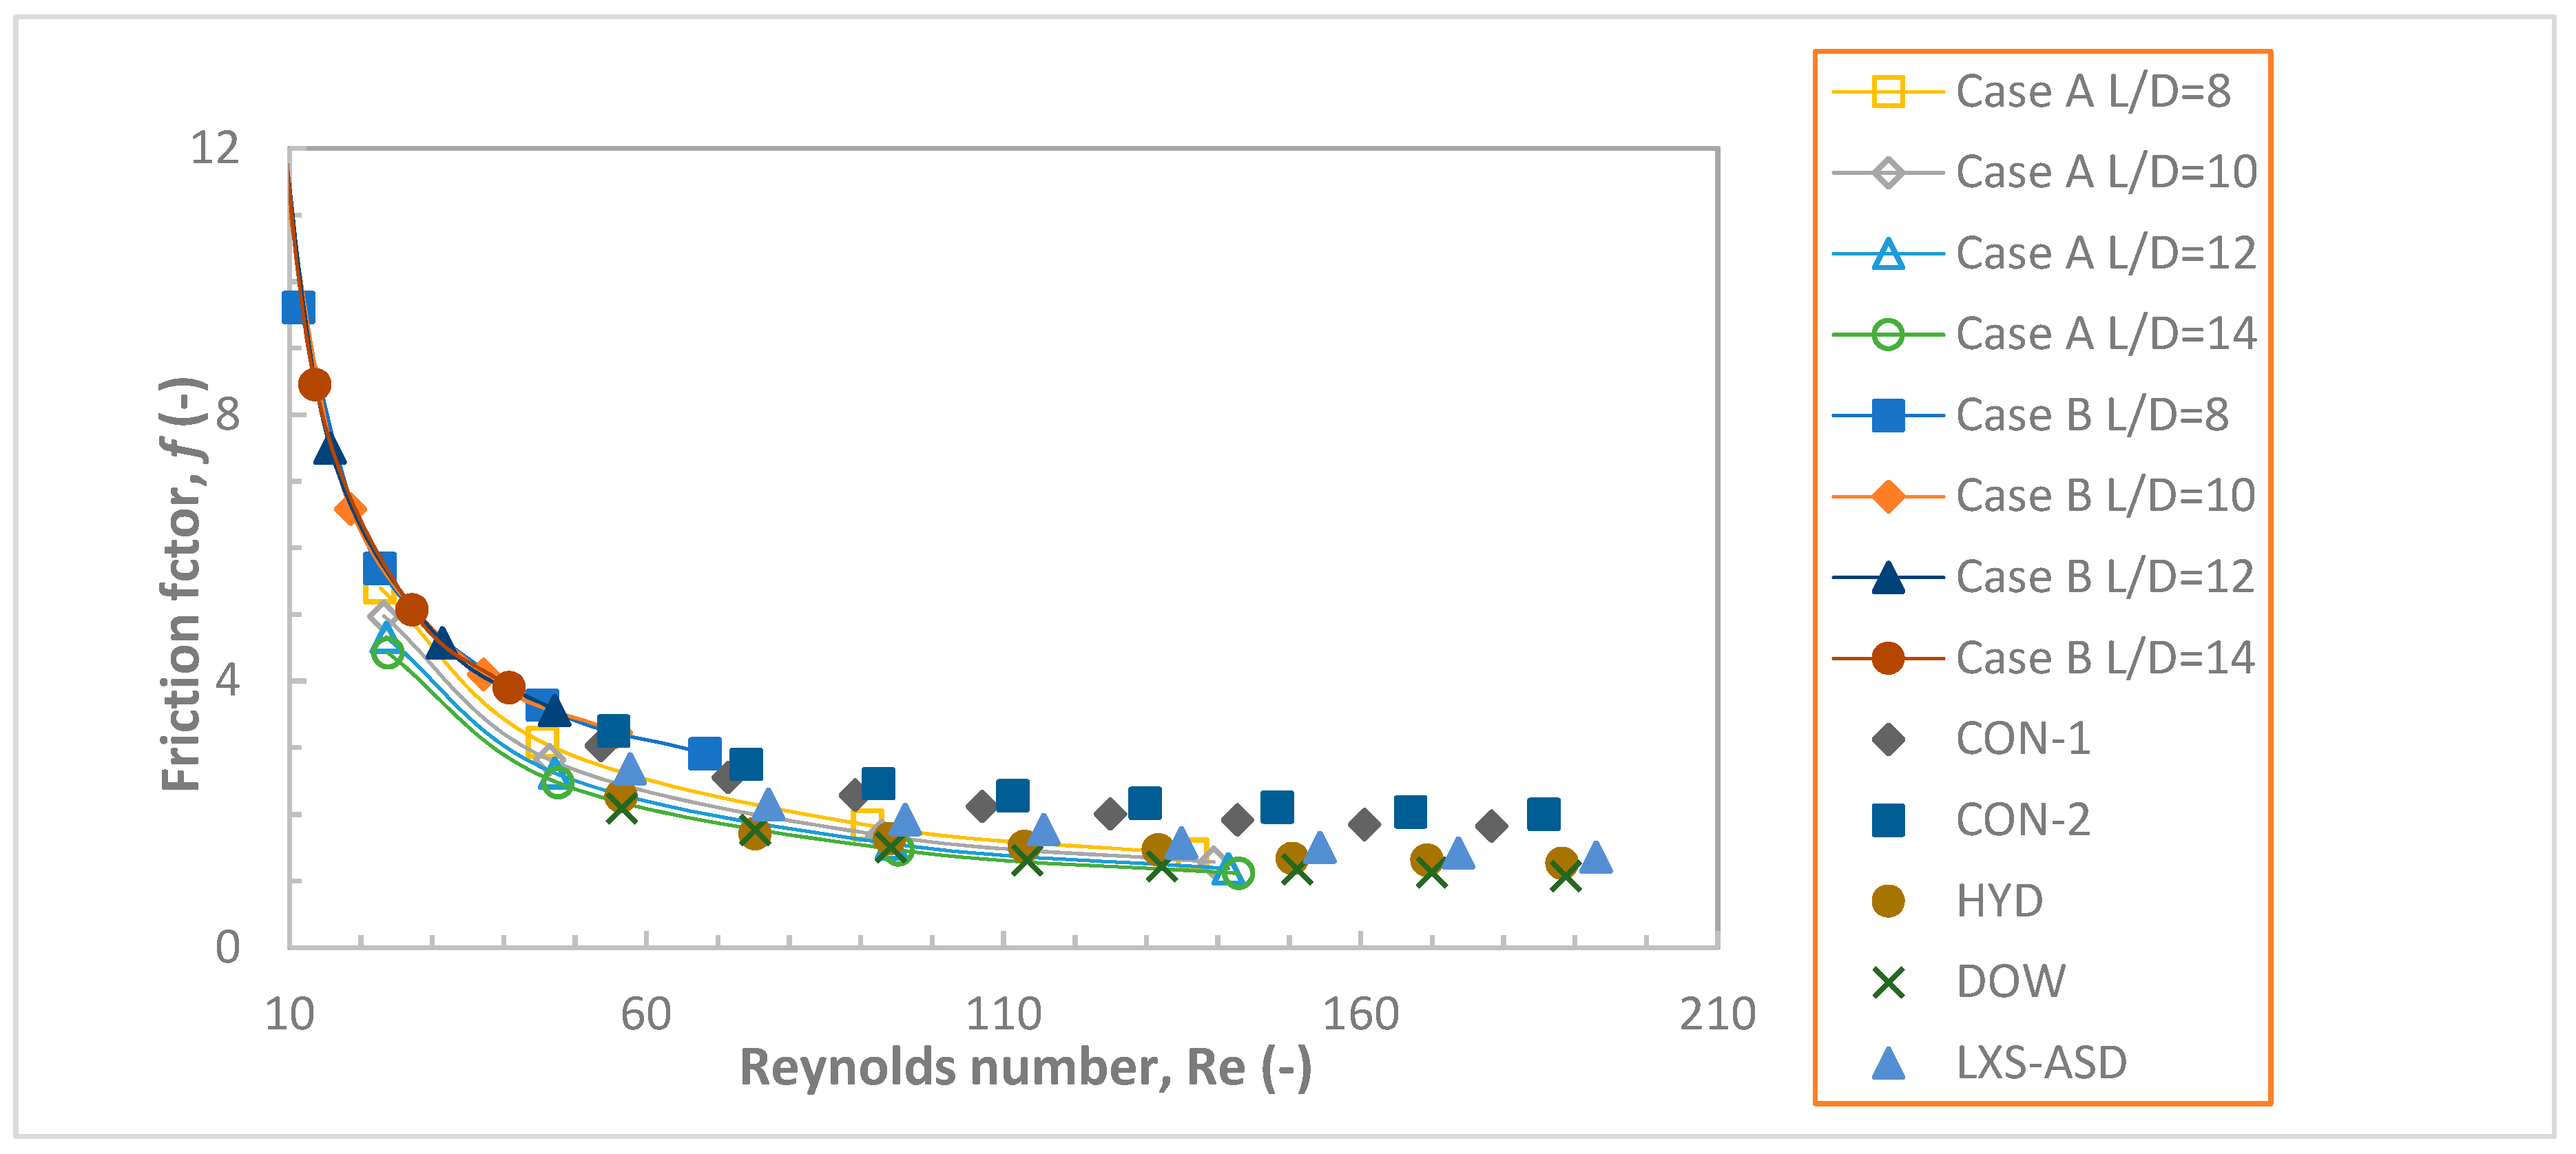
Figure 8 indicates the general agreement on the inclination of the friction factor to decrease with an increasing Reynolds number, as shown in the present study [32]. Five kinds of commercial spacers from the study by Haaksman et al. were added for comparison, which were available from Conwed Plastics (Minneapolis, MN, USA), Hydranautics (Oceanside, CA, USA), DOW Chemical (Midland, MI, USA), and Lanxess AG (Cologne, Germany), and were surveyed by the accurate 3D geometry obtained from X-ray computed tomography scans [10]. CON-2 produced the maximum value, and the DOW spacer gave the minimum value. For case B, the difference of the friction factor results between the four groups of different L/D ratios was small; however, the values were almost similar to that of CON-2. The value of case A L/D = 14 was lower than for DOW. The same mass flow rate was applied in case A and case B and the hydraulic diameter was the same, but the cross section of the feed channel was larger in case B. This is the reason why the two flow directions had two different ranges of Reynolds numbers, and the range of Reynolds numbers was smaller in case B. In the two cases, the cause of differentiated curves was different porosity or element length; a different L/D ratio means different channel porosity. Friction factor values were higher when porosity was lower (element length was lower), but the amplitude became gradually smaller. This inclination was the same as reported in previous studies of feed channel porosity [33,34]. The effect of porosity in case A was higher than in case B due to separate inclination lines or the larger difference. Friction factor was higher in case B; when the main flow was vertical to the zigzag filament, higher pressure loss was caused by the longer transverse filament. This result cannot be detailed quantitatively without the simulation of every part of the spacer structure, which was outside the scope of this study. However, it yielded to the reason that given the same filament thickness for the filament length facing the flow direction, which decided the viscous drag from the spacer zigzag filament, it is longer than the arched filament. Haidari et al. reported that comparing with an empty channel feed spacer, it caused a greater pressure drop [35]. Additionally, based on basic hydrodynamic theory, the difference of pressure loss means a different dead zone behind the spacer filament. The difference of the friction factor in case A was higher than in case B, therefore, the effect from the arched filament on flow characteristics was more significant than that from the zigzag filament. This inclination revealed that having more traverse filaments caused more energy consumption, agreeing with previous studies, and this study’s results on the matter are listed in Table 2 by applying the specific power consumption (SPC) (≡(ΔP/L)Uave, Pa s−1), which indicates the mechanical power consumption dissipated per cubic meter [36]. Through comparison with the study by Haaskmen et al., which was concluded by X-ray computed tomography [10], in case A, the value of the friction factor was smaller than their results and was similar with the HYD result. In case B, the value was a little bit higher than their result and was similar with the CON-2 result when the Reynolds number was close to 60, for which agreement of the value is provided by the study by Koutsou et al. [13].
3.2.2. The Modified Friction Factor
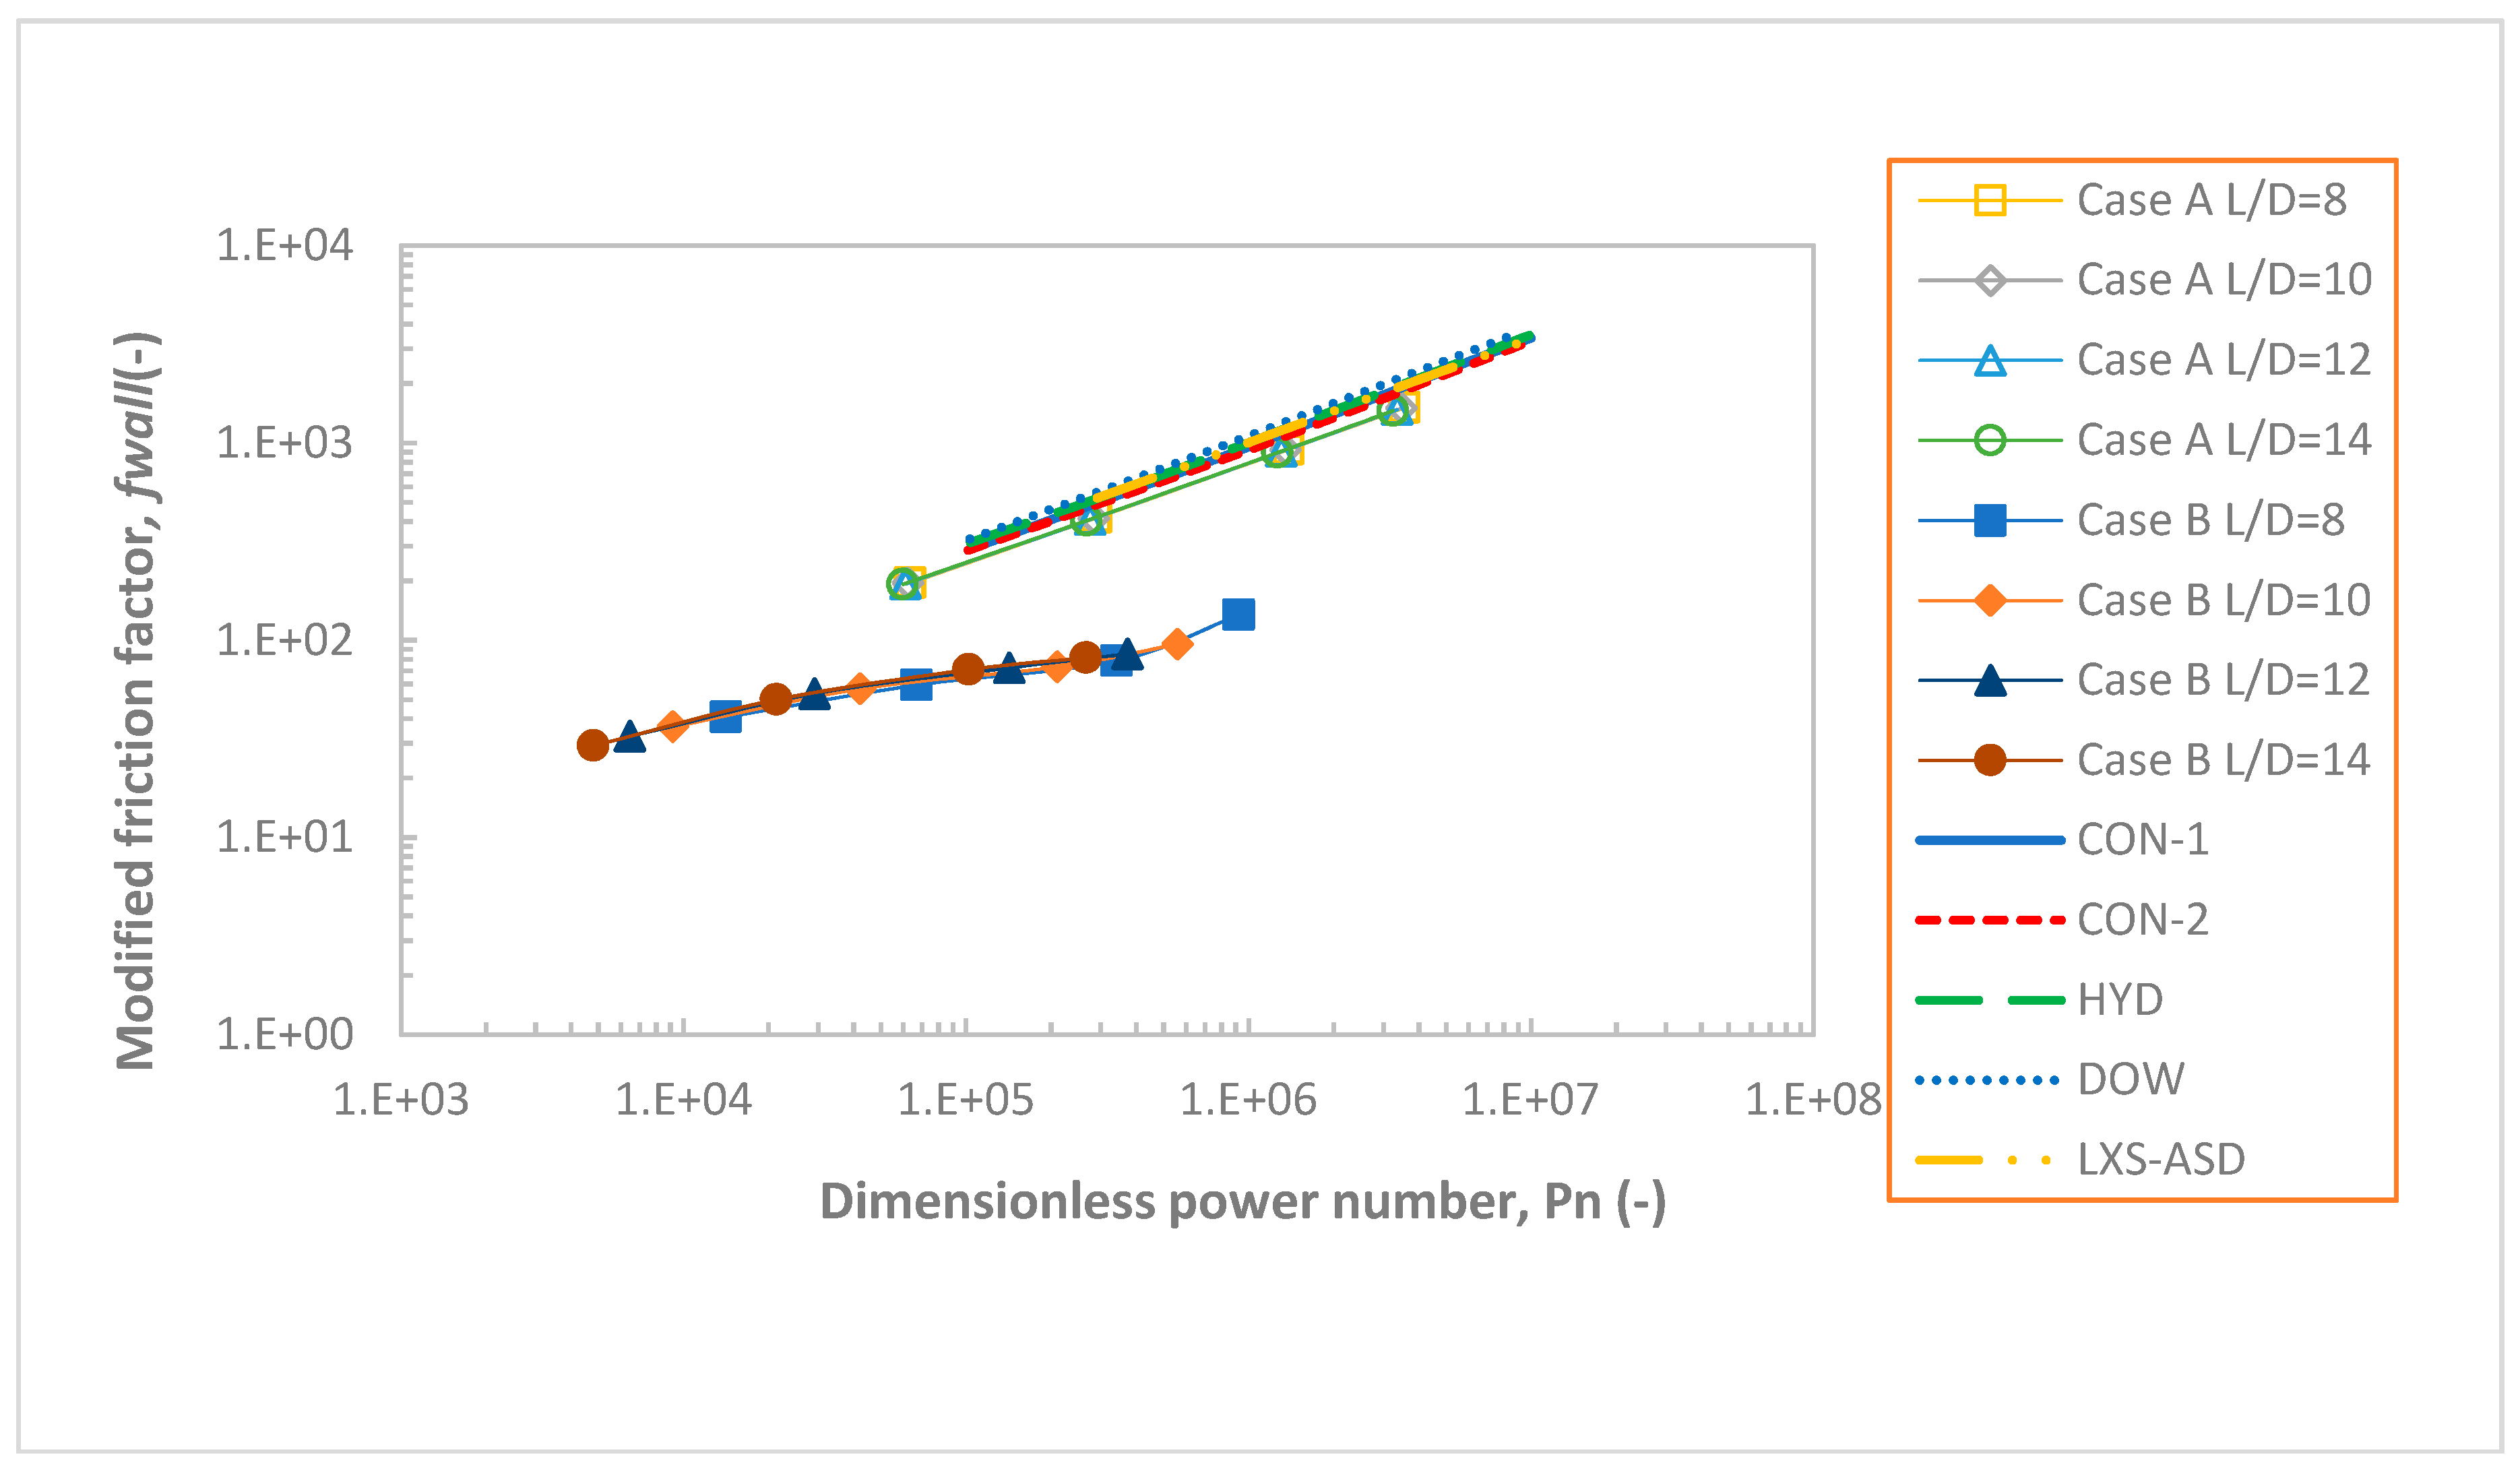
This subsection underlines the average value of shear stress on the upper and lower membrane surfaces after the discussion of shear stress distribution. The numerical dimensionless parameter, by applying the modified friction factor, was employed to enable comparison with previous works and confirm the value in the rational range. Figure 9 shows the comparison with the previous study for a commercial spacer model [10]. In order to compare the values of shear stress with other spacer geometries, the modified friction factor as a dimensionless parameter was computed from the plot shown in Figure 9. As a function of the dimensionless power number, the modified friction factor is shown in Equation (6). The modified friction factor increased with the dimensionless power number in case A and case B. The difference of the modified friction factor was small at the same dimensionless power number, hence the effect of the L/D ratio or porosity on the average shear stress was small. The value of the modified friction factor in case A was higher than in case B. Santos et al. [21] reported the value of the modified friction factor as being a little bit higher than 1000 when the dimensionless power number approached 106. Vicktor et al. had made a similar report, in that when the dimensionless power number is close to 106, the modified friction factor is about 103 [10]. In this study, the modified friction factor had the same increase in inclination as in previous studies. The value of the modified friction factor in case A was fairly accordant with their results. From this comparison, the shear stress distribution was homogenized by the vortex promoted by arched filaments with an increasing Reynolds number. The effect of the zigzag filaments on shear stress distribution was lower than that of the arched filaments. Arched filaments, through the improvement of vortex shedding, strengthened the effect on shear stress distribution. The dead zone behind the spacer filament was reduced by this spacer structure in case A, as mentioned in the ‘Flow pattern and Shear stress distribution’ subsection.
4. Conclusions
To achieve enhanced mixing, the modified feed spacer was designed as the transversal filament from the upper membrane to the lower membrane. This structure changed the flow patterns in the total feed channel compared with the conventional spacer. Reduction of the shadow zone behind the transversal filament was realized with the arched filament, and the potential for mixing reached to the close vicinity of the filament.
Here, a CFD simulation result of the modified feed spacer was presented. Under laminar flow conditions, the element of the feed spacer between membrane envelopes was simulated. Subsequently, the geometry parameters of the modified spacer and this simulation’s parameter values were compared with previous works and validated. The results revealed the detailed flow pattern and shear stress distribution. The main research findings revealed that:
- –
- When the main flow was normal to the arched filament, the area of the dead zone behind the zigzag filament, which was connected with the membrane, decreased with an increasing Reynolds number. In addition, the zone of vortex shedding behind the arched filament caused different flow fields, which generated a high gradient of velocity, improving the mixing of the feed solution.
- –
- The investigated data of power consumption (friction factor) was approximated to the conventional commercial spacer. The value was a little lower than the commercial spacer at high Reynolds numbers when the main flow was normal to the arched filament. From comparison with previous work, it can be extrapolated that the changing of flow patterns from the structure of the modified spacer did not cause too much energy consumption.
- –
- The value of the modified friction factor as a dimensionless number was similar to the results of previous work on commercial spacers when the main flow was normal to the arched filament.
- –
- The effect of porosity (element length) on the energy consumption of the modified spacer was in agreement with previous studies, but on shear stress, was smaller. This conclusion was indicated by result lines qualitatively.
Author Contributions
Conceptualization, Z.H.; Methodology, Z.H. and M.T.; Software, Z.H.; Validation, Z.H., M.T. and H.Y.; Formal Analysis, Z.H.; Investigation, Z.H.; Resources, M.T. and H.Y.; Data Curation, Z.H., M.T., B.L. and H.Y.; Writing-Original Draft Preparation, Z.H.; Writing-Review & Editing, Z.H. and B.L.; Visualization, Z.H.; Supervision, M.T. and H.Y.
Funding
This research received no external funding.
Conflicts of Interest
The authors declare no conflicts of interest.
Nomenclature
| D | thickness of feed spacer filaments/cylinders (m) |
| DH | the channel hydraulic diameter (m) (defined in Equation (3)) |
| f | friction factor (-) (defined in Equation (4)) |
| fwall | the modified friction factor (-) (defined in Equation (6)) |
| hf | height of feed channel (m) |
| ΔL | the element length (m) |
| P | pressure (Pa) |
| ΔP | the pressure drop (Pa) |
| Pn | the dimensionless power number (-) (defined in Equation (5)) |
| Q | flow rate (m3 s−1) |
| Re | Reynolds number (-) (defined in Equation (2)) |
| Uave | average velocity (m s−1) |
| Usup | superficial velocity (m s−1) |
| VSpacer | feed spacer volume (m3) |
| VTotal | channel space volume (m3) |
| Greek letters | |
| ε | feed spacer porosity/voidage (defined in Equation (1)) |
| µ | fluid viscosity (Pa s) |
| v | the kinematic viscosity (-) |
| ρ | fluid density (kg m−3) |
| τwall | average shear stress (Pa) |
| Subscripts | |
| ave | average |
| sup | superficial |
References
- Jamaly, S.; Darwish, N.N.; Ahmed, I.; Hasan, S.W. A short review on reverse osmosis pretreatment technologies. Desalination 2014, 354, 30–38. [Google Scholar] [CrossRef]
- Gu, B.; Adjiman, C.S.; Xu, X.Y. The effect of feed spacer geometry on membrane performance and concentration polarisation based on 3D CFD simulations. J. Memb. Sci. 2017, 527, 78–91. [Google Scholar] [CrossRef] [Green Version]
- Sablani, S.S.; Goosen, M.F.A.; Al-Belushi, R.; Gerardos, V. Influence of spacer thickness on permeate flux in spiral-wound seawater reverse osmosis systems. Desalination 2002, 146, 225–230. [Google Scholar] [CrossRef]
- Radu, A.I.I.; Vrouwenvelder, J.S.S.; van Loosdrecht, M.C.M.C.M.; Picioreanu, C. Effect of flow velocity, substrate concentration and hydraulic cleaning on biofouling of reverse osmosis feed channels. Chem. Eng. J. 2012, 188, 30–39. [Google Scholar] [CrossRef]
- Fernández-Sempere, J.; Ruiz-Beviá, F.; García-Algado, P.; Salcedo-Díaz, R. Experimental study of concentration polarization in a crossflow reverse osmosis system using Digital Holographic Interferometry. Desalination 2010, 257, 36–45. [Google Scholar] [CrossRef] [Green Version]
- Cao, Z.; Wiley, D.E.; Fane, A.G. CFD simulations of net-type turbulence promoters in a narrow channel. J. Memb. Sci. 2001, 185, 157–176. [Google Scholar] [CrossRef]
- Karabelas, A.J.; Kostoglou, M.; Koutsou, C.P. Modeling of spiral wound membrane desalination modules and plants—Review and research priorities. Desalination 2015, 356, 165–186. [Google Scholar] [CrossRef]
- Ranade, V.V.; Kumar, A. Fluid dynamics of spacer filled rectangular and curvilinear channels. J. Memb. Sci. 2006, 271, 1–15. [Google Scholar] [CrossRef] [Green Version]
- Shakaib, M.; Hasani, S.M.F.; Mahmood, M. Study on the effects of spacer geometry in membrane feed channels using three-dimensional computational flow modeling. J. Memb. Sci. 2007, 297, 74–89. [Google Scholar] [CrossRef]
- Haaksman, V.A.; Siddiqui, A.; Schellenberg, C.; Kidwell, J.; Vrouwenvelder, J.S.; Picioreanu, C. Characterization of feed channel spacer performance using geometries obtained by X-ray computed tomography. J. Memb. Sci. 2017, 522, 124–139. [Google Scholar] [CrossRef]
- Da Costa, A.R.; Fane, A.G.; Fell, C.J.D.; Franken, A.C.M. Optimal channel spacer design for ultrafiltration. J. Memb. Sci. 1991, 62, 275–291. [Google Scholar] [CrossRef]
- Ma, S.; Song, L. Numerical study on permeate flux enhancement by spacers in a crossflow reverse osmosis channel. J. Memb. Sci. 2006, 284, 102–109. [Google Scholar] [CrossRef]
- Koutsou, C.P.; Yiantsios, S.G.; Karabelas, A.J. Numerical simulation of the flow in a plane-channel containing a periodic array of cylindrical turbulence promoters. J. Memb. Sci. 2004, 231, 81–90. [Google Scholar] [CrossRef]
- Fimbres-Weihs, G.A.; Wiley, D.E. Review of 3D CFD modeling of flow and mass transfer in narrow spacer-filled channels in membrane modules. Chem. Eng. Process. Process Intensif. 2010, 49, 759–781. [Google Scholar] [CrossRef]
- Hayes, R.E. Computational Flow Modelling for Chemical Reactor Engineering; Academic Press: San Diego, CA, USA, 2002; Volume 80, ISBN 0125769601. [Google Scholar]
- Schock, G.; Miquel, A. Mass transfer and pressure loss in spiral wound modules. Desalination 1987, 64, 339–352. [Google Scholar] [CrossRef]
- Fimbres-Weihs, G.A.; Wiley, D.E. Numerical study of mass transfer in three-dimensional spacer-filled narrow channels with steady flow. J. Memb. Sci. 2007, 306, 228–243. [Google Scholar] [CrossRef]
- Geraldes, V.; Semião, V.; De Pinho, M.N. Flow management in nanofiltration spiral wound modules with ladder-type spacers. J. Memb. Sci. 2002, 203, 87–102. [Google Scholar] [CrossRef]
- Koutsou, C.P.; Yiantsios, S.G.; Karabelas, A.J. Direct numerical simulation of flow in spacer-filled channels: Effect of spacer geometrical characteristics. J. Memb. Sci. 2007, 291, 53–69. [Google Scholar] [CrossRef]
- Song, L.; Ma, S. Numerical studies of the impact of spacer geometry on concentration polarization in spiral wound membrane modules. Ind. Eng. Chem. Res. 2005, 44, 7638–7645. [Google Scholar] [CrossRef]
- Santos, J.L.C.; Geraldes, V.; Velizarov, S.; Crespo, J.G. Investigation of flow patterns and mass transfer in membrane module channels filled with flow-aligned spacers using computational fluid dynamics (CFD). J. Memb. Sci. 2007, 305, 103–117. [Google Scholar] [CrossRef]
- Schwinge, J.; Wiley, D.E.; Fletcher, D.F. Simulation of the flow around spacer filaments between narrow channel walls. 1. Hydrodynamics. Ind. Eng. Chem. Res. 2002, 41, 2977–2987. [Google Scholar] [CrossRef]
- Gurreri, L.; Tamburini, A.; Cipollina, A.; Micale, G. CFD analysis of the fluid flow behavior in a reverse electrodialysis stack. Desalin. Water Treat. 2012, 48, 390–403. [Google Scholar] [CrossRef] [Green Version]
- Lim, S.Y.; Liang, Y.Y.; Fimbres Weihs, G.A.; Wiley, D.E.; Fletcher, D.F. A CFD study on the effect of membrane permeance on permeate flux enhancement generated by unsteady slip velocity. J. Memb. Sci. 2018, 556, 138–145. [Google Scholar] [CrossRef]
- Kavianipour, O.; Ingram, G.D.; Vuthaluru, H.B. Investigation into the effectiveness of feed spacer configurations for reverse osmosis membrane modules using Computational Fluid Dynamics. J. Memb. Sci. 2017, 526, 156–171. [Google Scholar] [CrossRef]
- Blocken, B.; Gualtieri, C. Ten iterative steps for model development and evaluation applied to Computational Fluid Dynamics for Environmental Fluid Mechanics. Environ. Model. Softw. 2012, 33, 1–22. [Google Scholar] [CrossRef]
- Saeed, A.; Vuthaluru, R.; Vuthaluru, H.B. Impact of Feed Spacer Filament Spacing on Mass Transport and Fouling Propensities of RO Membrane Surfaces. Chem. Eng. Commun. 2015, 202, 634–646. [Google Scholar] [CrossRef]
- Haidari, A.H.; Heijman, S.G.J.; van der Meer, W.G.J. Effect of spacer configuration on hydraulic conditions using PIV. Sep. Purif. Technol. 2018, 199, 9–19. [Google Scholar] [CrossRef]
- Schwinge, J.; Wiley, D.E.; Fletcher, D.F. Simulation of the Flow around Spacer Filaments between Channel Walls. 2. Mass-Transfer Enhancement. Ind. Eng. Chem. Res. 2002, 41, 4879–4888. [Google Scholar] [CrossRef]
- Saeed, A.; Vuthaluru, R.; Vuthaluru, H.B. Investigations into the effects of mass transport and flow dynamics of spacer filled membrane modules using CFD. Chem. Eng. Res. Des. 2015, 93, 79–99. [Google Scholar] [CrossRef]
- Lau, K.K.; Abu Bakar, M.Z.; Ahmad, A.L.; Murugesan, T. Effect of feed spacer mesh length ratio on unsteady hydrodynamics in 2D spiral wound membrane (swm) channel. Ind. Eng. Chem. Res. 2010, 49, 5834–5845. [Google Scholar] [CrossRef]
- Zimmerer, C.C.; Kottke, V. Effects of spacer geometry on pressure drop, mass transfer, mixing behavior, and residence time distribution. Desalination 1996, 104, 129–134. [Google Scholar] [CrossRef]
- Da Costa, A.R.; Fane, A.G.; Wiley, D.E. Spacer characterization and pressure drop modeling in spacer-filled channels.pdf. J. Memb. Sci. 1994, 87, 79–98. [Google Scholar] [CrossRef]
- Siddiqui, A.; Lehmann, S.; Haaksman, V.; Ogier, J.; Schellenberg, C.; van Loosdrecht, M.C.M.; Kruithof, J.C.; Vrouwenvelder, J.S. Porosity of spacer-filled channels in spiral-wound membrane systems: Quantification methods and impact on hydraulic characterization. Water Res. 2017, 119, 304–311. [Google Scholar] [CrossRef] [PubMed]
- Haidari, A.H.; Heijman, S.G.J.; van der Meer, W.G.J. Visualization of hydraulic conditions inside the feed channel of Reverse Osmosis: A practical comparison of velocity between empty and spacer-filled channel. Water Res. 2016, 106, 232–241. [Google Scholar] [CrossRef] [PubMed]
- Li, F.; Meindersma, W.; De Haan, A.B.; Reith, T. Experimental validation of CFD mass transfer simulations in flat channels with non-woven net spacers. J. Memb. Sci. 2004, 232, 19–30. [Google Scholar] [CrossRef]
Figure 1.
A view of the morphology of the modified feed spacer.

Figure 2.
The geometrical characteristics of the modified feed.

Figure 3.
CFD (computational fluid dynamics) model setting.

Figure 4.
Mesh dependence analysis and the adopted mesh for this study.

Figure 5.
(A) Contour plot (L/D = 12) of the average wall shear stress (τ) profile on the upper membrane and lower membrane generated by the spacer; flow was from up to down in case A and flow was from left to right in case B (red: High, blue: Low, unit: Pa); (B) streamline of velocity in case A and case B (L/D = 12, Usup = 0.06 m s−1).

Figure 6.
Contour plot of velocity in case A (L/D = 12, Usup = 0.06 m s−1).

Figure 7.
Velocity vectors in case A and case B (L/D = 12, Usup = 0.06 m s−1; in (case A), the main flow was from up to down, and in (case B), the main flow was from right to left for (A) 0.95hf, (B) 0.50hf, and (C) 0.05hf.
Figure 7.
Velocity vectors in case A and case B (L/D = 12, Usup = 0.06 m s−1; in (case A), the main flow was from up to down, and in (case B), the main flow was from right to left for (A) 0.95hf, (B) 0.50hf, and (C) 0.05hf.


Figure 8.
Comparison with the friction factor result of Haaksman et al. [9] as a function of Reynolds number.
Figure 8.
Comparison with the friction factor result of Haaksman et al. [9] as a function of Reynolds number.

Figure 9.
Comparison with the result of Haaksman et al. [9] in the commercial spacer simulation for the modified friction factor as a function of the dimensionless power number.
Figure 9.
Comparison with the result of Haaksman et al. [9] in the commercial spacer simulation for the modified friction factor as a function of the dimensionless power number.


Table 1.
The ratio of the control area to total area for the values of shear stress, which are smaller than 10% maximum value or greater than 90% maximum value.
Table 1.
The ratio of the control area to total area for the values of shear stress, which are smaller than 10% maximum value or greater than 90% maximum value.
| 0.01 m/s | 0.02 m/s | 0.04 m/s | 0.06 m/s | |||
|---|---|---|---|---|---|---|
| Case A | upper | smaller | 23.916% | 29.274% | 37.002% | 42.018% |
| greater | 2.056% | 1.605% | 0.758% | 0.552% | ||
| lower | smaller | 23.855% | 29.099% | 36.751% | 41.720% | |
| greater | 2.093% | 1.753% | 0.814% | 0.572% | ||
| Case B | upper | smaller | 33.544% | 35.614% | 29.087% | 23.815% |
| greater | 13.788% | 12.603% | 4.015% | 1.937% | ||
| lower | smaller | 33.427% | 35.987% | 29.285% | 23.635% | |
| greater | 13.954% | 13.133% | 3.838% | 1.815% |
Table 2.
Interpolated value from fixed superficial velocity at Reynolds number 40.
| Channel porosity | SPC(Pa/s) | ||
|---|---|---|---|
| Case A | L/D=8 | 0.828 | 10.399 |
| L/D=10 | 0.835 | 8.663 | |
| L/D=12 | 0.841 | 7.554 | |
| L/D=14 | 0.845 | 6.802 | |
| Case B | L/D=8 | 0.828 | 69.736 |
| L/D=10 | 0.835 | 92.111 | |
| L/D=12 | 0.841 | 124.068 | |
| L/D=14 | 0.845 | 151.636 |
© 2018 by the authors. Licensee MDPI, Basel, Switzerland. This article is an open access article distributed under the terms and conditions of the Creative Commons Attribution (CC BY) license (http://creativecommons.org/licenses/by/4.0/).
Share and Cite
MDPI and ACS Style
Han, Z.; Terashima, M.; Liu, B.; Yasui, H. Impact of Modified Spacer on Flow Pattern in Narrow Spacer-Filled Channels for Spiral-Wound Membrane Modules. Environments 2018, 5, 116. https://doi.org/10.3390/environments5110116
AMA Style
Han Z, Terashima M, Liu B, Yasui H. Impact of Modified Spacer on Flow Pattern in Narrow Spacer-Filled Channels for Spiral-Wound Membrane Modules. Environments. 2018; 5(11):116. https://doi.org/10.3390/environments5110116
Chicago/Turabian StyleHan, Zhiming, Mitsuharu Terashima, Bing Liu, and Hidenari Yasui. 2018. "Impact of Modified Spacer on Flow Pattern in Narrow Spacer-Filled Channels for Spiral-Wound Membrane Modules" Environments 5, no. 11: 116. https://doi.org/10.3390/environments5110116
Note that from the first issue of 2016, this journal uses article numbers instead of page numbers. See further details here.