Wetting Fraction in a Tubular Reactor with Solid Foam Packing and Gas/Liquid Co-Current Downflow


1
AREVA Endowed Chair of Imaging Techniques in Energy and Process Engineering, Technische Universität Dresden, 01062 Dresden, Germany
2
Helmholtz-Zentrum Dresden-Rossendorf, Bautzner Landstraße 400, 01328 Dresden, Germany
*
Author to whom correspondence should be addressed.
Catalysts 2018, 8(9), 396; https://doi.org/10.3390/catal8090396
Submission received: 5 August 2018
/
Revised: 7 September 2018
/
Accepted: 12 September 2018
/
Published: 14 September 2018
(This article belongs to the Special Issue Structured Catalysts for Catalytic Processes Intensification)
Abstract
:The performance of fixed-bed reactors with structured catalysts depends heavily on the gas–liquid–solid contacting pattern. For a broad range of flow conditions, the liquid phase does not cover the solid surface of the packing homogeneously; this is known as partial wetting. The wetting fraction in solid foams was obtained using a modified electrochemical measurement method with adaption of the limiting-current technique in different pre-wetting scenarios. The external wetting fraction, which is defined as fraction of the external solid-foam area covered by the liquid phase to the total external solid-foam area, is directly linked to the overall rate of reaction through the overall liquid mass transfer rate. The wetting fraction decreased with an increase in foam density, a process which was related to decreasing the strut thickness, increasing foam surface area, and consequently, decreasing the wetted area. Additionally, the results indicate that a better distribution of liquid and an increased wetting fraction occurred when a spray nozzle distributor was applied. A new wetting correlation for solid foams is proposed to estimate the wetting fraction with consideration of foam morphology and flow regime.
1. Introduction
In recent years, the performance of gas–liquid–solid fixed-bed reactors with structured catalysts was intensively discussed as an alternative to random-catalyst particle packing. Structured catalysts based on solid foams with an open-cell structure are very promising in particular. Such porous structures combine highly specific surface areas up to 2000 m2/m3, which can be even higher for high foam density, low single-phase and two-phase pressure drop due to high bed porosities between 75% and 95%, and interconnected pores for enhanced heat and mass transfer [1,2]. However, for a good understanding of the reactor performance, as well as to perform optimization in terms of catalyst utilization, yield and selectivity information about wetting is needed. Therefore, a deeper understanding of the wetting of catalytic surfaces is very important. Two types of wetting are indicated in multiphase reactors: external wetting, which refers to the measured packing surface covered by liquid, and internal wetting fraction, which refers to the measured internal packing surface covered by liquid.
The term “wetting fraction” is used to describe the ratio of the wetted area in relation to the complete surface area of the solid foam. A wetting fraction of 0 describes a completely dry surface, whereas a wetting fraction of 1 means every part of the surface is covered with liquid, which equals complete wetting. The wetting fraction strongly depends on the solid foam porosity, the foam material, gas and liquid throughput, the liquid properties (viscosity, surface tension, and contact angle), as well as the type of liquid distributor applied above the packing.
Wetting, in general, the influences catalyst utilization, yield, and selectivity. The study of trickle-bed reactors refers to a direct link between catalysis wetting and the phase in which the limited reactant is present (liquid or gas). In the case of a liquid-limited reaction (e.g., hydrogenation), reducing the wetting fraction led to a decrease in reaction rate, while, in the case of a gas-limited reaction, decreasing the catalysis wetting enhanced the reaction rate because the gas reaction occurred on the dry surface of the catalyst [3].
Previous studies on multiphase tubular reactors with catalyst particles in the trickle mode of operation by van Howelingen et al. [4] and Niclo et al. [5] identified the dependency of the wetting fraction on the applied pre-wetting of the particles. Different pre-wetting procedures result in different wetting fractions. This is due to a phenomenon which is called hydrodynamic multiplicity. Cheng et al. [6] proposed a three-region model for external liquid–solid wetting, taking into account the flow regime, pre-wetting, and the specific solid surface area of the particles.
Experimental studies of solid foam packing indicate similar hydrodynamic phenomena compared with particle packing, but with reduced pressure drop and higher mass transfer rates [7,8,9,10].
Typically, the wetting fraction is measured either directly or indirectly. Directly, it can be measured through, for example, the photographic (direct image) method, the injection of a dye, or the application of non-invasive tomographic measurement techniques such as computed tomography or magnetic resonance imaging [11]. Although these techniques have high accuracy, they do not allow a real quantification of wetting and are mostly limited by reactor diameter and reactor material, in addition to high costs. Furthermore, most of them do not allow a real quantification of wetting [12,13,14,15].
On the other hand, indirect methods such as tracer measurements, mass transfer measurements, and reaction studies deliver interesting insights into the physico-chemical phenomena that are important for reactor design and operation. However, reactive methods require a proper choice of reaction and catalytic characterization. For example, the method is not valid if the reaction is highly exothermic [16,17].
The tracer method is based on the effect of inter-particle diffusion on the tracer response curve after applying a concentration step change. The wetting fraction is then proportional to the ratio of disturbance of the tracer concentration in the case of two-phase flow and the disturbance of the tracer concentration in the case of a flooding condition, which equals complete wetting [18,19,20,21]. The limitations of this method are the critically theoretical considerations of proper choice of boundary conditions and flow behavior close to plug flow, as well as asymmetrical diffusion in the catalyst pores due to partial wetting of the catalyst.
This is the case since the ratio of internal diffusivities is estimated from the first moments of the trace response curve, which is used later to calculate the wetting fraction. The dissolution rate method is based on comparing the actual dissolution rate of solid material with the dissolution rate on the completely wetted surface at the same interstitial liquid velocity. This method requires nonporous soluble packing of the same structure, which is rather difficult to prepare.
The colorant method [22,23,24] applies dyes in the liquid to color the packing when contacting the liquid phase. The wetting factor calculation is based on individual visual assessment of the packing after the experiments. This method offers direct information without specific parameter assumption. Nevertheless, the success of this method depends on a stable flow pattern over time and access to the solid surface. The latter is not possible if solid foams are applied due to the opaque nature of the material.
The reaction method provides overall information and requires a detailed knowledge of the reaction kinetics and the different mass transfer steps [25] to back-calculate the wetting fraction.
Joubert et al. [26] applied an electrochemical method to measure the external wetting fraction directly in trickle-bed reactors with multiple nickel sphere packing. By applying two different hydrodynamic states at different bed heights, the upper state represented by Kan pre-wetting mode and the lower represented by Levec pre-wetting mode based on the variation in the applied voltage. The results suggest the variation in wetting is the result of the divergence in the wetted area connected directly with applying the pre-wetting mode.
However, a significant drop in wetting along the reactor axial height was observed for both pre-wetting modes. Further development of the electrochemical method was made by Joubert et al. [26]. They further qualified the method to measure the wetting fraction on a sub-particle scale; the results provide clear evidence of the two wetted zone theories in trickle-bed reactors. The lower hysteresis branch (Levec pre-wetting mode) had a larger static wetted fraction (wetted area to total area) in comparison to the static wetted fraction in the upper hysteresis (Kan pre-wetting mode). However, no correlation among the wetting, the axial position, and static and residual wetting values was found.
The main parameter which affects the wetting performance in a tubular reactor is the liquid throughput and its distribution on the packing. Sederman et al. [27] referred to the variation of wetting with a higher liquid flow rate related to the construction of new rivulets, but further rises in the liquid flow rate resulted in saturation, increases in the thickness of the rivulet, and consequently, improvements in wetting. Similar trends were found by El-Hisnawi et al. [28].
Two different impacts of increasing gas velocity on the wetting fraction are found in the literature: a decrease in the wetting efficiency was found in studies made by Burghardt et al. [29], Sederman et al. [27], and Baussaron et al. [24]; a reduction in liquid holdup was given as an explanation for this contrary effect. On the other hand, Al-Dahhan and Dudukovic [30] referred to an indirect improvement in wetting upon increasing the gas velocity, which is related to higher shear stress induced by the gas flow at the gas–liquid interface.
Further studies in trickle-bed reactors refer to the impact of packing specification on wetting [31,32]. These studies indicated improvements in wetting upon using a smaller packing size, which were explained by the effect of capillary pressure.
However, based on our knowledge, no work was done investigating this important parameter with solid foam packing. To get a better understanding of solid foam packing in tubular reactors for gas–liquid–solid reactions, wetting fractions were studied experimentally by applying the method of Joubert et al. [26] to a solid-foam-packed reactor.
2. Results and Discussion
This section presents the main results of the experimental wetting study and the comparison of selected experimental data with data from the literature. The wetting fraction was defined as the ratio between the effectively wetted surface area of the foam packing to the complete surface area of the foam packing.
2.1. Effect of Gas and Liquid Velocity
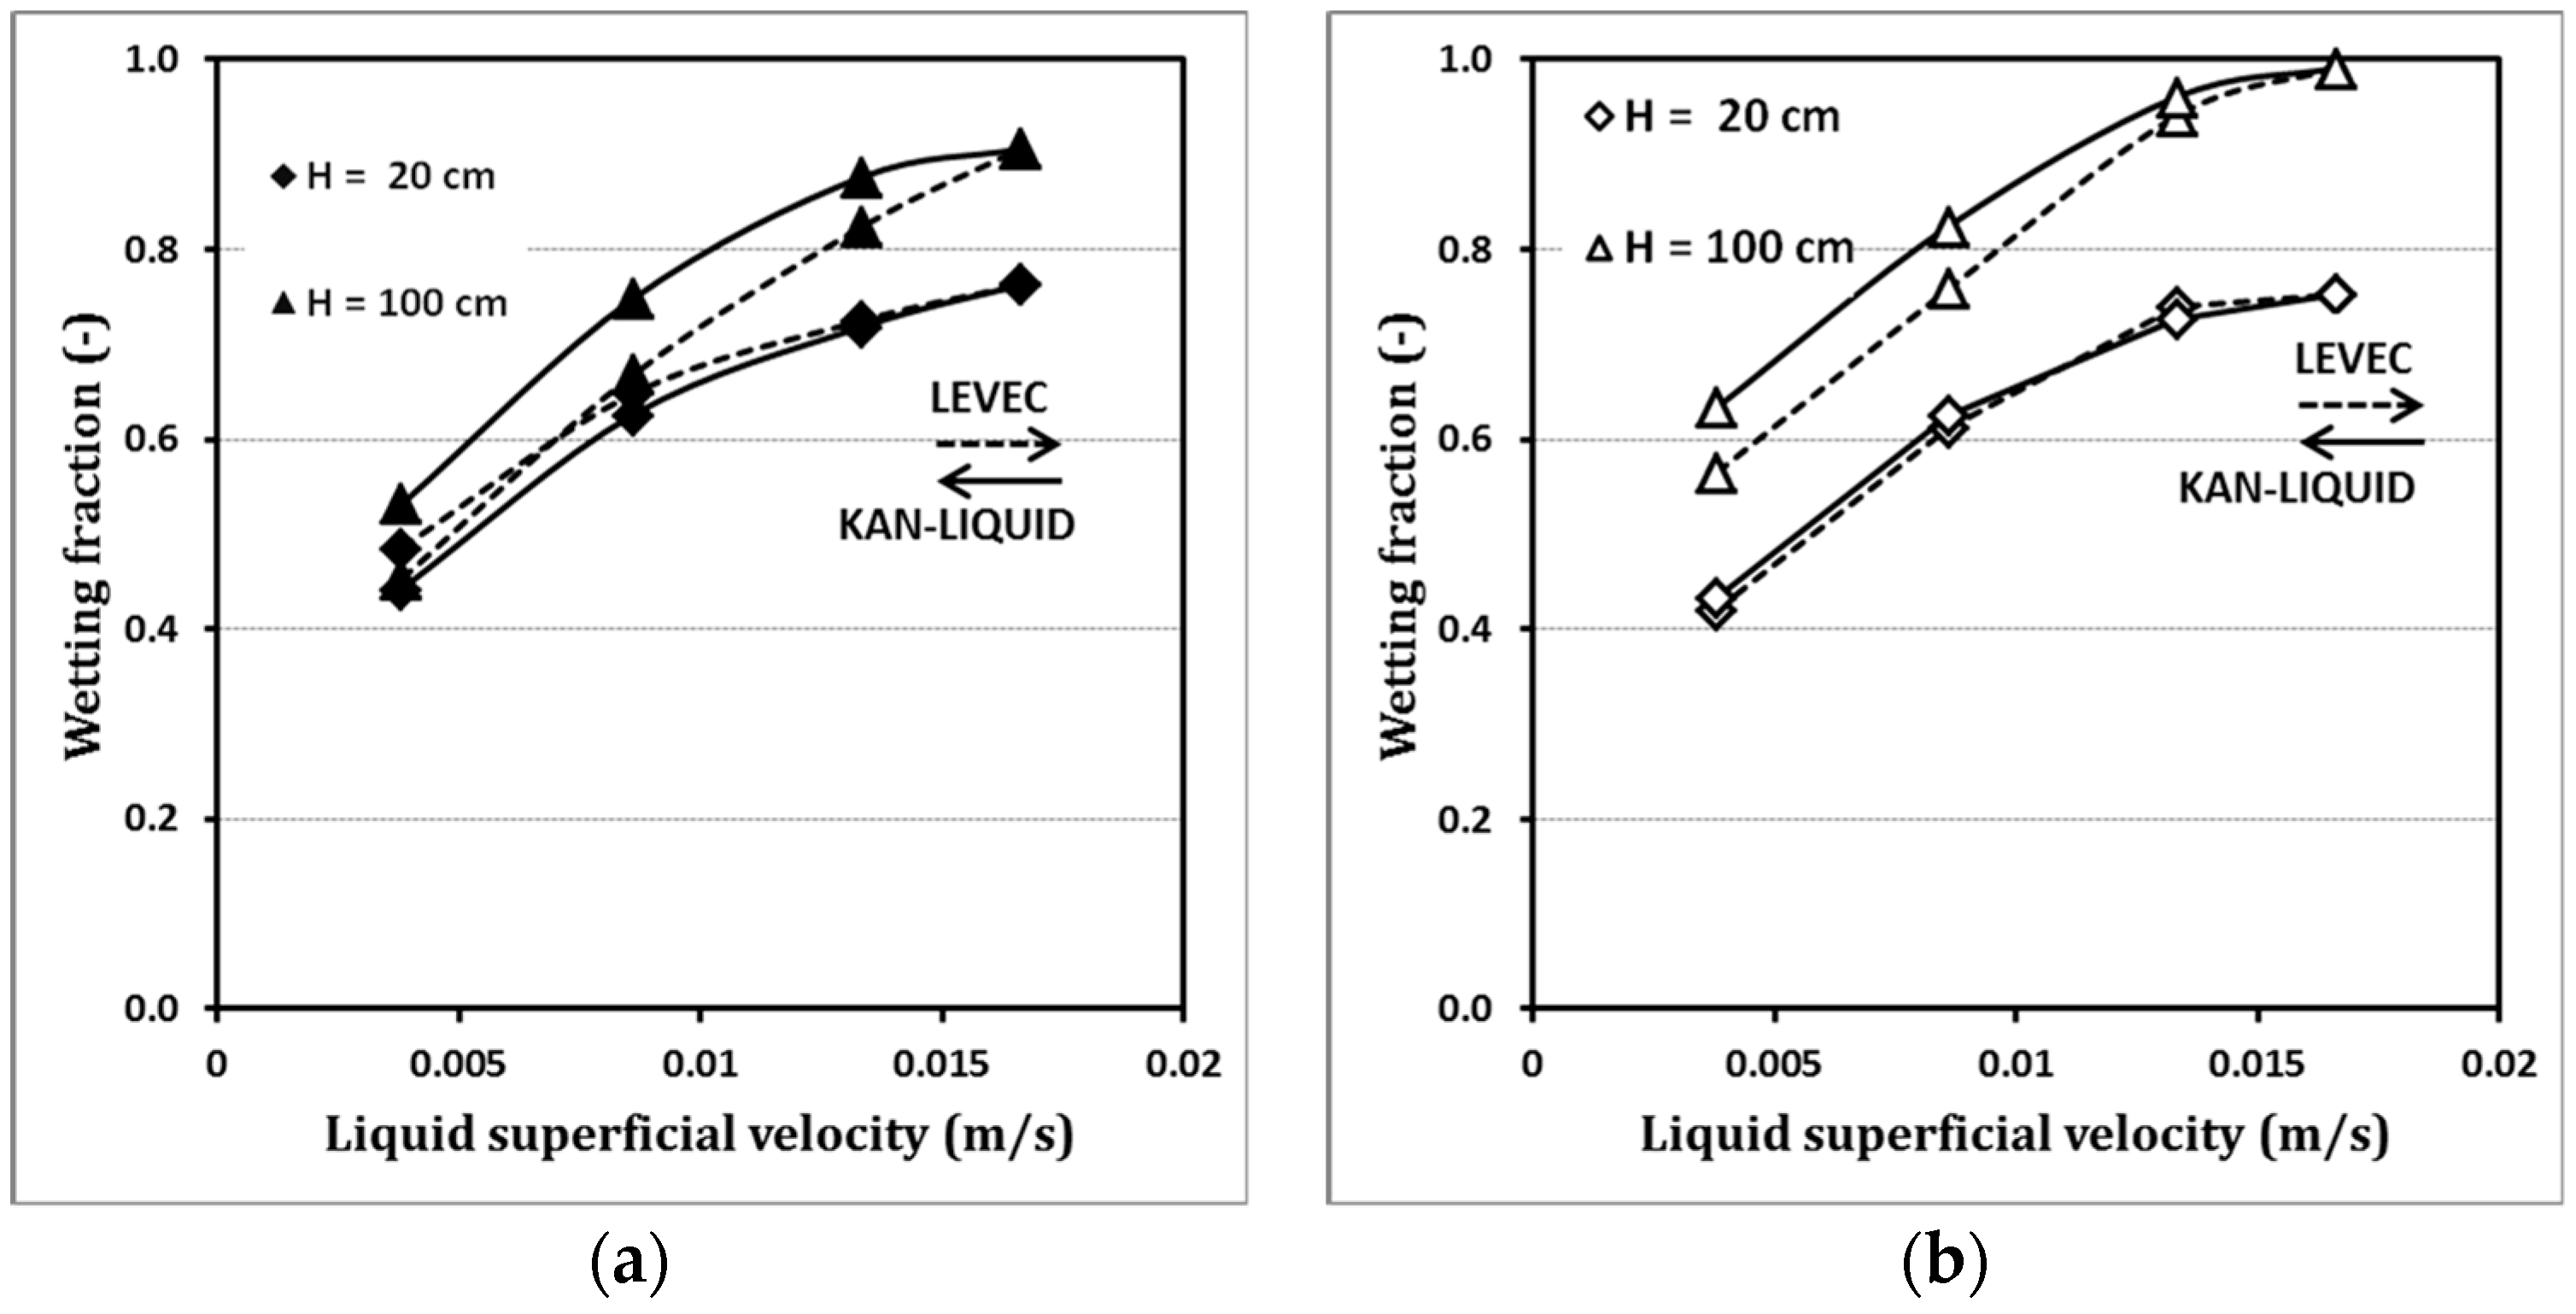
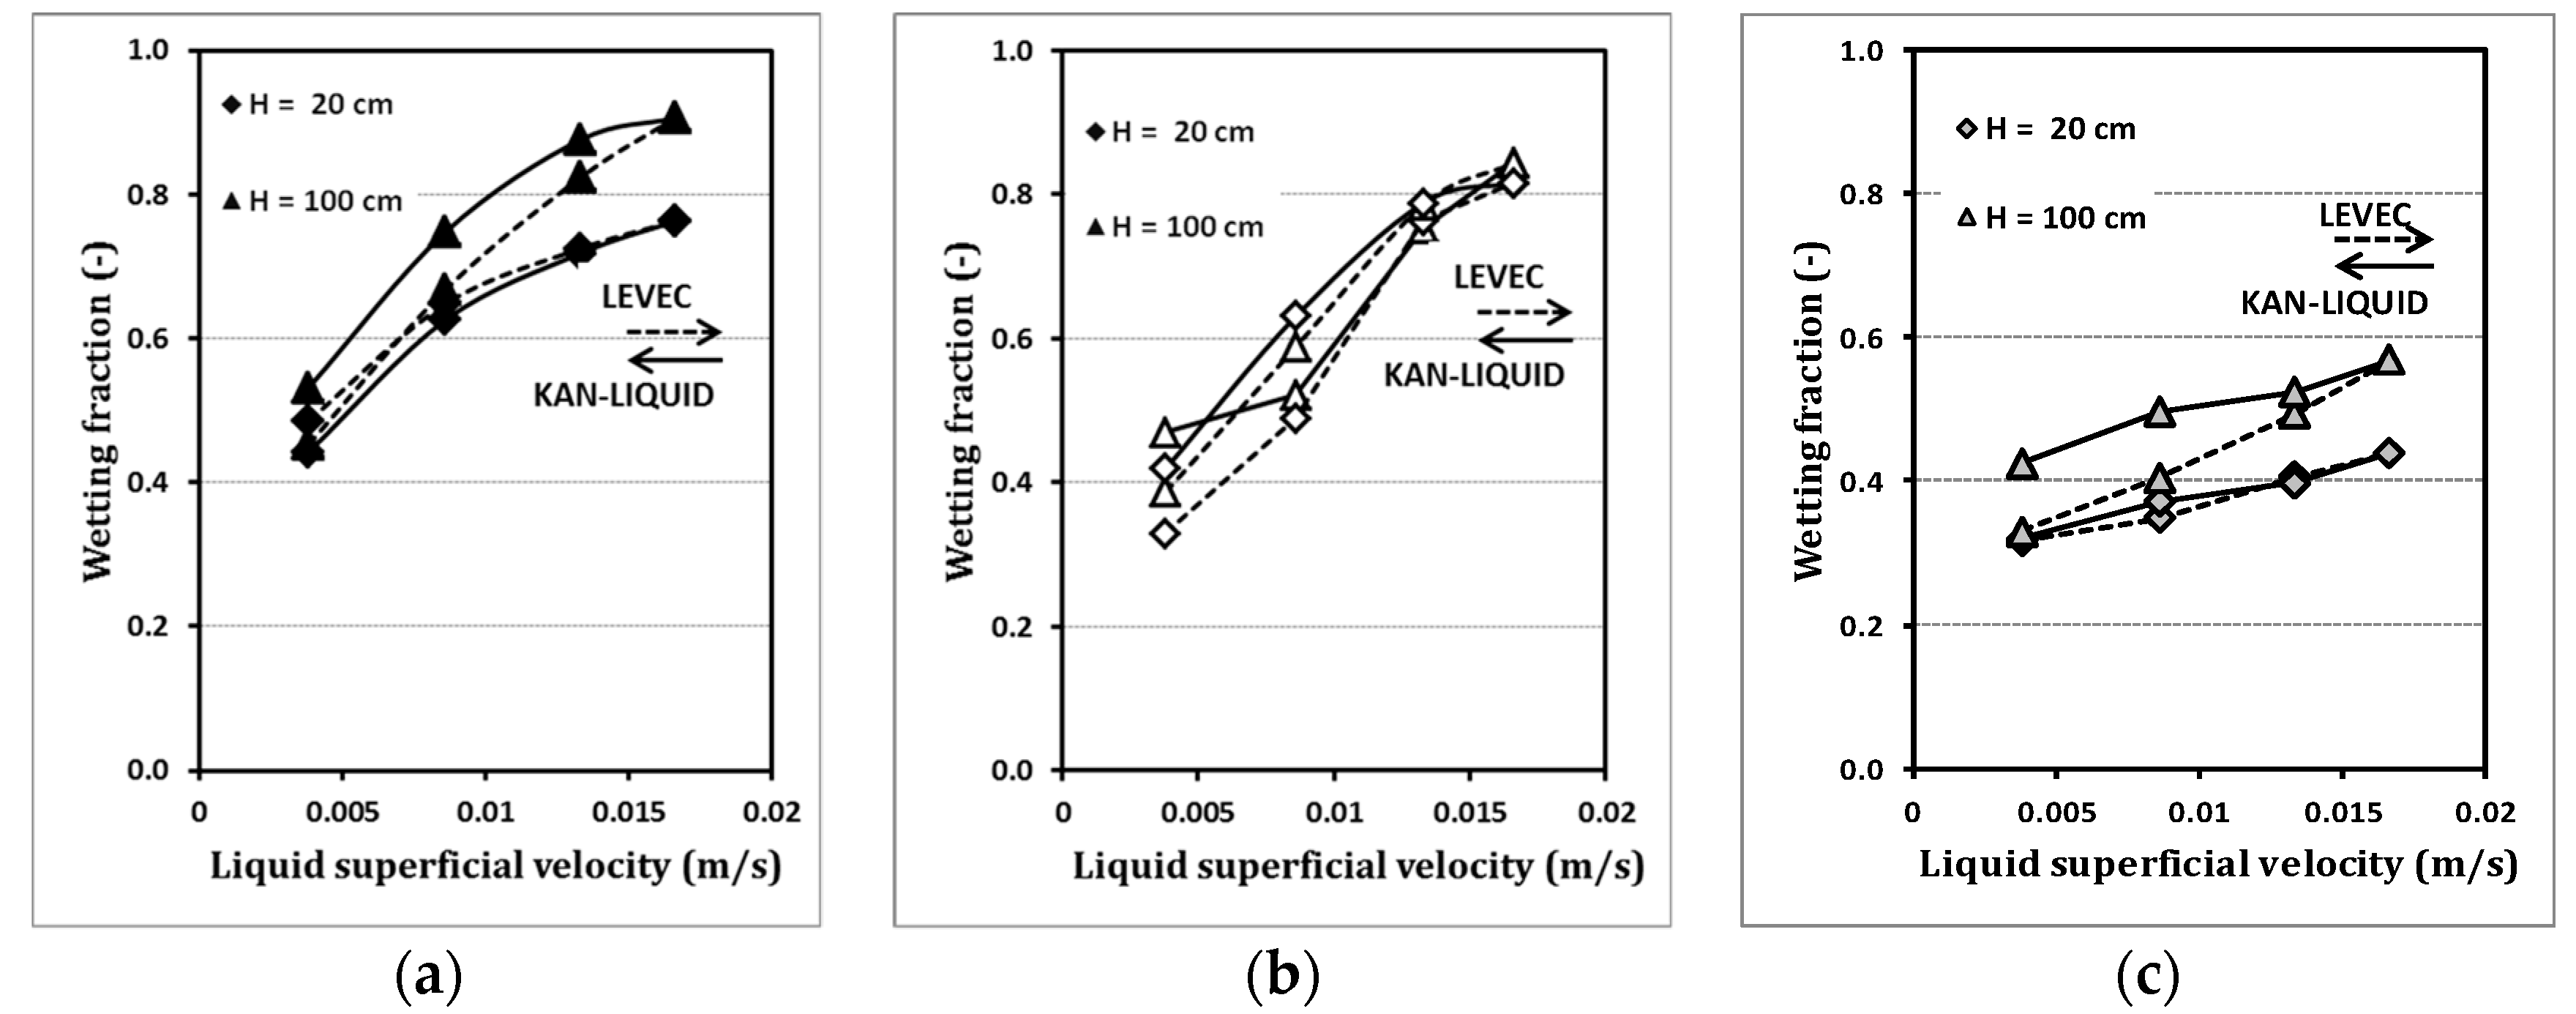
The effect of superficial liquid velocity at a constant gas velocity is shown in Figure 1 for a pore density of 10 ppi.
Figure 1 demonstrates that increasing the liquid velocity results in an increase in wetting fraction. The influence of gas velocity is not very pronounced and can be ignored for the conditions studied in this work. The maximum wetting fraction is higher in the lower part (downstream) of the column than in the upper part. A possible reason for this is the liquid spreading along the packing axis.
Similar trends were reported for studies of trickle-bed reactors by Specchia [33] using dissolution of phthalic anhydride particles, and by Al-Dahhan et al. [20] in high-pressure trickle-bed reactors. In the upper part of the packing, the pre-wetting mode also had no significant influence on the wetting fraction. This is in contrast to the second measurement position at H = 100 cm where an influence is noticeable. The Kan pre-wetting mode caused higher wetting fractions compared to the Levec pre-wetting mode.
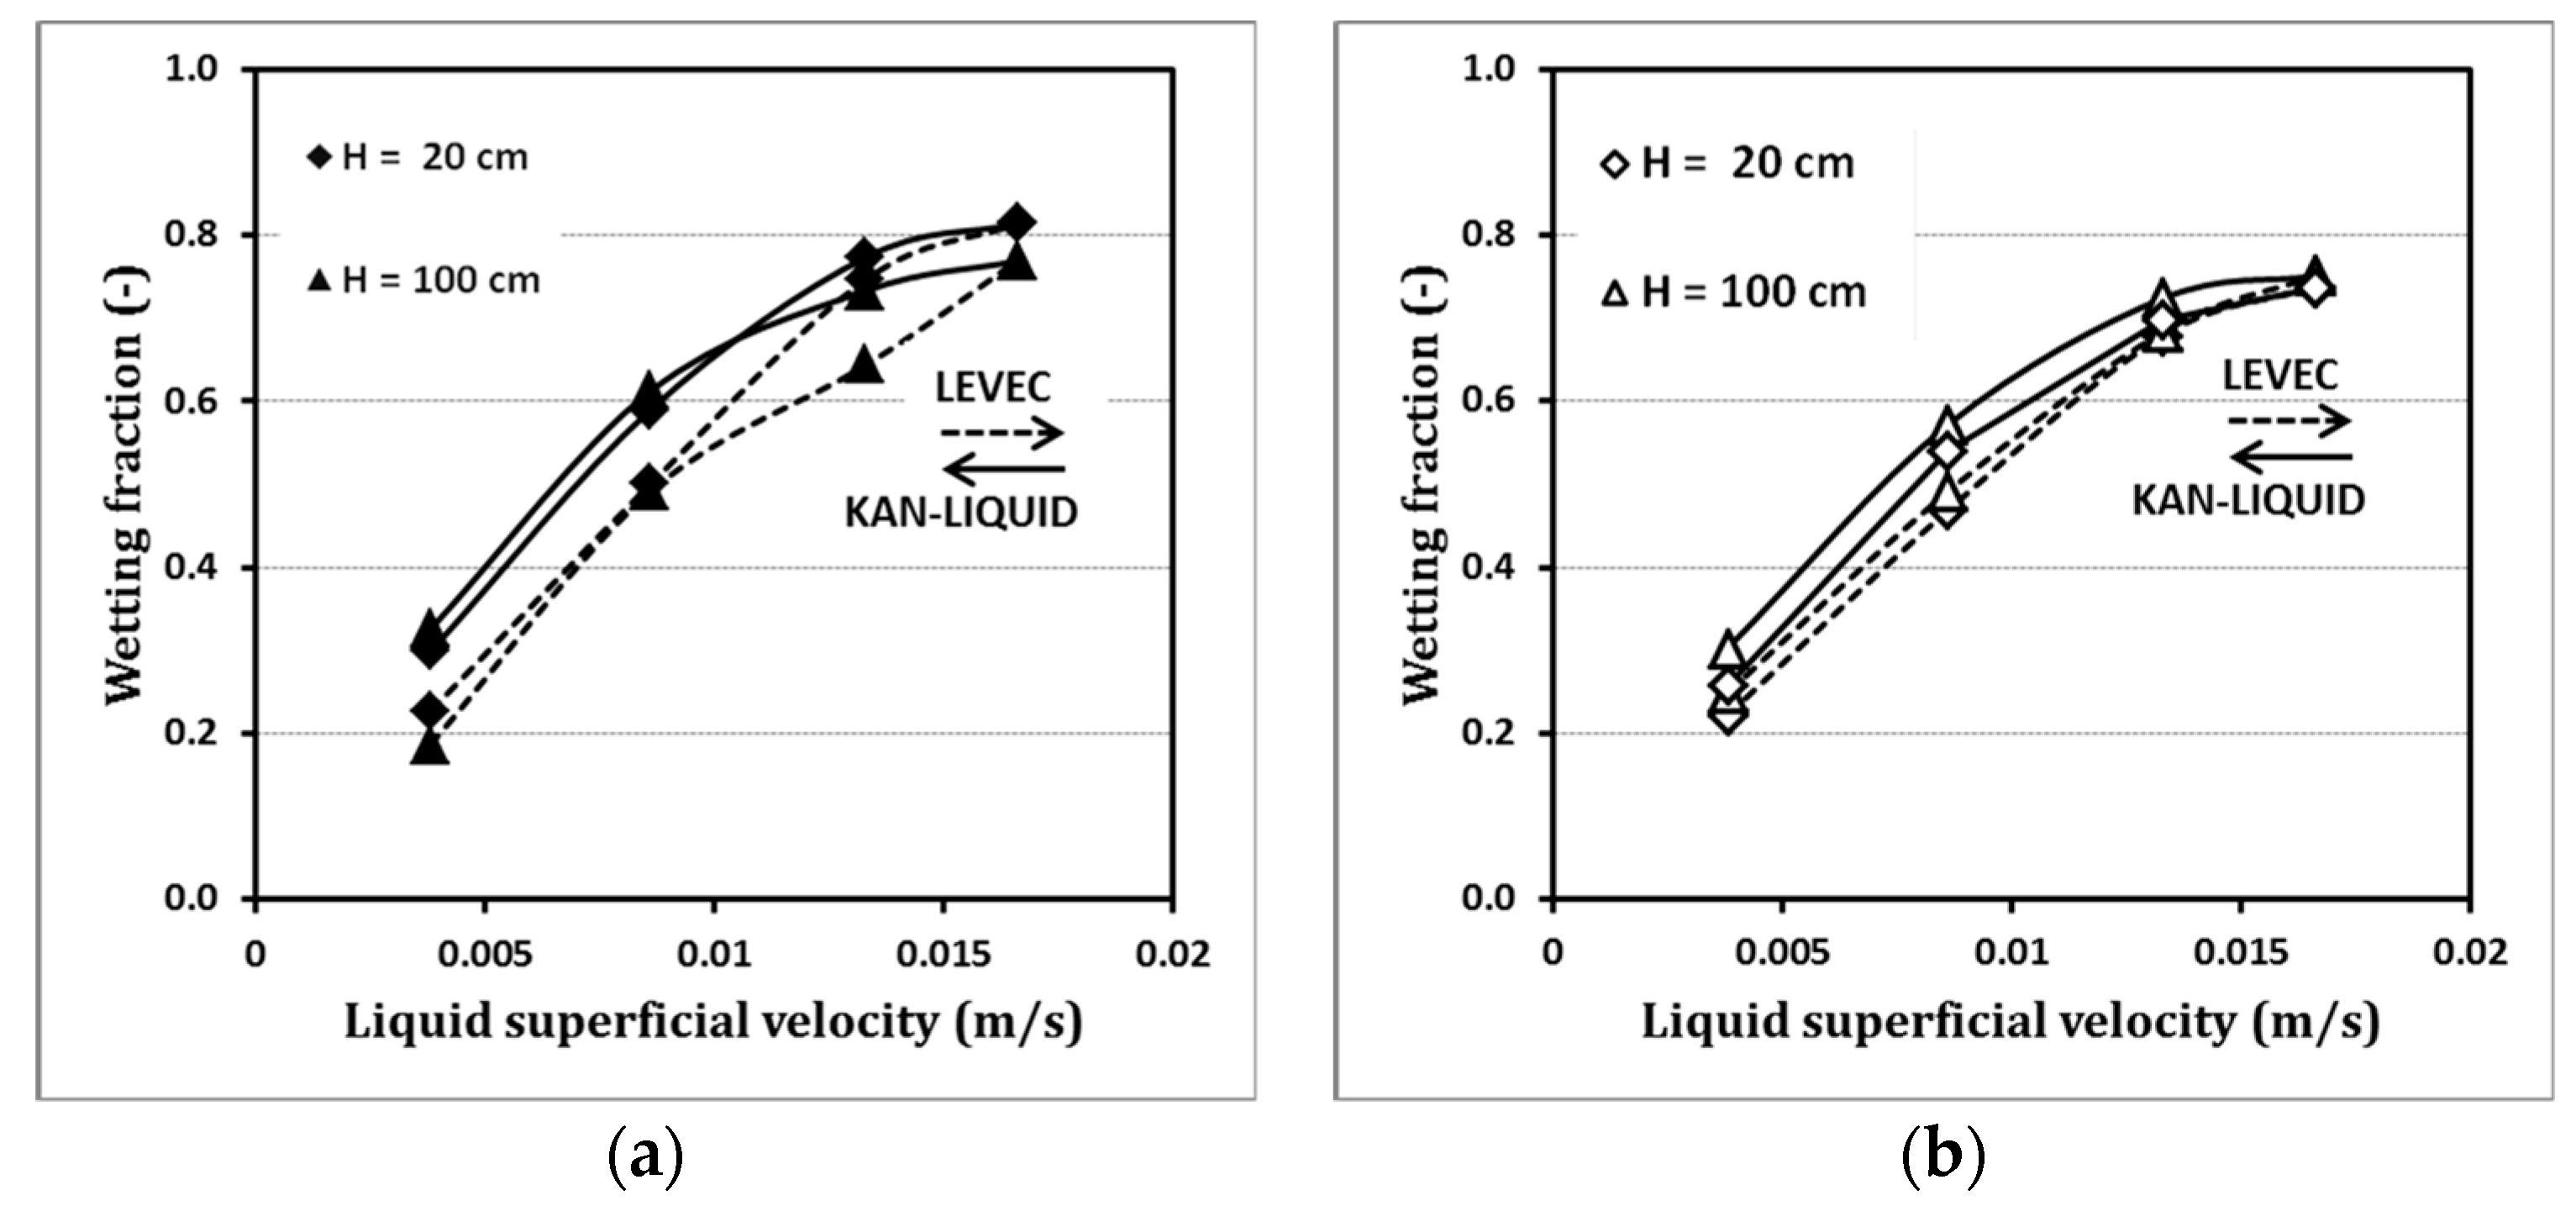
An increase in pore density up to 20 ppi showed overall similar trends as observed for a pore density of 10 ppi, as shown in Figure 2. The overall trends of wetting, e.g., the increase in wetting fraction with increase in liquid velocity, are similar. The influence of gas superficial velocity can be neglected. The experiments revealed similar behavior and a similar wetting fraction at different measurement positions, at different gas superficial velocities, and for different pre-wetting modes. Nevertheless, there are some remarkable differences compared to the foams of 10-ppi pore density.
The pre-wetting mode starts influencing the wetting fraction at 20 ppi in the upper part of the packing. The diagram reveals that the Kan mode results in higher wetting fractions compared with the Levec mode for all conditions at 20 ppi (no line break at this point). Furthermore, the wetting fraction for the 20-ppi foam at the lower part of the column is smaller compared to the 10-ppi foam. These results can be explained with the specific foam morphology and the related decrease in the mean pore diameter at higher foam pore densities. This led most probably to accumulation of liquid inside the pores, resulting in higher static liquid holdup.
Consequently, the foam packing will be filled with liquid until a constant value of the wetting fraction is attained. Any further increase in the superficial liquid velocity will not show any effect on the wetting fraction due to the formation of liquid channel flow. Similar effects were observed by Mills et al. [16] in trickle-bed reactors, as well as by Mohammed et al. [34] and Zalucky et al. [35].
It is important to mention that the trickle flow regime was visually observed for both foam densities of 10 and 20 ppi.
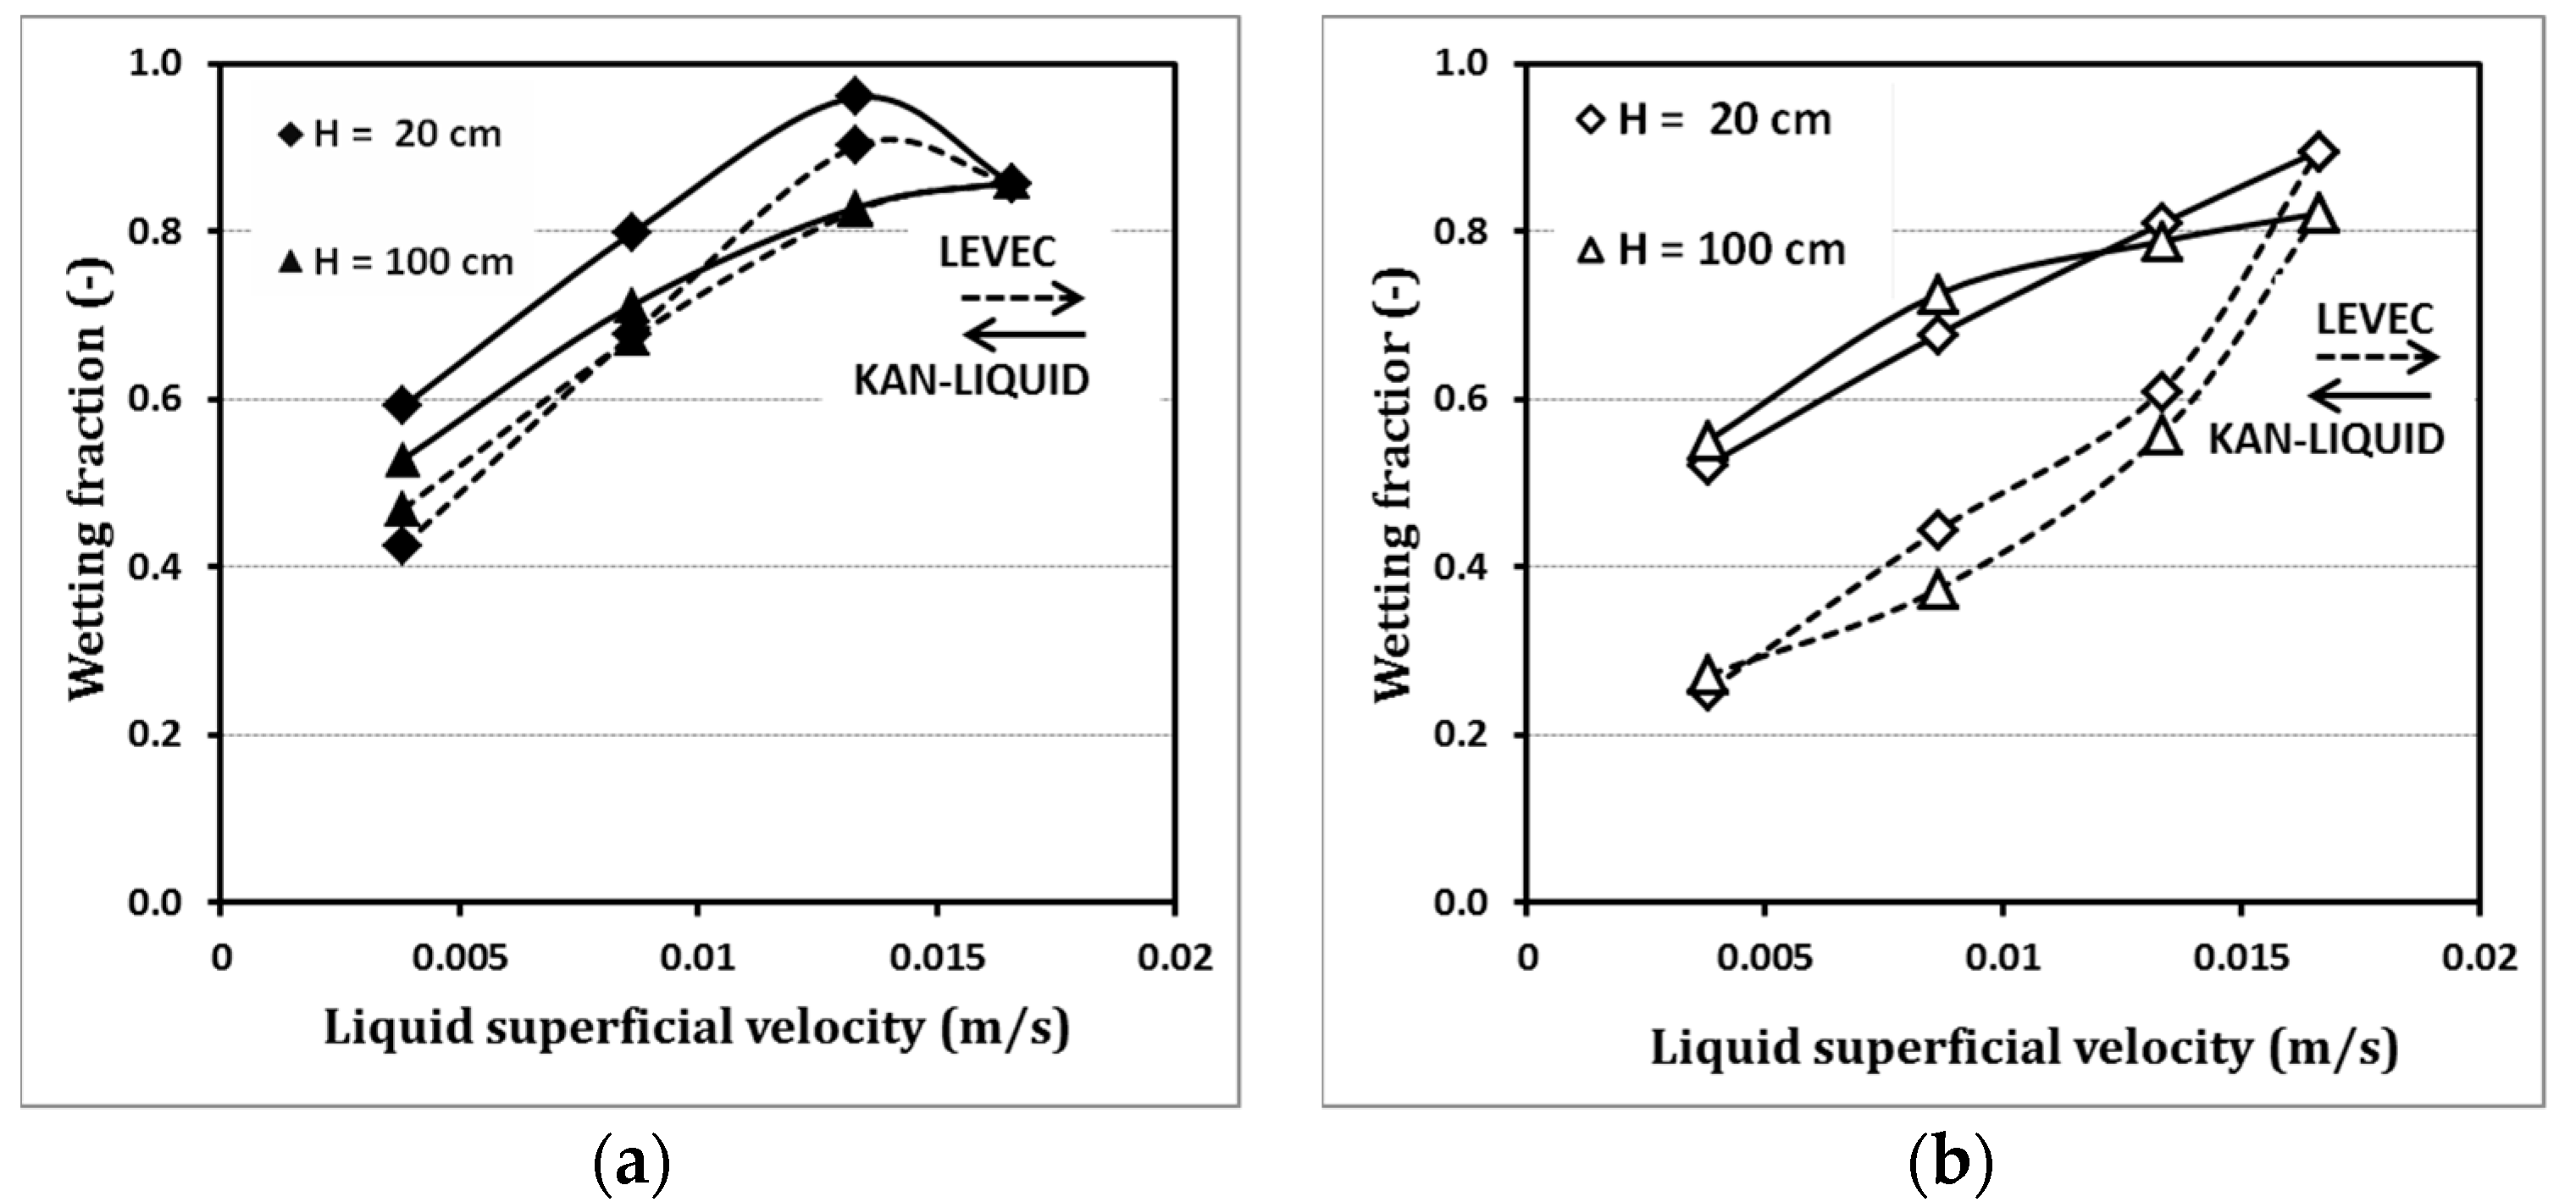
A further increase in pore density resulted in a fundamental change from a trickle regime to a pulse flow regime at a pore density of 25 ppi. It is clear that the higher the pore density, the larger the resistance and friction. This is related to the structure of 25-ppi foam, as the compressible nature of the 25-ppi foam at the intersections will trigger pulse flow at lower velocities, resulting in pulse waves moving across the packing length, as depicted in Figure 3.
Increasing the superficial velocity of the liquid resulted in an increase in wetting fraction for almost all conditions at a pore density of 25 ppi. The change in flow regime results in a noticeable effect on the gas velocity at different pre-wetting conditions. The wetting fraction changes along the downstream flow through the packing. At a measurement position of 20 cm from the upper edge of the packing, the Kan pre-wetting mode resulted in a higher wetting fraction compared to Levec mode. At a superficial liquid velocity of about 0.015 m/s, an almost complete wetting of the foam packing was observed.
A possible explanation can be related to the complete formation of full pulse flow from trickle flow, as there is a certain inlet length for the pulse to develop from the trickling flow. Below the so-called point of pulse inception, there is a pro-wetting tendency to pulse, which will not cover the complete cross-section. The point of pulse inception is always related to certain discrete points, i.e., points of network defects or the intersection (which also denotes a defect in the network). It is likely that the electrode itself denotes a veritable defect in the network. At the point of pulse inception, the packing is completely flooded. At higher velocities, the liquid holdup drops again and the wetting is also incomplete. This can also explain why the wetting is lower in the lower section of the foam column.
The wetting fraction value reached higher wetting values in the upper part, while the wetting value fraction became lessened in the lower part of the column. One explanation could be related to the pulse flow structure: the point of the pulse formation and inception starts moving in the upper part of the column, then decreases in the lower part, as liquid pulses have a tendency to be attenuated as they move down the bed [36].
2.2. Effect of Pre-Wetting Mode
The experimental results are depicted in the aforementioned diagrams. In this section, important ideas on the effect of pre-wetting mode are discussed in more detail. To distinguish the effects of the different hydrodynamic states, Kan and Levec were employed as the upper and lower boundaries of pre-wetting, respectively. Comparisons between the two pre-wetting modes were made with three different foam densities.
For 10-ppi and 20-ppi foam density, the investigation into the wetting fraction in the upper and lower parts of the foam reactor was made for the whole range of gas and liquid velocities. The results illustrate insignificant deviation for both pre-wetting modes. Here, the initial liquid distribution can be employed as a possible explanation; using a spray nozzle distributor, a cross-section of the foam (cross-sectional) can be covered at the top of the packing by liquid, and consequently, can be wetted increasingly better with an increasing liquid velocity. Any change in pre-wetting mode will have no influence on the wetting.
The effect of flow morphology, however, becomes more significant with changes to the pulse flow regime with 25-ppi foam density. Here, the value of the wetting fraction for the Kan pre-wetting mode is significantly higher than the value with the Levec pre-wetting mode. A possible explanation can be related to liquid distribution, which gains a clear benefit from the Kan pre-wetting mode. The liquid starts pulsing with more interaction between the gas and the liquid phases. The film flow in the Kan pre-wetting mode provides a higher wetting fraction. In the rivulet flow in the Levec mode, the liquid aggregates due to surface tension forces, which lowers the free surface energy. The aggregation decreases the liquid–solid contact, resulting in a larger dry area, and consequently, a lower wetting fraction. These results were confirmed by Joubert et al. [26] for trickle-bed reactors.
In this experimental study, the pre-wetting effect was also indicated in the lower part of the foam reactor; thus, a higher wetting fraction value was also found at 0.3-m/s superficial gas velocity when applying the Kan pre-wetting mode, which can be explained with the contribution of the gas superficial velocity, and by the fact that the pre-wetting mode is related to the flow texture. The Kan mode is related to film flow, and the gas impact is negligible in this regime. Increasing the gas flow rate in film flow (Kan) caused strong gas–liquid interaction, and consequently, increasing wetting fraction. This result is comparable with the wetting investigation made by van Houwelingen et al. [37]. Both studies indicated enhancement in the wetting fraction with the application of the Kan pre-wetting mode in different particle-to-column-diameter ratios; this can be explained by the flow texture of film flow in the Kan pre-wetting mode.
2.3. Effect of Foam Density
A clear influence of foam density on the wetting fraction was indicated in this study. However, this effect is closely related to the effect of gas velocity and the appearing flow regime.
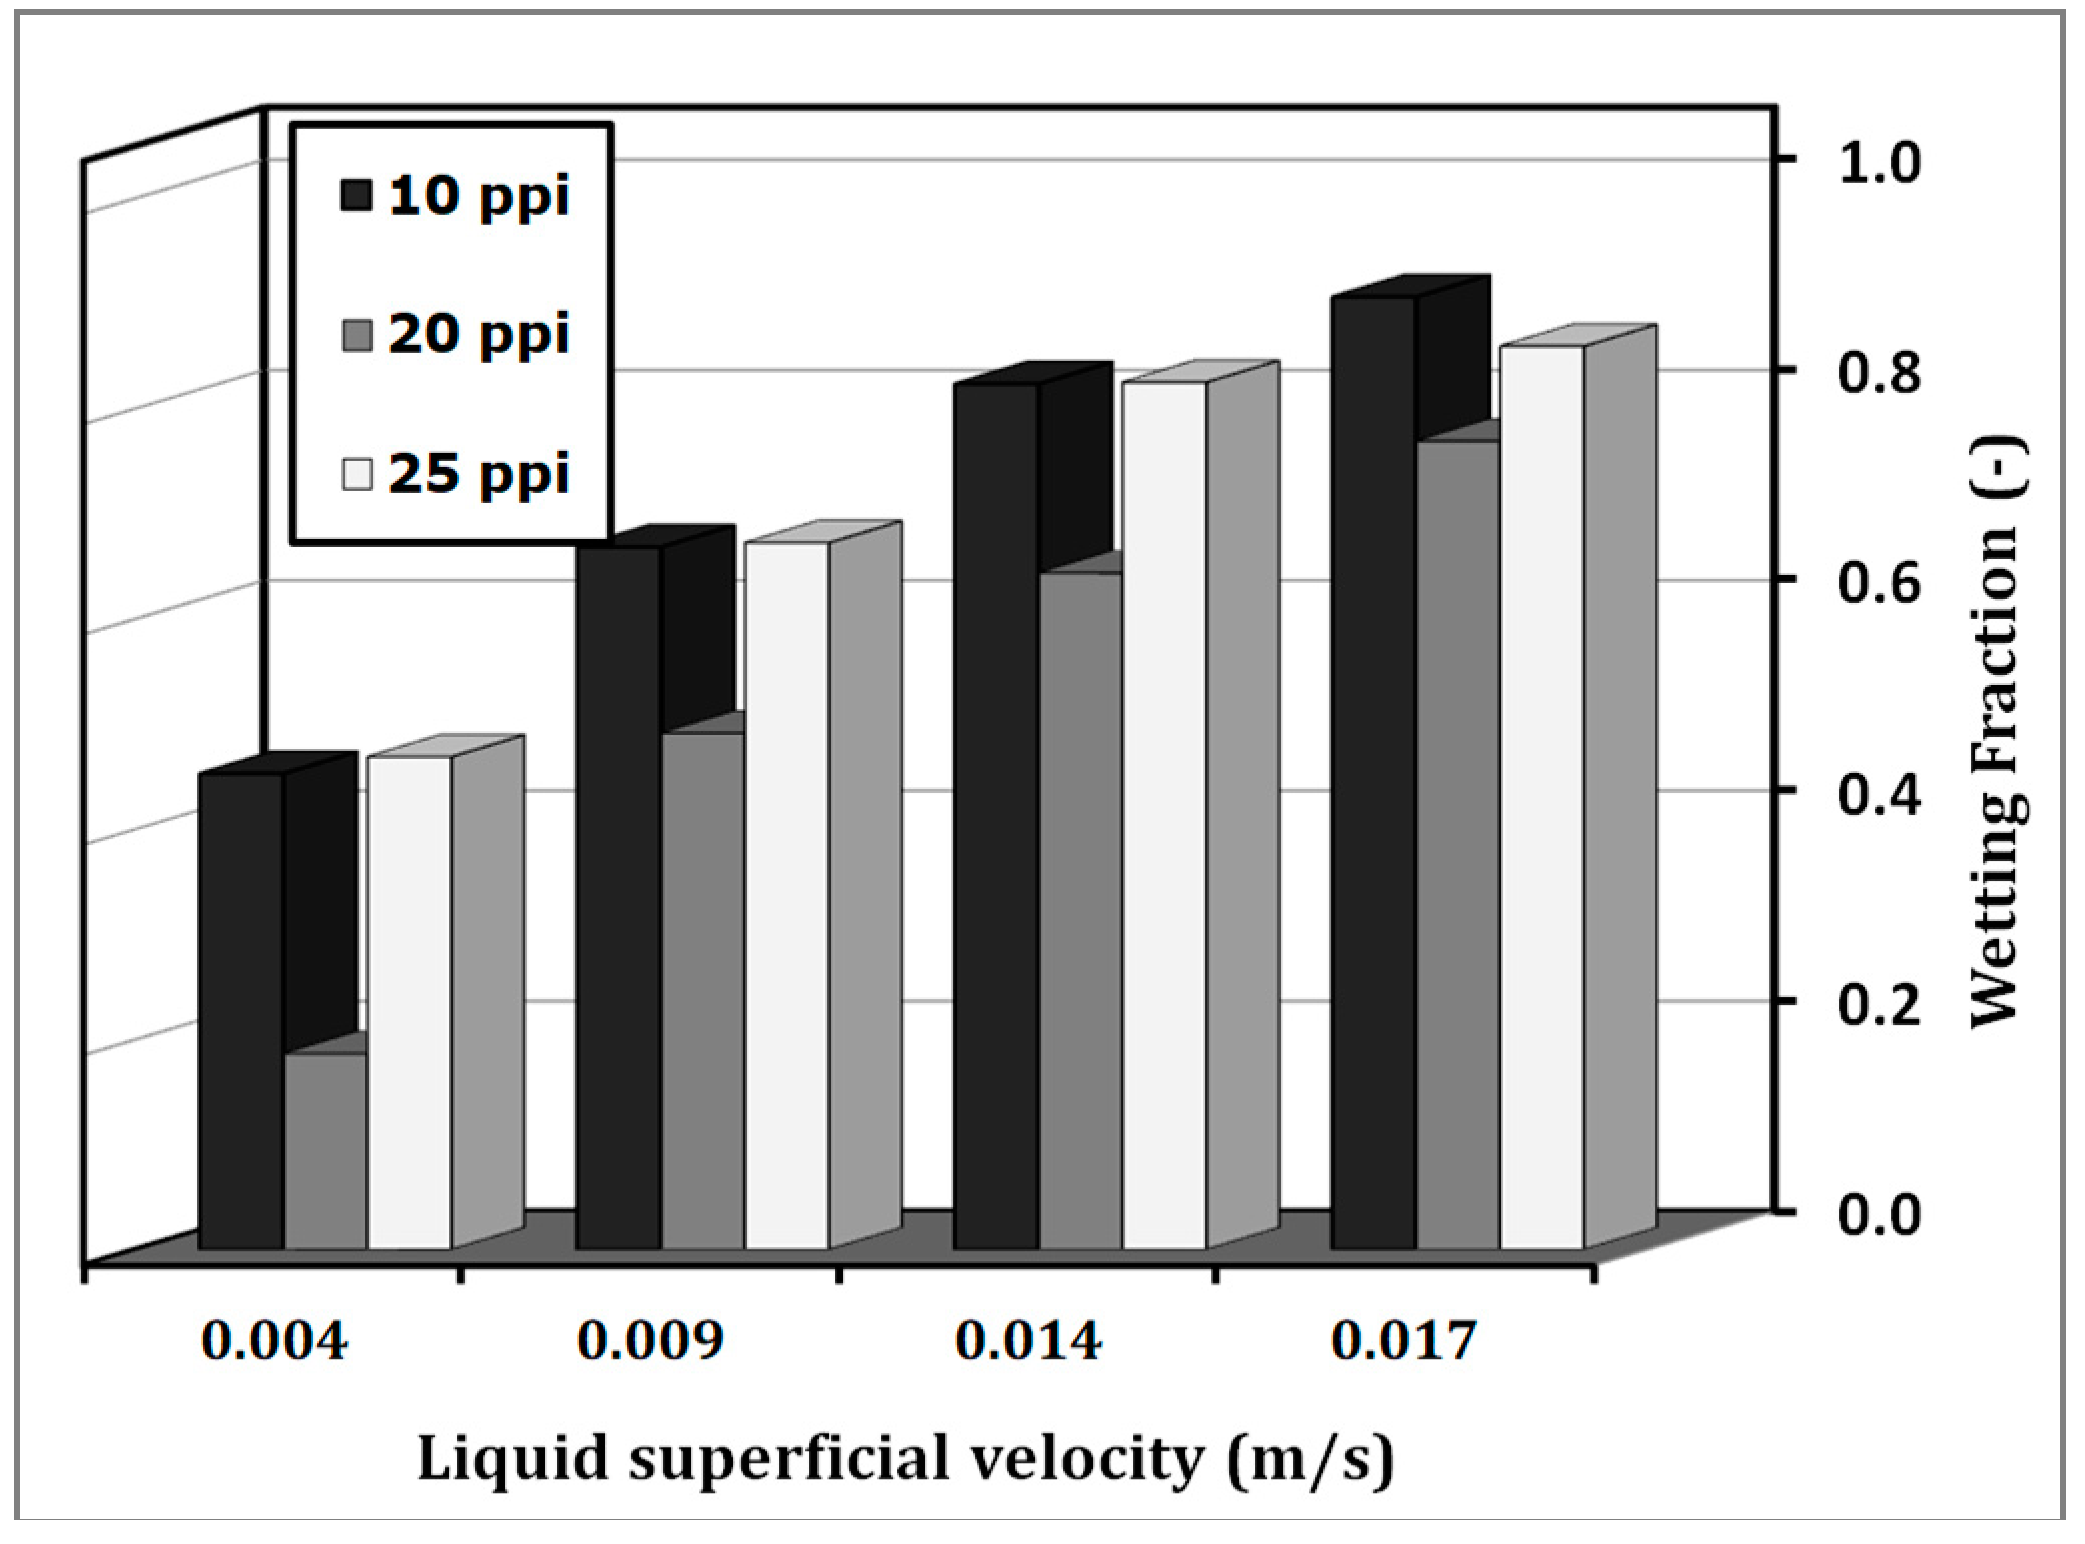
At a lower gas velocity (0.1 m/s) in the upper part of the packing, a much higher wetting fraction was indicated for 25 ppi, compared with 20 and 10 ppi, in the Levec pre-wetting mode. It can be assumed that the gas flow supports the aggregation of the liquid in rivulets. In other words, higher gas fluxes segregate channeled flows [35].
At higher gas velocities of 0.3 m/s, the wetting fraction was higher for 10-ppi foam than for 25-ppi foam in the pulse flow regime. Here, the effect of foam density can be explained with the capillary force, which is reverse to the window diameter. Therefore, in this case, the wetting value of lower foam density (10 ppi) will be higher, as indicated in Figure 4.
This is related to the high percentage of the dynamic wetting fraction, which is responsible for the residual wetted area according to Joubert et al. [26]. However, upon increasing the foam density, the capillary force is enhanced; this consequently causes a higher static wetting fraction (stagnant wetted areas form as a consequence of the accumulation of a part of the liquid in the total wetted area) and less residual wetting fractions (wetted areas where the liquid in contact with the foam solid surface is in well-irrigated zones within the total wetted area), which will lower the wetting fraction.
The same wetting phenomena was observed in trickle-bed reactors [6,26,38]. These studies refer to increases in the wetting fraction with decreases in particle diameter. The authors explained the improvement in wetting by relating it to the enhancement in radial mixing with decreasing particle diameter.
2.4. Effect of Liquid Distributors
The effect of liquid distributors was studied by applying three different distributor types: single-point and multi-point distributors, and a full-cone spray nozzle. The experimental results for the three distributors at two different packing positions and for two different pre-wetting modes are depicted in Figure 5.
It can be seen that the type of liquid distributor has a strong influence on the wetting fraction. A single-point distributor provides a much smaller wetting fraction compared to the multi-point distributor and the full-cone spray nozzle. A good initial distribution results in a higher wetting fraction. The pre-wetting mode has little influence on the wetting fraction in the upper position of the column. In the lower position of the column, the influence of the pre-wetting mode is much more pronounced. As shown, the Kan mode provided higher wetting fractions in this section. This can be related to the flow morphology of film flow which is associated with the Kan pre-wetting mode.
As the liquid flows and spreads across the foam packing, most of the foam is still covered with a liquid film, which retreats when the liquid flow rate is decreased. On the contrary, most of the surface stays dry in the Levec mode as the liquid is flowing in fixed rivulets covered with a continuous film. This finding was confirmed by investigation of the liquid holdup and the liquid distribution in foam packing [8,34].
2.5. Wetting Fraction Correlation and Comparison with Random Packing
A large and growing body of literatures deals with the investigation of wetting in multiphase packed bed reactors. In particular, trickle-bed reactors get special attention due to the effect of wetting fraction on the overall reactor performance and reactor safety. The phenomena are mainly described by correlating equations reflecting experimental data [6,16,20,29,39,40]. This work shows, however, that available correlations are not applicable to predict the wetting fraction of solid foam packing. The reason is the different morphological structures of both beds.
Based on the experimental data of this study and dimension analysis, a new correlation for the prediction of the wetting fraction is proposed (see Equation (1)). The correlation considers the gas and liquid Reynolds number, foam geometrical properties (window diameter, specific surface area, and porosity), as well as the liquid Weber number.
where the terms are defined as follows:
| a, b, c, d, and e | Coefficient and exponents for empirical correlation |
| uL m/s | Liquid superficial velocity |
| uG m/s | Gas superficial velocity |
| g m/s2 | Acceleration due to gravity |
| dw m | Window (pore)diameter |
| as 1/m | Specific surface area |
| Modified liquid Reynolds number, (ρLuLdW/µL) | |
| Modified gas Reynolds number, (ρGuGdW/µG) | |
| WeL | Modified liquid Weber number, (ρLuL2gdW/(ρL(1−ε))) |
| ε | Porosity |
| µ Pa·s | Viscosity |
| ρ kg/m3 | Density |
| φ | Wetting fraction |
The coefficient and exponents of the correlation (a–e) were determined using the nonlinear least-squares method (STATISTICA 10.0) to fit the experimental data.
The correlation is based on experimental data obtained for the Levec pre-wetting since it is the most popular operating mode. Additionally, the transition from trickle flow (10- and 20-ppi foam) to pulse flow (25-ppi foam) was considered in the proposed correlation. The estimated coefficient and exponents are summarized in Table 1.
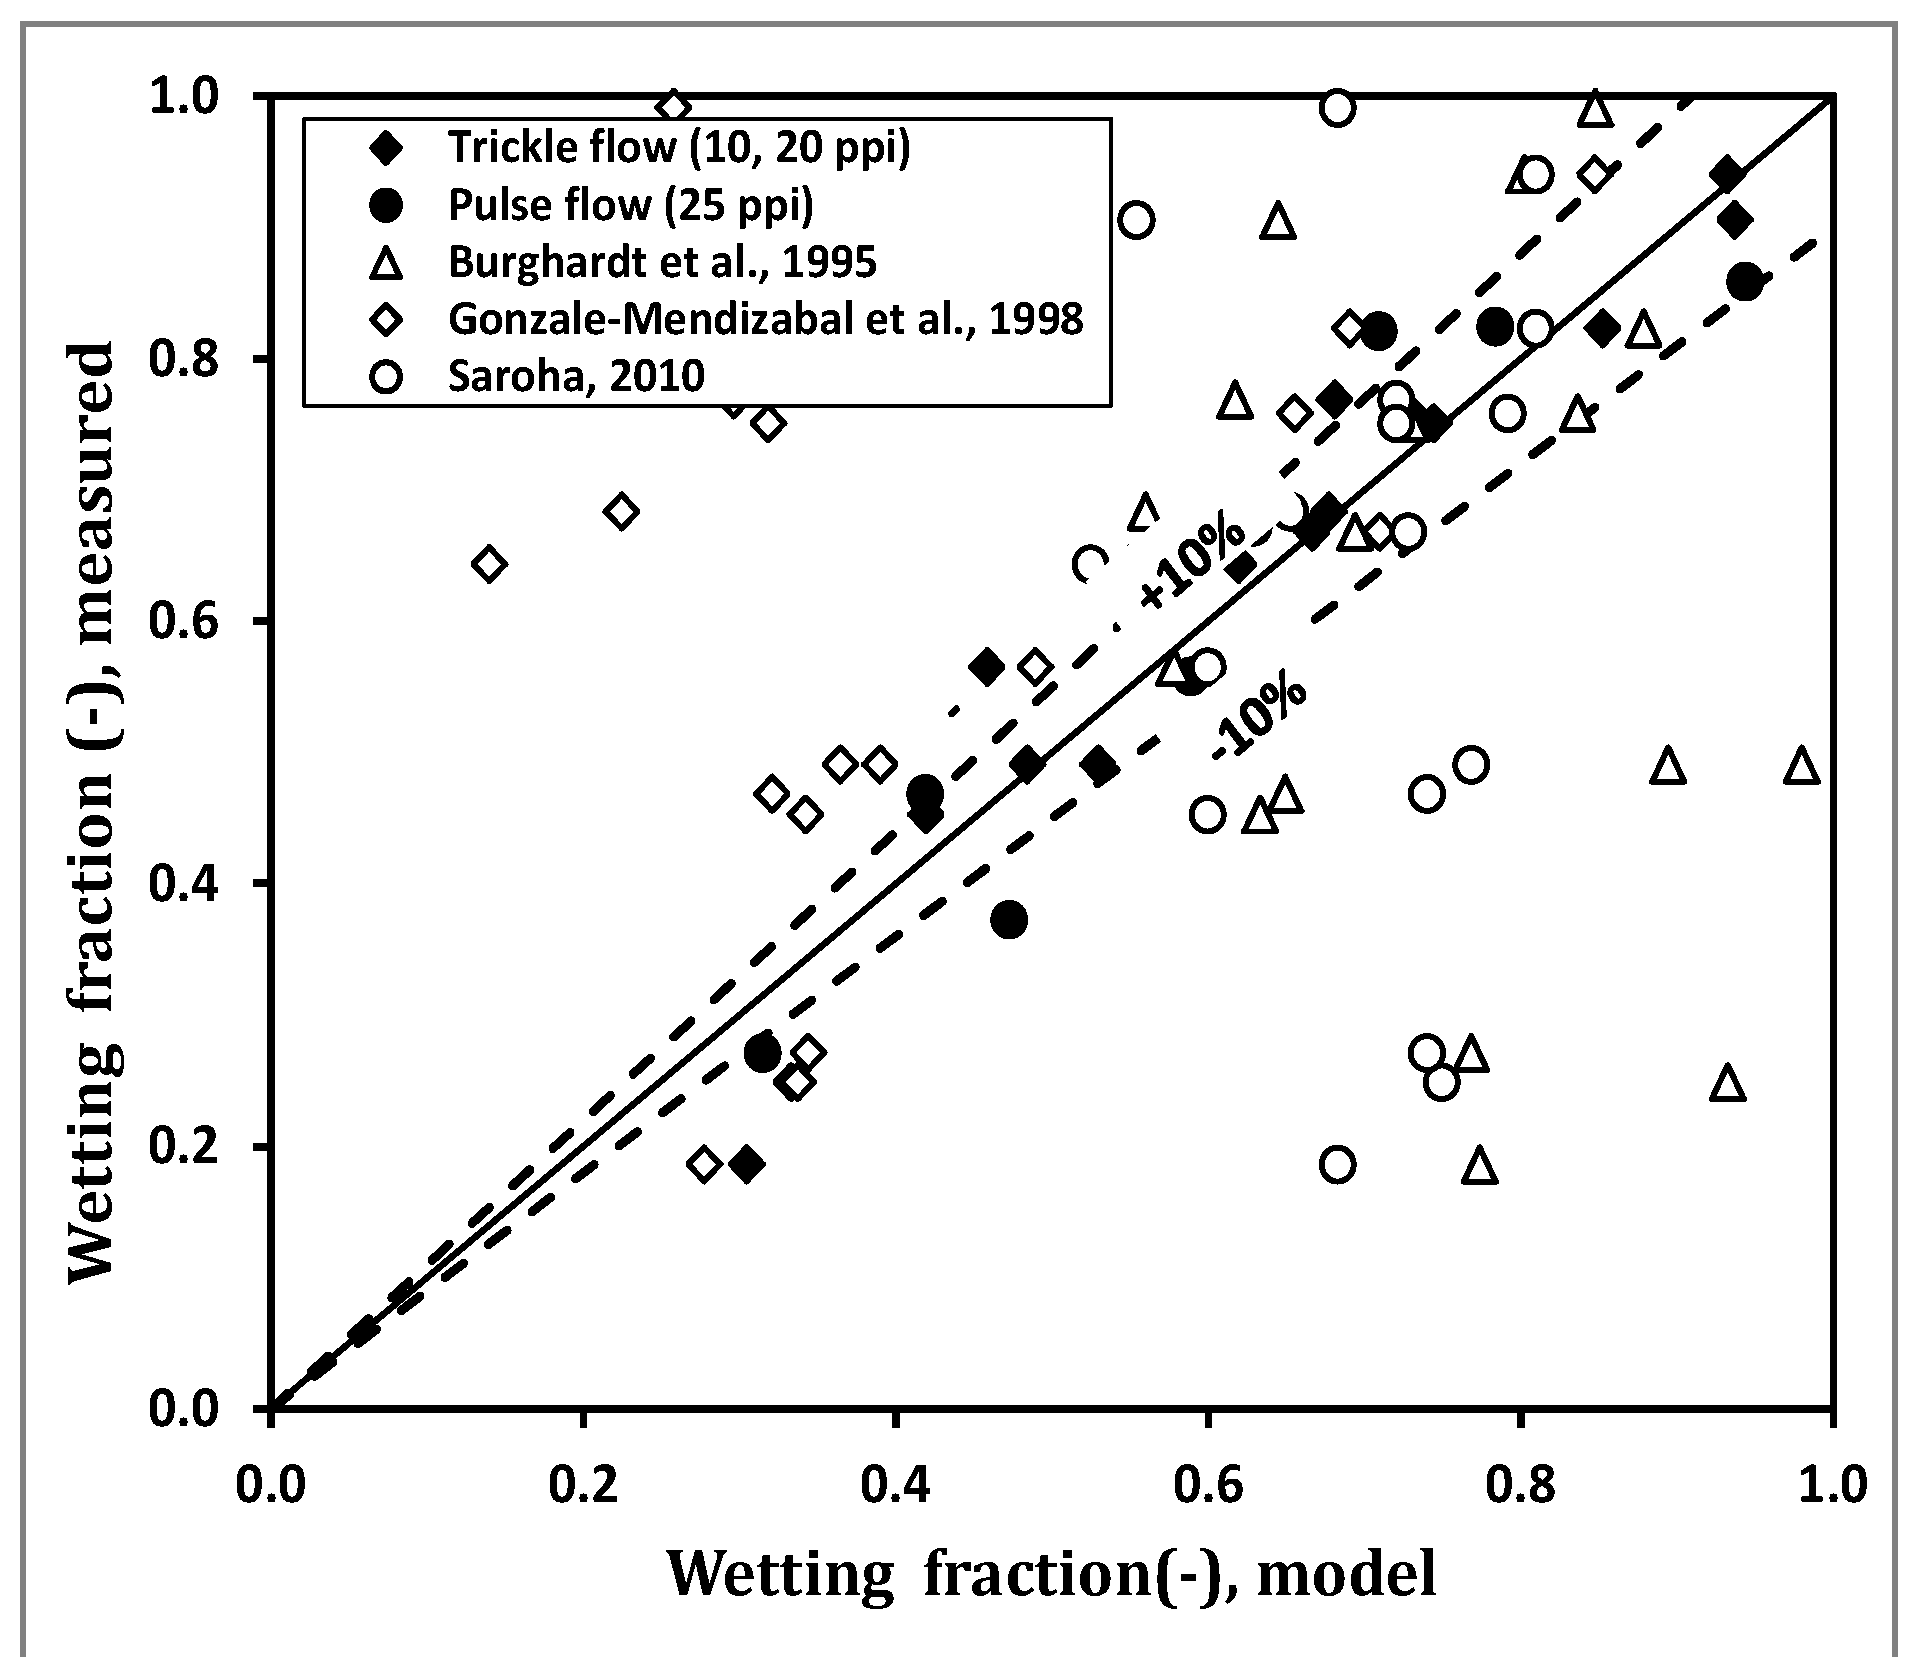
Figure 6 is a parity plot of the experimental data and the predictions from Equation (1). The figure shows good agreement between the experimental and predicted wetting fraction; the average error (R2) was less than 10%. Additionally, the figure shows data derived from trickle-bed reactors from References [6,29,39,40].
It is demonstrated clearly that available correlations for trickle-bed reactors are not suitable to predict the wetting fraction in foam packing.
3. Materials and Methods
A novel electrochemical method used for measuring effective liquid–solid mass transfer for reactors with foam packing [9] was developed to measure the wetting of the foam after calibration, as described below.
3.1. Method and Calibration
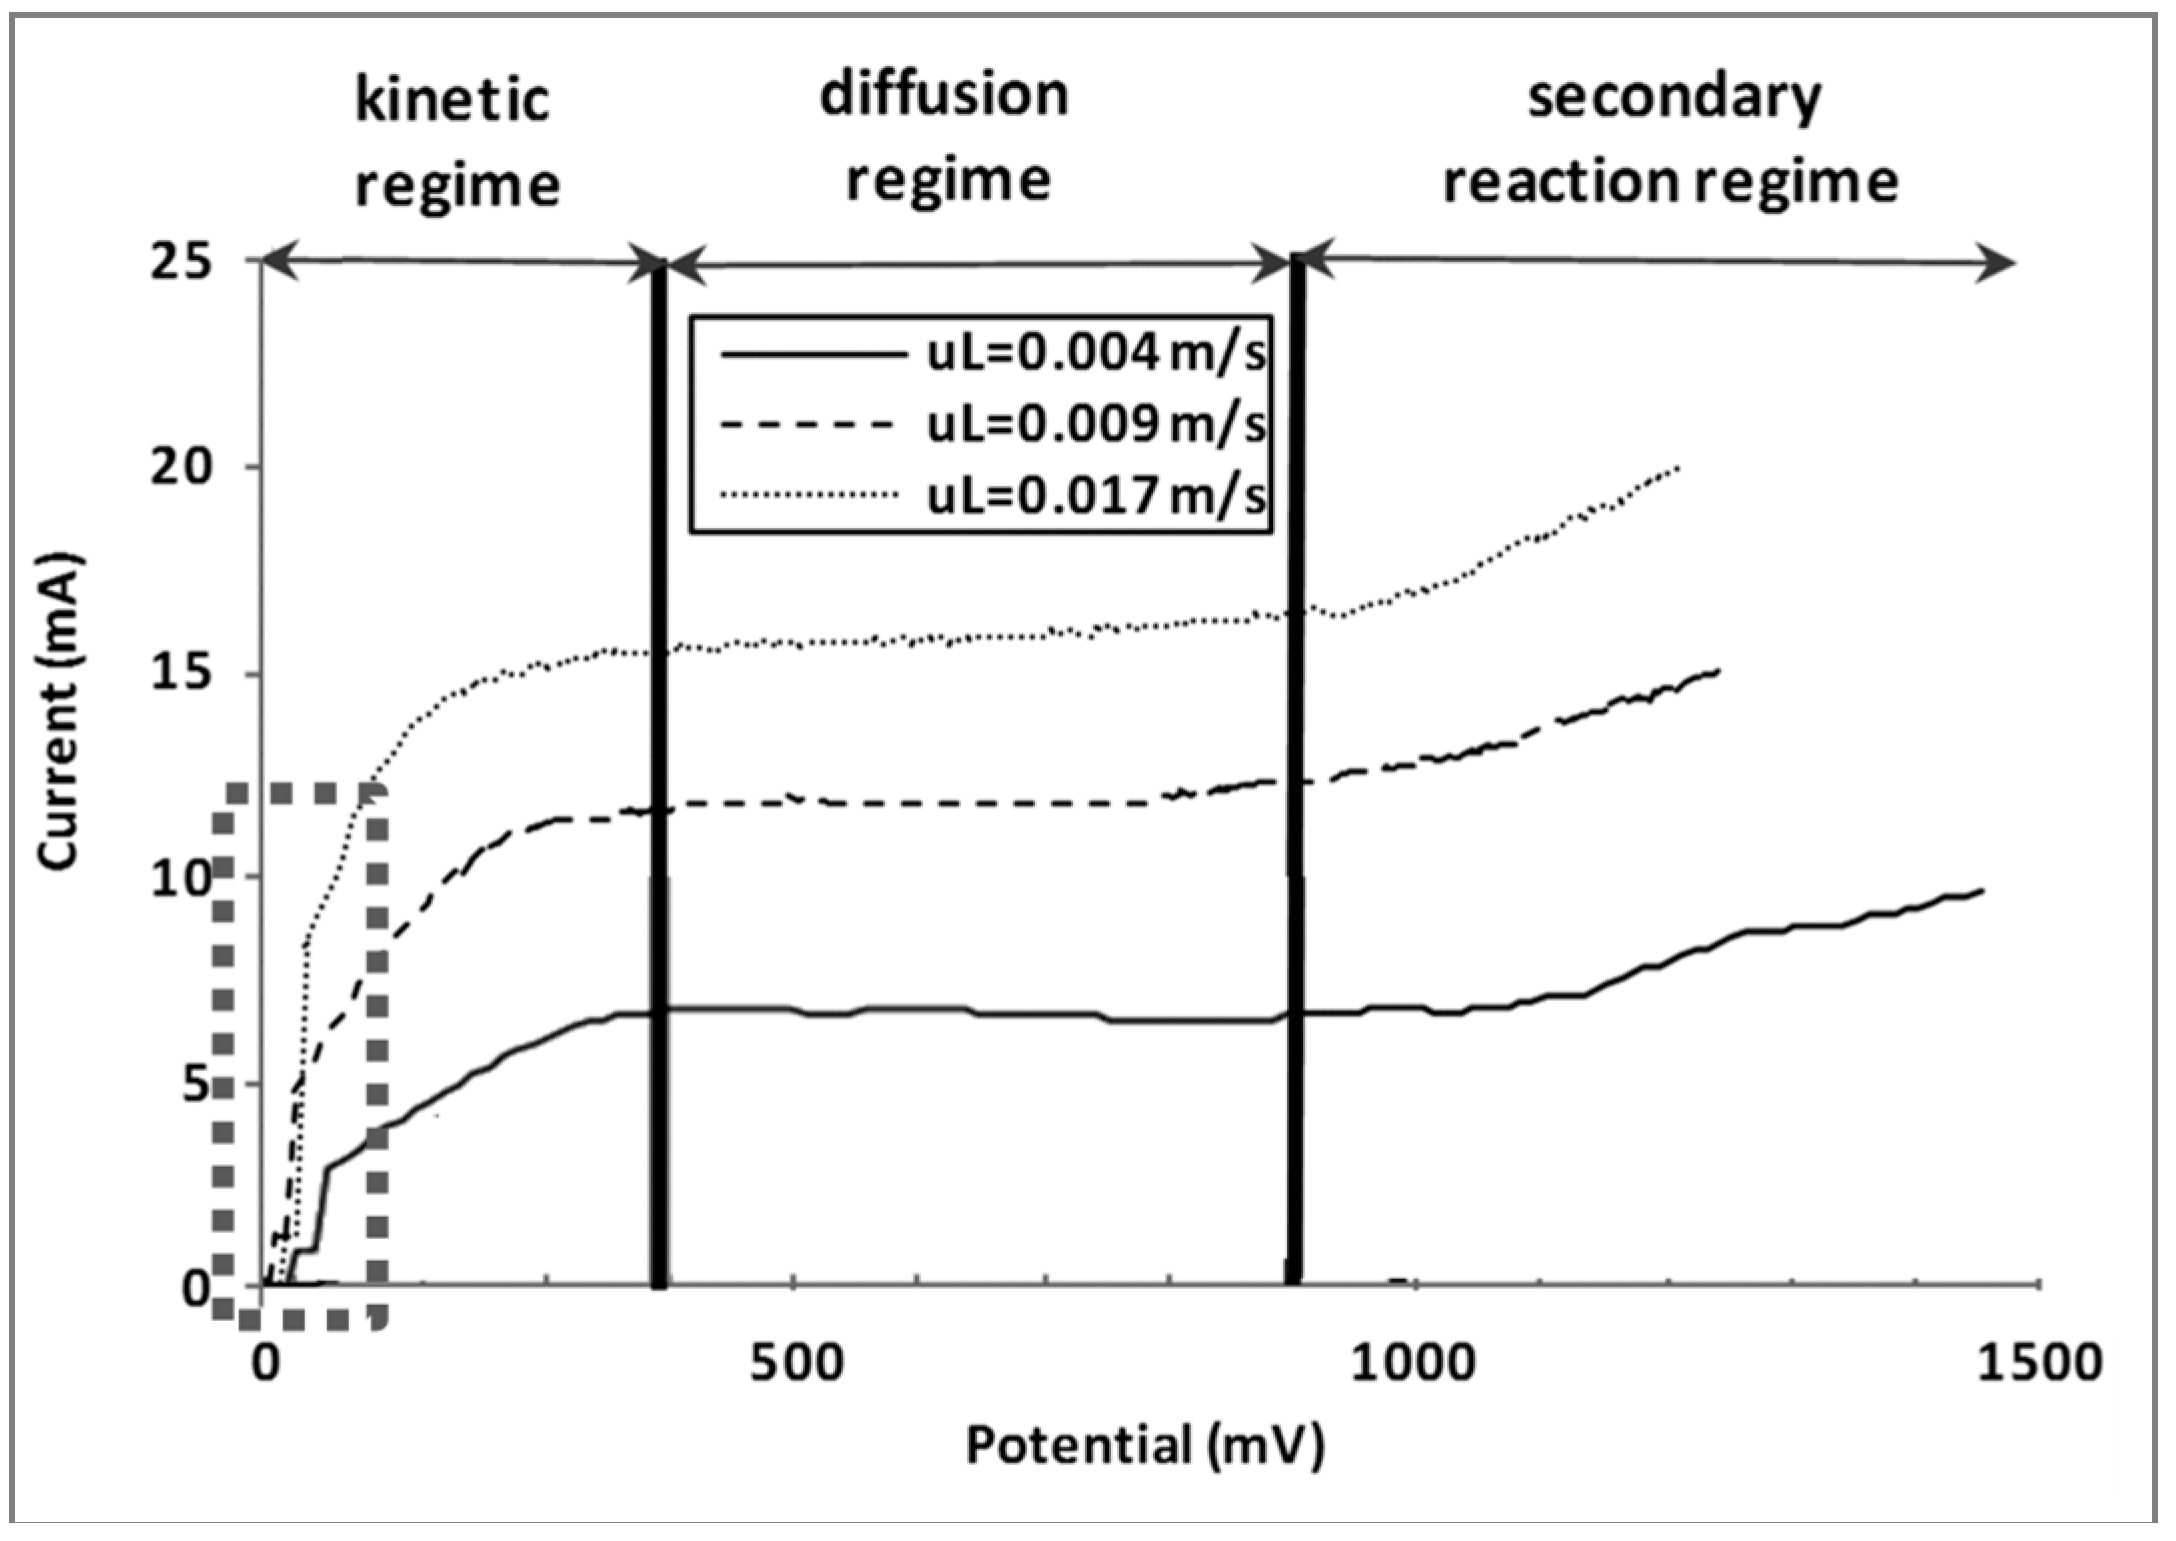
The method is based on the application of low electrical potential in an electrochemical reaction where the reaction accrues in the kinetic regime, as depicted in Figure 7. The reaction rate of the electrochemical conversion in this region is kinetically limited, compared to the liquid-phase chemical reaction under reaction limited conditions, based on Reference [26]. The calibration was carried out in flooding conditions where the superficial velocity had no effect on the reaction rate. According to Ohm’s law, the measured current is proportional to the electric potential difference, which is impressed across its ends, while it is inversely proportional to the total resistance, which is provided by the external circuit. Using this law, the wetted area available for the reaction can be calculated.
Liquid downflow mode with complete flooding of the bed resulted in full wetting of the foam surface and provided a wetting fraction of 1, although in the beginning, the foams require some elevated liquid flow rate before the start of flooding. However, as soon as flooding is achieved, the foams become independent of the liquid superficial velocity, and the flow is fully developed. This value was used in order to identify the necessary voltage where the mass transfer is negligible. In this experimental work, 30 mV was observed for superficial liquid velocities in the range of 2–15 mm/s, which means that at potentials <30 mV, the current is independent of superficial liquid velocity (no external mass transfer limitation). Hence, a voltage of 20 mV was used for all the wetting fraction measurements with different foams.
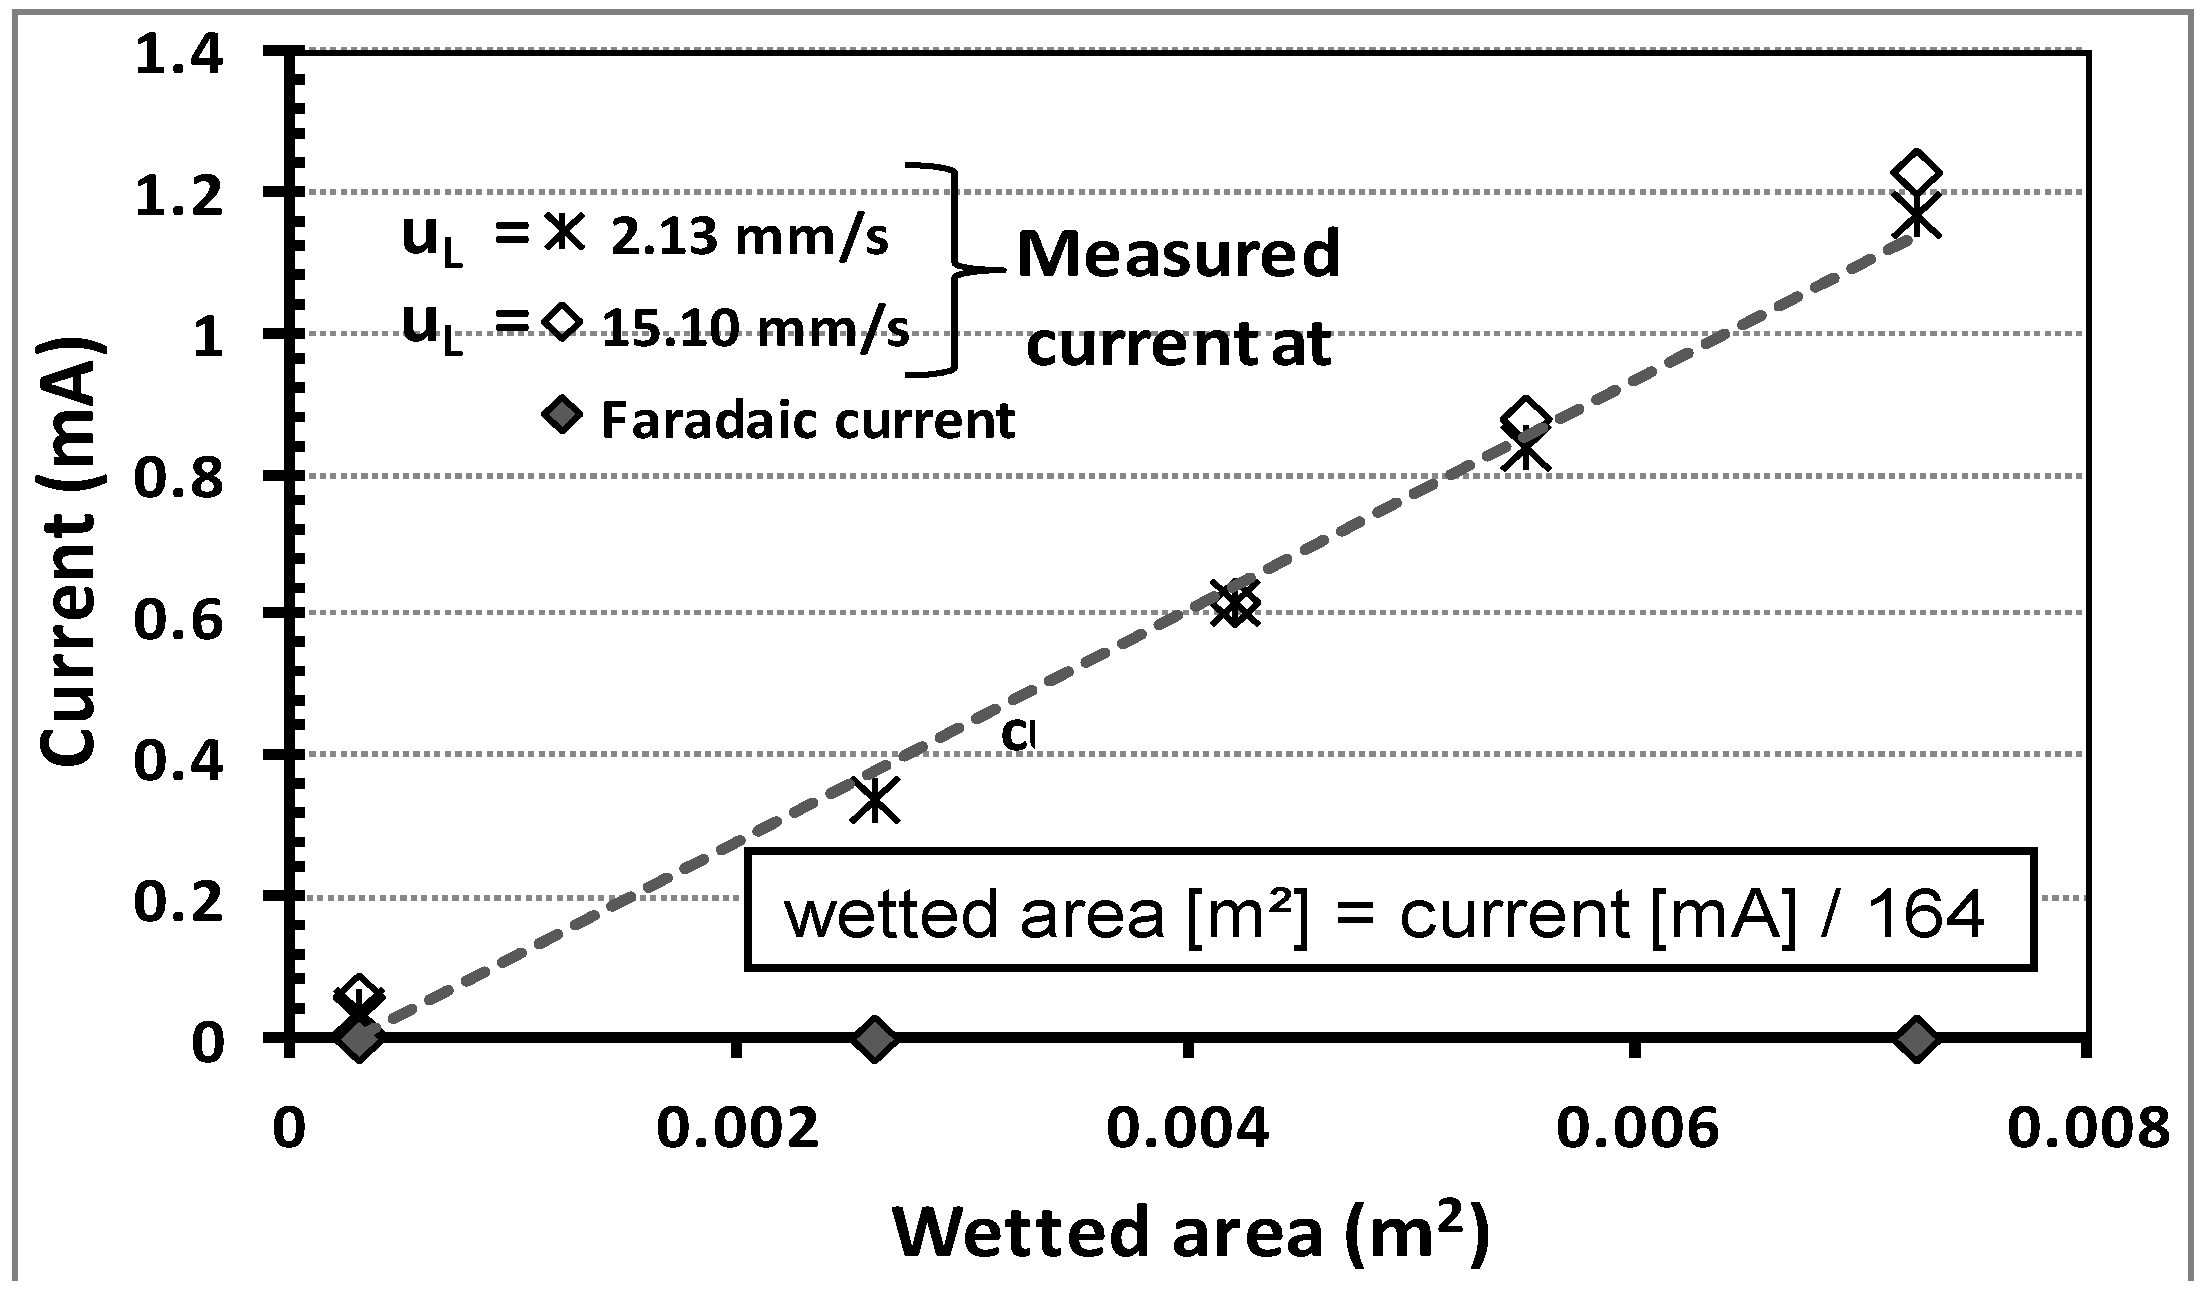
Following this, the measured current at 20 mV was compared to the area available for the electrochemical reaction, which represents the complete surface area of the foam. In the beginning of the experiments, a calibration curve was measured using foam samples of different surface areas.
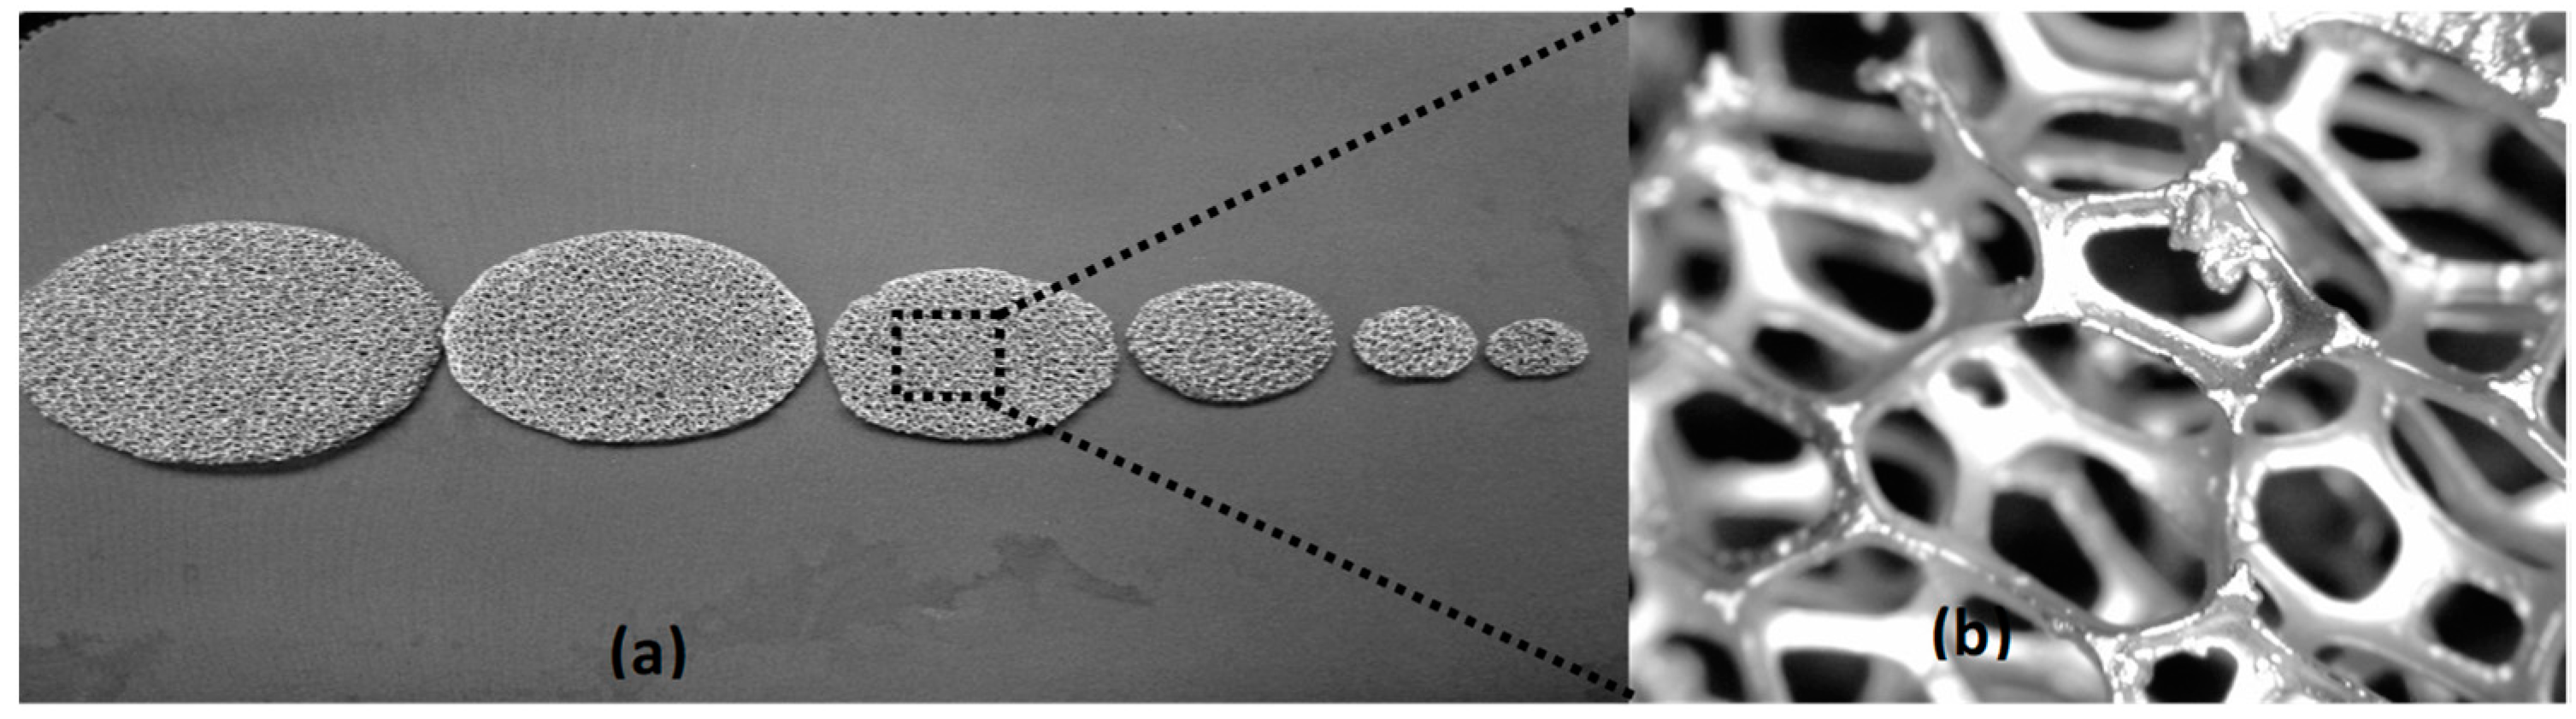
The nickel foam discs applied are depicted in Figure 8. With this arrangement, it was possible to mimic different wetted areas under flooding conditions with the nickel-disc diameter. Each nickel disc under flooding conditions provided an area-specific current. This value was used to build a calibration curve between the measured current and the wetted area. Later, these data were used to calculate the wetting fraction at different operational conditions independent of the foam density.
Figure 9 shows the calibration curve of the measured current and cathode area for 25-ppi foam. It is important to note that the current measurements almost coincide for the minimum and maximum velocities (see Figure 9). In our measurements, no effect of faradaic current (current resulting from the electrochemical activities associated with the redox reaction) was observed; although repeating measurements with 1 M NaOH solution, as recommended by Joubert et al. [26], were performed to test for undesired effects of faradaic current. As a result, no influence was measured. This can be explained by the high porosity and high surface area of our nickel foam [41,42].
3.2. Experimental Set-Up and Conditions
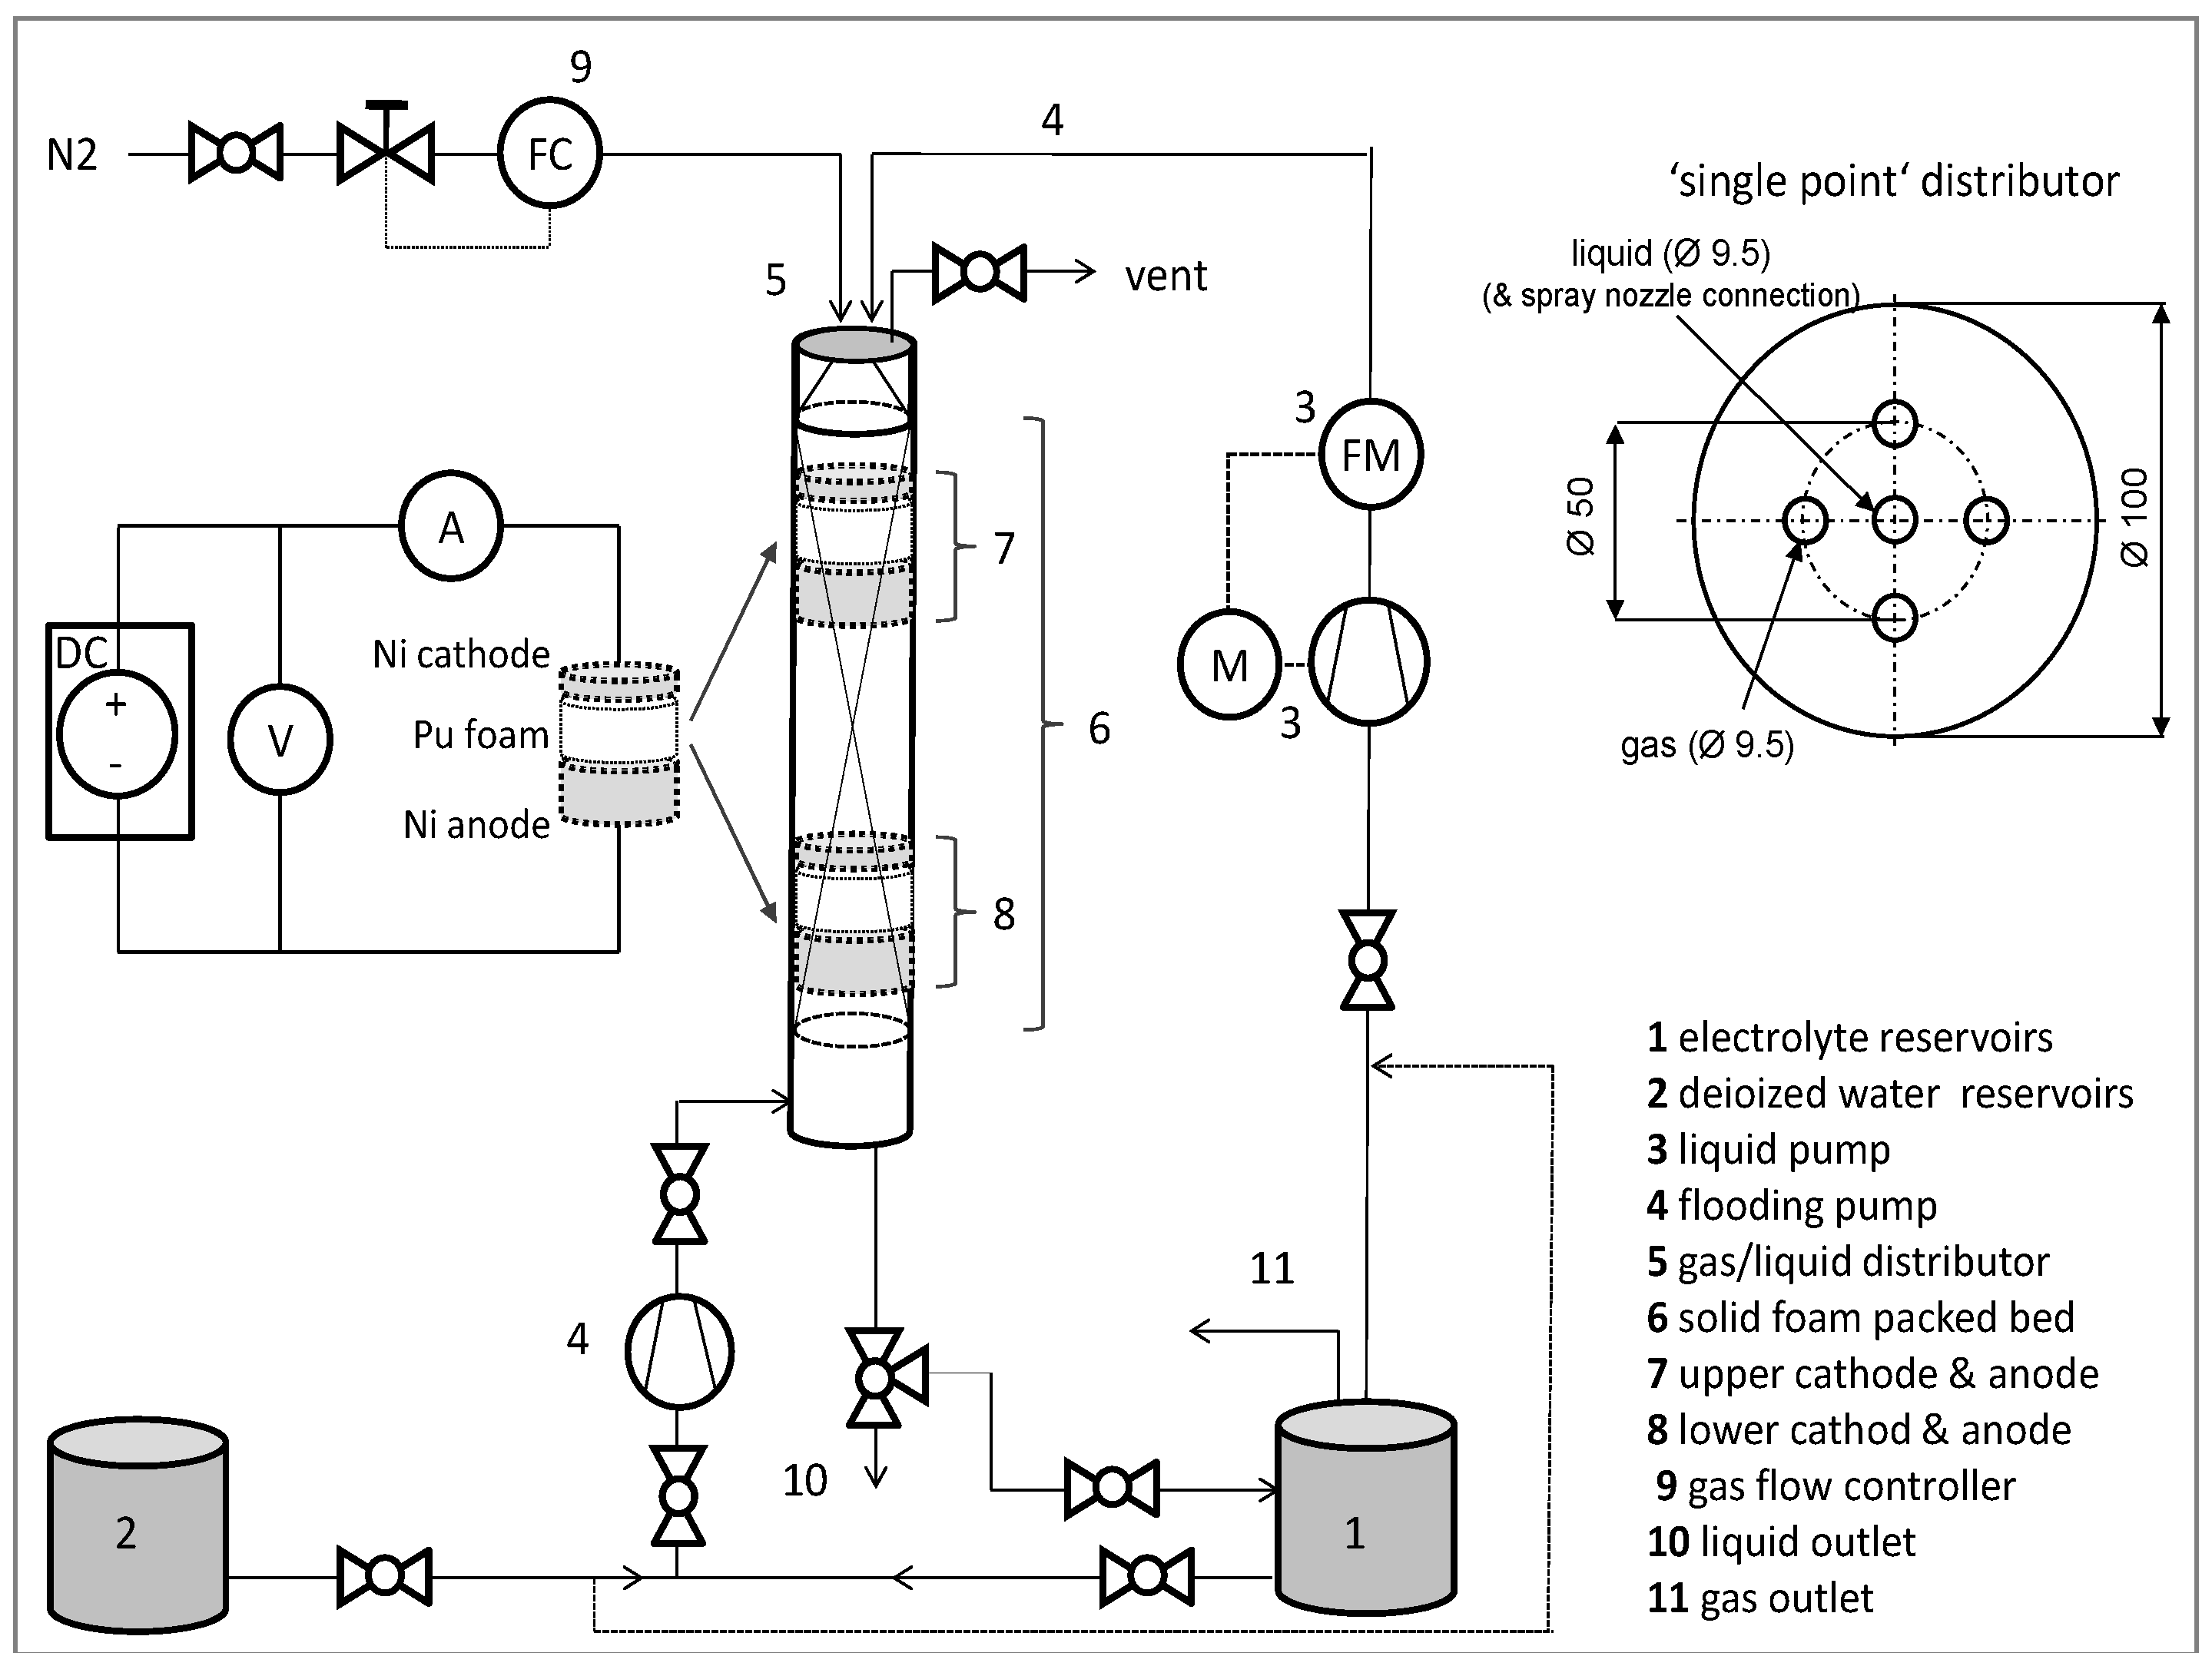
The electrolyte solution (0.02 M K4Fe (CN)6 + 0.003 M K3Fe(CN)6 + 1 M NaOH) was used as the liquid phase, and N2 was used as the gas phase; the wetting fraction measurements were carried out at H1 = 20 cm and at H2 = 100 cm. The influence of the initial distribution on the wetting fraction was investigated with three different liquid distributors: single-point and multi-point distributors, and a spray nozzle. Oxidation occurred at the anode (A), while reduction (reverse reaction) occurred at the cathode (B):
- (A)
- ;
- (B)
- .
Thus, a “co-current-flow” configuration with the cathode and anode stacked at different axial positions [26,43,44] between polyurethane foam blocks was chosen. To minimize the ohmic potential drop, the electrodes were installed above and below one polyurethane foam block 100 mm in height. The anode was located downstream of the cathode in order to diminish the current interference effect at the cathode, as well as to prevent increasing ion bulk concentration due to convective transport of the ferricyanide ions from the anode reaction [45,46]. All chemicals used were of analytical grade supplied by Sigma-Aldrich (Munich, Bavaria, Germany) (now Merk).
Thus, nickel foams (99% purity, provided by Alantum Europe GmbH (Munich, Bavaria, Germany) with different foam pore densities were used in the present study to act as cathode and anode electrodes. The nickel cathodes for each foam pore density consisted of cylindrical foam sheets of 100 mm in diameter. To attain reliable results, the nickel foam has to provide similar morphological properties to the solid foam packing. Since the deviations between nickel and polyurethane (PU) foam morphological properties are no more than approximately 10% (Table 2), reliable mass transfer data and wetting fraction data for the packing can be expected using these nickel foams [9]. Figure 10 shows the experimental set-up with details of the chemical cell.
The cathode was located at two different axial positions in the solid foam packing at H1 = 20 cm and H2 = 100 cm downstream of the top of the packing (Table 3), which correspond to length-to-diameter ratios of 2 and 10, respectively. This configuration was used to study the effect of flow evolution along the reactor axis on the liquid–solid mass transfer depending on pre-wetting mode and distributor type.
4. Conclusions
A novel experimental method for implementing electrochemical reactions to measure wetting fraction was developed. The method is based on applying low voltage employed in the kinetic region of an electrochemical reaction in order to calculate the wetted area. The method was performed successfully to obtain the wetting fraction; in particular, it was applied for investigating the local wetting fractions at two different axial bed positions with both Levec and Kan pre-wetting modes.
The wetting fraction in polyurethane foams with pore densities of 10, 20, and 25 ppi was studied in a tubular reactor operated in co-current downflow of gas and liquid. It was shown experimentally that the wetting behavior is significantly affected by the superficial liquid velocity, the pre-wetting mode, and the liquid distributor type. Furthermore, the wetting fraction changed along the packing length. In the upper part of the packing, the pre-wetting mode had only slight effects on the wetting fraction; whereas in the lower part of the packing, the Kan mode resulted in remarkably higher wetting fractions compared to the Levec mode. A distinctive formation of upper and lower branches was found for the wetting in Levec and Kan modes, which also depends strongly on gas and liquid superficial velocity, as well as on axial position in the column and the foam pore density. At a foam density of 25 ppi, it was found that the pulse flow regime improves the wetting fraction. At high superficial liquid velocities, almost complete wetting was obtained. A new correlation is proposed to predict the wetting fraction depending on the gas and liquid superficial velocities, the gas and liquid properties, the foam properties, and flow regime considerations. The local measurements of wetting at two axial positions in the foam packing for three different distributors revealed that the initial liquid distribution is important. To obtain a good liquid distribution, the application of a full-cone spray nozzle is suggested.
Author Contributions
Conceptualization, I.M.; Methodology, I.M.; Software, I.M. and U.H.; Investigation, I.M.; Writing—Original Draft, I.M.; Writing—Review & Editing, I.M. and U.H.; Funding Acquisition, U.H.; Resources, I.M. and U.H.; Supervision, U.H.; Data Curation, I.M.; Visualization, I.M.
Acknowledgments
The authors acknowledge Alantum Europe GmbH and Fraunhofer-Institut IFAM for supplying the nickel foam. Authors appreciate the valuable discussion with Johannes Zalucky and the language editing by Jessica Buskirk. The author Iman Mohammed acknowledges the Graduate Academy of the Technische Universität Dresden and DAAD for the scholarship during the research period.
Conflicts of Interest
The authors declare no conflict of interest.
References
- Grosse, J.; Kind, M. Hydrodynamics of ceramic sponges in countercurrent flow. Ind. Eng. Chem. Res. 2011, 50, 4631–4640. [Google Scholar] [CrossRef]
- Stemmet, C.P.; Jongmans, J.N.; van der Schaaf, J.; Kuster, B.F.M.; Schouten, J.C. Hydrodynamics of gas–liquid counter-current flow in solid foam packings. Chem. Eng. Sci. 2005, 60, 6422–6429. [Google Scholar] [CrossRef]
- Ranade, V.; Chaudhari, R.V.; Gunjal, P.R. Trickel Bed Reactor: Reactor Engineering & Application, 1st ed.; Elsevier: Oxford, UK, 2011. [Google Scholar]
- Van Houwelingen, A.J.; van der Merwe, W.; Wales, N.; Heydenrych, M.; Nicol, W. The effect of hydrodynamic multiplicity on liquid phase trickle flow axial dispersion. Chem. Eng. Res. Des. 2009, 87, 677–683. [Google Scholar] [CrossRef]
- Nicol, W.; Joubert, R. Liquid–solid mass transfer distributions in trickle bed reactors. Chem. Eng. J. 2013, 230, 361–366. [Google Scholar] [CrossRef] [Green Version]
- Cheng, Z.-M.; Kong, X.-M.; Zhu, J.; Wang, Z.-Y.; Jin, J.; Huang, Z.-B. Hydrodynamic modeling on the external liquid-solid wetting efficiency in a trickling flow reactor. AIChE J. 2012, 59, 283–294. [Google Scholar] [CrossRef]
- Calvo, S.; Beugre, D.; Crine, M.; Léonard, A.; Marchot, P.; Toye, D. Phase distribution measurements in metallic foam packing using x-ray radiography and micro-tomography. Chem. Eng. Process. Process Intensif. 2009, 48, 1030–1039. [Google Scholar] [CrossRef]
- Mohammed, I.; Bauer, T.; Schubert, M.; Lange, R. Hydrodynamic multiplicity in a tubular reactor with solid foam packings. Chem. Eng. J. 2013, 231, 334–344. [Google Scholar] [CrossRef]
- Mohammed, I.; Bauer, T.; Schubert, M.; Lange, R. Liquid–solid mass transfer in a tubular reactor with solid foam packings. Chem. Eng. Sci. 2014, 108, 223–232. [Google Scholar] [CrossRef]
- Zalucky, J.; Wagner, M.; Schubert, M.; Lange, R.; Hampel, U. Hydrodynamics of descending gas-liquid flows in solid foams: Liquid holdup, multiphase pressure drop and radial dispersion. Chem. Eng. Sci. 2017, 68, 480–494. [Google Scholar] [CrossRef]
- Atkinson, B.; abdel-Rahman-Ali, M.E. Wetted area, slime thickness and liquid phase mass transfer in a packed bed biological film reactor (trickling filter). Chem. Eng. Res. Des. 1976, 54, 239–250. [Google Scholar]
- IKEDA, T.; KOTANI, K.; MAEDA, Y.; KOHNO, H. Preliminary study on application of x-ray ct scanner to measurement of void fractions in steady state two-phase flows. J. Nucl. Sci. Technol. 1983, 20, 1–12. [Google Scholar] [CrossRef]
- Toye, D.; Marchot, P.; Crine, M.; L’Homme, G. Modelling of multiphase flow in packed beds by computer-assisted x-ray tomography. Meas. Sci. Technol. 1996, 7, 436–443. [Google Scholar] [CrossRef]
- Gladden, L.F.; Lim, M.H.M.; Mantle, M.D.; Sederman, A.J.; Stitt, E.H. Mri visualisation of two-phase flow in structured supports and trickle-bed reactors. Catal. Today 2003, 79–80, 203–210. [Google Scholar] [CrossRef]
- Heindel, T.J. A review of x-ray flow visualization with applications to multiphase flows. J. Fluids Eng. 2011, 133, 074001. [Google Scholar] [CrossRef]
- Mills, P.L.; Duduković, M.P. Analysis of catalyst effectiveness in trickle-bed reactors processing volatile or nonvolatile reactants. Chem. Eng. Sci. 1980, 35, 2267–2279. [Google Scholar] [CrossRef]
- Mills, P.L.; Erk, H.F.; Evans, J.; Duduković, M.P. Some comments on models for evaluation of catalyst effectiveness factors in trickle-bed reactors. Chem. Eng. Sci. 1981, 36, 947–950. [Google Scholar] [CrossRef]
- Colombo, A.J.; Baldi, G.; Sicardi, S. Solid-liquid contacting effectiveness in trickle bed reactors. Chem. Eng. Sci. 1976, 31, 1101–1108. [Google Scholar] [CrossRef]
- Ramachandran, P.A.; Duduković, M.P.; Mills, P.L. A new model for assessment of external liquid-solid contacting in trickle-bed reactors from tracer response measurements. Chem. Eng. Sci. 1986, 41, 855–860. [Google Scholar] [CrossRef]
- Al-Dahhan, M.H.; Duduković, M.P. Catalyst wetting efficiency in trickle-bed reactors at high pressure. Chem. Eng. Sci. 1995, 50, 2377–2389. [Google Scholar] [CrossRef]
- Al-Dahhan, M.; Highfill, W. Liquid holdup measurement techniques in laboratory high pressure trickle bed reactors. Can. J. Chem. Eng. 1999, 77, 759–765. [Google Scholar] [CrossRef]
- Lazzaroni, C.L.; Keselman, H.R.; Figoli, N.S. Colorimetric evaluation of the efficiency of liquid-solid contacting in trickle flow. Ind. Eng. Chem. Res. 1988, 27, 1132–1135. [Google Scholar] [CrossRef]
- Ravindra, P.V.; Rao, D.P.; Rao, M.S. Liquid flow texture in trickle-bed reactors: An experimental study. Ind. Eng. Chem. Res. 1997, 36, 5133–5145. [Google Scholar] [CrossRef]
- Baussaron, L.; Julcour-Lebigue, C.; Wilhelm, A.-M.; Boyer, C.; Delmas, H. Partial wetting in trickle bed reactors: Measurement techniques and global wetting efficiency. Ind. Eng. Chem. Res. 2007, 46, 8397–8405. [Google Scholar] [CrossRef]
- Llano, J.J.; Rosal, R.; Sastre, H.; Díez, F.V. Determination of wetting efficiency in trickle-bed reactors by a reaction method. Ind. Eng. Chem. Res. 1997, 36, 2616–2625. [Google Scholar] [CrossRef]
- Joubert, R.; Nicol, W. Trickle flow liquid-solid mass transfer and wetting efficiency in small diameter columns. Can. J. Chem. Eng. 2012, 91, 441–447. [Google Scholar] [CrossRef]
- Sederman, A.J.; Gladden, L.F. Magnetic resonance imaging as a quantitative probe of gas–liquid distribution and wetting efficiency in trickle-bed reactors. Chem. Eng. Sci. 2001, 56, 2615–2628. [Google Scholar] [CrossRef]
- Elhisnawi, A.A.; Duduković, M.P.; Mills, P.L. Trickle-Bed Reactors: Dynamic Tracer Tests, Reaction Studies, and Modeling of Reactor Performance. Chem. React. Eng. 1982, 421–440. [Google Scholar] [CrossRef]
- Burghardt, A.; Bartelmus, G.; Jaroszyński, M.; Kołodziej, A. Hydrodynamics and mass transfer in a three-phase fixed-bed reactor with cocurrent gas—Liquid downflow. Chem. Eng. J. Biochem. Eng. J. 1995, 58, 83–99. [Google Scholar] [CrossRef]
- Al-Dahhan, M.H.; Dudukovic´, M.P. Pressure drop and liquid holdup in high pressure trickle-bed reactors. Chem. Eng. Sci. 1994, 49, 5681–5698. [Google Scholar] [CrossRef]
- El-Hisnawi, A.A. Tracer and Reaction Studies in Trickle-Bed Reactors. Ph.D. Thesis, Washington University, St. Louis, MO, USA, 1981. [Google Scholar]
- Baussaron, L.; Julcour-Lebigue, C.; Wilhelm, A.-M.; Delmas, H.; Boyer, C. Wetting topology in trickle bed reactors. AIChE J. 2007, 53, 1850–1860. [Google Scholar] [CrossRef]
- Speccia, V.; Baldi, G.; Gianetto, A. Solid-liquid mass transfer in concurrent two-phase flow through packed beds. Ind. Eng. Chem. Process Des. Dev. 1978, 17, 362–367. [Google Scholar] [CrossRef]
- Mohammed, I.; Bauer, T.; Schubert, M.; Lange, R. Gas–liquid distribution in tubular reactors with solid foam packings. Chem. Eng. Process. Process Intensif. 2015, 88, 10–18. [Google Scholar] [CrossRef]
- Zalucky, J.; Möller, F.; Schubert, M.; Hampel, U. Flow regime transition in open-cell solid foam packed reactors: Adaption of the relative permeability concept and experimental validation. Ind. Eng. Chem. Res. 2015, 54, 9708–9721. [Google Scholar] [CrossRef]
- Boelhouwer, J.G.; Piepers, H.W.; Drinkenburg, A.A. Liquid-induced pulsing flow in trickle-bed reactors. Chem. Eng. Sci. 2002, 57, 3387–3399. [Google Scholar] [CrossRef]
- Van Houwelingen, A.J.; Kok, S.; Nicol, W. Effectiveness factors for partially wetted catalysts. Ind. Eng. Chem. Res. 2010, 49, 8114–8124. [Google Scholar] [CrossRef]
- Ruecker, C.M.; Akgerman, A. Determination of wetting efficiencies for a trickle-bed reactor at high temperatures and pressures. Ind. Eng. Chem. Res. 1987, 26, 164–166. [Google Scholar] [CrossRef]
- Saroha, A.K. Solid–liquid mass transfer studies in trickle bed reactors. Chem. Eng. Res. Des. 2010, 88, 744–747. [Google Scholar] [CrossRef]
- GONZÁLEZ-MENDIZABAL, D.; AGUILERA, M.E.; PIRONTI, F. Solid-liquid mass transfer and wetting factors in trickle bed reactors: Effect of the type of solid phase and the presence of chemical reaction. Chem. Eng. Commun. 1998, 169, 37–55. [Google Scholar] [CrossRef]
- Bard, A.J.; Faulkner, L.R. Electrochemical Methods: Fundamentals and Applications, 2nd ed.; John Wiley & Sons, Inc.: New York, NY, USA, 2000; pp. 1–864. [Google Scholar]
- Wang, J. Analytical Electrochemistry, 3rd ed.; J. Wiley & Sons Inc.: New York, NY, USA, 2006; Chapter 3; pp. 67–115. [Google Scholar]
- Chou, T.S.; Worley, F.L.; Luss, D. Local particle-liquid mass transfer fluctuations in mixed-phase cocurrent downflow through a fixed bed in the pulsing regime. Ind. Eng. Chem. Fundam. 1979, 18, 279–283. [Google Scholar] [CrossRef]
- Joubert, R.; Nicol, W. Multiplicity behavior of trickle flow liquid-solid mass transfer. Ind. Eng. Chem. Res. 2009, 48, 8387–8392. [Google Scholar] [CrossRef]
- Berger, F.P.; Ziai, A. Optimization of experimental conditions for electrochemical mass-transfer measurements. Chem. Eng. Res. Des. 1983, 61, 377–382. [Google Scholar]
- Gostick, J.; Doan, H.D.; Lohi, A.; Pritzker, M.D. Investigation of local mass transfer in a packed bed of pall rings using a limiting current technique. Ind. Eng. Chem. Res. 2003, 42, 3626–3634. [Google Scholar] [CrossRef]
Figure 1.
Wetting fraction for 10-ppi foam packing with different liquid velocities (a) at 0.1 m/s and (b) at 0.3 m/s gas velocity at two different positions using a spray nozzle distributor.
Figure 1.
Wetting fraction for 10-ppi foam packing with different liquid velocities (a) at 0.1 m/s and (b) at 0.3 m/s gas velocity at two different positions using a spray nozzle distributor.

Figure 2.
Wetting fraction for 20-ppi foam packing with various liquid velocities (a) at 0.1 m/s and (b) at 0.3 m/s gas velocity at two different positions using a spray nozzle distributor.
Figure 2.
Wetting fraction for 20-ppi foam packing with various liquid velocities (a) at 0.1 m/s and (b) at 0.3 m/s gas velocity at two different positions using a spray nozzle distributor.

Figure 3.
Wetting fraction for 25-ppi foam packing with various liquid velocities (a) at 0.1 m/s and (b) at 0.3 m/s gas velocity at two different positions using a spray nozzle distributor.
Figure 3.
Wetting fraction for 25-ppi foam packing with various liquid velocities (a) at 0.1 m/s and (b) at 0.3 m/s gas velocity at two different positions using a spray nozzle distributor.

Figure 4.
Effect of pore density on wetting fraction at 0.3-m/s gas velocity, and a foam height of 100 cm, when applying the Levec pre-wetting mode using a spray nozzle distributor.
Figure 4.
Effect of pore density on wetting fraction at 0.3-m/s gas velocity, and a foam height of 100 cm, when applying the Levec pre-wetting mode using a spray nozzle distributor.

Figure 5.
Wetting fraction for 10-ppi foam, at 0.1-m/s superficial gas velocity, at different axial positions and pre-wetting modes, with different liquid distributors: (a) spray nozzle, (b) multi-point distributor, and (c) single-point distributor.
Figure 5.
Wetting fraction for 10-ppi foam, at 0.1-m/s superficial gas velocity, at different axial positions and pre-wetting modes, with different liquid distributors: (a) spray nozzle, (b) multi-point distributor, and (c) single-point distributor.

Figure 6.
Measured data vs. predictions using Equation (1) and literature model (white symbols represent data from the literature and black symbols represent data from this study).
Figure 6.
Measured data vs. predictions using Equation (1) and literature model (white symbols represent data from the literature and black symbols represent data from this study).

Figure 7.
Area applicable for wetting measurements in diffusion curve for 25-ppi nickel foam.

Figure 8.
(a) Ni foam of different diameters used for the calibration; (b) zoomed image of the nickel foam.
Figure 8.
(a) Ni foam of different diameters used for the calibration; (b) zoomed image of the nickel foam.

Figure 9.
Calibration curve of measured current and foam cathode area.

Figure 10.
Experimental set-up with details of the chemical cell and the single point distributor.


Table 1.
Coefficient and exponents for wetting fraction correlation in Equation (1).
| Flow Regime | a | b | c | d | e | Correlation Coefficient (R2) |
|---|---|---|---|---|---|---|
| Trickle flow (10 and 20 ppi) | 0.174 | 0.334 | 0.0813 | −0.251 | 0.116 | 0.97 |
| Pulse flow (25 ppi) | 0.582 | −0.807 | −0.260 | −2.369 | 0.653 | 0.94 |
Table 2.
Polyurethane and nickel foam morphology properties used in this study.
| Polyurethane Foam Morphology | |||
| Foam Pore Density (ppi) | Porosity | Window Diameter (mm) | Specific Surface Area (m2/m3) |
| 10 | 0.97 | 1.92 | 514 |
| 20 | 0.96 | 1.43 | 731 |
| 25 | 0.95 | 1.18 | 962 |
| Nickel Foam Morphology | |||
| Foam Pore Density (ppi) | Porosity | Window Diameter (mm) | Specific Surface Area (m2/m3) |
| 10 | 0.97 | 1.93 | 524 |
| 20 | 0.96 | 1.22 | 690 |
| 25 | 0.94 | 0.96 | 1088 |
Table 3.
The investigation conditions applied in this work.
| Distributor | Single-Point/Multi-Point/Spray Nozzle | |
|---|---|---|
| Foam density | 10/20/25 ppi | |
| Pre-wetting mode | Levec | Kan |
| Gas/liquid | N2/electrolyte solution | 0.1–0.3 m/s gas velocity 0.0038–0.016 m/s liquid velocity |
© 2018 by the authors. Licensee MDPI, Basel, Switzerland. This article is an open access article distributed under the terms and conditions of the Creative Commons Attribution (CC BY) license (http://creativecommons.org/licenses/by/4.0/).
Share and Cite
MDPI and ACS Style
Mohammed, I.; Hampel, U. Wetting Fraction in a Tubular Reactor with Solid Foam Packing and Gas/Liquid Co-Current Downflow. Catalysts 2018, 8, 396. https://doi.org/10.3390/catal8090396
AMA Style
Mohammed I, Hampel U. Wetting Fraction in a Tubular Reactor with Solid Foam Packing and Gas/Liquid Co-Current Downflow. Catalysts. 2018; 8(9):396. https://doi.org/10.3390/catal8090396
Chicago/Turabian StyleMohammed, Iman, and Uwe Hampel. 2018. "Wetting Fraction in a Tubular Reactor with Solid Foam Packing and Gas/Liquid Co-Current Downflow" Catalysts 8, no. 9: 396. https://doi.org/10.3390/catal8090396
Note that from the first issue of 2016, this journal uses article numbers instead of page numbers. See further details here.