Spatial–Temporal Variability of Hydrothermal Climate Conditions in the Yellow River Basin from 1957 to 2015


1
The College of Environment and Planning of Henan University, Kaifeng 475004, China
2
Institute of Geographic Sciences and Natural Resources Research, CAS, Beijing 100101, China
3
School of Civil Engineering and Architecture of Henan University, Kaifeng 475004, China
4
United States Department of Agriculture-Agricultural Research Service, Genetics and Sustainable Agriculture Research Unit, Starkville, MS 39762, USA
*
Author to whom correspondence should be addressed.
Atmosphere 2018, 9(11), 433; https://doi.org/10.3390/atmos9110433
Submission received: 27 August 2018
/
Revised: 15 October 2018
/
Accepted: 17 October 2018
/
Published: 7 November 2018
(This article belongs to the Section Meteorology)
Abstract
:The Yellow River Basin has been affected by global climate change. Studying the spatial–temporal variability of the hydrothermal climate conditions in the Yellow River Basin is of vital importance for the development of technologies and policies related to ecological, environmental, and agricultural adaptation in this region. This study selected temperature and precipitation data observed from 118 meteorological stations distributed in the Yellow River Basin over the period of 1957–2015, and used the Mann–Kendall, Pettitt, and Hurst indices to investigate the spatial–temporal variability of the hydrothermal climate conditions in this area. The results indicated: (1) the annual maximum, minimum, and average temperatures have increased. The seasonal maximum, minimum, and average temperatures for the spring, summer, autumn, and winter have also increased, and this trend is statistically significant (p < 0.01) between 1957–2015. The rate of increase in the minimum temperature exceeded that of the maximum temperature, and diurnal warming was asymmetric. Annual precipitation and the total spring, summer, and autumn precipitations declined, while the total winter precipitation increased, although the trend was non-significant (p > 0.05). (2) Based on the very restrictive assumption that future changes will be similar to past changes, according to the Hurst index experiment, the future trends of temperature and precipitation in the Yellow River Basin are expected to stay the same as in the past. There will be a long-term correlation between the two trends: the temperature will continue to rise, while the precipitation will continue to decline (except in the winter). However, over the late stage of the study period, the trends slowed down to some extent.
1. Introduction
In recent years, global climate change has become one of the greatest concerns for human society. As pointed out by the fifth assessment report from the Intergovernmental Panel on Climate Change (IPCC), global warming is both temporally and spatially uneven [1]. For instance, the contribution made by semi-arid areas to global surface warming may reach as high as 44% [2,3]. In China, the temperature has clearly risen at an average rate of about 0.23 °C every 10 years, which is almost twice that of the global temperature increase rate in the last 60 years [1].
The essence of climate change not only represents the variability of a single factor, but also that of the entire climate system, so the reallocation of hydrothermal resources brought about by climate change is worthy of close attention [4]. Climate change will alter light, temperature, precipitation, soil, air, organisms, and other ecosystem factors through the combined variability of temperature and precipitation, influencing ecology, the environment, agricultural production, and more [5].
In the context of global climate change, various regions in China are experiencing a changing climate [6]. When it comes to the specific characteristics of climate change and the variations of the hydrothermal climate conditions in different regions over the same period, however, there is no clear consensus [6]. Spanning humid, semi-humid, semi-arid, and arid areas, the Yellow River Basin is a transition zone between monsoon and continental climates with complex climate types. It is also an ecosystem transition zone that is very sensitive to global climate change. Furthermore, warming and drying phenomena are very prominent in the Yellow River Basin. This not only gives rise to frequent drought disasters and increased extreme climatic events, but also seriously influences the sustainable development and productivity of China’s social economy, local agriculture, and husbandry [7,8]. For this reason, studying the spatial–temporal evolution of temperature and precipitation in the Yellow River Basin has become an urgent task for both meteorologists and policy makers.
Hydrothermal climate resources in the Yellow River Basin have also changed over the past decades, and such changes have profoundly influenced the ecology, environment, and agriculture of this region. Zhang et al. [9] investigated the spatial–temporal variability of the extreme temperature index of the Yellow River Basin, and the results indicated that there has been a warming trend over the past 50 years. Variability in the temperature index was most significant during the winter, and winter contributed the most to the yearly averaged temperature rise. Pan et al. [10] explored the temperature variability of the Yellow River Basin over the past 50 years, and found that temperatures in all four seasons had increased over time. Zhao et al. [11] focused on the spatial–temporal variability in the precipitation index of the Yellow River Basin over the past 50 years, and concluded that precipitation decreased over the period considered. Chen et al. [12] studied the precipitation of the Yellow River Basin across different seasons, and found that on the whole, annual precipitation had decreased (except in the winter, when precipitation increased). They argued that future precipitation trends would be the opposite of those found in the past. Chang et al. [13] studied the time variability of precipitation and rainy days in the Yellow River Basin over the past 50 years, and found large-scale negative trends year-round (except in the winter) for both. Jin et al. [14] discovered in their study that annual precipitation in the Yellow River Basin had a non-significant declining trend. Chen et al. [15] focused on the variability of extreme climatic events in the Yellow River Basin over the past 35 years, and found that the number of extreme low-temperature days had declined, while extreme high-temperature days had increased. Liu et al. [16] explored the temperature and precipitation variability in the Yellow River Basin over the past 50 years, and discovered that temperature had significantly increased with a warmer and wetter trend in the winter. They argued that variability in the maximum and minimum temperature was clearly asymmetric, and that precipitation in the spring had increased. Yang et al. [17] investigated the spatial–temporal distribution of extreme precipitation in the Yellow River Basin, and found that the magnitude of extreme precipitation was subject to evident alterations without significant trends. The frequency of extreme precipitation had increased significantly year-by-year, but precipitation itself had declined.
Clearly, there are some disagreements regarding hydrothermal variability in the Yellow River Basin, and in-depth analysis still needs to be conducted on some of the spatial–temporal details. Existing studies on the Yellow River Basin have mostly focused on a single meteorological parameter (precipitation or temperature), so it has been impossible to obtain a comprehensive understanding of the overall variability in hydrothermal conditions in this region for a given year, or in different seasons. In particular, research has rarely touched upon the future evolution of the hydrothermal climate. In this context, studying the spatial–temporal characteristics of hydrothermal climate conditions and inferring possible future trends of temperature and precipitation in the Yellow River Basin, under the assumption that climate variability will be similar to that found in the past, is highly relevant for ecology, the environment, and agriculture. For this reason, this study selected observation data from 118 meteorological stations distributed in the Yellow River Basin and surrounding regions from 1957–2015 as the object of analysis, and investigated the annual and seasonal characteristics of the hydrothermal climate variability in this region. The future direction of hydrothermal climate conditions was explored based on the analysis of hydrothermal temporal variability in the study area, and assuming that future climate variability will be similar to the past one. The spatial distribution pattern was also described with the purpose of providing some background information about climate change for ecological and environmental management and sustainable agricultural development.
2. Data Sources and Study Methods
2.1. Study Area
The Yellow River originates in the Bayan Har Mountains on the Qinghai–Tibet Plateau. The full stream length is 5464 km, and the basin area is 795,000 km2. As the second largest river in China, it runs through nine provinces before finally flowing into the Bohai Sea, including Qinghai, Sichuan, Gansu, Ningxia, Inner Mongolia, Shanxi, Shaanxi, Henan, and Shandong. The Yellow River Basin is characterized by very complicated geomorphological types; from west to east, it spans four geomorphological units: the Qinghai–Tibet Plateau, the Inner Mongolian Plateau, the Loess Plateau, and the Huang-Huai-Hai Plain (Figure 1). It also contains humid, semi-humid, semi-arid, and arid areas in China, which respectively account for 5.3%, 54.8%, 28.2%, and 11.7% of the total basin area. The Yellow River Basin is located in the northwest of the East Asian monsoon region. In the winter, it experiences the cold and dry Mongolian High pressure and prevailing northerly winds, and the climate is characterized by low temperatures and less precipitation. In the summer, it is subject to the warm and wet Pacific high pressure and prevailing southeast winds, and its climate is characterized by high temperatures and more precipitation. Precipitation in the summer (from June to September) roughly accounts for 70% of the total precipitation of the year. The mean annual precipitation of the entire basin is 466 mm, which gradually declines from southeast to west. The average annual temperature is between −4 °C and 14 °C. In general, the basin is arid in the west, and constitutes one of the most sensitive and fragile climatic regions in China.
2.2. Data Sources
The meteorological data in this study were obtained from the China Meteorological Data Sharing Service System (http://cdc.cma.gov.cn/home.do). All of the data underwent strict quality control and correction. Data quality control is a prerequisite for index calculations. Data quality control was performed using the computer program RClimDex Software Version 1.1, which is developed and maintained by researchers at the Climate Research Branch of the Meteorological Service of Canada [18,19]. Using the detailed principles described by Wang [20,21], 118 qualified stations with reliable data for statistical analysis were ultimately selected. A homogeneity test was made with the RHtest V4 software to identify possible change points or structural changes in the data series. The only criterion for a meteorological station to be considered was that its recording period has to cover at least 85% of the total period of 59 years. The 118 stations (Figure 1) were selected after data quality control and a homogeneity assessment, and the total length of the period of every station selected is 59 years (from 1 January 1957 to 31 December 2015).
The meteorological parameters selected in this study were temperature and precipitation. According to typical practice [22], a year was divided into four seasons: spring (March–May), summer (June–August), autumn (September–November), and winter (December–February). Based on existing meteorological data, we obtained the daytime maximum temperatures, nighttime minimum temperatures, average temperatures, and total accumulated precipitation for each year and season.
2.3. Study Methods
R/S (Rescaled Range Analysis) is an analytical method that was originally proposed by the hydrologist Hurst when researchers were analyzing the hydrological data of the Nile [23]. This method has been extensively applied to forecast a time series of hydrological and meteorological factors. The R/S analysis can infer the overall trend of future climate change. This overall trend generally manifests in two forms, the first being that long-term correlation characteristics are assumed to be persistent. That is, future changes are similar to the past, and have positive trends. On the other hand, long-term correlation characteristics might be characterized by anti-sustainability. That is, future changes and the opposite of the past are a countertrend. However, not only should we predict the trend of change and the duration of each state in the trend, we also need to find out whether there is a turning point in climate change and further estimate whether this transition indicates climate change.
The Hurst index, based on an R/S analysis and calculation, reveals the correlation between past and future variability in a time series. The future variability can be predicted based on past variability. The principle is below [24,25,26,27,28,29,30,31]: all of the data is divided into adjacent subsequences of length n. Assuming that there is a time series of n samples X1, ⋯, Xn, the mean of n values can be calculated using the following Equation (1):
The cumulative deviations can be calculated using the following Equation (2). are deviations; m is mean value of n values:
The difference between the maximum and minimum of n deviations is called the Range (R), which can be calculated using the following Equation (3):
Finally, we calculate the standard deviation of the n values (S) according to Equation (4):
We repeat the above Equation (2) to Equation (4) for all of the data, and we get the R/S value, then R/S can be calculated using the following Equation (5):
We repeat the above for all of the data; then, n = N/2 (N = 59), and we can get a series of (n,). The Hurst index (H) can be calculated using the following Equation (6):
However, the Yellow River Basin has very complicated climate conditions, as manifested by the abrupt variability of climate change at many different scales. When it comes to predicting future climate change, the R/S analysis method has its limitations [24,25,26,27,28,29,30]. A sudden change of climate is a phenomenon in which the climate changes from a stable state to another stable state. It manifests itself in the dramatic change in climate from one statistical property to another in time and space. From the perspective of temperature changes, climate change has cold and warm mutations on various scales. As for the precipitation time and spatial distribution, there are flooding and droughts; from the perspective of systemic nature, these are different behaviors.
A lot of research on the prediction of R/S analysis has found that the prediction of future climate change with the Hurst index is only a trending overall contour prediction. There are two manifestations of this trend. Positive trends indicate that future changes have a certain self-similarity with the past; anti-trends indicate that the future will have completely opposite changes to the past. Feng Xinling designed a Hurst index experiment scheme to resolve these limitations in trend analysis and future trend forecasting [25,26,27]. Referring to the achievements of Feng Xinling [25,26,27], this study proposed that the Hurst index could be used to strengthen the inference process.
Test 1 is a Hurst index test (20-year Hurst index experiment) from the beginning of the time series data. The first 20-year sequence, from 1957 to 1976, has a Hurst index recorded as 1957–20; the second 20-year sequence, from 1958–1977, has a Hurst index recorded as 1958–20; the third 20-year sequence, from 1959–1978, has a Hurst index recorded as 1959–20; and so on until the last 20-year sequence, from 1996–2015, has a Hurst index recorded as 1996–20. Experiment 1 is a series of Hurst exponential sequences for a large sample (n > 30) formed by calculating sequence lengths of 20 years and the data age.
Test 2 is a time-sequential, yearly cumulative Hurst index test (accumulation experiment). The method involves calculating the first Hurst index for the 20 years from 1957 to 1976 (recorded as 1957–20), then calculating the second Hurst index from 1957 to 1977 (recorded as 1957–21); then calculating the third Hurst index from 1957 to 1978 (recorded as 1957–22); and so on, to continuously calculate a Hurst exponential sequence. The last Hurst index is for the 59 years from 1957 to 2015 (recorded as 1957–59). Experiment 2 is a large sample (n > 30) of the Hurst exponential sequence that was formed in the beginning of the time series data.
Based on the 20-year Hurst index experiment and accumulation experiment, this study explored the variability and duration of hydrothermal climate trends and identified abrupt change points. After comparing the two experiments, it ultimately established that the 20-year Hurst index experiment has significance and value for identifying abrupt change points in the hydrothermal climate, as well as for forecasting future variability.
The Hurst index, based on R/S analysis and calculation, reveals the correlation between past and future variability in a time series; that is, future variability can be predicted based on past variability. This method has been extensively applied to forecast the time series of hydrological and meteorological factors [29]. See the judgment rules below:
The magnitude of a Hurst index value is used to judge the continuity or anti-continuity intensity of trend components. When 0< H < 0.5, the time series is not continuous, and future variability will not be consistent with past variability. The closer the H value is to 0, the less continuous it is. When 0.5< H < 1, the time series is continuous, and future variability is consistent with the past. The closer the H value is to 1, the stronger the continuity. When H = 0.5, the time series is a totally independent random time series, and future variability is not related to the past (Table 1).
3. Results and Analysis
3.1. Annual and Seasonal Variability of Hydrothermal Climate Conditions
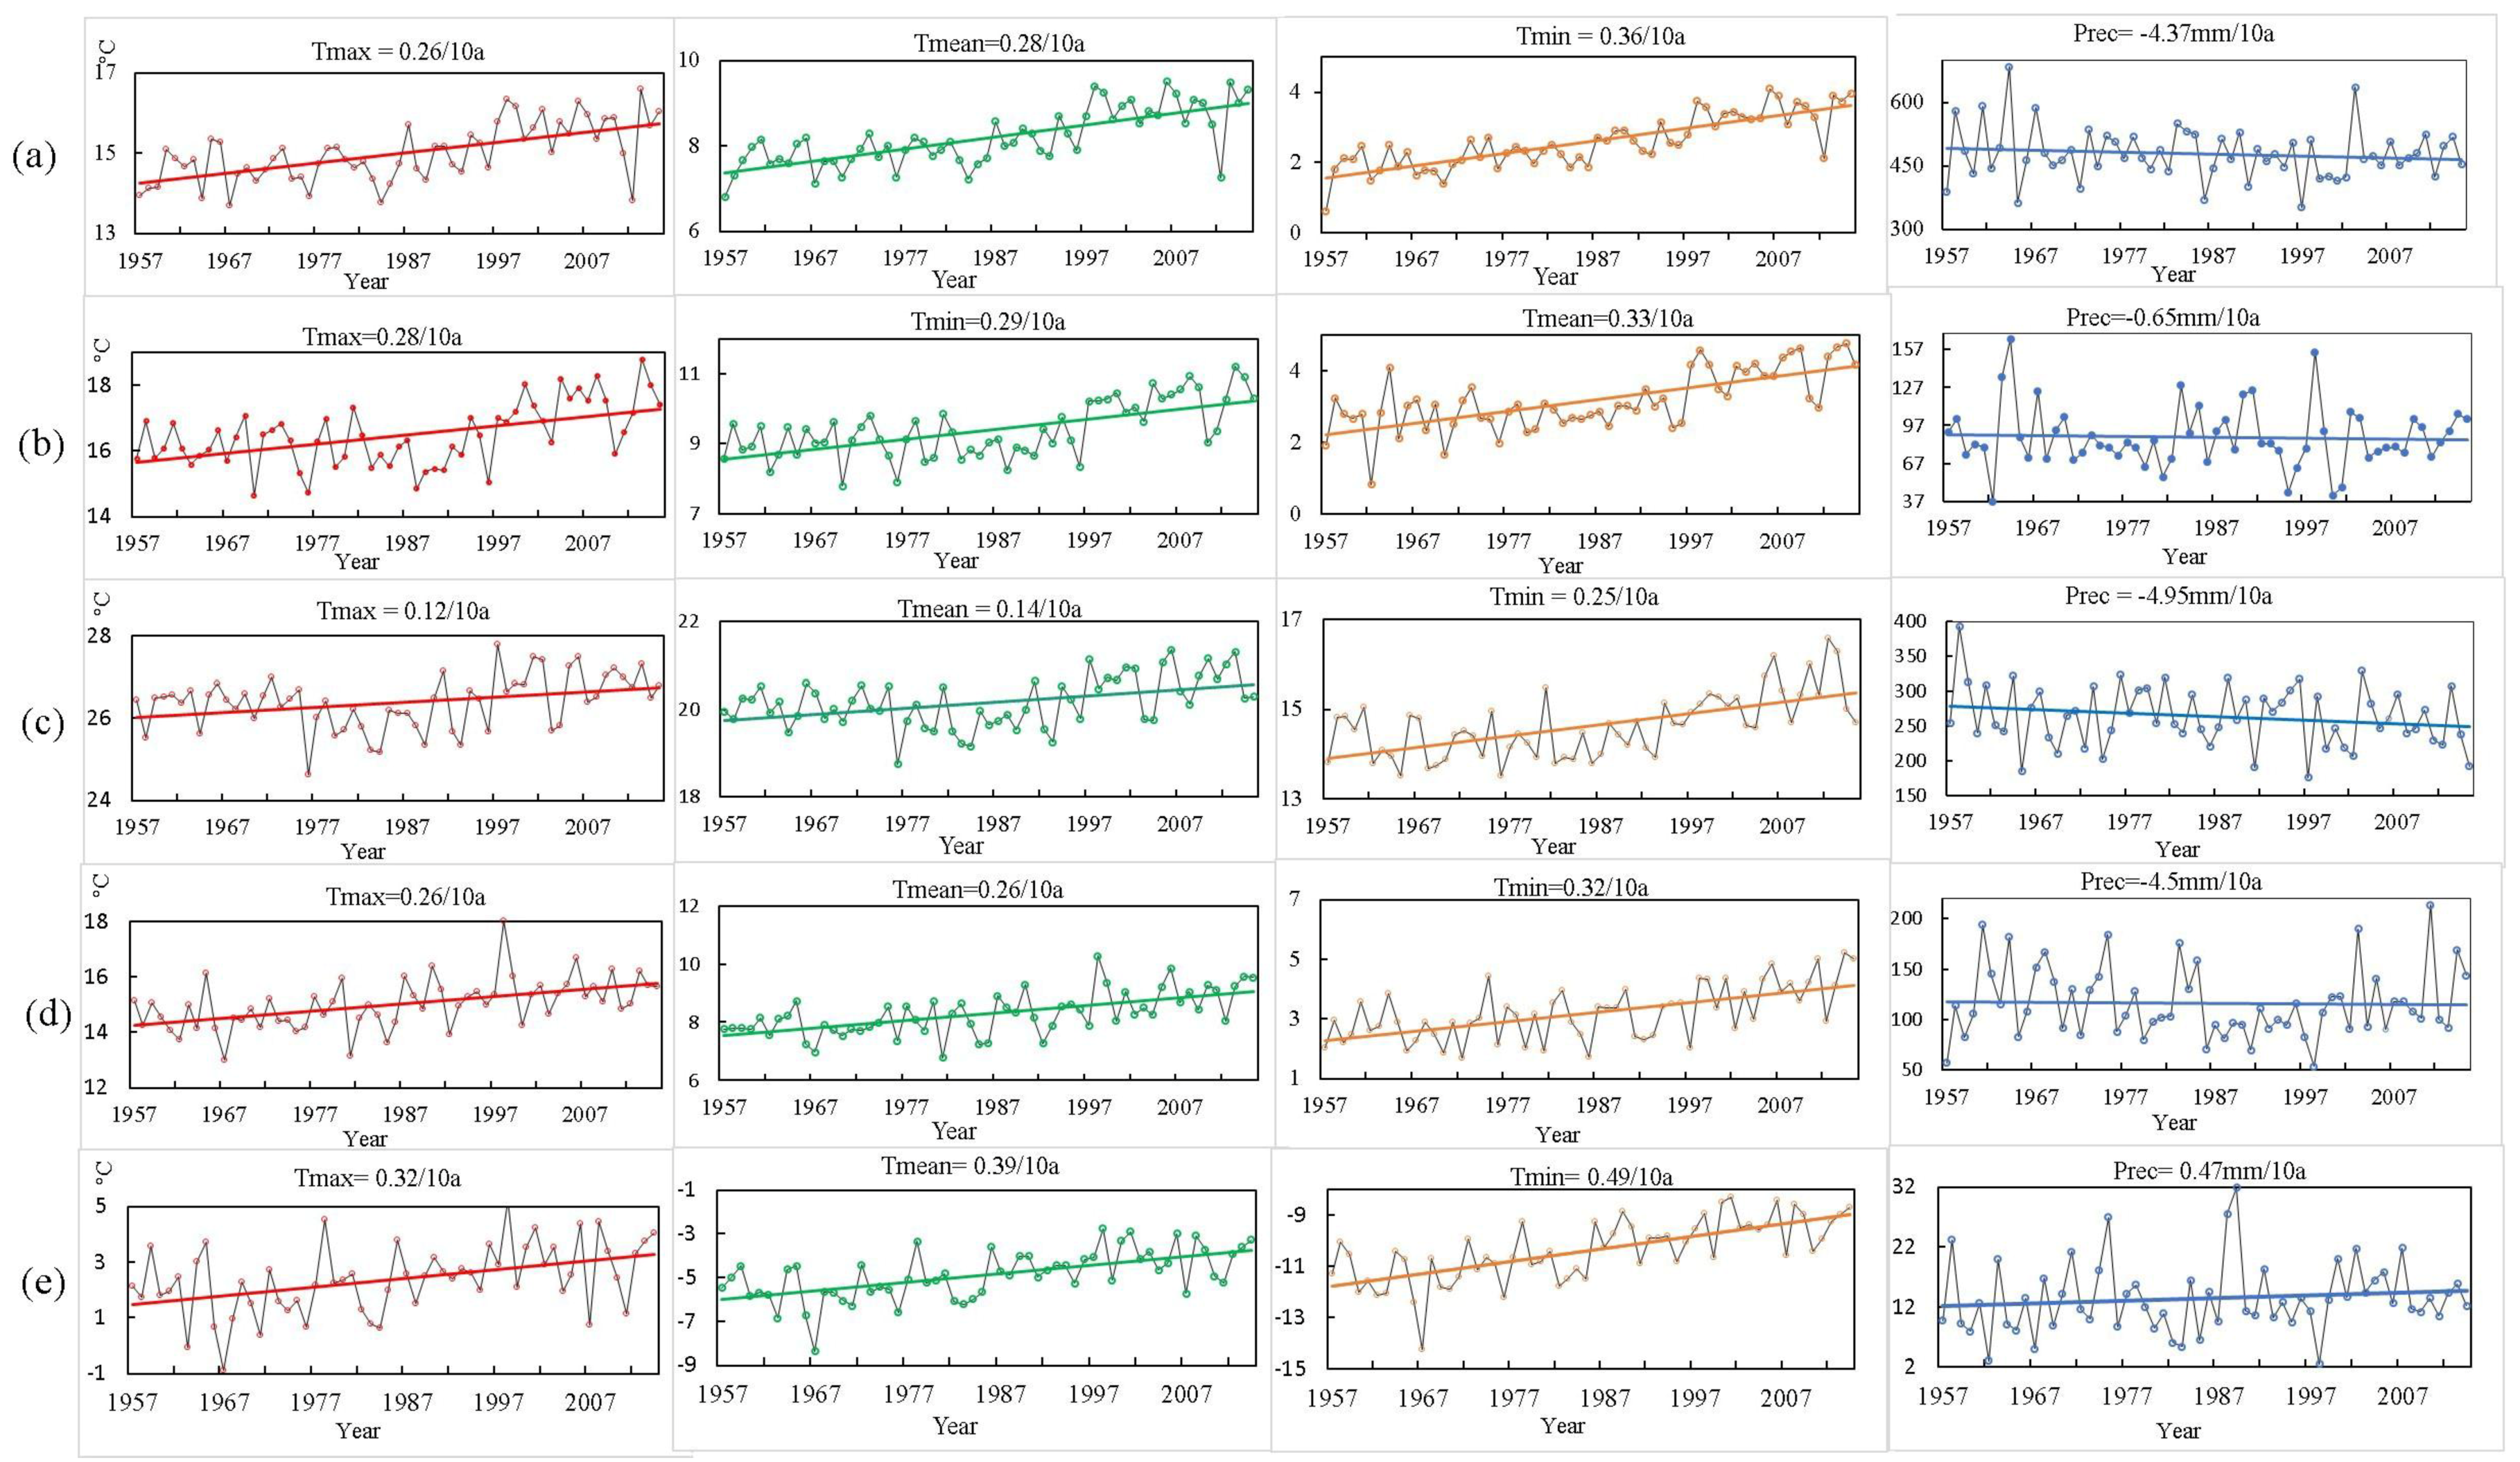
The Mann–Kendall (M–K) non-parametric test method and a linear regression method is usually used to analyze time series of temperature and precipitation. Based on M–K analysis, the annual maximum, minimum, and average temperatures, as well as the seasonal maximum, minimum, and average temperatures in the Yellow River Basin all significantly increased (p < 0.01) during the 1957–2015 period. The Yellow River Basin had the highest and most significant temperature increase in the winter (Figure 2), and the lowest temperature increase in the summer (Figure 2). The minimum temperature, regardless of the year or season, always increased at a faster rate than the maximum temperature. To be specific, the increase in the annual minimum temperature was 1.4 times that of the annual maximum temperature. In the spring and autumn, the same value was 1.2 times greater, in the summer it was double, and in the winter, it was 1.5 times greater. The IPCC2007 showed that global surface temperatures have been rising faster during the nighttime than during the daytime [32,33,34,35]. The Yellow River Basin has experienced a diurnal warming trend that is consistent with global diurnal warming; the diurnal warming scenario is asymmetric.
The Yellow River Basin has received an average annual precipitation of 478.5 mm from 1957 to 2015, and this has been declining at a rate of 4.4 mm every 10 years (4.4 mm/10a). Among the four seasons, only the winter has witnessed an increasing precipitation trend, and it was non-significant (p > 0.05) at 0.47 mm every 10 years (0.47 mm/10a) (Figure 2). The total precipitation in the spring, summer, and autumn all declined, and they were non-significant (p > 0.05).
The Pettitt method is used to test abrupt variation points. Annual and seasonal temperatures had a highly significant increasing trend (Table 2). The average annual temperature of the Yellow River Basin experienced an abrupt change in 1985, which was close to the time of an abrupt change in China’s average annual temperature (1987) [36,37]. The abrupt temperature changes in the spring and summer of 1995 and 1992 occurred later than the average annual change (Table 2). The abrupt changes in autumn and winter in 1985 occurred closer to the average annual change (Table 2). On the other hand, annual precipitation variability was non-significant (p > 0.05), with no abrupt changes (Table 2).
3.2. Possible Future Changes of Hydrothermal Climate Conditions
This study has inferred possible future trends (accelerating or slowing down) according to current trends by making the very restrictive assumption that future changes are likely to be similar to past changes. It is to be expected that future variability will produce a change in the mean climate that is similar to that already observed in the near past, with respect to the earlier reference climate.
The Hurst indices for the annual maximum, minimum, and average temperatures in the Yellow River Basin were greater than 0.5 for both the 20-year Hurst index experiment (Figure 3a) and the accumulation experiment over the period 1957–2015 (Figure 3b). This suggests that the temperature will continue an increasing trend in the long term, because the past and future trends were similar. The majority (82.5%) of the Hurst indices for the annual minimum temperature in both experiments fell within the range of Grade 5 (Table 1). This suggests that the future annual temperature trends will be correlated with the past trends. The Hurst indices for the annual maximum, minimum, and average temperatures in the 20-year Hurst index experiment and accumulation experiment all declined prior to the 1970s, suggesting that the temperature increase slowed down to some extent. After the 1970s, an increasing trend was observed (Figure 3a). The Hurst indices for the annual temperatures in the 20-year Hurst index experiment declined in the 1990s, suggesting that the temperature increase trend slowed down to some extent (Figure 3a).
The Hurst index values for both the maximum and minimum spring temperature in the 20-year Hurst index experiment were less than 0.5 in some cases, suggesting that both had abrupt change points in the period between the 1980s and the 1990s (Figure 3a), which is consistent with the results obtained by the Pettitt method. Most of the Hurst index values for the spring maximum, average, and minimum temperatures were greater than 0.5 in the 20-year accumulation experiment. Future temperature trends in the spring maintained a correlation with their past trends, and thus will continue to increase.
The Hurst index values for the minimum summer temperature in the 20-year Hurst index experiment were less than 0.5 in some cases, and according to Figure 3, there were abrupt change points in the period between the 1980s and the 1990s. Most of the Hurst index values for the summer maximum, average, and minimum temperatures in the 20-year Hurst index experiment and accumulation experiment were greater than 0.5, suggesting that there was consistency between the future and past trends, and thus they will have an increasing trend. However, in the 20-year Hurst index experiment, Hurst index values declined in the 1990s, suggesting that the temperature increase has slowed to some extent.
The Hurst index values for the autumn minimum and average temperatures in the 20-year Hurst index experiment were less than 0.5 in some cases. According to Figure 3a, there were abrupt change points in the period between the 1980s and the 1990s, which was consistent with the results obtained by the Pettitt method. The Hurst index values for the autumn maximum, minimum, and average temperature in the two tests were all above 0.5, suggesting that there was consistency between the future and past trends, and they will thus continue to show an increasing trend.
The Hurst index values for the winter maximum, minimum, and average temperature in the 20-year Hurst index experiment and accumulation experiment (Figure 3a) were all greater than 0.5, suggesting that there was consistency between the future and past trends, and they will thus continue to increase.
According to the Hurst index classification (Table 1), 85% of the Hurst index values of temperature in the winter were higher than Grade 3, suggesting that there was a strong correlation between past and future temperature trends and that winter temperatures will continue to increase. In the 20-year Hurst index experiment and accumulation experiment (Figure 3), the Hurst index values for the maximum, minimum, and average temperatures in all of the seasons were increasing in the 1970s, suggesting that the increasing temperature trend was accelerating. A decreasing trend of the Hurst index value was observed in the 1990s, suggesting that the temperature increase slowed down to some extent.
Most of the Hurst index values for the annual and seasonal precipitation were greater than 0.5 (Figure 3a) in both the 20-year Hurst index and accumulation experiments (Figure 3b), suggesting that the past and future trends were consistent and increasing. The total accumulated precipitation during one year and in the total spring, summer, and autumn precipitation amounts will likely continue to decline, while the total winter precipitation will increase. In the 20-year Hurst index experiment, the Hurst index values for the total accumulated precipitation during one year were less than 0.5 in some cases, suggesting that there were abrupt change points in the period between the 1980s and the 1990s, as shown in Figure 3. The Hurst index values for the total spring precipitation indicated a decreasing trend in both the 20-year Hurst index experiment (Figure 3a) and the accumulation experiment (Figure 3b). According to Figure 3a, in the 20-year Hurst index experiment, 10 Hurst index values were less than 0.5, which were consecutive after (1986–20). This suggests that the total spring precipitation had an increasing trend after 2000, which was consistent with the results obtained by the Pettitt method. The Hurst index values in both experiments (Figure 3) for the total summer precipitation declined in the 1990s, suggesting that the future decline would be reduced. According to the Hurst index classification (Table 1), 85% of the Hurst index values in 20-year Hurst index experiment (Figure 3a) for the total autumn precipitation were higher than Grade 3, suggesting that there was a strong correlation between future and past trends. The Hurst value for the total autumn precipitation decreased in the late 1990s, suggesting that the decline had slowed down to some extent. According to the Hurst index classification (Table 1), the Hurst index values for the total winter precipitation were all higher than Grade 3, suggesting that the increasing trend will continue in the long term.
As indicated by the R/S analysis-based Hurst index experiment, the Hurst indices for the annual maximum, minimum, and average temperature and precipitation for all of the meteorological stations in the Yellow River Basin were above 0.5, suggesting that future temperature and precipitation will maintain current trends. That is, temperature is expected to increase in each season, while precipitation will decline in each season (except in the winter). In the late stages of 1957–2015, temperature and precipitation variability both slowed down to varying degrees.
3.3. Spatial Patterns of Hydrothermal Climate Variability
To analyze the spatial variations of temperature and precipitation in the Yellow River Basin, the annual temperature and annual precipitation in each station were computed. Regarding the spatial distribution (Figure 4a) of the annual maximum temperature, 100% of the stations showed an increase from 1957 to 2015, all of which passed the significance test at the 0.1 level. Annual minimum temperature increased significantly at 93% of the meteorological stations, with a significant decline occurring at only 7%. The average annual temperature increased significantly at 97% of the meteorological stations, and significantly declined at only 3% (Figure 4a). Precipitation declined at 80% of the meteorological stations and increased at 20%. From a spatial perspective, in terms of the changes of temperature and precipitation, apparent spatial differences and dry conditions were mainly in the midstream and downstream areas in the Yellow River Basin (Figure 4).
Previous studies have found that future temperature increase and precipitation decrease contribute to a phenomenon of warming and drying, while temperature increase and precipitation increase lead to a phenomenon of warming and wetting [38]. By employing the M–K trend test and Hurst index, this study forecasts the development trend of the future climate in the Yellow River Basin. In the Yellow River Basin, the temperature demonstrates a rising trend, while the precipitation shows a declining trend (except in the winter). This suggests that a warming and drying phenomenon will be observed in the basin in the future both on average annually and in the spring, summer, and autumn, and that a warming and wetting trend will occur in the winter. From a spatial perspective, the Hurst indices, which are above 0.5 for the annual maximum, minimum, and average temperature and precipitation for all of the meteorological stations, were alleviated in the midstream and downstream areas in the Yellow River Basin. The data from Figure 4 shows the decrease and increase of temperature and precipitation and the spatial differences in the Yellow River Basin. The characteristics of precipitation are highly spatially diverse due to the influence of complex topography. The Yellow River Basin spans over 5464 km from west to east, and its climate differences are obvious. It is difficult for the moisture to reach the study area due to its complex terrain. The Yellow River Basin is strongly influenced by monsoon. Previous research analysis found that monsoon influences the spatial variation of extreme precipitation events.
4. Discussion
The Yellow River Basin has seen significant temperature increases and precipitation decreases between 1957–2015. The warming trend has been most significant since the 1980s, while the decrease in precipitation was most obvious in the 1990s. This is relatively consistent with the results of existing studies. For instance, studies by Chen et al. [11] and Yang et al. [16] all indicated that winter precipitation increased, and its trend was not statistically significant. Winter was the only season in which precipitation increased, but the precipitation in the winter was very low, and increased only slightly, so its influence on the total accumulated precipitation in one year was non-significant. Summer precipitation declined the most. Such changes in the Yellow River Basin are in response to global climate warming, as a region experiencing relevant climate warming. It also constitutes a major part of global climate change.
This study infers possible future trends (accelerating or slowing down) according to current trends, if we make the very restrictive assumption that future changes will be similar to past changes. Then, it is to be expected that the future trend will produce a change in the mean climate that is similar to that already observed in the near past, with respect to the earlier reference climate. Therefore, in the absence of other predictions, the local administrations should assume that the local climate will undergo a further drift.
Climate warming has aggravated the drying trend in the study area, and led to frequent heat damage, drought, and other extreme climatic events [39]. Therefore, it is necessary to strengthen the monitoring, forecasting, and assessment of meteorological disasters to provide better information services for government agencies and users [40]. In the Yellow River Basin, which is an important area regarding the response to global climate change, the reallocation of the hydrothermal resources brought about by climate change will alter light, temperature, precipitation, soil, air, organisms, and other ecosystem factors through the combined variability of temperature and precipitation. In turn, it will influence the ecology, environment, agricultural production, and more [8]. Hydrothermal climate change can allocate thermal resources in the basin to varying extents, prolonging the growing season and increasing the arable land area. It can also modify the physical, biological, and chemical reactions of the soil, and thus impact agricultural production and ecological management. For instance, climate warming accelerates the mineralization rate of soil organic carbon and results in the loss of soil moisture and nutrients. Intensified soil evaporation further drives soil salts to move upward and causes soil salinization [41]. More in-depth study is needed to deal with hydrothermal climate change and create mechanisms for reducing heat damage and drought risks.
Climate warming and drying are basic characteristics of modern climate change in North China. The Loess Plateau is the most ecologically and environmentally fragile region in West China, facing serious water and soil loss [42]. Climate warming and drying also lead to intensified evaporation, reduced lake area, loss of river function, and other more serious ecological and environmental problems. In addition, it also accelerates water surface evaporation, reduces precipitation, increases runoff loss, decreases river runoff, and results in water resource shortages. In this context, it is very important to introduce adaptive measures to lessen the adverse influence of climate change on water resources.
Variations in the spatial–temporal distribution pattern of hydrothermal climate conditions will change the spatial–temporal distribution of water resources and nutrient substances [43,44], and substantially influence cropping systems, pest control, agricultural production potential, agricultural management, and so forth.
From 1957–2015, rapid industrial development has increased the waste gas, smoke, particles, and other pollutants emitted by industrial plants and vehicles into the air, and intensified the greenhouse effect, which further results in temperature rises and precipitation decreases [45]. Hydrothermal climate change occurs under the combined action of human activities and climate change. This study analyzes the hydrothermal variability in the Yellow River Basin only from the perspective of the climate, so future studies should take into account the influence of human activities on the spatial–temporal characteristics [46].
5. Conclusions
As indicated by the M-K method, the annual maximum, minimum, and average temperatures, as well as the seasonal maximum, minimum, and average temperatures, have all increased significantly (p > 0.01) from 1957–2015 in the Yellow River Basin. The annual and seasonal minimum temperatures always increased at a faster pace than maximum temperatures, which was consistent with a global diurnal warming scenario. The diurnal warming was asymmetric: the contribution made by the minimum temperature variability to the average temperature rise exceeded that made by maximum variability. The maximum, average, and minimum temperatures increased the most in winter and the least in summer. The total accumulated precipitation during one year and the total spring, summer, and autumn precipitations all declined, while the total winter precipitation increased. However, none of these trends was significant (p > 0.05). Winter was the only season in which precipitation increased, but the increase was very low, so it had a non-significant influence on the total accumulated precipitation in one year.
If future changes of temperature and precipitation are assumed to be similar to past changes, then it is to be expected that future variability will produce a change that is similar to that already observed in the near past with respect to the earlier reference climate. Based on the above assumptions, according to R/S method-based Hurst index experiments, warmer and wetter trends will be observed in the winter in the Yellow River Basin according to current trends. However, annually and during the spring, summer, and autumn, the climate will be warmer and drier. The Hurst indices for the maximum, minimum, and average annual and seasonal temperatures, along with the Hurst indices for the annual and seasonal precipitation, all exceeded 0.5 over the period 1957–2015. For both temperature and precipitation, future variability is expected to remain correlated with past trends; temperature will continue to rise, while precipitation will continue to decrease (except in the winter). Spatially, the annual maximum temperature increased significantly at all the meteorological stations distributed in the Yellow River Basin from 1957 to 2015. The annual minimum temperature has increased significantly at 93% of the meteorological stations. The average annual temperature increased significantly at 97% of the meteorological stations. Precipitation decreased at 80% of the meteorological stations, and increases in precipitation were mainly observed in the midstream and upstream areas.
Author Contributions
L.M. and F.Q. conceived and designed the experiments. L.M. performed programming work, analysis, discussions, and wrote most sections of the manuscript. H.X., J.S. and H.W. supplied suggestions and comments for the manuscript. All authors reviewed and adjusted the manuscript.
Funding
This research was funded jointly by the National Science and Technology Platform Construction Project of China (2005DKA32300) and Major Projects of the Ministry of Education Base (16JJD770019) in China.
Acknowledgments
All authors thank the anonymous reviewers and the editor for the constructive comments on the earlier version of the manuscript.
Conflicts of Interest
The authors declare no conflict of interest.
References
- IPCC. Climate Change 2013: The Physical Science Basis; Cambridge University Press: Cambridge, UK; New York, NY, USA, 2013. [Google Scholar]
- Huang, J.; Guan, X.; Ji, F. Enhanced cold-season warming in semi-arid regions. Atmos. Chem. Phys. 2012, 12, 5391–5398. [Google Scholar] [CrossRef] [Green Version]
- Jiang, X.L.; Ma, Z.G.; Gong, Y.F. Comparative analysis of relationship between moisture budget and precipitation change among global significantly wetting/drying regions. Plateau Meteorol. 2015, 34, 1279–1291. [Google Scholar] [CrossRef]
- Thornes, J.E. Climate change 2001: Impacts, adaptation and vulnerability, contribution of working group II to the third assessment report of the Intergovernmental Panel on Climate Change. Int. J. Climatol. 2002, 22, 1285–1286. [Google Scholar] [CrossRef]
- Liu, Y.S.; Liu, Y.; Guo, L.P. Impact of climatic change on agricultural production and response strategies in China. Chin. J. Eco-Agric. 2010, 18, 905–910. [Google Scholar] [CrossRef]
- Cui, Y.P.; Ning, X.; Qin, Y.; Li, X.; Chen, Y. Spatio-temporal changes in agricultural hydrothermal conditions in China from 1951 to 2010. J. Geogr. Sci. 2016, 26, 643–657. [Google Scholar] [CrossRef]
- Du, H.-M.; Yan, J.P.; Wang, P.T. The drought disaster and its response to the warming- drying climate in the 1986 farming-pastoral ecotones in northern China. J. Arid Land Resour. Environ. 2015, 29, 124–128. [Google Scholar] [CrossRef]
- Liu, T.; Huang, H.Q.; Yan, H.M.; Jia, J. The persistence of precipitation series and the trend of drought in northern Agro-pastoral Zone. Resour. Sci. 2012, 34, 940–947. [Google Scholar]
- Zhang, Z.X.; Hu, C.H.; Li, S.H.; Wang, J.J.; Li, X.M. Temporal and Spatial Variation Characteristics of Extreme Temperature Index from 1961 to 2010 in the Yellow River Basin. Meteorol. Environ. Sci. 2015, 38, 48–53. [Google Scholar] [CrossRef]
- Pan, P.; Zhu, Y.L.; Wang, J.J. Spatial-temporal variations of temperature and the cause analyses in the Yellow River valley during recent 50 years. Clim. Environ. Res. 2014, 19, 477–485. [Google Scholar] [CrossRef]
- Zhao, C.P.; Chen, Y.; Wang, W.G.; Gao, Z.J. Temporal and Spatial Variation of Extreme Precipitation Indexes of the Yellow River Basin in Recent 50 Years. Yellow River 2015, 37, 18–22. [Google Scholar] [CrossRef]
- Chen, L.; Wang, Y.M.; Chang, J.X.; Wei, J. Characteristics and variation trends of seasonal precipitation in the Yellow River Basin. Yellow River 2016, 38, 8–12. [Google Scholar] [CrossRef]
- Chang, J.; Wang, Y.G.; Zhao, Y.; Li, F.X. Characteristics of climate change of precipitation and rain days in the Yellow River Basin during recent 50 years. Plateau Meteorol. 2014, 33, 43–54. [Google Scholar] [CrossRef]
- Jin, L.J.; Wang, C.Q.; Wang, P.; Guo, T. Analysis of characteristics of the extreme precipitation. J. Water Resour. Water Eng. 2016, 27, 44–48. [Google Scholar]
- Chen, X.Q.; Liu, L.; Wei, Y.P. Variation trend of extreme climate events of the Yellow River Basin in 1961–2005 period. Yellow River 2011, 33, 3–5. [Google Scholar] [CrossRef]
- Liu, Q.; Yan, C.R.; Zhang, Y.Q.; Yang, J.J.; Zheng, S.H. Variation of precipitation and temperature in Yellow River Basin during the last 50 years (1961-2010). Chin. J. Agrometeorol. 2012, 33, 475–480. [Google Scholar] [CrossRef]
- Yang, P.Y.; Zhang, Q.; Shi, P.J.; Gu, X.H.; Li, Q. Spatiotemporal distribution of precipitation extremes and related implications across the Yellow River Basin, China. J. Wuhan Univ. (Nat. Sci. Ed.) 2017, 63, 368–376. [Google Scholar] [CrossRef]
- Hyndman, R.; Fan, Y. Sample quantiles in statistical packages. Am. Stat. 1996, 50, 361–367. [Google Scholar]
- Zhang, X.; Hegel, G.; Zwiers, F. Avoiding inhomogeneity in percentile-based indices of temperature extremes. J. Clim. 2005, 18, 1641–1651. [Google Scholar] [CrossRef]
- Wang, X.L.; Wen, Q.H.; Wu, Y. Penalized maximal t test for detecting undocumented mean change in climate data series. J. Appl. Meteorol. Climatol. 2007, 46, 916–931. [Google Scholar] [CrossRef]
- Wang, X.L. Accounting for autocorrelation in detecting mean-shifts in climate data series using the penalized maximal T. or F test. J. Appl. Meteorol. Climatol. 2008, 47, 2423–2444. [Google Scholar] [CrossRef]
- Karl, T.R.; Nicholls, N.; Ghazi, A. Weather and Climate Extremes; Springer: Dordrecht, The Netherlands, 1999; pp. 3–7. [Google Scholar]
- Qin, Y.; Liu, K. Advancement of applied studies of fractal theory in Geography. Prog. Geogr. 2003, 22, 426–436. [Google Scholar]
- Rybski, D.; Neumann, J. In Extremis: Disruptive Events and Trends in Climate and Hydrology; Springer: Berlin/Heidelberg, Germany, 2011; pp. 202–213. ISBN 978-3-642-14863-7. [Google Scholar]
- Pan, Y.J.; Wang, Y.L.; Peng, J.; Shen, H.; Liu, X.Q. Precipitation change in middle and lower reaches of Hanjiang River: Based on wavelet analysis and R/S analysis. Geogr. Res. 2012, 31, 811–820. [Google Scholar]
- Feng, X.L.; Luo, L.C.; Feng, Z.L. Hurst index experiment on precipitation change trend and mutation of China in the near 50 years. Arid Land Geogr. 2009, 32, 859–866. [Google Scholar] [CrossRef]
- Feng, X.L.; Luo, L.C.; Qiu, L.L.; Feng, Z.L. Fractal research of rainy day changing trend from Tibetan Plateau to Eastern China. Geogr. Res. 2007, 26, 835–843. [Google Scholar]
- Feng, X.L.; Luo, L.C.; Qiu, L.L. R/S analysis on future climate change in the city of Chengdu. Resour. Environ. Yangtze Basin 2008, 17, 83–87. [Google Scholar]
- Feng, X.L.; Feng, Z.L.; Luo, L.C.; Qiu, L.L.; Liu, P. Fractal analysis of climate change and Hurst Index experiment in Tibetan Plateau in future. Arid Land Geogr. 2008, 31, 175–181. [Google Scholar] [CrossRef]
- Zuo, H.C.; Lyu, S.H.; Hu, Y.Q. Variations trend of yearly mean air temperature and precipitation in China in the last 50 years. Plateau Meteorol. 2004, 23, 238–244. [Google Scholar]
- Shen, J.J.; Ju, X.X.; Ma, L. Multiple scales analysis of the precipitation characteristics in Xi’an. Chin. Agric. Sci. Bull. 2015, 31, 257–263. [Google Scholar]
- Peng, S.S.; Piao, S.L.; Ciais, P. Asymmetric effects of daytime and night-time warming on Northern Hemisphere vegetation. Nature 2013, 501, 88–94. [Google Scholar] [CrossRef] [PubMed]
- Easterling, D.R.; Horton, B.J.; Philip, D.P.; Thomas, C.K.; Thomas, R.; Parker, D.E.; Salinger, M.; James, R.; Vyacheslav, P.; Neil, J.; et al. Maximum and minimum temperature trends for the globe. Science 1997, 277, 364–367. [Google Scholar] [CrossRef]
- Tan, J.G.; Piao, S.L.; Chen, A.P.; Zeng, Z.Z.; Ciais, P.; Janssens, I.A.; Mao, J.F.; Myneni, R.B.; Peng, S.S.; Penuelas, J.; et al. Seasonally different response of photosynthetic activity to daytime and night-time warming in the Northern Hemisphere. Glob. Chang. Biol. 2015, 21, 377–387. [Google Scholar] [CrossRef] [PubMed]
- Harvey, L.D.D. Warm days, hot nights. Nature 1995, 377, 15–16. [Google Scholar] [CrossRef]
- Wei, F.Y.; Cao, H. Detection of abrupt changes and trend prediction of the air temperature in China, the Northern Hemisphere and the Globe. Sci. Atmos. Sin. 1995, 19, 140–148. [Google Scholar]
- Ren, G.Y.; Guo, J.; Xu, M.Z.; Chu, Z.Y.; Zhang, L.; Zou, X.K.; Li, Q.X.; Liu, X.N. Climate changes of China’s mainland over the past half century. Acta Meteorol. Sin. 2005, 63, 942–956. [Google Scholar]
- Shi, Y.F.; Fan, J.H. Climatic warming and drying trend and its impact on water resources in Mid Latitude China. Adv. Water Sci. 1991, 2, 217–223. [Google Scholar]
- Leemans, R.; Eickhout, B. Another reason for concern: Regional and global impacts on ecosystems for different levels of climate change. Glob. Environ. Chang. 2004, 14, 219–228. [Google Scholar] [CrossRef]
- Deng, Z.Y.; Wang, Q.; Zhang, Q.; Qing, J.Z.; Yang, Q.G.; Yuan, Z.P.; Liu, W.J.; Xu, J.F. Impact of climate warming and drying on food crops in northern China and the countermeasures. Acta Ecol. Sin. 2010, 30, 6278–6288. [Google Scholar]
- Zhang, Q.; Zhang, C.J.; Bai, H.Z.; Li, L.; Sun, L.D.; Liu, D.X.; Wang, J.S.; Zhao, H.Y. New development of climate change in Northwest China and its impact on Arid Environment. J. Arid Meteorol. 2010, 28, 1–7. [Google Scholar]
- Yang, X.; Yan, J.P. Study on the tendency of climate change and its effect on ecological environment in the SHANNXI-GANSU-NINGXIA Border Area. Adv. Earth Sci. 2003, 18, 127–132. [Google Scholar]
- Adger, W.N.; Brown, K. Land Use and the Causes of Global Warming; John Wiley & Sons: Chichester, UK, 1994. [Google Scholar]
- Dobson, A.P.; Bradshaw, A.D.; Baker, A.J.M. Hopes for the future: Restoration ecology and conservation biology. Science 1997, 277, 515–522. [Google Scholar] [CrossRef]
- Yang, Y.W.; Yu, Q.; Wang, J. Spatio-Temporal variations of principal climatic factors in North China and part of East China within past 40 years. Resour. Sci. 2004, 26, 45–50. [Google Scholar]
- Li, F.X.; Chen, D.; Tang, Q.H. Variations of hydro-meteorological variables in the Yellow River basin and their relationships with the East Asian summer monsoon. Adv. Water Sci. 2015, 26, 481–490. [Google Scholar] [CrossRef]
Figure 1.
Distribution of meteorological stations in the Yellow River Basin.

Figure 2.
Annual and seasonal variability of hydrothermal climate variables in the Yellow River Basin from 1957 to 2015. These indices are obtained averaging each field over the Yellow River Basin. (a) Annual variability; (b) variability in the spring; (c) variability in the summer; (d) variability in the autumn; and (e) variability in the winter.

Figure 3.
Results of the Hurst index experiment on temperature and precipitation in the Yellow River Basin. (a) Results of the 20-year Hurst index experiment; (b) Results of the Hurst index accumulation experiment. Red is the maximum temperature; orange is the average temperature; green is the minimum temperature; and blue is the precipitation amount.


Figure 4.
Past variability (a); Hurst indices (b); and directions of future variability of temperature and precipitation in the Yellow River Basin (c).
Figure 4.
Past variability (a); Hurst indices (b); and directions of future variability of temperature and precipitation in the Yellow River Basin (c).


Table 1.
Hurst index (H) classification.
| Grade | Hurst Index Range | Continuity Intensity | Grade | Hurst Index Range | Discontinuity Intensity |
|---|---|---|---|---|---|
| 1 | 0.5 < H ≤ 0.55 | Very weak | −1 | 0.45 ≤ H < 0.5 | Very weak |
| 2 | 0.55 < H ≤ 0.65 | Relatively weak | −2 | 0.35 ≤ H < 0.45 | Relatively weak |
| 3 | 0.65 < H ≤ 0.75 | Relatively strong | −3 | 0.25 ≤ H < 0.35 | Relatively strong |
| 4 | 0.75 < H ≤ 0.80 | Strong | −4 | 0.2 ≤ H < 0.25 | Strong |
| 5 | 0.80 < H < 1 | Very strong | −5 | 0 < H < 0.2 | Very strong |
Table 2.
Hydrothermal variability and abrupt changes in the Yellow River Basin from 1957 to 2015. M–K: Mann–Kendall.
Table 2.
Hydrothermal variability and abrupt changes in the Yellow River Basin from 1957 to 2015. M–K: Mann–Kendall.
| Season | Method | Maximum Temperature (°C) | Minimum Temperature (°C) | Average Temperature (°C) | Precipitation (mm) |
|---|---|---|---|---|---|
| Year | M–K | 0.26 | 0.36 | 0.28 | −4.40 |
| Pettitt | 1992 | 1985 | 1985 | 1985 | |
| Spring | M–K | 0.28 | 0.33 | 0.29 | −0.65 |
| Pettitt | 1995 | 1995 | 1995 | 2008 | |
| Summer | M–K | 0.12 | 0.25 | 0.14 | −0.49 |
| Pettitt | 1995 | 1992 | 1992 | 1996 | |
| Autumn | M–K | 0.26 | 0.32 | 0.26 | −0.45 |
| Pettitt | 1985 | 1992 | 1985 | 1985 | |
| Winter | M–K | 0.32 | 0.49 | 0.39 | 0.47 |
| Pettitt | 1992 | 1985 | 1985 | 1984 |
© 2018 by the authors. Licensee MDPI, Basel, Switzerland. This article is an open access article distributed under the terms and conditions of the Creative Commons Attribution (CC BY) license (http://creativecommons.org/licenses/by/4.0/).
Share and Cite
MDPI and ACS Style
Ma, L.; Xia, H.; Sun, J.; Wang, H.; Feng, G.; Qin, F. Spatial–Temporal Variability of Hydrothermal Climate Conditions in the Yellow River Basin from 1957 to 2015. Atmosphere 2018, 9, 433. https://doi.org/10.3390/atmos9110433
AMA Style
Ma L, Xia H, Sun J, Wang H, Feng G, Qin F. Spatial–Temporal Variability of Hydrothermal Climate Conditions in the Yellow River Basin from 1957 to 2015. Atmosphere. 2018; 9(11):433. https://doi.org/10.3390/atmos9110433
Chicago/Turabian StyleMa, Liqun, Haoming Xia, Jiulin Sun, Hao Wang, Gary Feng, and Fen Qin. 2018. "Spatial–Temporal Variability of Hydrothermal Climate Conditions in the Yellow River Basin from 1957 to 2015" Atmosphere 9, no. 11: 433. https://doi.org/10.3390/atmos9110433
Note that from the first issue of 2016, this journal uses article numbers instead of page numbers. See further details here.