Article

Community Perceptions of Ecosystem Services and the Management of Mt. Marsabit Forest in Northern Kenya

1
Centre for Advanced Studies in Environmental Law and Policy, University of Nairobi, P.O. Box 30197, Nairobi 00100, Kenya
2
School of Environment, Water and Natural Resources, South Eastern Kenya University, P.O. Box 170, Kitui 90200, Kenya
3
Centre for Development and Environment, University of Bern, Mittelstrasse 43, CH-3012 Bern, Switzerland
*
Author to whom correspondence should be addressed.
Environments 2018, 5(11), 121; https://doi.org/10.3390/environments5110121
Submission received: 28 September 2018 / Revised: 18 October 2018 / Accepted: 1 November 2018 / Published: 5 November 2018

Abstract

:
Identifying and characterizing ecosystem services (ES) has been shown to have an important role in sustainable natural resource management. However, understanding communities’ perspectives is critical in determining opportunities and constraints for ES management in multi-use landscapes. To do so, a study was conducted around Mt. Marsabit forest, a multiuse landscape in Kenya. Using stratification, participants from 11 administrative locations adjacent to the forest were selected. A total of 265 households were interviewed using semi-structured questionnaires. The study analyzed local communities’ perceptions of ES derived from the forest and their involvement in its management. Respondents identified trees, forage, water, fallback land cultivation, aesthetic enjoyment, and shade as key services derived from the forest. However, overexploitation of forest resources has led to degradation. Degradation and insecurity were perceived as the major threats to the ecosystem. The local communities were minimally involved in developing governance structures or management of this forest. Family size, education level, and age were important predictors of level of involvement in management. Lack of involvement in the forest management may have largely contributed to the unsustainable extraction of resources by local communities. We suggest that meaningful engagement of communities in the management of this forest will be critical to its sustainability.

1. Introduction

Forests are a key natural resource altered through intense human activities worldwide, posing severe threats to their integrity [1]. Forests are being converted to other land uses but are also experiencing increased selective exploitation of important indigenous plant species [2]. The on-going loss of key ecosystem services (ES) and biodiversity is undermining the ability of the biophysical environment to sustain human beings and their livelihoods [3]. At the same time, wildlife populations are declining with many forest-dependent species now facing extinction [4]. The scientific community has therefore expressed a strong interest in finding ways to incorporate ES into decision-making processes [5,6,7] as this allows to account for the importance of nature and the environment for human well-being [8,9,10]. The importance of studying these relationships was emphasized by The United Nations Educational, Scientific and Cultural Organization (UNESCO) in its Man and the Biosphere Program, which suggested that such studies would increase the efficiency of natural resource management and ecosystem conservation [11]. The importance of such studies has increased over time [12,13,14,15].
ES in this study were classified according to the four categories suggested by the Millennium Ecosystem Assessment [8]: (1) provisioning services (including quantity of water for domestic consumption and farming, farming opportunities, beekeeping opportunities, firewood, and non-timber forest products); (2) regulating services (including water quality, soil fertility, occurrence of storms & typhoons, occurrence of droughts, forest fires, pest and diseases, air quality, local climate, noise, number of wild animals); (3) cultural services (including recreation, ecotourism, landscape-beauty, and spiritual-value); and (4) supporting services (maintenance of biodiversity).
A better understanding of the contributions of ES to human well-being in resource-rich developing countries can contribute to poverty alleviation and sustainable development [16,17]. According to Cuni-Sanchez et al. [18], social science approaches complement economic and ecological approaches and can help to (a) value cultural ES, (b) understand complex socio-ecological systems, (c) assure social relevance of the ES assessment process, and (d) strengthen the policy relevance of the assessment. To better understand how local communities can be encouraged to participate in co-managing forest conservation, social science is needed to analyze the relationship different people have with the environment [19]. Social science further enables us to understand, create, and engage with institutions, which shape our lives. Social science approaches always challenge prevailing understandings and provide better evidence-based grounded investigations [7]. Sagie et al. [20] state that if management interventions in forest ecosystems recognize local cultures and perspectives this increases the likelihood of participation in management by local people. Furthermore, the assessment of ES demands an integrative triad approach considering ecological, economic, and social evaluation criteria [21,22]. Despite this, in Africa so far the majority of studies has focused on ecological and economic valuation of ES, with fewer studies applying social science methods [23,24].
Forests in Kenya cover 37.6 million ha of which 940,423 ha are protected areas [25,26]. Mt. Marsabit forest is a protected area system in northern Kenya, covering 1100 ha. The ecosystem is unique in being a mist forest in a desert biome. It is an important water catchment and conservation area [27,28] for the desert landscape of northern Kenya. The livelihoods of rural communities living adjacent to the forest are intimately connected to the natural resources provided by this ecosystem [22]. The forest is, however, under threat from encroachment, especially conversion into agricultural land, deforestation through over-abstraction of fuelwood and charcoal (currently fuelwood abstraction rates are 16,382 tons per year), over-grazing by domestic livestock (up to 50,000 heads of livestock were recorded in the forest during the drought of 2009), and wildlife poaching [27,29]. Continued stress on Mt. Marsabit forest reduces its capacity to supply ecosystem services [30], such as water provision, food, wildlife habitats, and carbon sinks, and undermines the conservation of biodiversity [28,31]. Examples of stress induced by the mentioned threats include decline in forest cover, loss of wildlife habitat, decrease in biodiversity, and insufficient supply of spring [32]. There is, therefore, an urgent need for interventions towards more sustainable forest management.
As a multi-use landscape, Mt. Marsabit forest is under different regulatory regimes. It is under dual gazettement as a forest reserve and a national park [27] on the one hand and a county forest [26], on the other hand. Hence, its management involves different stakeholders from the national and county governments as well as adjacent communities. Two national agencies, Kenya Wildlife Service (KWS) and Kenya Forest Service (KFS) hold key positions in its conservation and management. The highly complex management structure of this forest challenges the change towards a more inclusive governance approach, which would encourage the active participation of local communities. Despite conservation efforts and interventions by different stakeholders, forest degradation here has been accelerating [27,32].
The understanding of communities’ perception on ES derived from the forest is an important step in defining their role in the multi-scale governance, and therefore in the sustainable management of the forest. The value system of a person or a group is directly relevant to the perception. Perception in this study is understood as a subjective process, whereby different people may perceive the same environment differently based on particular aspects of the situation they choose to selectively absorb, how they organize this information, and the manner in which they interpret it to obtain a grasp of the situation [33].
This study therefore set out to analyze the perceptions of local communities on ES derived from Mt. Marsabit forest, and their involvement in forest management. The specific objectives were: (1) to establish the perception of different community members regarding the ES provided by Mt. Marsabit forest and the threats to the forest; (2) to assess community members involvement in the management of the forest; and (3) to determine the main factors which affect community members’ participation of in the forest’s management.

2. Materials and Methods
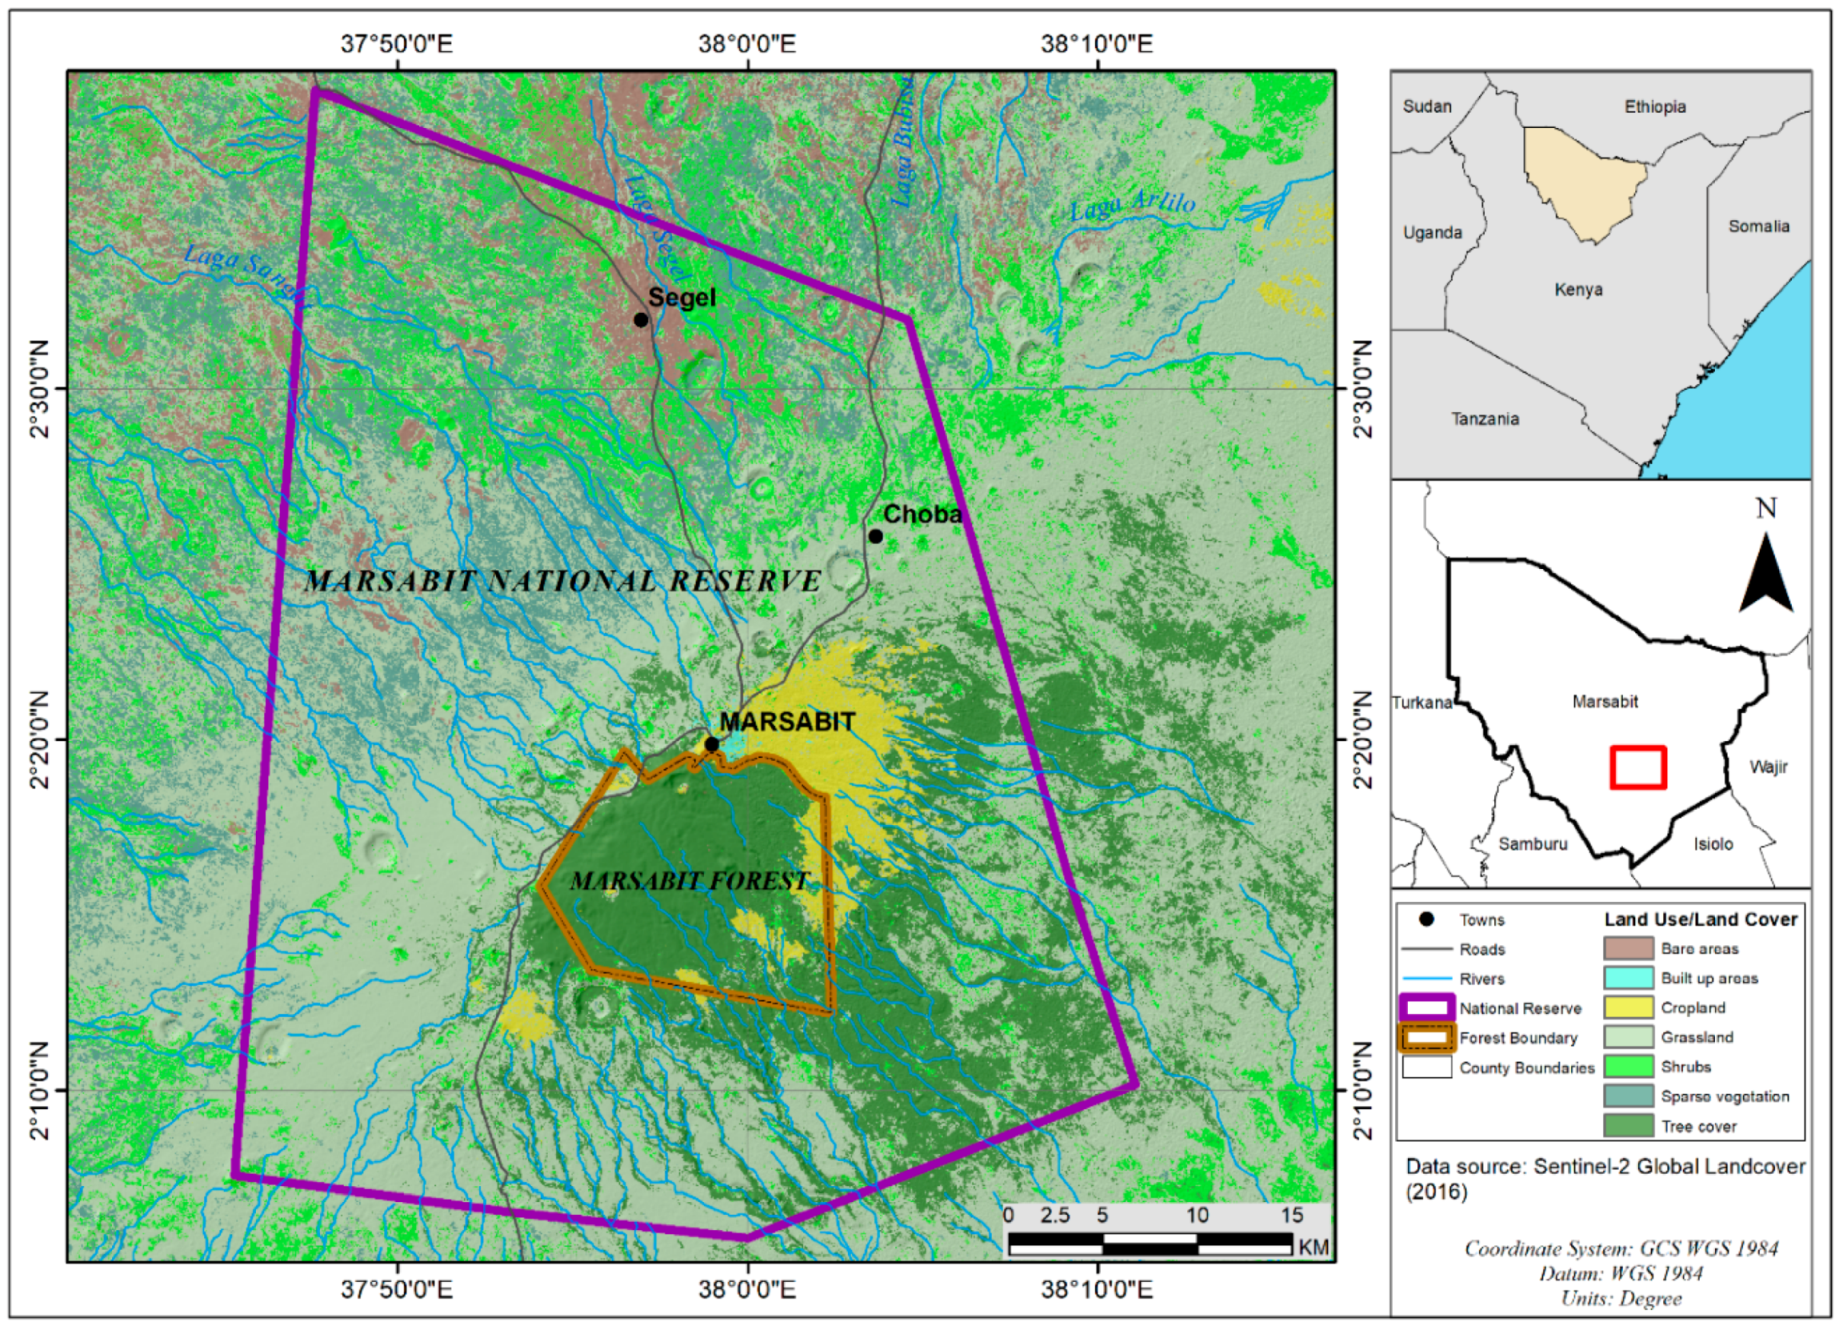
2.1. Study Area

Mt. Marsabit forest (2°19′ N 37°59′ E) is located in Marsabit County, in northern Kenya (Figure 1). The forest covers an extinct Holocene shield volcano characterized by hills and several craters shrouded in mist. The extinct volcano area covers approximately 210,000 ha and is surrounded by expansive low lying arid plains at an altitude of 300–900 m.a.s.l formed by weathered lava flow [4], [27]. The volcano rises almost a kilometer above the surrounding arid plains to a summit of 1865 m above sea level with an elliptical shape about 45 km northwest-southeast (NW-SE) wide and 70 km northeast-southwest (NE-SW) long. The forest has an equatorial climate with rainfall and temperature very different from the surrounding lowlands which exhibit arid and semi-arid conditions [27].
Mt. Marsabit forest experiences a bimodal rainfall pattern ranging from 600 to 1000 mm per year, with a mean annual rainfall of 800 mm. The long rains usually occur between March and May, while the short rains occur between October and January. The temperature ranges between a minimum of 15 °C to a maximum of 26 °C, with an annual average of 20.5 °C. Evaporation rates are high with the total annual potential between 1800–2200 mm. Mt. Marsabit is the watershed for a vast area that encompasses Chalbi Desert to the west, the Milgis basin to the south, and the Shura plains to the east [34].
The population in Marsabit County tripled between 1979 (96,216 inhabitants) and 2009 (291,166 inhabitants) [35]. This huge increase in population can be attributed on the one hand to new births being higher than deaths, and on the other hand to immigration from Ethiopia due to unrest. Devolution is another factor contributing to migration, as it incites Kenyans to migrate towards the counties [36]. The population increase is resulting in increased water and food demand, thus a need of land for agricultural expansion. Residents of Marsabit County have been shifting their livelihoods from nomadic pastoral systems to more sedentary agricultural types over years [34]. There are increasingly small-scale agricultural activities spreading in the area, leading to increased land fragmentation and sedentarization. The rising population and increasing spread of settlements has also led to a decline in forest cover, loss of wildlife habitat, decrease in biodiversity, and insufficient supply of spring and well water [29,32].

2.2. Data Collection

The study was conducted using primary data from a field survey as well as secondary data sources. Secondary data was collected through a comprehensive review of published and non-published documents relating to forest ecosystem governance especially focused on Mt. Marsabit forest. This information was used to provide insights into how socio-ecological processes and governance have changed over time. Primary data was collected from households using a survey questionnaire between March and May 2017.
The survey questionnaire was designed in XLSFORM adapted in Open Data Kit (ODK) for use in a mobile data platform [37]. The questionnaire was used for data collection through an android platform running on tablets to ensure data validity and reliability. The semi-structured questionnaire comprised both open-ended qualitative as well as multiple choice questions. Studies show that this combination of question types counteracts biases of single data sources [38]. The questionnaire was designed to elicit interviewee’s perceptions on (1) ecosystem services provided by Mt. Marsabit forest, (2) observed ecosystem changes, and (3) their involvement in the governance of the ecosystem.
For this study, the ES assessed were selected and adapted from existing studies by Cuni-Sanchez et al. [22], Mogoi et al. [39], and Wangai et al. [40] on ES provided by forests in Kenya.
We used a stratified sampling method to select the households included in the interviews. The first strata required sample size per sub-location, (which is the lowest administrative unit in Kenya), and was determined proportional to the overall population in the sub-locations. This was the most adequate way to ensure that the sample population interviewed was representative of the overall study area. The second strata was determined by proximity to the forest in terms of distance to the forest namely homestead being less than 2 km, 2–5 km, 5–10 km, and more than 10 km to the forest. The third strata was socioeconomic characteristics such that the households differed for example type of roof whether thatched or corrugated iron sheet.
Within the strata there was purposive sampling as once the number of samples per sub-location was determined, a fixed number of sample households to be interviewed per village was determined. To select specific households, local village chiefs were consulted, which indicated household’s availability at the time of the study. The questionnaire was administered to household heads or their representatives aged above 18 in individual households. Enumerators used conducted the interviews in the local dialects. The enumerators were trained for concurrence on interpretation of questions from English to local dialect before administration of the questionnaires. A total of 265 respondents were interviewed.

2.3. Data Analysis

Data was entered into an MS Excel spreadsheet for cleaning and preparation and then transferred to SPSS version 20 for analysis [41]. The analytical focus was on respondent perceptions of ES and involvement in the management of Mt. Marsabit forest. The unit of analysis was the household head. Measures of central tendency (mean) and dispersion (range) were computed to summarize the demographic data. Perceptions on the provision of different ES from Mt. Marsabit forest were analyzed using descriptive statistics. To test for statistical differences between the most important ES provided by Mt. Marsabit forest perceived and the distance of the respondents’ households from the forest, a Fisher’s exact test was performed. Regarding the status of the Mt. Marsabit forest in terms of the perception of threats, ES data was analyzed using Cronbach’s alpha and factor analysis. To explore community participation in forest management by different sociodemographic and biophysical factors, a logistic regression algorithm was used to predict a binary outcome (1, 0) [42]. The logistic regression (general linear model GLM) generated coefficients (and its standard errors and p-values) of a formula to predict a logit transformation of the probability of a community participation in forest management [42].

3. Results

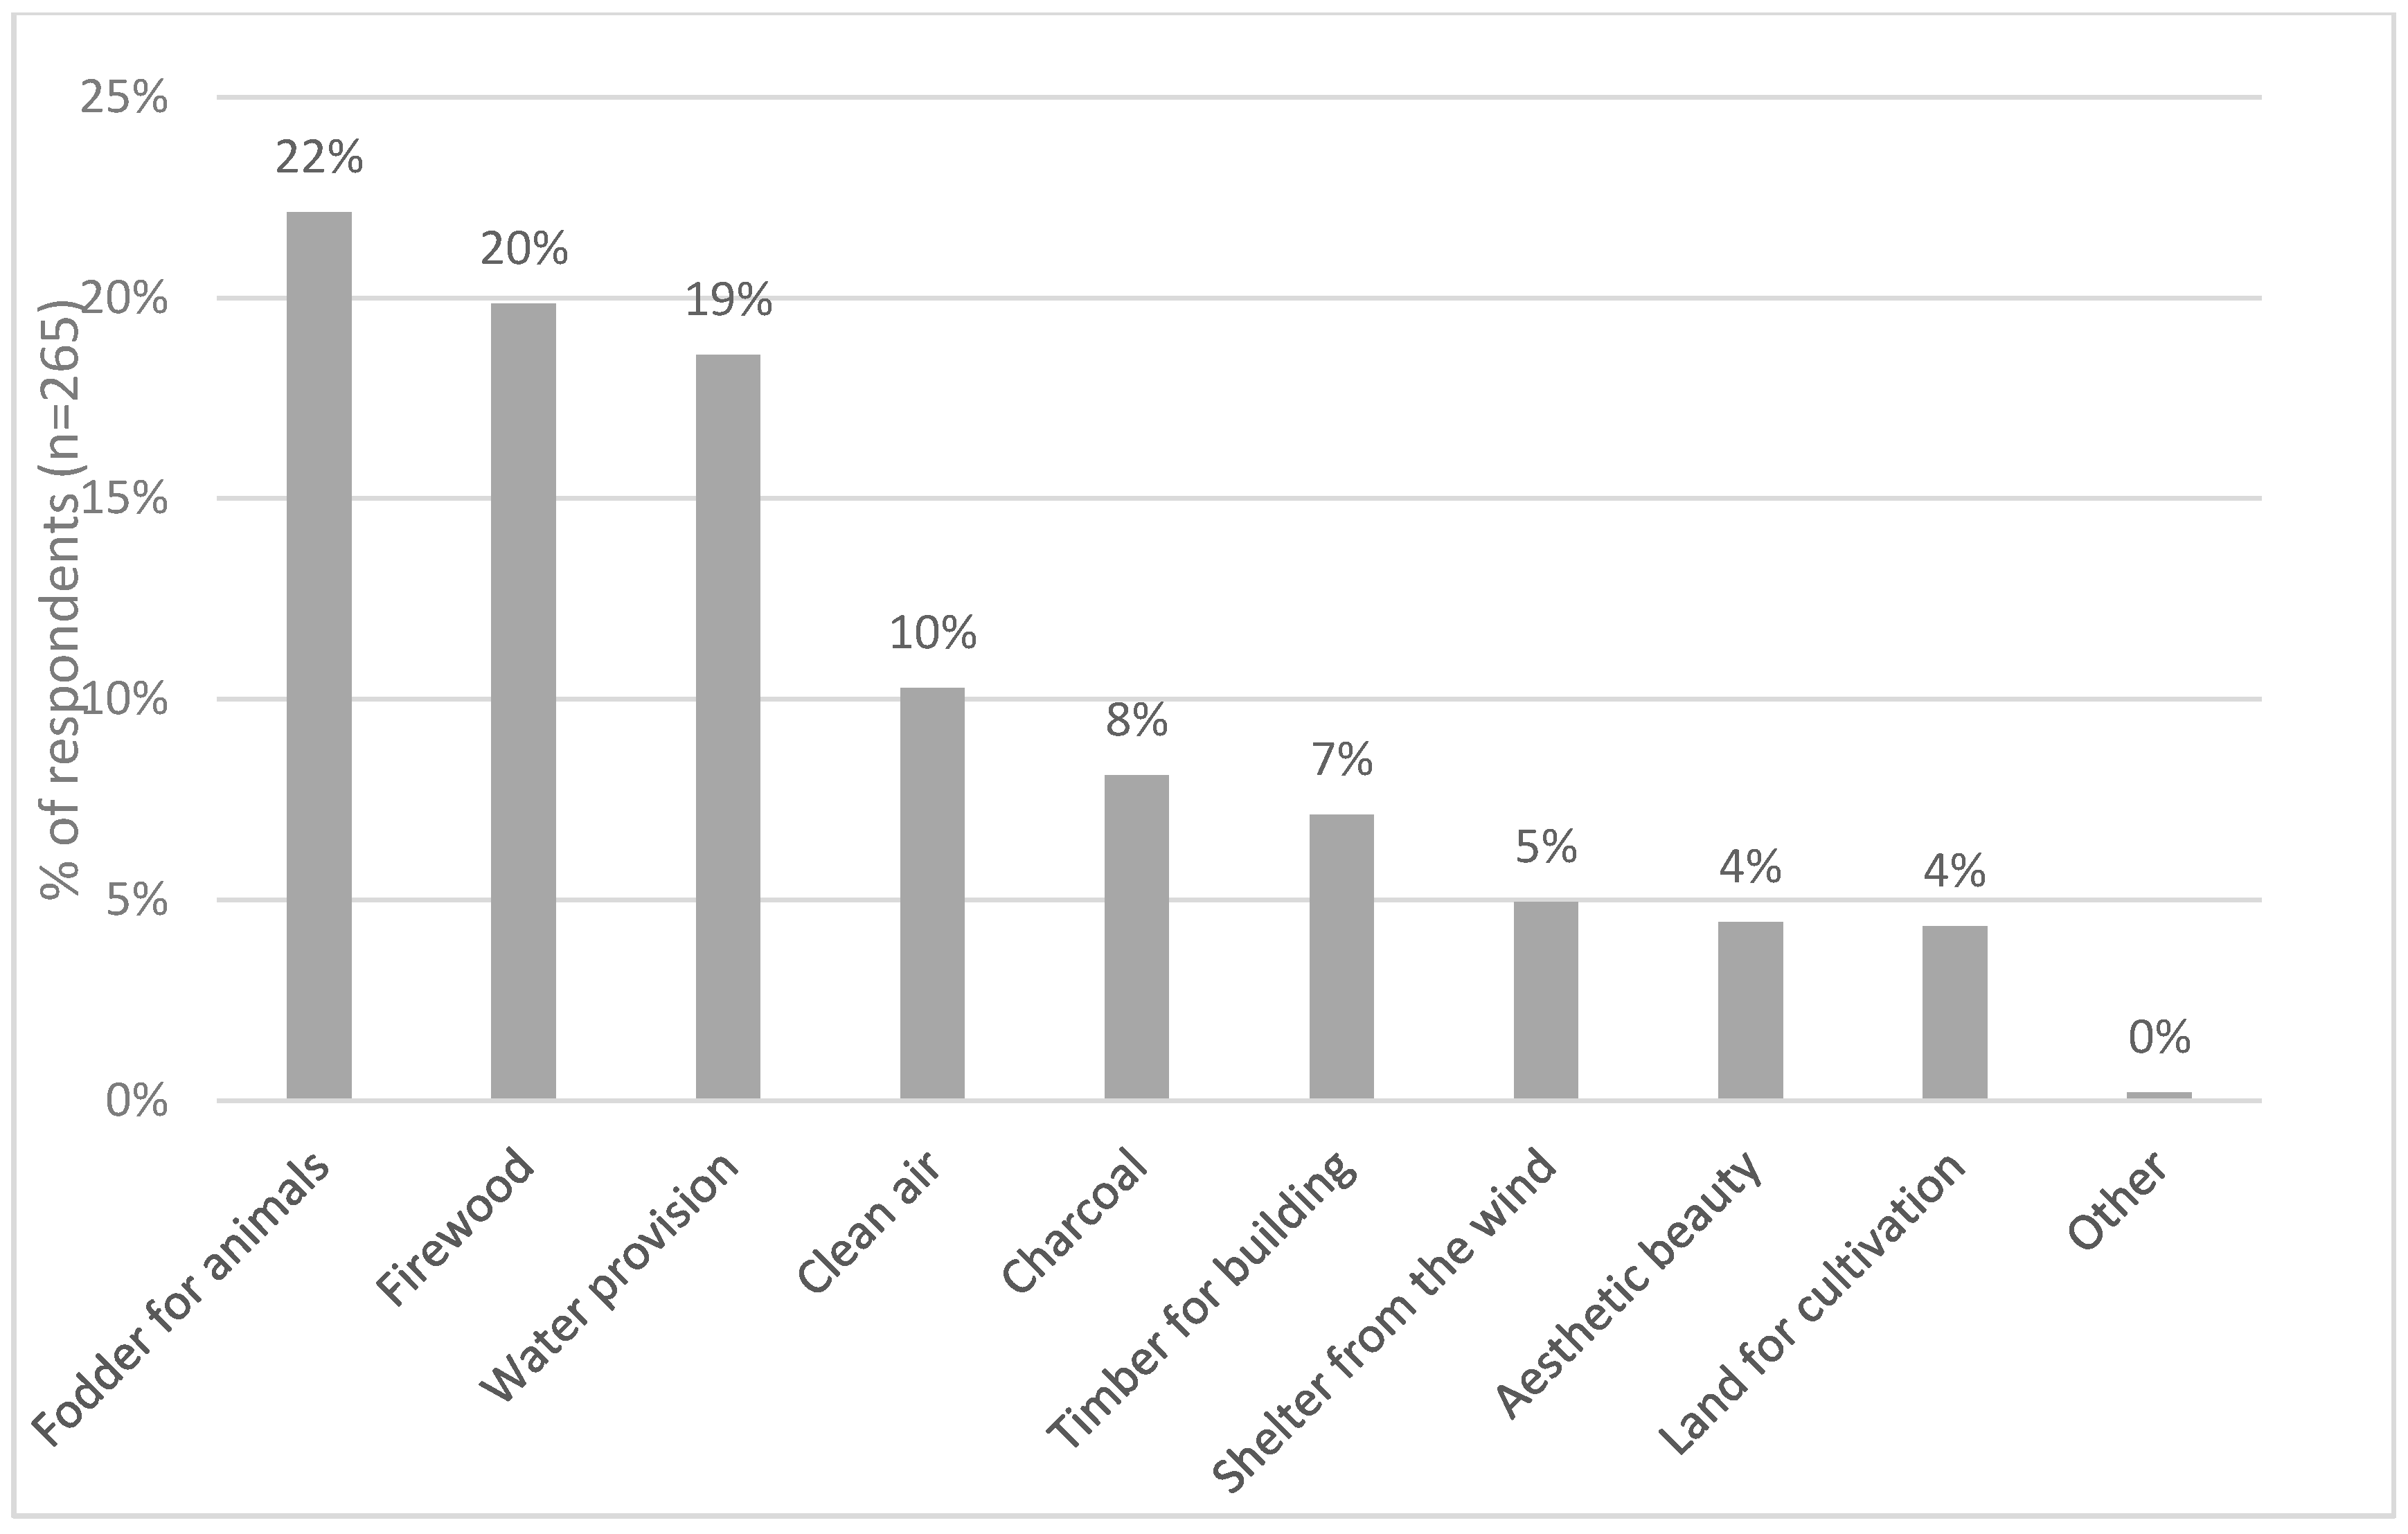
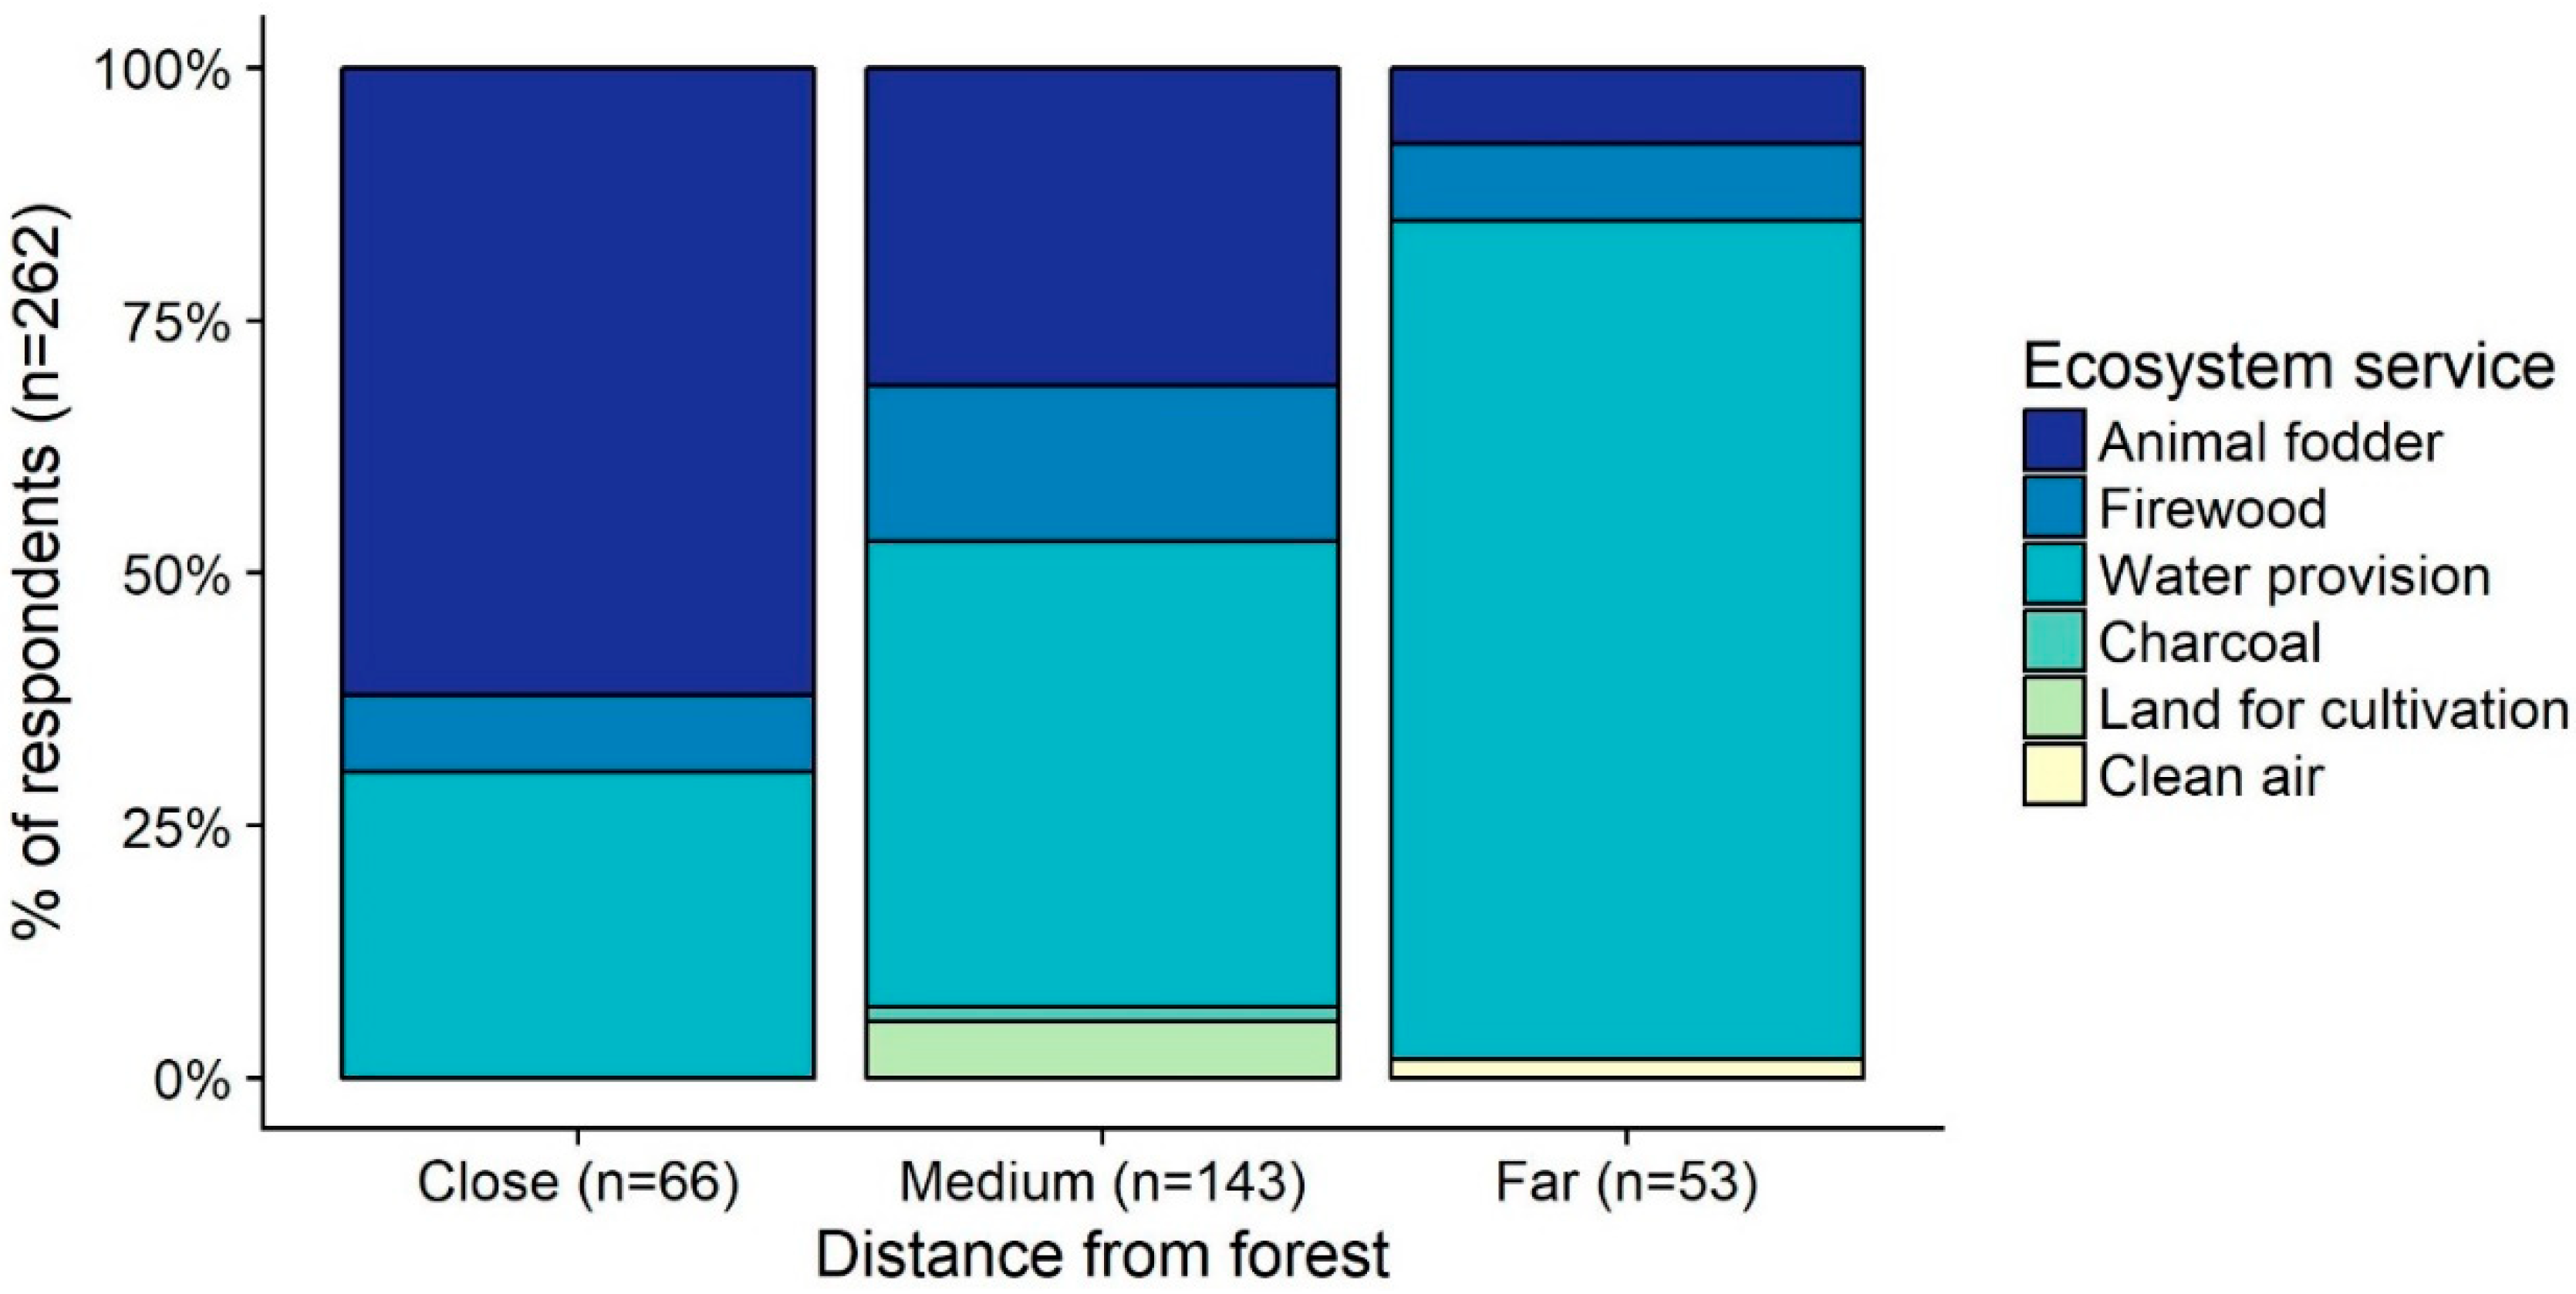
3.1. Perception of Respondents

Of the 265 survey respondents, 53% were male and 47% female. The mean age was 43 years (S.E.M ± 0.9) with the youngest respondent being 20 years and the oldest 97 years old. More than half (58%) of the respondents lacked formal education and the dominant ethnic community was the Boranas (32%). About one-third (29%) of the respondents had a residency of over two decades having settled in the area between 1985 and 1994 (for details on demographics of the sampled households see Appendix A).
The perceived benefits of respondents were both tangible and intangible, and included provisioning and cultural ES for their economic, physical, and social wellbeing (Figure 2). Three most important ecosystem goods and services obtained by communities were animal fodder (22%), firewood (20%), and water (19%). Other goods and services included clean air, charcoal, shade, aesthetic beauty, and land for cultivation. About one-quarter (23%) of respondents identified culture as an important factor in their forest utilization. Cultural practices included the use of Acacia xanthophloea regarded as the head of all trees, but also planting of trees around graves to provide shelter for the dead, cutting branches instead of the whole tree, and using plants as medicine and for sacrifices.
Perception of ES varied between households depending on residential distance to the forest edge. Provision of animal fodder was most important to respondents living within 2 km of the forest, and least so for those living 5 km or more (Figure 3). Conversely, the forest as a source of water was perceived to be more important for respondents living further than nearer the source.
These perceptions of most important ES differed significantly between respondents living in the three distance categories (close, mid, and far). The two main ES perceived as most important by the respondents were animal fodder and water provision. While respondents living “close” to the forest perceived animal fodder as the most important ES, for those in the “Mid” and “Far” categories, water provision was perceived as the most important ES.
Of the, 265 respondents, 54% perceived threats to the Mt. Marsabit forest ecosystem either in the past, present, or in the future (Table 1). Past threats were perceived to be insecurity and degradation. While security as a threat was perceived to have declined and will continue the trend, degradation was considered to have increased and that such trend would persist. Future human population would also increase pressure leading to habitat change.
The main perceived pressure leading to the impacts to the forest ecosystem was overexploitation of the forest, mentioned by 57% of the respondents, followed by overstocking and overgrazing (39%) (Table 2). Other pressures leading to the threats were mentioned only by very few respondents.

3.2. Local Community Involvement in the Management of Mt. Marsabit Forest

Overall, 35% of the respondents (n = 265) stated that they were engaged in conservation activities, while 65% did not engage. The conservation activities they were engaged in were tree planting (80%) and soil conservation measures (20%) of those who affirmed.
About 21% of the respondents (n = 265) are members of a conservation group and of these, 35% attended meetings a few times. For 33% of the respondents, meetings are scheduled monthly, and for 50%, once after 1–3 months. Only, 10% of these respondents hold positions such as a chairperson, vice-chairperson, secretary, treasurer, or committee member, in the group. Of these respondents, 97% belong to only one group, while the remaining 3% are members of between two and five groups. The activities these local conservation groups engage in are income generation, tree planting, and others, namely, patrolling around the forest, looking after wildlife, as well as soil conservation by building gabions.
Only 6% of the respondents (n = 265) have been involved in monitoring the forest through patrols, while 4% have been involved in sanctioning rule breakers. About 18% of the respondents (n = 265) were aware of initiatives by the National and County governments to conserve the forest. The initiatives they cited include: enabling local communities to plant trees in their homesteads (23%), national government agencies hosting meetings to discuss forest conservation (20%), creating awareness on the importance of forests (11%), fencing off the forest by the national government agencies (11%), tree planting by the County government in communal areas and schools (8%), KFS and KWS planting trees in schools (8%), conducting seminars and issuing uniforms to committee members (multi agency county committee for security) involved in patrols (8%), provision of tree seedlings to the local community (5%), measures against poaching and logging (2%), recruiting forest rangers (2%), as well as constructing gabions (2%). Of the respondents who cited the initiatives, 42% (n = 48) of them say that these initiatives have been moderately successful.

3.3. The Main Factors Affecting Participation of Community Members in Forest Management

The results of the binary logistic regression model analysis indicated that different socio-demographic and biophysical related factors influence involvement of community members in management of the forest ecosystem (Table 3). The logistic regression model was statistically significant as shown by the Wald Chi-Squared Test (χ2 (4) = 20.323, p < 0.0005). The model explained 16.1% (Nagelkerke R2) of the variance in community participation and correctly classified 64.1% of cases.
The logistic regression results demonstrated that there was a significant and positive association between family size and level of involvement in management of the forest, indicating that an increase in family size increases the probability of community members’ levels of involvement in the management of the forest. The level of education and level of involvement was also positive and significant. This implied that more educated forest users had a higher probability of involvement in its management. Age was negatively and significantly correlated with level of involvement in forest management, indicating that the older people grow the more likely it is that the probability of participation decreases.

4. Discussion

4.1. Perceptions on Ecosystem Services (ES)

This study investigated how local community members around Mt. Marsabit forest use and perceive their environment and its ecosystem services. The findings reveal a wide range of provisioning and cultural services that the local residents use for their economic, physical, and social wellbeing. Two other types of services, which do not provide humans with direct benefits, but rather are necessary for the production of provisioning and cultural services, namely, supporting services and regulating services, were hardly mentioned by the respondents (except for water, which is considered as both a provisioning service and a supporting service, when it supports primary productivity). This finding supports the conclusions of other researchers, who note that while cultural and provisional services are directly affecting human wellbeing, supporting and regulating services, which are indirectly affecting human wellbeing, are more difficult for people, and even scientific experts, to identify [43]. The results also corroborate the assessment by Christie et al. [38], which showed that residents in developing countries often have greater immediate dependency on ES than those in developed countries. Provisioning ES cited by respondents mainly covered for their basic needs and the resources reported most often were trees and forage for their livestock, spring water (for their livestock and domestic use), and future cultivation land. Water sources and wind (although usually considered climate conditions) were also defined as ES in this study. About 26% of the respondents said that the forest ecosystem was used for agriculture and particularly to raise livestock (Figure 2). Livestock raising in our study area is focused mainly on cows, while goats, sheep, and camels are less common. There is also a notable dependence on the use of provisioning services for fuel. Several respondents cited using fuel wood energy sources from the forest. Dry wood from bushes and trees is used for cooking and heating. However, there was no mention of various types of renewable energy, such as, solar energy, wind power, and bio-diesel, although the government has introduced wind power in Marsabit. Respondents referred to cultural ES in far greater detail than to the provisioning ES. The cultural ES were mainly expressed in terms of aesthetic enjoyment of the landscape and shade provided by trees. According to the typology of sentiments to place presented by Torri et al. [44] the natural environment, including the landscape, as well as climatic and biological components of the ecosystem, can create a strong sense of place, sense of being at home, and an attachment. The respondents also spoke often of the recreational activities that are particularly suited for their environment. They cited that tourists visit and enjoy activities such as camping, bird watching, rhino charge, and watching wild animals. The analysis of ES perceptions by respondents living in different distance from the forest edge showed that while respondents living close to the forest perceived it to be mainly important for livestock grazing, while respondents living further away highlighted the importance of water provision. This shows that disaggregating findings between different categories of land users is important, as they might have different priorities for forest management. Previous studies revealed that perceptions of ecosystems as sources of particular ES vary among respondents as a result of a complex set of factors, including formal education, gender, origin, age, individual needs, cultural traditions, access to ecosystem services, agricultural land ownership, spatial patterns, and household income [1,45,46].

4.2. Perceived Threats to Mt. Marsabit Forest

In this study, insecurity in the past and currently degradation were found to be the main threats to Mt. Marsabit forest ecosystem, which is similar to findings from other studies [47,48] that have flagged human induced activities to be associated with degradation of forests, thus rendering them incapable of continuously supplying ES. The main perceived pressure leading to the impacts to the forest ecosystem was overexploitation of the forest ecosystem and thus a reduction of its ability to supply ES sustainably. These results are related to the perception of the respondents on ES that agriculture and especially crop farming and livestock keeping lead to degradation, which threatens the long-term persistence of the forest ecosystem.

4.3. Community Involvement in Forest Management

The community members in Marsabit are aware of the importance of the forest ecosystem and the goods and services it is providing. However, the community is sparsely involved in forest management, with only 6% having been involved in implementing rules. Recently, interviews carried out on 11 cases of participatory management of forest in Spain and Portugal revealed that transparency and trust, especially between land users and government bodies, are a basis of successful participatory management [49]. If trust is present, participation provides further opportunities to get to know each other’s concerns and take them into account [50]. Without a secure right to access protected-area resources, local communities will always tend to consider the area as “lost villages resources” that are not worth caring for in the long-term [39]. Conservation groups and community-based conservation network encouraging conservation was observed to be a more efficient method to discourage illegal practices elsewhere in Kenya [50].
Mt. Marsabit is currently in the process of forming a community forest association (CFA). The strong link between knowledge of policy and involvement in participatory forest management through Community Forest Association membership was underlined for the Kakamega National Reserve in Kenya in 2012 [39]. It was argued that the involvement of communities could be enhanced by a better diffusion of information and simplification of the management plans, adapted to less educated people. Reticence and fear linked to previous governance are likely to disappear if wardenship of the local communities is respected but also if direct economic benefits are felt amongst the population involved [5].
Changes in management practices will eventually affect forest conservation and regeneration. Recently, Kenya has decentralized the management of natural resources. However, an engaged decentralization process does not necessarily lead to communities’ involvement. It is important for any kind of management plan and especially within a participatory management scheme to make sure the work will be equally shared between villages and communities relying on the resource under management [5].
With respect to the factors influencing levels of involvement in forest management, family size as well as level of education were positively and significantly correlated with level of participation in conservation. This could be because households with larger families have a higher demand for forest products such as fodder and firewood. Education catalyzes the process of information and knowledge flow thus enabling the educated community members to participate in management. Several other studies have also shown that respondents with larger families participated more in community forest management and those without formal education showed low levels of participation in Nepal, Haiti, and Ethiopia, respectively [51,52,53]. On the other hand, age was negatively and significantly correlated to participation in the forest management program. This finding matches results of Nkonya et al. [50], who reported that age had a negative influence on involvement in forest management in Kenya. This could be because the older people are unable to participate in activities requiring physical inputs.
These results show that communities identify with livestock keeping and crop farming. The focus of the community on the ES, which directly benefit them, could explain their minimal involvement in forest management, although they acknowledge that the forest is overexploited and the ES are under threat due to degradation. This has important implications for designing effective strategies to ensure community members’ participation in sustainable forest management. Assessments of local people’s perceptions of ES, such as the one conducted in this study, add to the growing body of policy-relevant knowledge on human–nature relationships [54,55].

5. Conclusions

Our study sought to operationalize the ecosystem service (ES) concept in the analysis of human–environment relationships of a mountain forest landscape in northern Kenya. The findings show that perception of ES among respondents were limited to provisioning and cultural services. However, respondents living within 5 km of the forest perceived different ES from those living greater distances from the forest. This has important policy implications since perceptions on ES influences use of natural resources and hence management strategies in shared ecosystems. The strategies may emphasize the reversing of threats to provisioning and cultural services that community members identify with. Perceptions on regulatory and supporting services, could be raised using targeted environmental education programs.
Due to sociodemographic and biophysical factors, involvement of local communities in management was limited. In order to improve forest conservation, it is necessary to ensure community members participation in sustainable forest management. This requires public support and involvement, which could be enhanced through improved education and governance. The management plans of this protected area should embrace needs and expectations of the local communities. People at different distance from the forest should be targeted differently through management and education interventions. Furthermore, it would be important that people living over 5 km from the forest get to experience the forest through guided visits and participatory mapping of ES to understand more about its benefits.
This study showed underlying problems, which need to be discussed by stakeholders to discern local livelihoods and conservation in protected areas. Long-term engagement with local communities is necessary, in order to instigate social learning processes leading to improved management practices. In order to secure the future of the Mt. Marsabit forest ecosystem, the stakeholders in charge of its governance need to address the weaknesses and threats of the current managerial approach. The improved understanding of perception and knowledge are the basis of effective participatory natural resource management.

Author Contributions

Conceptualization, formal analysis, funding acquisition, methodology, investigation, Writing—Original draft preparation: C.A.O. and N.O.O.; and resources, Writing—Review and editing: R.M., R.K., M.A.O. and J.G.Z.

Funding

The data collection only was supported by the Northern Kenya Biodiversity Conservation (Marsabit) Project KWS/AFD/CKE 1036.

Acknowledgments

The authors wish to thank the field assistants for their precious help in the field and especially Dennis Ojwang. Thanks to Kenya Forest Service, Kenya Wildlife Service, Marsabit County Government and all respondents for their participation and welcoming behavior. We also thank the Northern Kenya Biodiversity project and its coordinators especially Godwin Leslie Muhati, who provided funds for data collection. We would also like to thank fellow students of the University of Nairobi.

Conflicts of Interest

The authors declare no conflict of interest.

Appendix A

Table A1. Demographics of the respondents (n = 265).
Demographic Gender
NFemaleMaleTotal %
Age of respondent18–25204.9%2.6%7.5%
25–357214.7%12.5%27.2%
35–456511.3%13.2%24.5%
45–55527.9%11.7%19.6%
Over 55569.4%11.7%21.1%
Age analysisMean43.38
Median42.0
Std error of means0.888
Minimum20 years
Maximum97 years
Education levelNo Formal Education15331.7%26.0%57.7%
Primary Education6912.1%14.0%26.1%
Secondary Education251.9%7.5%9.4%
College or Tertiary 131.9%3.0%4.9%
University (degree/Masters/PhD) 50.8%1.1%1.9%
Ethnicity Year of Settling in the AreaBorana8513.6%18.5%32.1%
Burji495.7%12.8%18.5%
Gabra5314.7%5.3%20.0%
Kikuyu1 0.4%0.4%
Rendille458.3%8.7%17.0%
Samburu194.5%2.6%7.2%
Turkana131.5%3.4%4.9%
EthnicityBefore 1964201.9%5.7%7.5%
1965–1974285.3%5.3%10.6%
1975–1984264.9%4.9%9.8%
1985–19947611.3%17.4%28.7%
1995–2004407.2%7.9%15.1%
2005–20146916.6%9.4%26.0%
After 201461.1%1.1%2.3%

References

  1. Frank, C.; Kairo, J.G.; Bosire, J.O.; Mohamed, M.O.S.; Dahdouh-Guebas, F.; Koedam, N. Involvement, knowledge and perception in a natural reserve under participatory management: Mida Creek, Kenya. Ocean Coast. Manag. 2017, 142, 28–36. [Google Scholar] [CrossRef]
  2. Bussmann, R.W. Islands in the Desert—Forest Vegetation of Kenya’S Smaller Mountains and Highland Areas (Nyiru, Ndoto, Kulal, Marsabit, Loroghi, Ndare, Mukogodo, Porror, Mathews, Gakoe, Imenti, Ngaia, Nyambeni, Loita, Nguruman, Nairobi). J. East Afr. Nat. Hist. 2002, 91, 27–79. [Google Scholar] [CrossRef]
  3. Costanza, R.; de Groot, R.; Sutton, P.; van der Ploeg, S.; Anderson, S.J.; Kubiszewski, I.; Farber, S.; Turner, R.K. Changes in the global value of ecosystem services. Glob. Environ. Chang. 2014, 26, 152–158. [Google Scholar] [CrossRef]
  4. Ogutu, J.O.; Piepho, H.P.; Said, M.Y.; Ojwang, G.O.; Njino, L.W.; Kifugo, S.C.; Wargute, P.W. Extreme wildlife declines and concurrent increase in livestock numbers in Kenya: What are the causes? PLoS ONE 2016, 11, 1–46. [Google Scholar] [CrossRef] [PubMed]
  5. Reed, M.S. Stakeholder participation for environmental management: A literature review. Biol. Conserv. 2008, 141, 2417–2431. [Google Scholar] [CrossRef]
  6. Hicks, C.C.; Cinner, J.E.; Stoeckl, N.; Mcclanahan, T.R. Linking ecosystem services and human-values theory. Conserv. Biol. 2015, 29, 1471–1480. [Google Scholar] [CrossRef] [PubMed] [Green Version]
  7. Schlüter, M.; Hinkel, J.; Bots, P.W.G.; Arlinghaus, R. Application of the SES framework for model-based analysis of the dynamics of social-ecological systems. Ecol. Soc. 2014, 19, 36. [Google Scholar] [CrossRef]
  8. Millennium Ecosystem Assessment. Ecosystems and Human Well-Being; Island Press: Washington, DC, USA, 2005; pp. 25–36. [Google Scholar]
  9. Díaz, S.; Demissew, S.; Carabias, J.; Joly, C.; Lonsdale, M.; Ash, N.; Larigauderie, A.; Adhikari, J.R.; Arico, S.; Báldi, A.; et al. The IPBES Conceptual Framework—Connecting nature and people. Curr. Opin. Environ. Sustain. 2015, 14, 1–16. [Google Scholar] [CrossRef] [Green Version]
  10. The Economics of Ecosystems and Biodiversity (TEEB). Mainstreaming the Economics of Nature: A Synthesis of the Approach, Conclusions and Recommendations of TEEB; Sukhdev, P., Wittmer, H., Schroter-Schlaack, C., Nesshover, C., Bishop, J., ten Brink, P., Gundimeda, H., Kumar, P., Simmons, B., Eds.; Progress Press: Valletta, Malta, 2010. [Google Scholar]
  11. The United Nations Educational, Scientific and Cultural Organization (UNESCO). International Classification and Mapping of Vegetation; 7 Place de Fontenoy: Paris, France, 1973. [Google Scholar]
  12. Bennett, E.M.; Cramer, W.; Begossi, A.; Cundill, G.; Díaz, S.; Egoh, B.N.; Geijzendorffer, I.R.; Krug, C.B.; Lavorel, S.; Lazos, E.; et al. Linking biodiversity, ecosystem services, and human well-being: Three challenges for designing research for sustainability. Curr. Opin. Environ. Sustain. 2015, 14, 76–85. [Google Scholar] [CrossRef]
  13. Reenberg, A. Land system science: Handling complex series of natural and socio-economic processes. J. Land Use Sci. 2009, 4, 1–4. [Google Scholar] [CrossRef]
  14. Verburg, P.H.; Erb, K.H.; Mertz, O.; Espindola, G. Land System Science: Between global challenges and local realities. Curr. Opin. Environ. Sustain. 2013, 5, 433–437. [Google Scholar] [CrossRef] [PubMed]
  15. Verburg, P.H.; Crossman, N.; Ellis, E.C.; Heinimann, A.; Hostert, P.; Mertz, O.; Nagendra, H.; Sikor, T.; Erb, K.-H.; Golubiewsk, N.; et al. Land system science and sustainable development of the earth system: A global land project perspective. Anthropocene 2015, 12, 29–41. [Google Scholar] [CrossRef] [Green Version]
  16. Chan, K.M.A.; Satterfield, T.; Goldstein, J. Rethinking ecosystem services to better address and navigate cultural values. Ecol. Econ. 2012, 74, 8–18. [Google Scholar] [CrossRef]
  17. Owuor, M.A.; Icely, J.; Newton, A.; Nyunja, J.; Otieno, P.; Tuda, A.O.; Oduor, N. Mapping of ecosystem services flow in Mida Creek, Kenya. Ocean Coast. Manag. 2017, 140, 11–21. [Google Scholar] [CrossRef]
  18. Cuni-Sanchez, A.; Pfeifer, M.; Marchant, R.; Calders, K.; Sorensen, C.L.; Pompeu, P.V.; Lewis, S.L. New insights on above ground biomass and forest attributes in tropical montane forests. For. Ecol. Manag. 2017, 399, 235–246. [Google Scholar] [CrossRef] [Green Version]
  19. Bennett, N.J.; Roth, R.; Klain, S.C.; Chan, K.; Christie, P.; Clark, D.A.; Cullman, G.; Curran, H.; Durbin, T.G.; Epstein, G.; et al. Conservation social science: Understanding and integrating human dimensions to improve conservation. Biol. Conserv. 2017, 205, 93–108. [Google Scholar] [CrossRef]
  20. Sagie, H.; Morris, A.; Rofè, Y.; Orenstein, D.E.; Groner, E. Cross-cultural perceptions of ecosystem services: A social inquiry on both sides of the Israeli-Jordanian border of the Southern Arava Valley Desert. J. Arid Environ. 2013, 97, 38–48. [Google Scholar] [CrossRef]
  21. de Groot, R.S.; Alkemade, R.; Braat, L.; Hein, L.; Willemen, L. Challenges in integrating the concept of ecosystem services and values in landscape planning, management and decision making. Ecol. Complex. 2010, 7, 260–272. [Google Scholar] [CrossRef]
  22. Cuni-Sanchez, A.; Pfeifer, M.; Marchant, R.; Burgess, N.D. Ethnic and locational differences in ecosystem service values: Insights from the communities in forest islands in the desert. Ecosyst. Serv. 2016, 19, 42–50. [Google Scholar] [CrossRef]
  23. Wangai, P.W.; Burkhard, B.; Müller, F. A review of studies on ecosystem services in Africa. Int. J. Sustain. Built Environ. 2016, 5, 225–245. [Google Scholar] [CrossRef]
  24. Greiner, C. Pastoralism and Land-Tenure Change in Kenya: The Failure of Customary Institutions. Dev. Chang. 2017, 48, 78–97. [Google Scholar] [CrossRef]
  25. Ministry of Environment and Natural Resources. National Forest Programme of Kenya; MENR: Nairobi, Kenya, 2016.
  26. Republic of Kenya. Forest Conservation and Management Act No 34 of 2016; Kenya Law: Nairobi, Kenya, 2016.
  27. Robinson, L.W. Mt. Marsabit, Kenya: An Assessment of the Governance System; Vancouver Island University: Nanaimo, BC, Canada, 2013. [Google Scholar]
  28. Ministry of Forestry and Wildlife. Analysis of Drivers and Underlying Causes of Forest Cover Change in the Various Forest Types of Kenya; Ruri Consultants: Nairobi, Kenya, 2013.
  29. Country Government of Marsabit. Marsabit County Integrated Development Plan. Available online: http://www.ke.undp.org/content/dam/kenya/docs/Democratic%20Governance/Marsabit%20County%20%20Revised%20CIDP.pdf (accessed on 28 September 2018).
  30. Zaehringer, J.G.; Schwilch, G.; Andriamihaja, O.R.; Ramamonjisoa, B.; Messerli, P. Remote sensing combined with social-ecological data: The importance of diverse land uses for ecosystem service provision in north-eastern Madagascar. Ecosyst. Serv. 2017, 25, 140–152. [Google Scholar] [CrossRef]
  31. Venkanna, K.; Mandal, U.; Aluri, J.S.R.; Sharma, K.L.; Adake, R.V.; Pushpanjali, P.; Reddy, B.S.; Masane, R.; Venkatravamma, K.; Babu, B.P. Carbon stocks in major soil types and land-use systems in semiarid tropical region of southern India. Curr. Sci. 2014, 106, 604–611. [Google Scholar]
  32. Oroda, A.S. The Impact of Increased Population and Sedentarization of the Pastoral Communities on Land Cover and the Resources of Mount Marsabit Forest and Surrounding Lands. Ph.D. Thesis, Kenyatta University, Nairobi, Kenya, 2011. [Google Scholar]
  33. Ingold, T. The Perception of the Environment: Essays on Livelihood, Dwelling and Skill; Taylor and Francis: London, UK, 2000. [Google Scholar]
  34. Maina, P.M.; Imwati, A.T. Use of Geoinformation Technology in Assessing Nexus between Ecosystem Changes and Wildlife Distribution: A Case Study of Mt. Marsabit Forest. Int. J. Sci. Res. 2015, 4, 718–724. [Google Scholar]
  35. Republic of Kenya. Kenya: Facts and Figures; Kenya National Bureau of Statistics: Nairobi, Kenya, 2014.
  36. Munya, A.; Hussain, N.H.M.; Njuguna, M.B. Can devolution and rural capacity trigger de-urbanization? Case studies in Kenya and Malaysia respectively. GeoJournal 2015, 80, 427–443. [Google Scholar] [CrossRef]
  37. Jeffrey-Coker, F.; Basinger, M. Open Data Kit: Implications for the Use of Smartphone Software Technology for Questionnaire Studies in International Development. 2010. Available online: https://qsel.columbia.edu/assets/uploads/blog/2013/06/Open-Data-Kit-Review-Article.pdf (accessed on 5 November 2018).
  38. Christie, M.; Cooper, R.; Hyde, T.; Fazey, I. An Evaluation of Economic and Non-Economic Techniques for Assessing the Importance of Biodiversity to People in Developing Countries; No. I; Defra: London, UK, 2008; p. 22. [Google Scholar]
  39. Mogoi, J.; Obonyo, E.; Ongugo, P.; Oeba, V.; Mwangi, E. Communities, Property Rights and Forest Decentralisation in Kenya: Early Lessons from Participatory Forestry Management. Conserv. Soc. 2012, 10, 182–194. [Google Scholar]
  40. Wangai, P.W.; Burkhard, B.; Kruse, M.; Müller, F. Contributing to the cultural ecosystem services and human wellbeing debate: A case study application on indicators and linkages. Landsc. Online 2017, 50, 1–27. [Google Scholar]
  41. International Business Machines. SPSS Statistics for Windows, Version 20.0; IBM Corp.: Armonk, NY, USA, 2011. [Google Scholar]
  42. Dreiseitl, S.; Ohno-Machado, L. Logistic regression and artificial neural network classification models: A methodology review. J. Biomed. Inform. 2002, 35, 352–359. [Google Scholar] [CrossRef]
  43. Fisher, B.; Bateman, I.J.; Turner, R.K. Valuing Ecosystem Services: Benefits, Values, Space and Time; Routledge: London, UK, 2011; p. 11. [Google Scholar]
  44. Bouahim, S.; Rhazi, L.; Ernoul, L.; Mathevet, R.; Amami, B.; Er-Riyahi, S.; Muller, S.D.; Grillas, P. Combining vulnerability analysis and perceptions of ecosystem services in sensitive landscapes: A case from western Moroccan temporary wetlands. J. Nat. Conserv. 2011, 27, 1–9. [Google Scholar] [CrossRef]
  45. Muhamad, D.; Okubo, S.; Harashina, K.; Parikesit, P.; Gunawan, B.; Takeuchi, K. Living close to forests enhances people[U+05F3]s perception of ecosystem services in a forest-agricultural landscape of West Java, Indonesia. Ecosyst. Serv. 2014, 8, 197–206. [Google Scholar] [CrossRef]
  46. Agbenyega, O.; Burgess, P.J.; Cook, M.; Morris, J. Application of an ecosystem function framework to perceptions of community woodlands. Land Use Policy 2009, 26, 551–557. [Google Scholar] [CrossRef] [Green Version]
  47. Imo, M. Forest Degradation in Kenya: Impacts of Social, Economic and Political Transitions. In Kenya: Social, Environmental and Political Issues; Adoyo, J.W., Wangai, C.I., Eds.; Nova Science Publishers: Hauppauge, NY, USA, 2012. [Google Scholar]
  48. Randhir, T.O.; Erol, A. Emerging Threats to Forests: Resilience and Strategies at System Scale. Am. J. Plant Sci. 2013, 4, 739–748. [Google Scholar] [CrossRef]
  49. Deressa, T.T.; Africa Growth Initiative. Climate Change and Growth in Africa: Challenges and the Way Forward. Available online: https://www.brookings.edu/wp-content/uploads/2016/07/09-foresight-climate-change-growth-africa-deressa-1.pdf (accessed on 28 September 2018).
  50. Nkonya, E.; Braun, J.V.; Mirzabaev, A.; Le, Q.; Kwon, H.-Y.; Kirui, O. Concepts and Methods of Global Assessment of the Economics of Land Degradation and Improvement. In Economics of Land Degradation and Improvement—A Global Assessment for Sustainable Development; Springer: Berlin, Germany, 2016; pp. 15–32. [Google Scholar]
  51. Tadesse, S.; Woldetsadik, M.; Senbeta, F. Forest users’ level of participation in a participatory forest management program in southwestern Ethiopia. For. Sci. Technol. 2017, 13, 164–173. [Google Scholar] [CrossRef] [Green Version]
  52. Chhetri, B.B.K.; Johnsen, F.H.; Konoshima, M.; Yoshimoto, A. Community forestry in the hills of Nepal: Determinants of user participation in forest management. For. Policy Econ. 2013, 30, 6–13. [Google Scholar] [CrossRef]
  53. Dolisca, F.; Carter, D.R.; McDaniel, J.M.; Shannon, D.A.; Jolly, C.M. Factors influencing farmers’ participation in forestry management programs: A case study from Haiti. For. Ecol. Manag. 2006, 236, 324–331. [Google Scholar] [CrossRef]
  54. Sachs, J.D. From millennium development goals to sustainable development goals. Lancet 2012, 379, 2206–2211. [Google Scholar] [CrossRef]
  55. Pascual, U.; Palomo, I.; Adams, W.M.; Chan, K.M.; Daw, T.M.; Garmendia, E.; Gómez-Baggethun, E.; de Groot, R.S.; Mace, G.M.; Martín-López, B.; et al. Off-stage ecosystem service burdens: A blind spot for global sustainability. Environ. Res. Lett. 2017, 12, 075001. [Google Scholar] [CrossRef] [Green Version]
Figure 1. Location of Mt. Marsabit Forest Ecosystem in northern Kenya showing land use and landcover 2016.
Environments 05 00121 g001
Figure 2. Perception of the most important ecosystem services (ES) provided by Mt. Marsabit forest (several responses possible).
Environments 05 00121 g002
Figure 3. Perception of most important ES by respondents living in different distance from the forest “close” indicates a distance of less than 1 km to 2 km from the forest edge; “mid” means between 2 and 5 km, and households in the “far” category live between 5 km and more than 10 km from the forest.
Environments 05 00121 g003
Table 1. Perceived threats to the Mt. Marsabit forest ecosystem (n = 144).
ThreatsIn the PastIn the PresentIn the Future
Frequency%Frequency%Frequency%
Insecurity6243.14027.83322.9
Change in climate128.32316.0128.3
New emerging diseases10.7 0 0
Habitat change64.296.31913.2
Degradation5638.95840.35638.9
Human population pressure74.9149.72416.7
Total144100144100144100
Table 2. Perceived pressures and impacts to Mt. Marsabit forest ecosystem (n = 265).
Perceived Pressures to Mt. MarsabitPercent
Overexploitation of forests57.4
Overstocking and overgrazing38.5
Loss of soil and productivity1.5
Cultivation on steep slopes1.1
Drying up of river sources0.8
Loss of insects/plants/animals (biodiversity)0.4
Other0.4
Total100.0
Table 3. Results of logistic regression model analysis.
Variables TestedβS.E.WalddfSig.Exp (B)
Main impact of threat0.2030.1751.34710.2461.225
Most important ES0.2730.1523.21410.0731.313
Education level0.2450.1164.47410.0341.278
Gender−0.5370.2913.40810.0650.584
Respondent’s age−0.0440.0158.47010.0040.957
Family size0.1500.0734.15310.0421.161
Land size (acres)0.0780.0850.83210.3621.081
Distance to forest (km)−0.2320.1542.28410.1310.793
Constant0.0130.8340.00010.9881.013
S.E.: Standard Error; df: degree of freedom; Sig.: significance level; Exp (B): exponentiation of the B coefficient.

