Article

Prognostic Values of EPDR1 Hypermethylation and Its Inhibitory Function on Tumor Invasion in Colorectal Cancer

1
Institute of Pharmacology, National Yang-Ming University, Taipei 11221, Taiwan
2
Department of Surgery, Koo Foundation, Sun Yat-Sen Cancer Center, Taipei 11259, Taiwan
3
Division of Colon & Rectal Surgery, Department of Surgery, Taipei Veterans General Hospital, Taipei 11217, Taiwan
4
Institute of Biomedical Sciences, Academia Sinica, Taipei 11529, Taiwan
5
Department of Surgery, National Yang-Ming University Hospital, Yilan 26058, Taiwan
6
Department of Pharmacology, Tzu Chi University, Hualien 97004, Taiwan
*
Authors to whom correspondence should be addressed.
Cancers 2018, 10(10), 393; https://doi.org/10.3390/cancers10100393
Submission received: 6 September 2018 / Revised: 17 October 2018 / Accepted: 18 October 2018 / Published: 22 October 2018

Abstract

:
Aberrant DNA methylation is a potential mechanism underlying the development of colorectal cancer (CRC). Thus, identification of prognostic DNA methylation markers and understanding the related molecular functions may offer a new perspective on CRC pathogenesis. To that end, we explored DNA methylation profile changes in CRC subtypes based on the microsatellite instability (MSI) status through genome-wide DNA methylation profiling analysis. Of 34 altered genes, three hypermethylated (epidermal growth factor, EGF; carbohydrate sulfotransferase 10, CHST10; ependymin related 1, EPDR1) and two hypomethylated (bone marrow stromal antigen 2, BST2; Rac family small GTPase 3, RAC3) candidates were further validated in CRC patients. Based on quantitative methylation-specific polymerase chain reaction (Q-MSP), EGF, CHST10 and EPDR1 showed higher hypermethylated levels in CRC tissues than those in adjacent normal tissues, whereas BST2 showed hypomethylation in CRC tissues relative to adjacent normal tissues. Additionally, among 75 CRC patients, hypermethylation of CHST10 and EPDR1 was significantly correlated with the MSI status and a better prognosis. Moreover, EPDR1 hypermethylation was significantly correlated with node negativity and a lower tumor stage as well as with mutations in B-Raf proto-oncogene serine/threonine kinase (BRAF) and human transforming growth factor beta receptor 2 (TGFβR2). Conversely, a negative correlation between the mRNA expression and methylation levels of EPDR1 in CRC tissues and cell lines was observed, revealing that DNA methylation has a crucial function in modulating EPDR1 expression in CRC cells. EPDR1 knockdown by a transient small interfering RNA significantly suppressed invasion by CRC cells, suggesting that decreased EPDR1 levels may attenuate CRC cell invasion. These results suggest that DNA methylation-mediated EPDR1 epigenetic silencing may play an important role in preventing CRC progression.

1. Introduction

Colorectal cancer (CRC) is the third most common cancer and fourth leading cause of cancer death worldwide. In 2016, an estimated 134,490 cases of CRC were diagnosed, with 49,190 deaths in the United States [1]. The risks for CRC include age, obesity, physical inactivity, smoking, alcohol drinking, high consumption of red or processed meat, low calcium intake, and very low intake of fruit and vegetables [1]. Additionally, hereditary factors include a family history of CRC and/or polyps, Lynch syndrome, and a personal history of chronic inflammatory bowel disease [2]. Common treatments for CRC include surgery, radiation, and chemotherapy. However, the 5- and 10-year survival rates for CRC are 65% and 58%, respectively [2]. Furthermore, approximately 50% of CRC patients will develop liver metastasis during the course of their disease [3], and the 10-year survival rates of these patients are only 17 to 28% [4]. Therefore, early detection and identification of useful diagnostic and prognostic markers are key to increase CRC survival rates.
Evidence accumulated since the 1990s has demonstrated three molecular pathways involved in CRC pathogenesis: chromosomal instability (CIN), microsatellite instability (MSI), and the CpG island methylator phenotype (CIMP). Through the CIN pathway, genetic alterations are generated in tumor suppressor genes (such as adenomatous polyposis coli (APC), tumor protein 53 (TP53) and SMAD family member 4 (SMAD4)) and oncogenes (such as K-ras proto-oncogene, KRAS and phosphoinositide 3-kinase catalytic subunit-α (PI3KCA)), resulting in CRC development [5,6,7]. Approximately 15% of CRCs present with MSI due to either defective DNA mismatch repair (MMR) induced by a mutation or methylation of an MMR gene (mutL homolog 1, MLH1; mutS protein homolog 2, MSH2; mutS homolog 6, MSH6; or PMS1 homolog 2, PMS2) promoter [8,9].
Epigenomic studies have demonstrated that tumors with MSI have a high CIMP phenotype and, hence, exhibit hypermethylation of genes critical for tumor progression [10,11]. MLH1 methylation is a main event observed in CRC with high CIMP (CIMP-H) [12]. In fact, high MSI (MSI-H) and CIMP-H share similar molecular features because nearly all MSI-H CRCs are molecularly based on hypermethylation-induced silencing of the MLH1 gene promoter [12]. CRCs with MSI and/or CIMP have distinct clinicopathological features, including the following: a tendency to arise in the proximal colon, lymphocytic infiltration, and a poorly differentiated, mucinous or signet ring appearance [13,14,15,16]. Additionally, these cases have a better prognosis than those without MSI but show no benefit from 5-fluorouracil (5-FU) treatment [17,18,19,20]. Overall, identification of biomarkers for MSI and/or CIMP and understanding the related molecular functions may offer a new perspective about MSI in CRC.
Epigenetic dysregulation of gene expression plays a vital role in the initiation and progression of cancer. DNA methylation is an epigenetic process through which the silencing of gene expression occurs and can be reversed by a DNA-demethylating agent, such as 5-aza-2’-deoxycytidine (5-Azadc). CIMP in CRC is characterized by simultaneous hypermethylation of CpG islands in a subset of genes [10]. To assess CRC CIMP, Weisenberger et al. developed a marker panel of five genes (calcium voltage-gated channel subunit alpha1 G, CACNA1G; insulin-like growth factor-2, IGF2; neurogenin-1, NEUROG1; runt-related transcription factor 3, RUNX3; and suppressor of cytokine signaling 1, SOCS1) [21]. Additionally, MSI patients with a methylated MLH1 promoter have high CIMP, another epigenetic feature that is clinically valuable to predict outcomes in CRC patients. Indeed, aberrant DNA methylation is a common and early alteration in many types of human cancer, including CRC [22,23,24]. To date, hypermethylation of the promoter of several genes, including APC, p16INK4a, tissue inhibitor of metallopeptidase-3 (TIMP3), twist-related protein 1 (TWIST1), and growth arrest-specific 7 (GAS7), has been reported in CRC [25,26], and several DNA methylation markers have been proposed as useful early biomarkers to detect CRC [27,28,29]. Thus, molecular studies aimed at discovering CRC-specific methylation markers may provide useful insight into the molecular mechanisms of CRC progression.
In this study, we explored DNA methylation profile changes in CRC with MSI. Five aberrantly methylated genes (epidermal growth factor, EGF; carbohydrate sulfotransferase 10, CHST10; ependymin related 1, EPDR1; bone marrow stromal antigen 2, BST2; and Rac family small GTPase 3, RAC3) were further verified in CRC tumor tissues. We investigated the clinical relevance of the methylation status of these five genes in CRC patients. We further demonstrated a negative correlation between the mRNA expression and DNA methylation levels of EPDR1 in CRC tissues and cell lines, indicating that DNA methylation may have a major function in modulating EPDR1 expression in CRC cells. Additionally, we explored the inhibitory function on the tumor invasion of EPDR1 in CRC cells.

2. Results

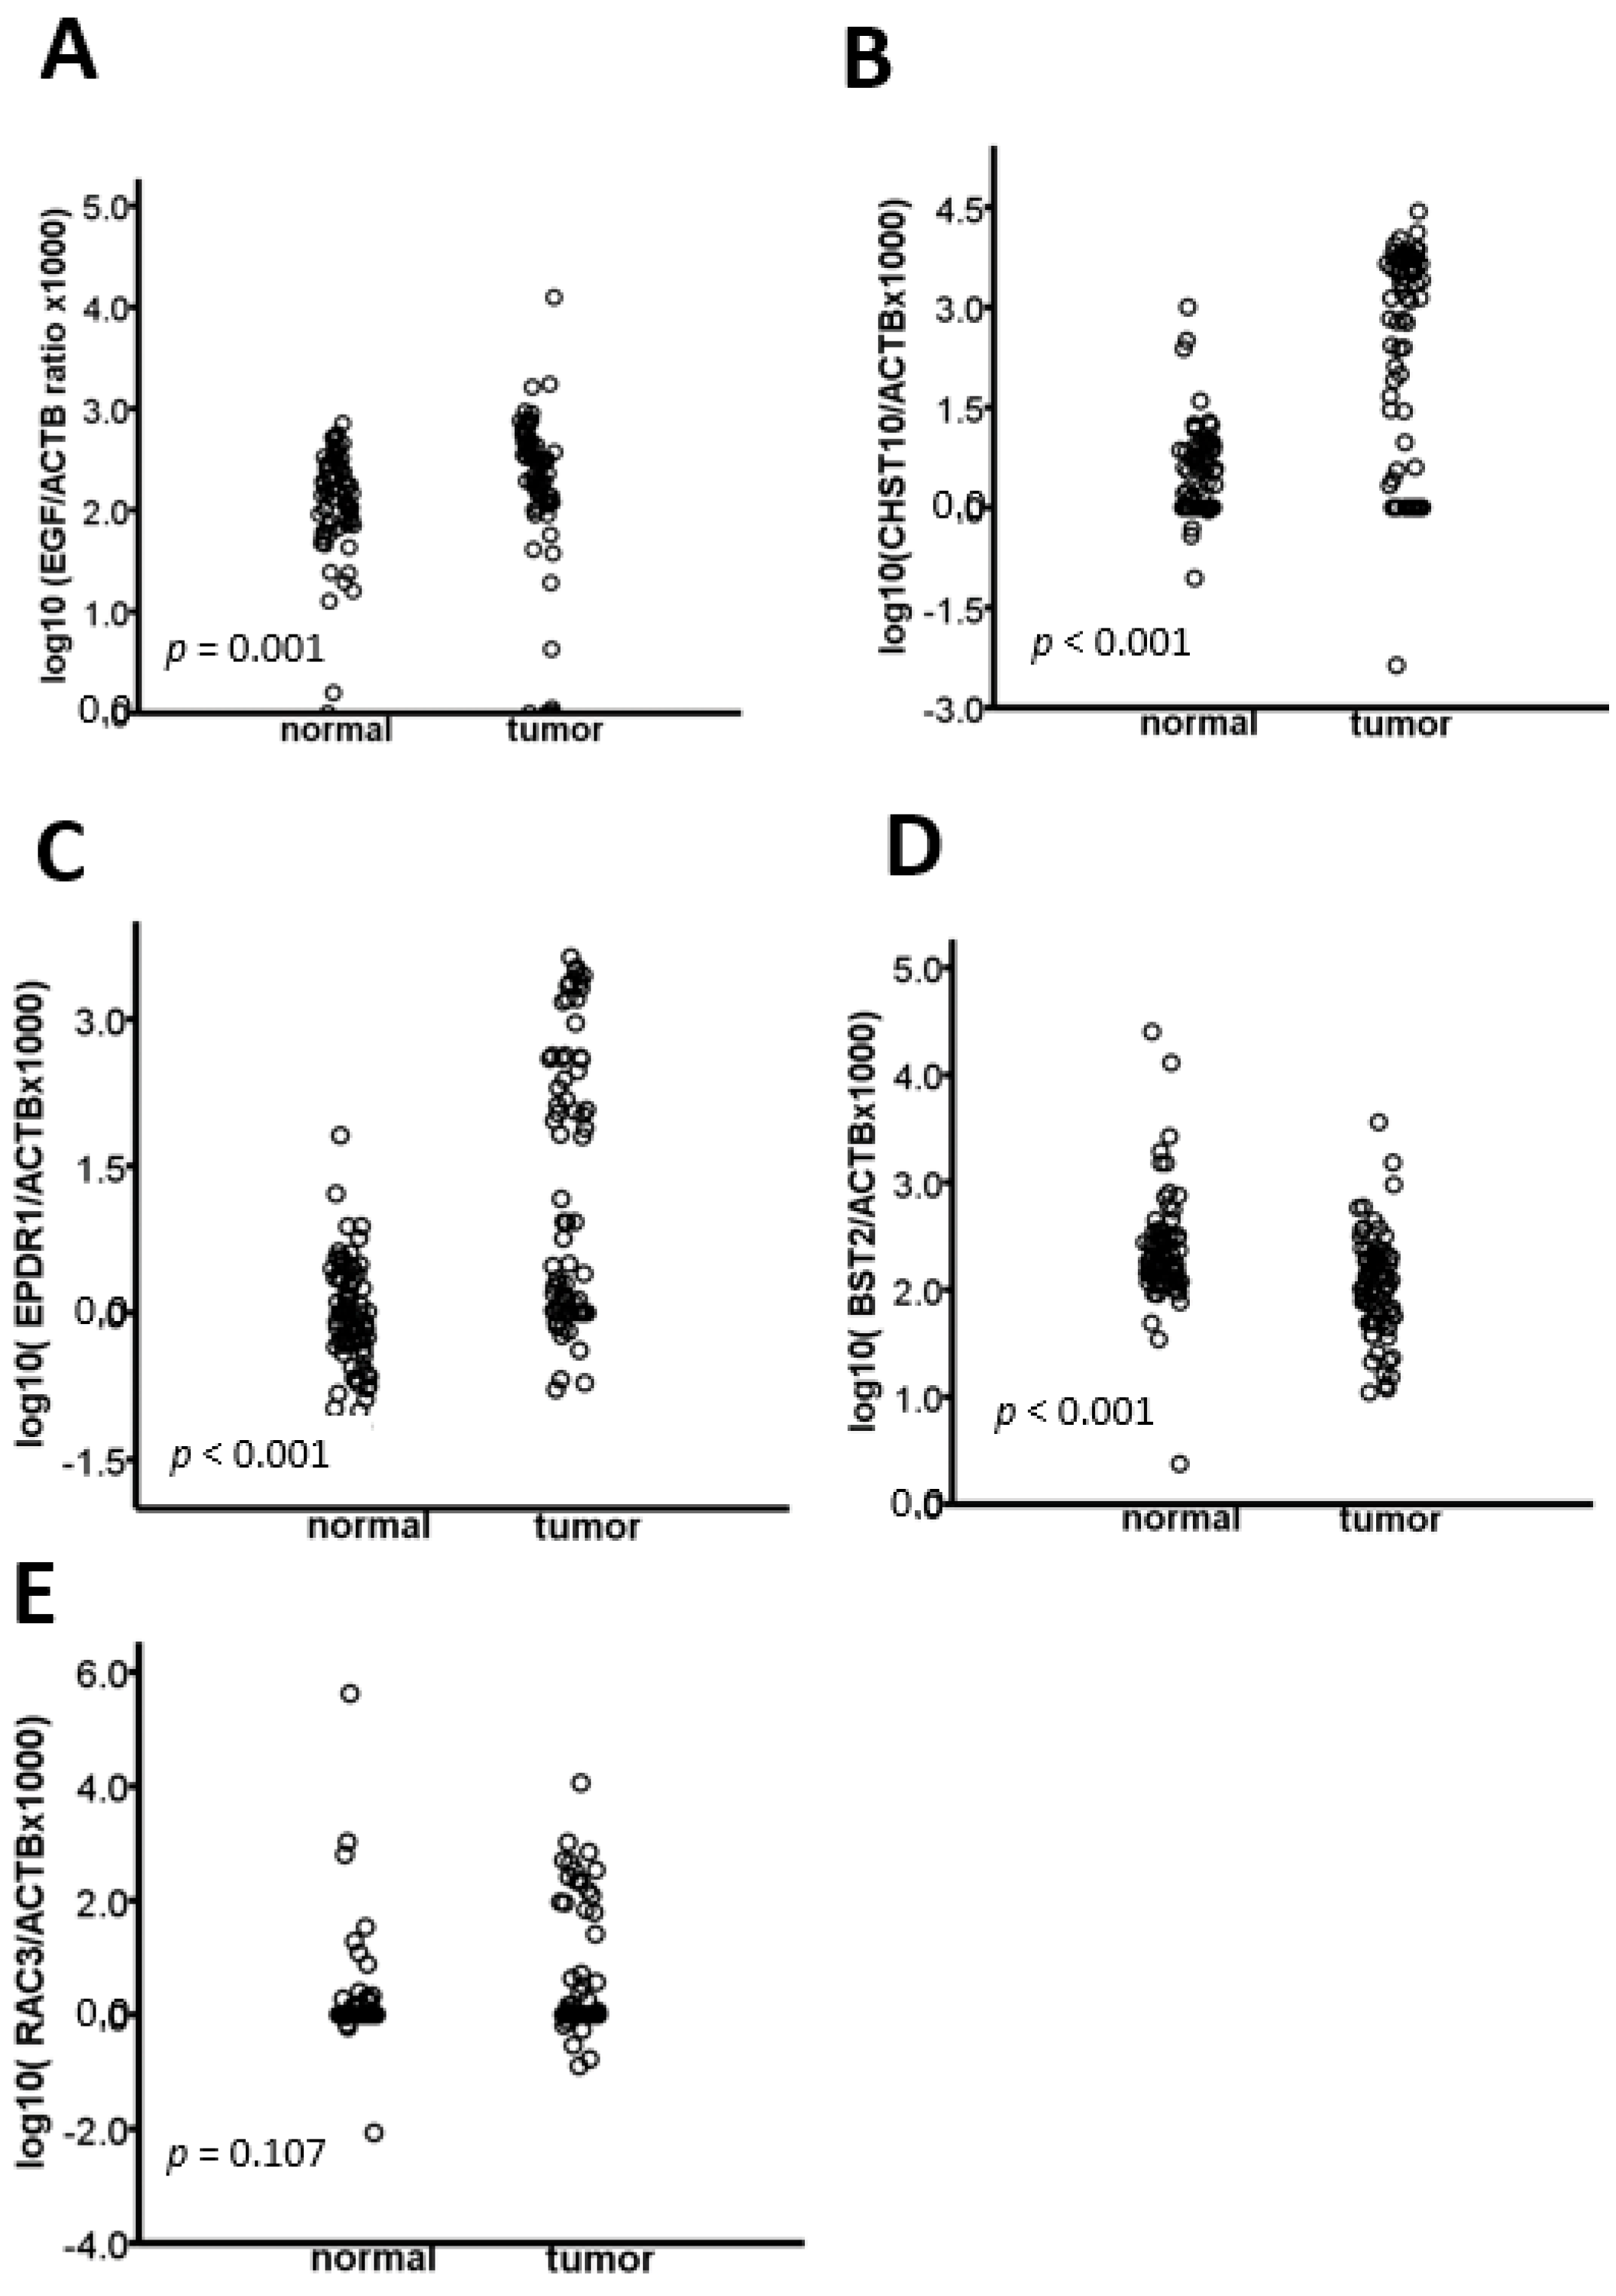
2.1. The EGF, CHST10, EPDR1, BST2, and RAC3 Methylation Levels Are Validated in CRC

To delineate DNA methylation profile changes in CRC with MSI, we performed DNA methylation analysis using Infinium Human Methylation 27K BeadChip (Illumina, San Diego, CA, USA). Together with the MSS group, methylation profiles were analyzed using three pooled DNA samples for each group. Consistent with other reports, over 300 CpG loci were hypermethylated in the methylated MLH1 group compared with the other two groups (data not shown). Compared with the MSS group, 650 selected genes in the MSI-MLH1 methylated or MSI-MLH1 mut groups showed an absolute beta difference (Δβ) value more than 0.5 (hypermethylation) or less than −0.25 (hypomethylation) (Figure S1A). Among them, 10 hypermethylated and 24 hypomethylated genes were identified in both MSI groups compared with those in the MSS group (Figure S1B,C).
Among these hypermethylated candidate genes, EPDR1 and EGF were reported to be deregulated in CRC tissues compared with those in adjacent normal and normal colon tissues [30,31]. CHST10 is likely a potential methylation biomarker and therapeutic target of vincristine in CRC cells [32]. Regarding the hypomethylated candidate genes, overexpression of BST2 is associated with poor survival in patients with CRC as well as those with esophageal or gastric cancer [33]. Additionally, the silencing of RAC3 inhibits proliferation and induces apoptosis in human lung cancer cells [34]. Accordingly, the three hypermethylated (EGF, CHST10, EPDR1) and two hypomethylated (BST2, RAC3) candidate genes were further validated by Q-MSP using 75 pairs of CRC and adjacent normal tissues. The clinicopathological features of these patients are provided in Table 1. We found that EGF, CHST10 and EPDR1 showed higher hypermethylated levels in CRC tissues than those in adjacent normal tissues (Figure 1A–C, respectively). Additionally, BST2 showed hypomethylation in CRC tissues than those in adjacent normal tissues (Figure 1D), although the methylation status of RAC3 was not significantly different (Figure 1E).

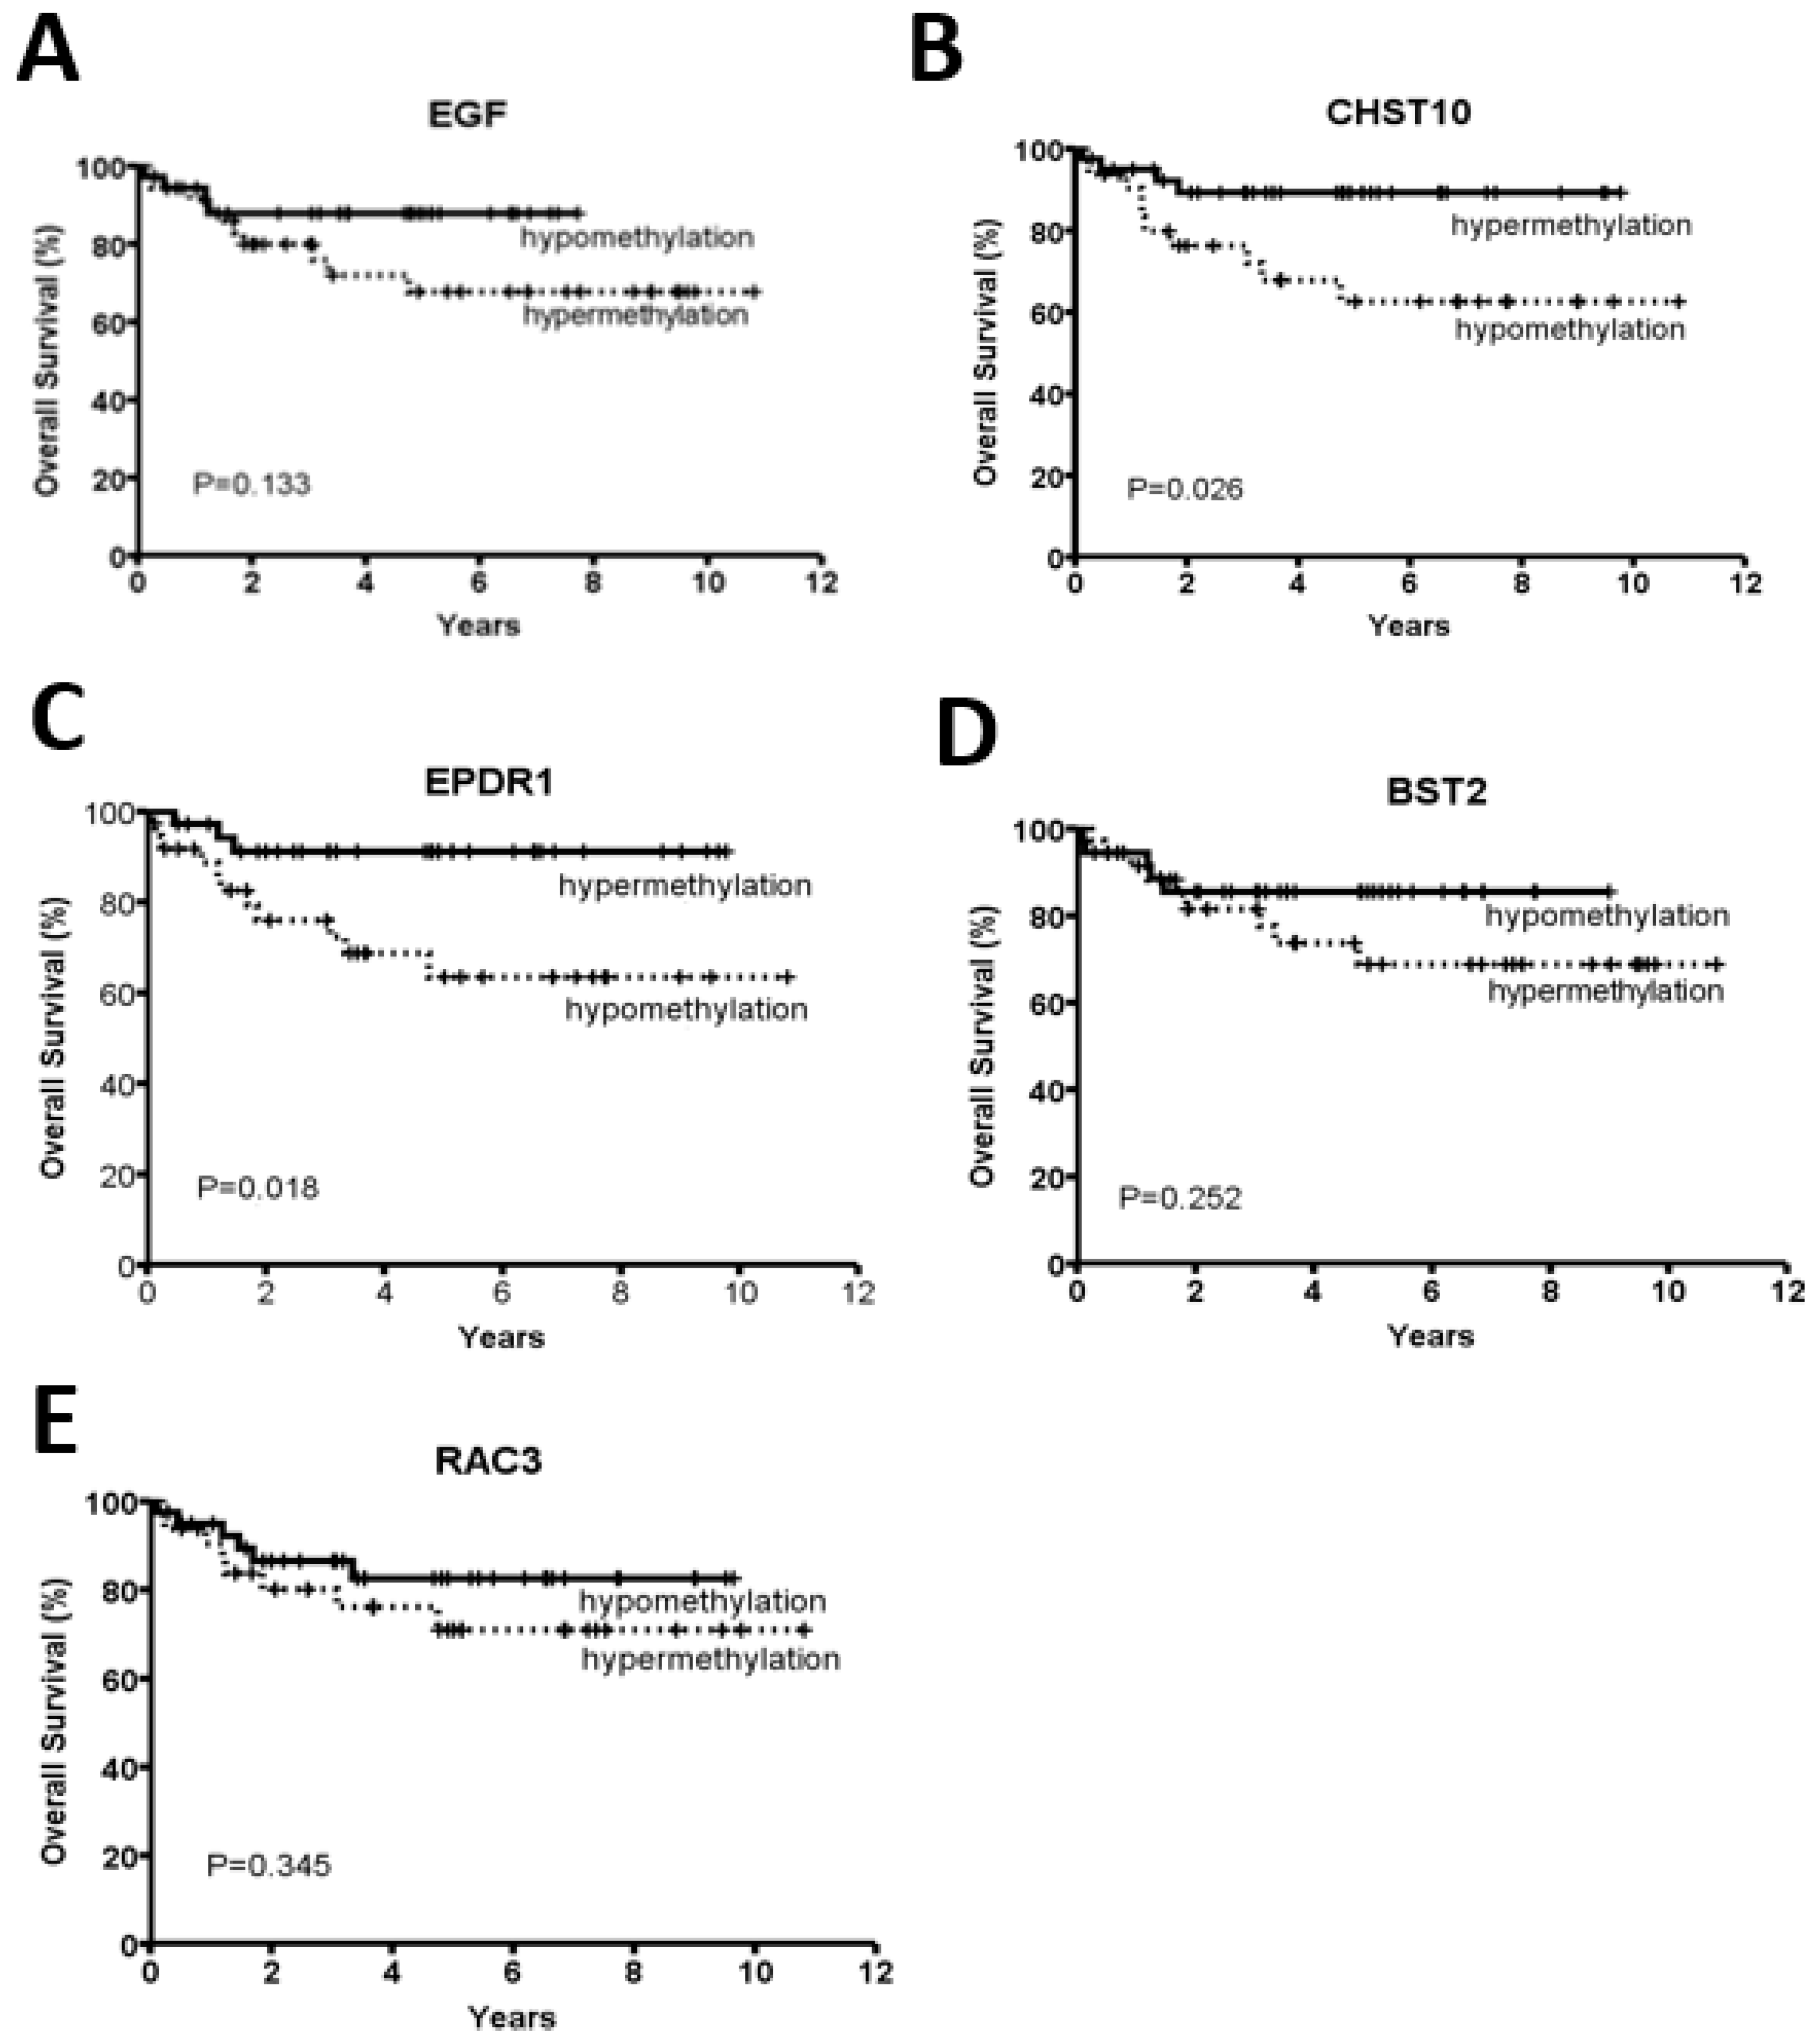
2.2. CHST10 and EPDR1 Hypermethylation Is Significantly Correlated with a Better Prognosis

We further analyzed the correlation of the methylation levels of these five candidate genes and various clinicopathological factors, including the differentiation status, invasion depth, node status, tumor stage, and microsatellite status. Compared with MSS CRC patients, associations with a lower median age of incidence (p < 0.001), female gender (p = 0.004), poor differentiation (p = 0.001) and proximal tumor location (p < 0.001) were found for patients with MSI CRC (Table 1). Furthermore, the methylation levels of CHST10 and EPDR1 were significantly higher in CRC patients with MSI than in those with MSS (CHST10: p = 0.003; EPDR1: p < 0.001) (Table 2). By contrast, the BST2 and RAC3 methylation levels were significantly lower in CRC patients with MSI than in those with MSS (BST2: p = 0.015; RAC3: p < 0.001). Interestingly, EPDR1 hypermethylation was significantly correlated with node negativity (p = 0.044) and an early tumor stage (p = 0.044) (Table 2). We also examined the relationship of the methylation status of these five genes with an overall survival in the 75 CRC patients by Kaplan-Meier analyses. As shown in Figure 2, CHST10 and EPDR1 hypermethylation was significantly correlated with a better prognosis (CHST10: p = 0.026; EPDR1: p = 0.018).

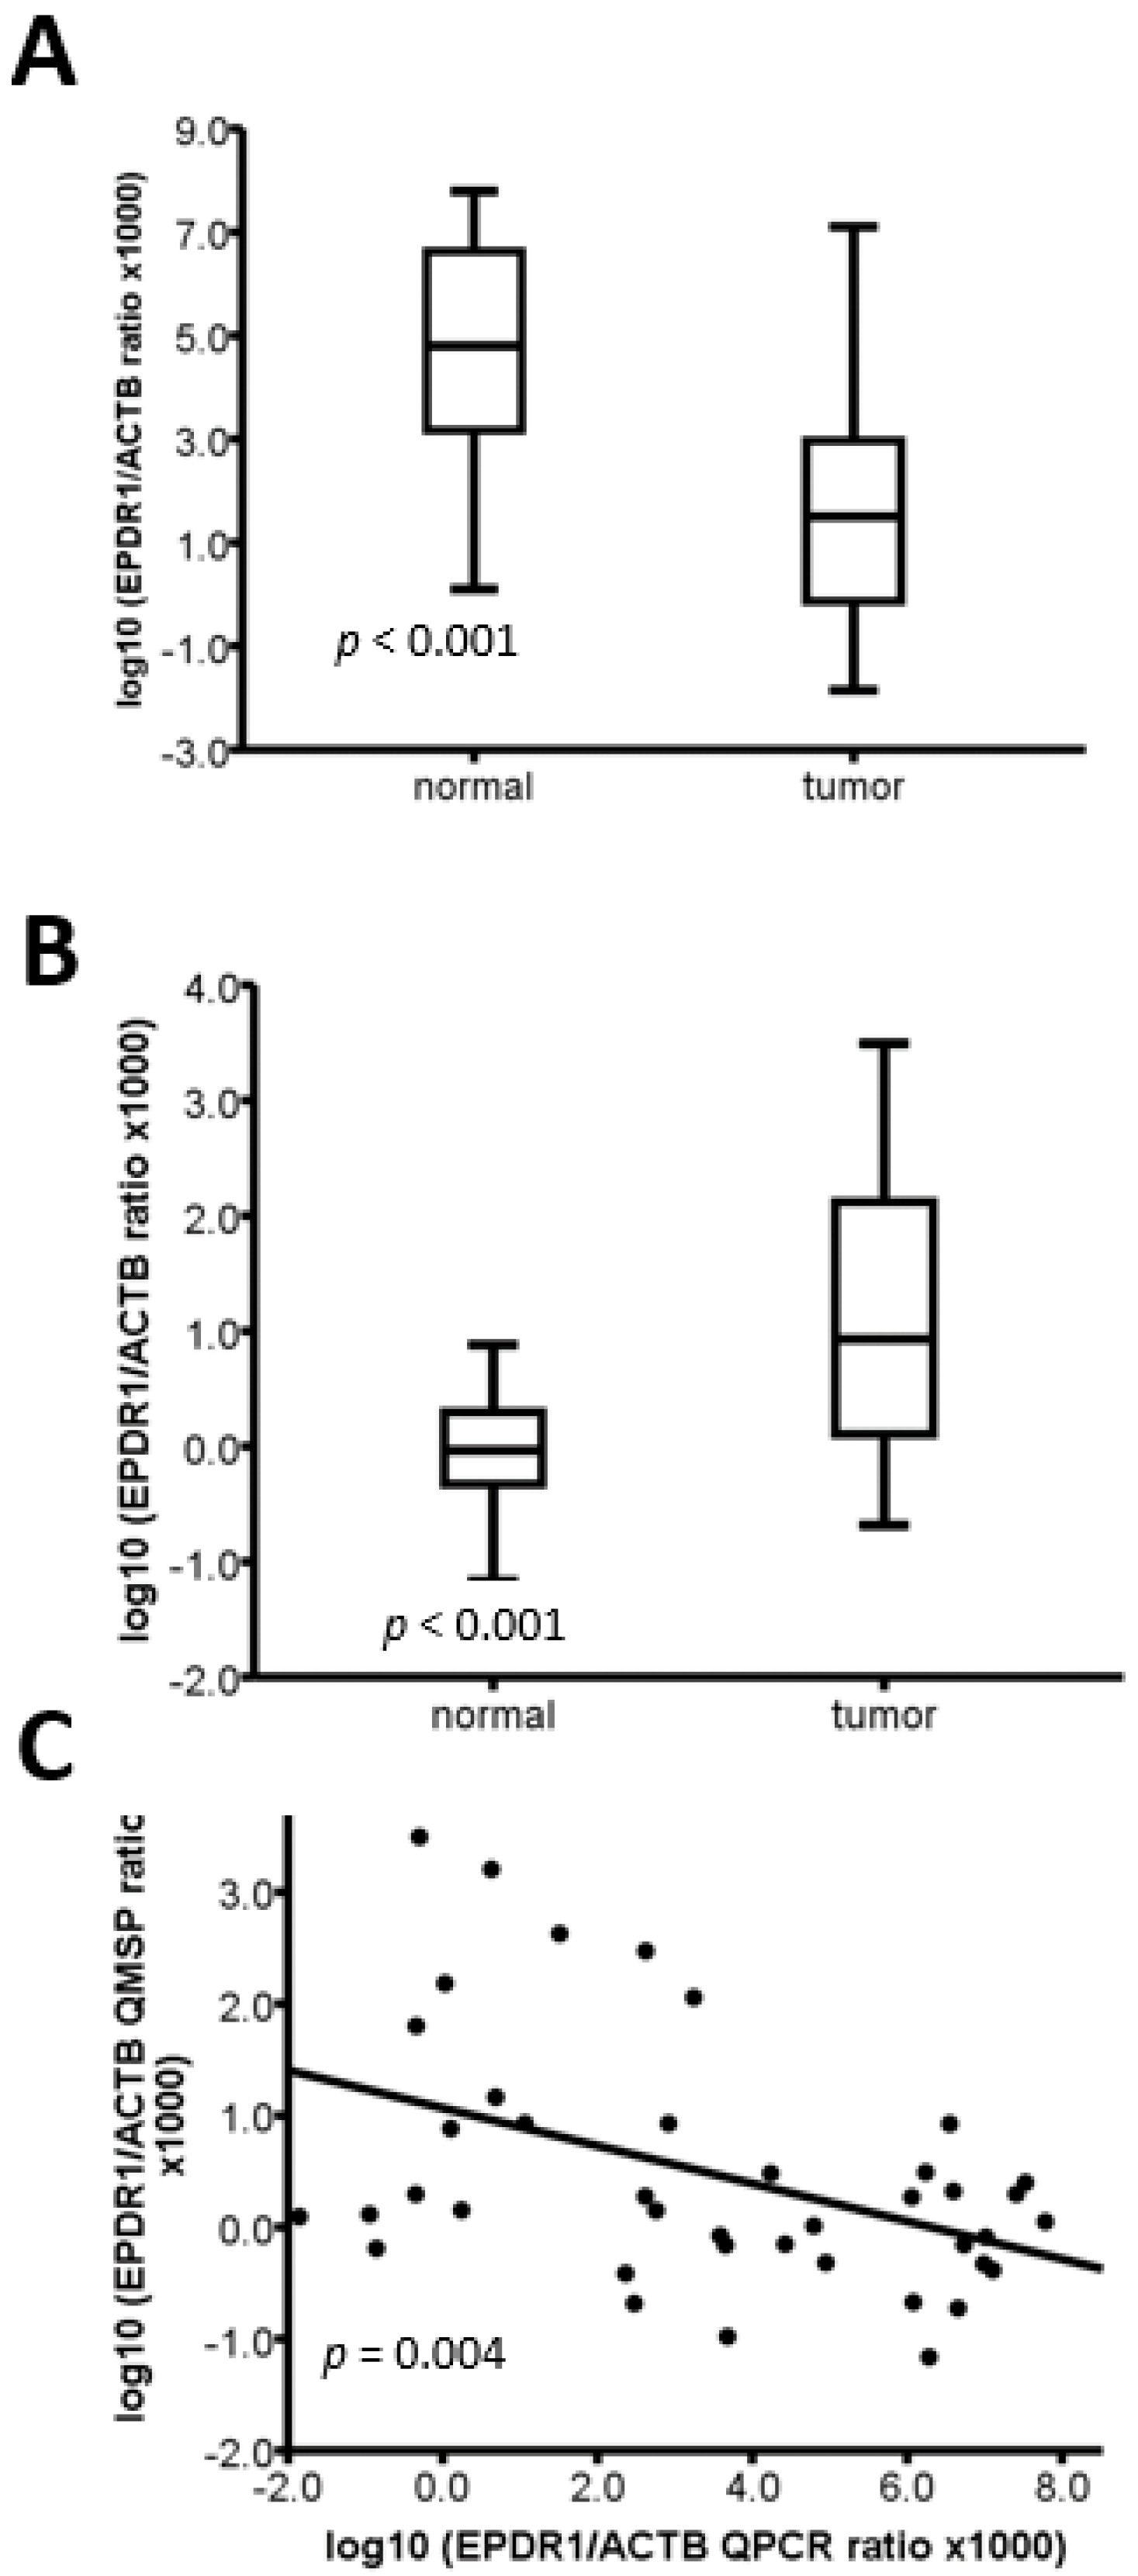
2.3. The Methylation Level of EPDR1 Is Correlated with Its mRNA Expression in CRC Tumor Tissues

To assess whether DNA methylation is associated with the expression of EPDR1 and CHST10, qRT-PCR was performed to examine the mRNA expression of EPDR1 and CHST10 in 23 CRC tumor tissues and corresponding normal tissues. As shown in Figure 3A, we found that the level of EPDR1 mRNA was significantly lower in tumor tissues than in corresponding normal tissues (p < 0.001), whereas the methylation level of EPDR1 in 23 tumor tissues was significantly higher than that in corresponding normal tissues (p < 0.001; Figure 3B). Moreover, a negative correlation between the qRT-PCR and Q-MSP results was observed (p = 0.004), indicating that DNA methylation likely participates in regulating EPDR1 expression (Figure 3C). Similarly, a negative correlation between mRNA expression and DNA methylation of the EPDR1 gene in 195 colorectal adenocarcinoma patients was reported in The Cancer Genome Atlas (TCGA) dataset (Nature 2012) (Figure S2). Because the mRNA levels of CHST10 were too low to be detected by qRT-PCR, we could not assess an inverse relationship between qRT-PCR and Q-MSP data.

2.4. EPDR1 Methylation Is Associated with BRAF and TGFβR2 Mutations in CRC Tumor Tissues

Because APC, TP53, KRAS, BRAF, TGFβR2, PIK3CA, and SMAD4 are the most commonly mutated genes in CRC [35], we investigated the relationship between mutations in these genes and EPDR1 methylation in 59 CRC tissues. Consistently, 17 of 27 cases (63%) in the hypermethylated EPDR1 group (EPDR1-HYPER-M) were MSI positive, whereas 5 MSI-positive cases (15.6%) were observed for the hypomethylated EPDR1 group (EPDR1-HYPO-M). Intriguingly, 16 of 17 cases were categorized as MSI with MLH1 methylation. By contrast, 1 of 5 MSI cases with MLH1 methylation was associated with EPDR1 hypomethylation (EPDR1-HYPO-M). Figure S3 displays the mutation patterns of APC, TP53, KRAS, BRAF, TGFβR2, PIK3CA, and SMAD4 in 27 EPDR1-HYPER-M patients and 32 EPDR1-HYPO-M patients. The EPDR1-HYPER-M group showed a higher mutation rate for BRAF and TGFβR2 than the EPDR1-HYPO-M group. All 27 patients with hypermethylated EPDR1 carried at least one mutation in these seven selected genes. However, nine of 32 cases (28.1%) in the EPDR1-HYPO-M group showed no mutation in these seven genes. Furthermore, differential mutation profiles between the EPDR1-HYPER-M and EPDR1-HYPO-M groups were noted. Among these seven genes, EPDR1 methylation was significantly associated with BRAF (p < 0.001) and TGFβR2 (p = 0.04) mutations in CRC tumor tissues (Table 3). All BRAF mutations in this study were the V600E substitution.

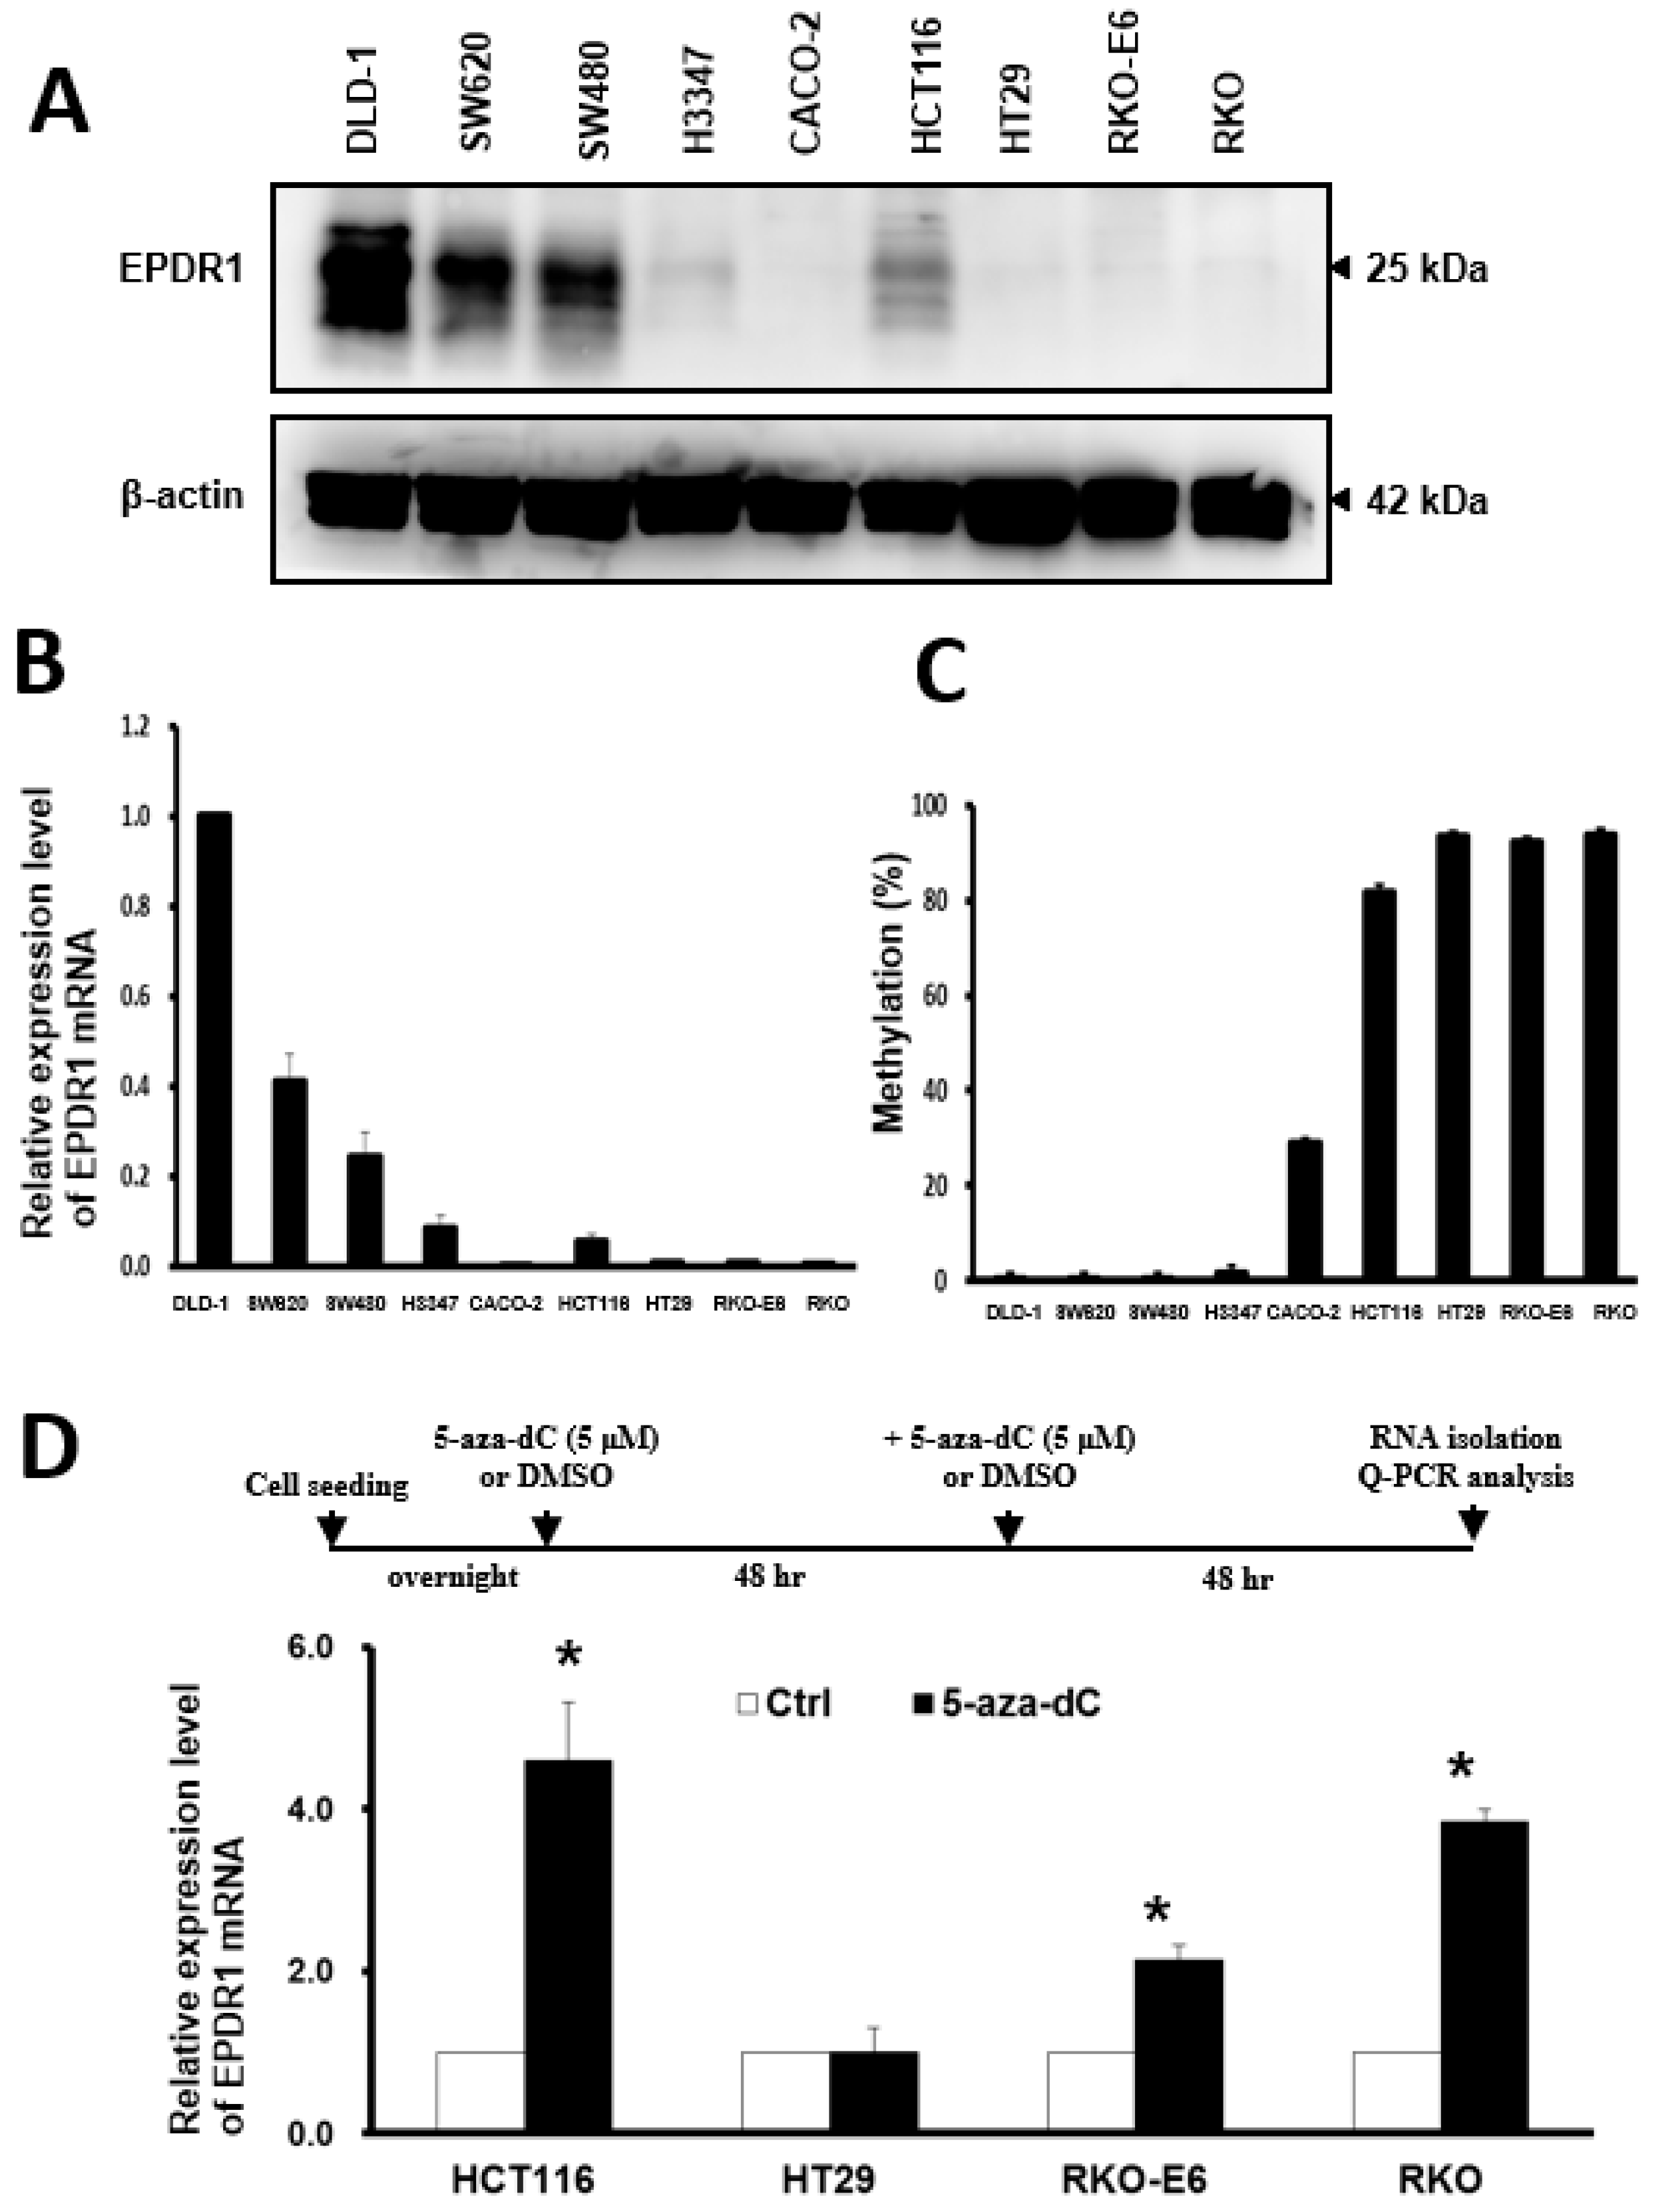
2.5. DNA Methylation Is Involved in the Regulation of EPDR1 Expression in CRC Cell Lines

To evaluate whether epigenetic silencing contributes to a decrease in EPDR1 expression, we performed qRT-PCR and western blotting to measure the expression of EPDR1 at both the mRNA and protein levels in nine CRC cell lines. As shown in Figure 4A,B, DLD-1 cells exhibited the highest levels of EPDR1 protein and mRNA, whereas SW480, SW620, H3347 and HCT116 cells expressed relatively lower levels of EPDR1. CACO-2, HT29, RKO, and RKO-E6 cells expressed limited or little amounts of EPDR1. Our results showed a satisfactory correlation between mRNA and protein expression among these cell lines. We further employed BSP to investigate whether the expression of EPDR1 can be attributed to the methylation of regulatory elements in CRC cell lines. Thirty-one CpG sites were located within the +64 and +437 regions of the EPDR1 gene (Figure S4A). As shown in Figure S4B, all 31 CpG sites were almost completely methylated in RKO, HT29, RKO-E6, and HCT116 cells. By contrast, the methylation levels in CACO-2, SW480, SW620, H3347, and DLD-1 cells were much lower. The quantitative BSP results for the nine CRC cell lines are shown in Figure 4C. These results reveal a close inverse association between promoter methylation and EPDR1 expression at the mRNA and protein levels in CRC cell lines.
To verify the association between epigenetic aberrations and putative transcriptional inactivation of EPDR1 gene expression, HCT116, HT29, RKO-E6, and RKO cells, which display high EPDR1 promoter methylation levels, were treated with 5-aza-dC, a DNA demethylation reagent and assessed for the expression of EPDR1 after 96 h of treatment by qRT-PCR (Figure 4D upper). As shown in Figure 4D, 5-azadC treatment significantly increased the EPDR1 transcript abundance in HCT116, RKO-E6, and RKO cells but not in HT29 cells. As expected, the EPDR1 transcript levels were not affected by 5-aza-dC treatment in EPDR1-hypomethylated cell lines, such as DLD-1, SW620, SW480, and H3347 cells (Figure S5).

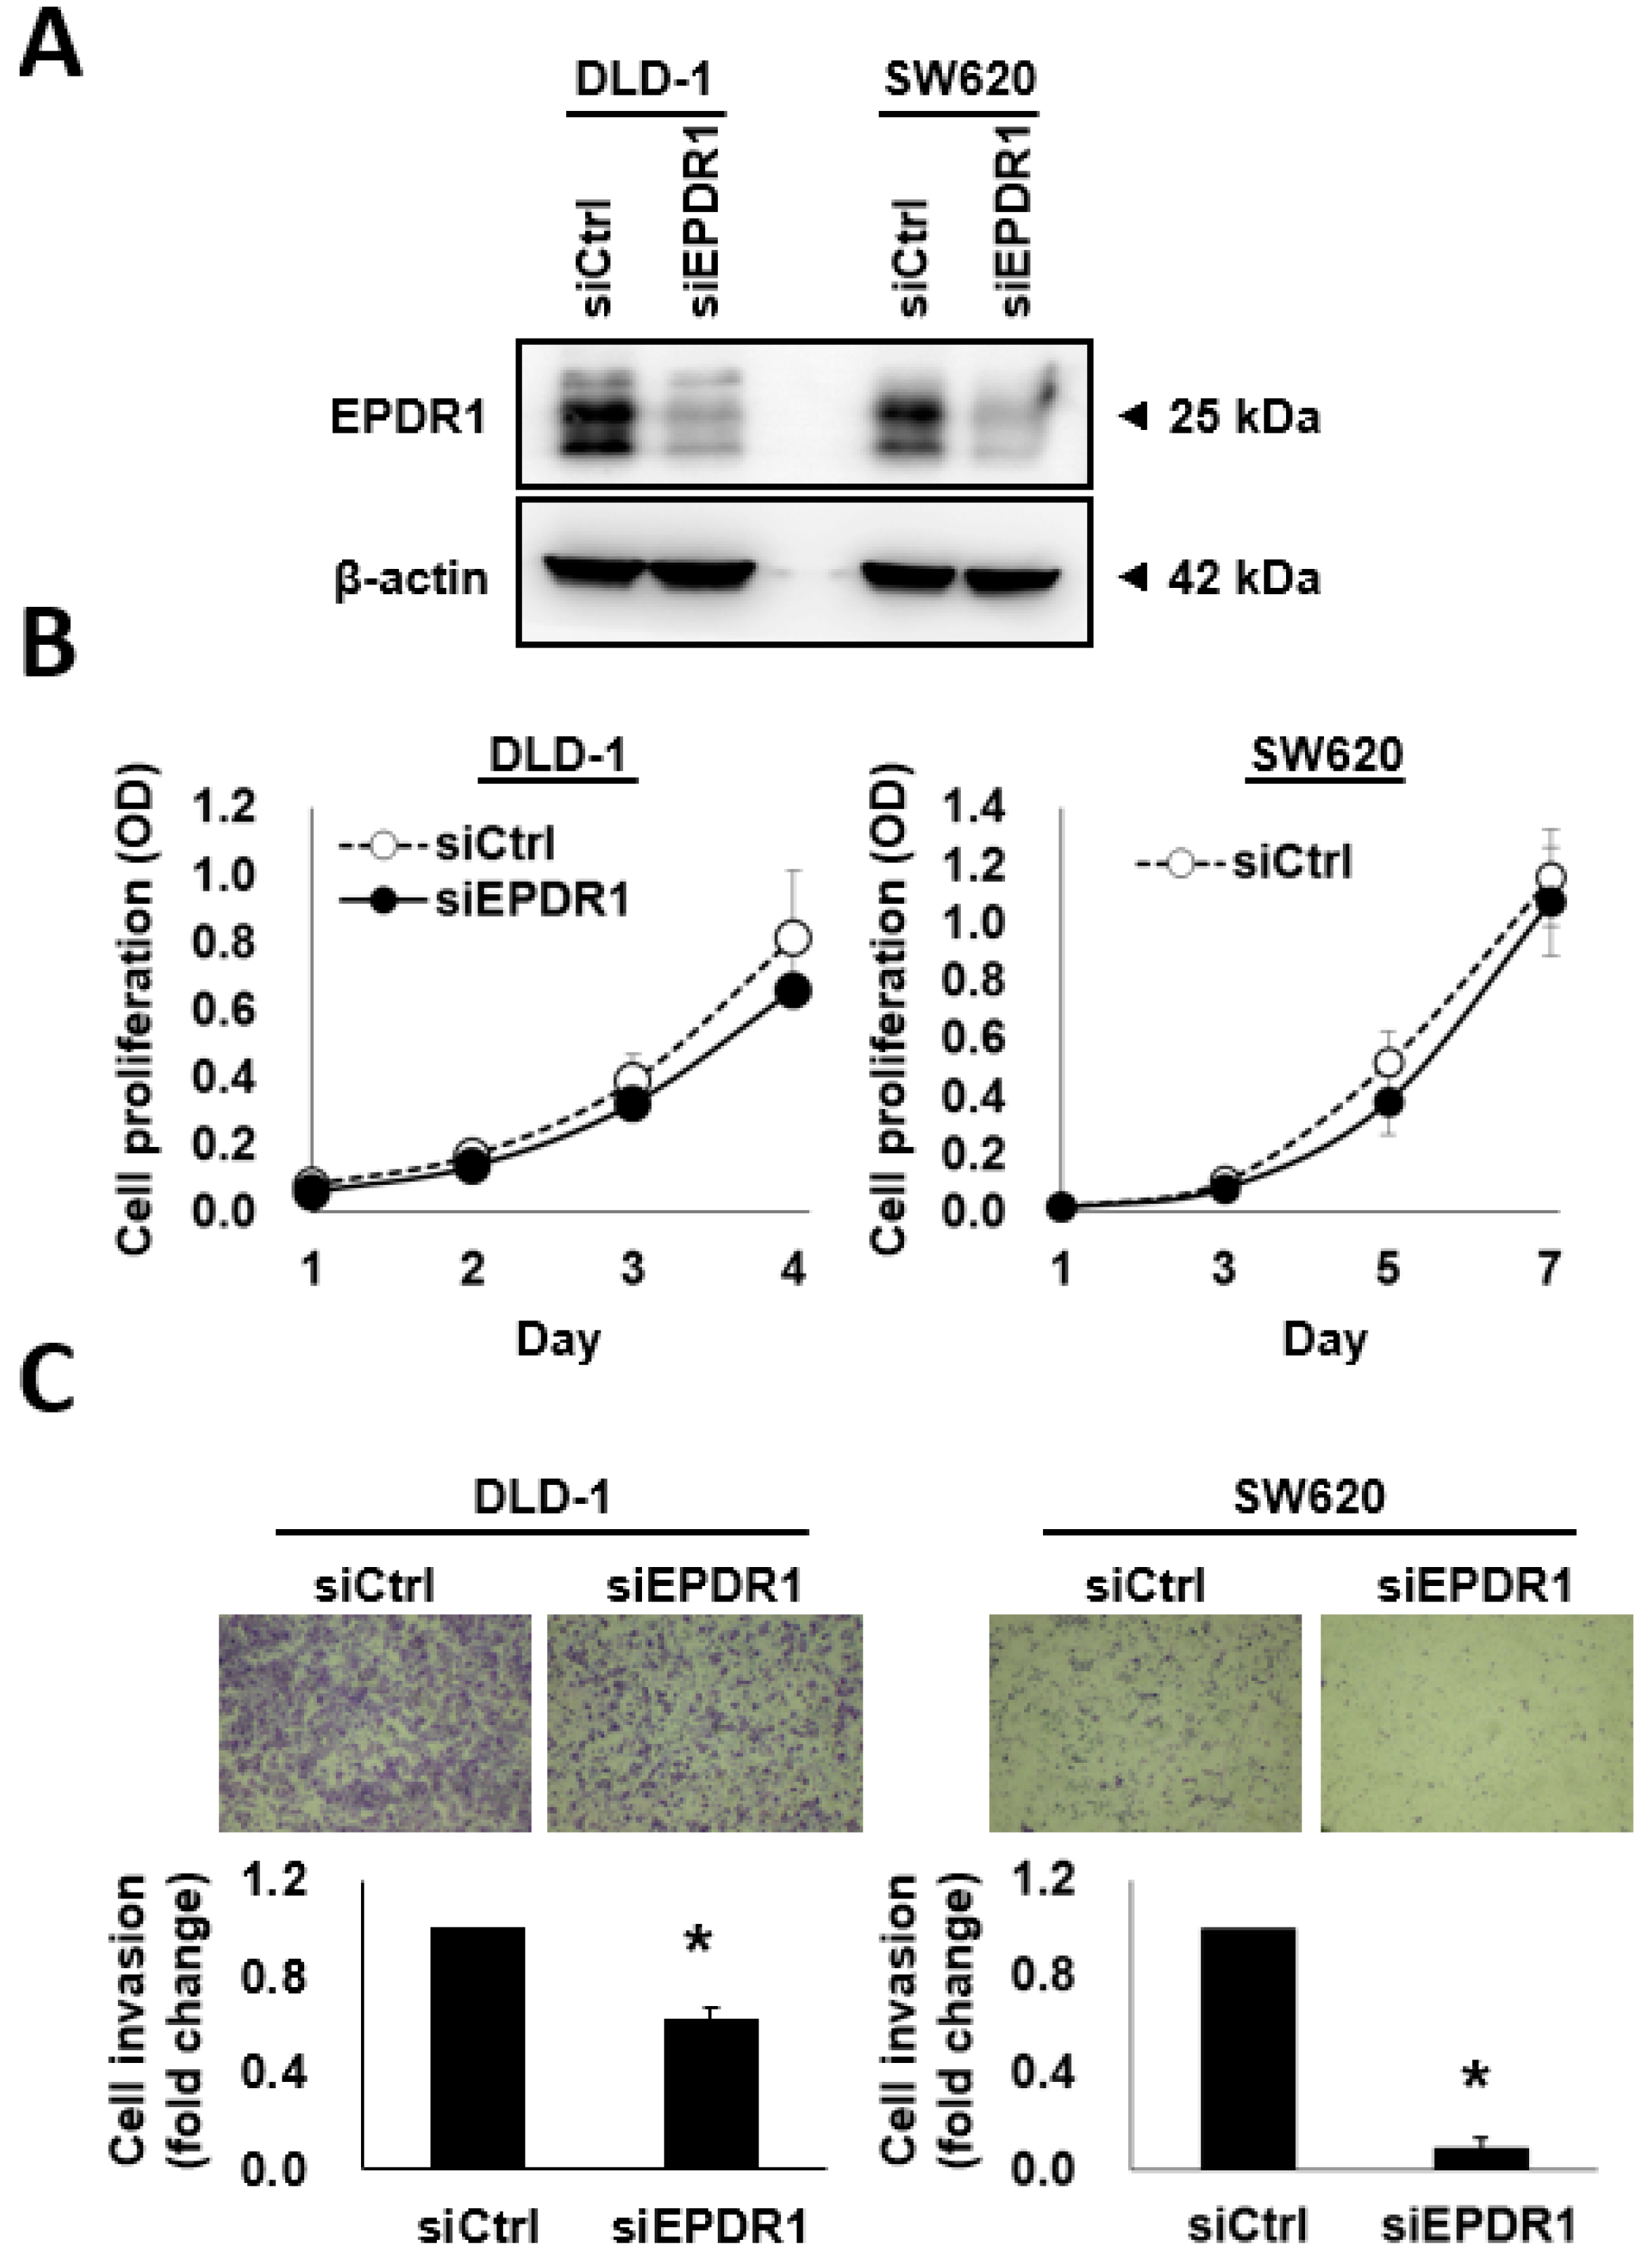
2.6. EPDR1 Knockdown Suppresses CRC Cell Invasion

Ependymins are extracellular matrix proteins that inhibit cell adhesion. Because they possess anti-adhesive properties, EPDR1 might activate the detachment of cells from a solid tumor. Although few studies have reported EPDR1 expression in cancer cells, EPDR1 is known to be highly expressed in CRC [30]. Therefore, it is important to elucidate whether EPDR1 played a role in CRC cell invasion and metastasis. We performed western blotting to determine the efficacy of knockdown and found EPDR1 expression to be significantly decreased in DLD-1 and SW620 cells after 72–96 h of transient RNA interference (Figure 5A). Transient EPDR1 knockdown did not affect the proliferative rate of CRC cells (Figure 5B) but did significantly suppress their invasion capacity (Figure 5C).

3. Discussion

Aberrant DNA methylation is associated with cancer progression, and studies on DNA methylation are likely to help in the identification of biomarkers clinically relevant to the process of tumorigenesis. Using the MethylCap-seq approach, Simmer et al. reported hypermethylation enrichment at gene promoter CpG islands in tumor samples, whereas hypomethylation was found throughout the genome [36]. In this study, we used a DNA methylation array to analyze differential DNA methylation patterns in CRC with MSI and found highly hypermethylation regions in the MSI-MLH1 methylated group compared with those in the MSI-MLH1 mut and MSS groups. MSI has been linked to hypermutation, hypermethylation, immune infiltration, and BRAF mutation [11]. Although it was demonstrated that most hypermethylated regions in the MSI group with MLH1 promoter methylation were not associated with cancer progression, we found that EPDR1 hypermethylation was associated with MSI, node status, tumor AJCC stage, and better prognosis in CRC patients. This is the first study to demonstrate the clinical prognostic values of EPDR1 methylation in CRC. Although the sample size is limited in our study, our finding was supported by the data retrieved from TCGA (Figure S2). More patients will be enrolled to demonstrate that EPDR1 methylation status could be a prognostic marker for CRC in future studies.
Epigenetic alterations have been linked to cancer-related gene transcriptional silencing. Based on the observed associations among qRT-PCR, Q-MSP, and western blotting results using CRC cell lines, we demonstrated that DNA methylation might play a critical role in regulating EPDR1 expression in CRC cells. In the present study, HCT116, HT29, RKO, and RKO-E6 cells displayed EPDR1 hypermethylation. Among them, RKO cells have been designated as a CIMP cell line; however, HT29 and HCT116 cells are thought to be non-CIMP cell lines [35]. Although EPDR1 methylation might not be well associated with CIMP in established cell lines, our findings show that EPDR1 hypermethylation is closely associated MSI with MLH1 methylation in clinical specimens.
Approximately 10% of CRCs display BRAF mutations [37], mostly the V600E substitution, resulting in constitutive mitogen-activated protein kinase kinase (MEK) phosphorylation and BRAF signal transduction [38]. BRAF-mutant CRCs are generally characterized by MSI with MMR deficiency and very high mutation rates [38]. BRAF mutations confer a relatively poor survival, but this phenomenon is restricted to carcinomas not showing MSI [39]. Although we identified EPDR1 as a hypermethylated gene in MSI patients with MLH1 methylation, we discovered an association between EPDR1 methylation and BRAF mutation. Therefore, the clinical implication of EPDR1 hypermethylation with a high rate of BRAF mutation warrants further investigation.
Fang et al. demonstrated that the BRAF V600E mutation results in CIMP and transcriptional silencing of nearby genes through v-Maf avian musculoaponeurotic fibrosarcoma oncogene homolog G (MAFG), a transcriptional repressor [40]. Additionally, BRAF V600E reportedly increases BRAF/MEK/extracellular signal-regulated kinase (ERK) signaling and enhances MAFG levels, promoting the binding of DNA modifiers and modulating CpG island methylation [40]. Important mediators of DNA methylation and demethylation include DNA methyltransferases (DNMTs), methyl-CpG binding proteins (MeCPs), and ten-eleven translocation cytosine dioxygenases (TETs) [41]. It has been reported that, after H2O2 treatment, silencing protein complex containing sirtuin-1 (SIRT1), enhancer of zeste protein-2 (EZH2), DNA methyltransferase 1 (DNMT1), DNA methyltransferase 3 beta (DNMT3B), and H2A histone family member X (H2AFX) interact with the EPDR1 gene (source: IntAct) [42]. Localization of this complex to the EPDR1 gene may result in histone mark changes, reductions in nascent transcription, and increases in DNA methylation [42].
Although few studies to date have investigated EPDR1 expression in cancer cells, it is highly expressed in CRC cells [36]. Nimmrich et al. found that the EPDR1 transcript level is increased in cultured tumor cell lines (SW480 and HCT116) and in two of three analyzed CRC tissue specimens compared with that in a cultured normal cell line (NCM460) and in corresponding normal tissues [36]. By contrast, our results showed that the mRNA levels of EPDR1 were lower in CRC tissue specimens than in corresponding non-cancerous tissues (n = 23). The difference between our findings and those in the previous study [36] might be due to the number of specimens analyzed. More CRC pairs will be examined to evaluate that expression of EPDR1 during CRC pathogenesis in future studies.
5-aza-dC could reactivate EDPR1 expression in several CRC cell lines, except HT29 cells, displaying a highly methylated EPDR1 promoter. In addition to DNA methylation, histone acetylation is the other epigenetic modification that may modulate transcription. Several epigenetic regulatory genes can be activated by combined treatment with histone deacetylase inhibitor, such as trichostatin A, and 5-aza-dC [43]. However, the involvement of DNA methylation and histone acetylation in EPDR1 expression in HT29 requires further elucidation.
Located at chromosome 7p14, the EPDR1 gene encodes a protein comprising 224 amino acids with an ependymin domain that is a type II transmembrane protein similar to two families of cell adhesion molecules: protocadherins and ependymins [30]. Ependymin is a glycoprotein of the brain extracellular fluid that has been implicated in synaptic changes linked to the consolidation process of long-term memory formation [44]. It has been reported that ependymins are extracellular matrix proteins that inhibit cell adhesion. EPDR1, which has anti-adhesive properties, might promote the detachment of cells from a solid tumor. In this study, we demonstrated that EPDR1 was positively associated with the invasiveness of CRC cells.
DNA methylation of metastasis-related genes is a promising biomarker for CRC prognosis. Among metastasis-related genes, p16INK4a promoter methylation is mainly associated with a metastogenic phenotype of primary CRCs [45]. Vimentin gene methylation is also a potential prognostic marker for advanced CRC [46]. Alternatively, the promoter hypomethylation of PGP9.5 is associated with invasion activity of CRC [47]. PGP9.5 is therefore an invasive marker for CRC [48]. In this study, we found that EPDR1 knockdown did not affect the proliferative rate of CRC cells but did significantly suppress their invasion capacity. Clinically, EPDR1 hypermethylation was significantly correlated with node negativity and good prognosis. These results suggest that EPDR1 hypermethylation may prevent CRC metastasis and serve as a prognostic marker.

4. Materials and Methods

4.1. Patient and Tumor Samples

This study included 75 CRC patients who were surgically treated at the Taipei Veteran General Hospital from 2000 to 2010. After approval by the Institutional Review Board at Taipei Veteran General Hospital (the IRB number is 201009003IC), CRC samples from this study were collected from the Biobank (Taipei Veterans General Hospital). Clinical information, including age, sex, personal and family medical history, location of tumor, TNM stage, differentiation, pathological prognostic features, and follow-up conditions, was retrieved from the hospital database. The 75 CRC patients were divided into two groups. MSS and MSI, based on MSI analysis. MSI patients were further divided into two groups, MSI with a methylated MLH1 promoter (MSI-MLH1 methylated) and MSI with MMR mutation (MSI-MLH1 mut), based on the results of mutation analyses and methylation analyses of the MLH1 gene. Three CRC tissues of each group were randomly selected for DNA pooling. All 75 tumor tissues and the corresponding normal tissues from patients with CRC were collected for Q-MSP. Among 75 patients, 23 CRC tissues and paired adjacent normal tissues were collected for qRT-PCR. Fifty-nine of 75 CRC samples were obtained for MassArray-based mutation characterization.

4.2. DNA Extraction from Tumor Samples

High-molecular-weight genomic DNA from CRC tumor samples and corresponding normal tissue samples was purified using the QIAamp Tissue kit (QIAGEN, Valencia, CA, USA) according to the manufacturer’s instructions. The yield and purity were determined using a Nanodrop 1000 Spectrophotometer (Thermo Fisher Scientific, Waltham, MA, USA).

4.3. MSI Analysis

MSI was characterized via the assessment of markers consisting of three dinucleotide repeats (D2S123, D5S346, D17S250) and two mononucleotide repeats (BAT26, BAT25) [49]. The primer sequences of five reference microsatellite markers were obtained from GenBank (www.gdb.org). Samples with more than two markers were defined as having MSI, and those patients with 0–1 MSI markers were considered as MSS.

4.4. Mutation Analysis of MLH1

DNA obtained from CRC tissues was amplified and sequenced with primers used in a previous study [50]. Sequencing of the MLH1 gene covered its exons and intronic regions adjacent to all splice sites. The extracted DNA was amplified by polymerase chain reaction (PCR) in a DNA thermocycler. The PCR product produced was then sequenced. Each sample was sequenced on both sense and antisense strands. Each mutation was confirmed by a second sequencing on new PCR products.

4.5. Methylation Analysis of MLH1

Methylation of the MLH1 promoter was determined by methylation-specific PCR. DNA was modified by sodium bisulfite and then was amplified with different methylated and unmethylated primers [51].

4.6. Genome-Wide DNA Methylation Profiling

A 0.5-μg sample of pooled DNA obtained from three early-staged CRC tissues was treated with sodium bisulfite using the EZ DNA Methylation-Gold Kit (Zymo Research, Orange, CA, USA) according to the manufacturer’s protocol. Methylation profile changes in these three groups were evaluated using the Infinium Methylation 27K BeadChip assay (Illumina), and CpG loci were validated using Illumina BeadStudio Software (Genetech Biotech, Taipei, Taiwan).

4.7. Quantitative Methylation-Specific PCR (Q-MSP)

After sodium bisulfite conversion, methylation analysis was performed using the Taqman PCR reaction-based MethyLight assay [52]. Primers and probes were designed for EGF, CHST10, EPDR1, BST2, and RAC3, as summarized in Supplementary Table S1. Primers and probes were designed to cover the same genomic region as found in the Infinium assay. β-Actin (ACTB) was amplified as a DNA loading control. Normal leukocyte DNA and in vitro-methylated leukocyte DNA served as negative and positive controls, respectively. PCR amplification was performed as previously described [53]. The relative level of methylated DNA for each gene in each sample was determined as a ratio of methylation-specific PCR-amplified DNA to ACTB DNA and then was multiplied by 1000 for easier tabulation. All values of methylation levels are presented on base 10 logarithmic scales. To compare the methylations levels of these five genes in tumor and corresponding normal tissues, we validated the cutoff values as follows: for EGF, tumor value/normal value > 1.5; for CHST10, log (tumor methylated value) > 2.5; for EPDR1, log (tumor methylated value) > 0.5; for BST2, tumor value/normal value > 0.5; for RAC3, tumor methylated value > 0.

4.8. Quantitative Real-Time Reverse Transcription PCR (qRT-PCR)

Total RNA was isolated using the TRI reagent (Molecular Research Center, Cincinnati, OH, USA) and was converted into first-strand cDNA using an oligo (dT) primer and the AMV reverse transcriptase system (Roche Diagnostics, Penzberg, Germany). qRT-PCR was performed using a LightCycler 480 system (Roche Diagnostics). Thermocycling was carried out in a final volume of 10 μL containing 3 μL of cDNA sample, 200 nM of each primer, and 5 μL of SYBR green I master mix (Roche Diagnostics). Relative differences in the expression level between genes were expressed using cycle threshold (Ct) values as follows: the Ct value of the gene of interest was first normalized to that of GAPDH in the same sample; the difference between the treatment and control group was then calculated, and it was expressed as an increase or decrease in the cycle number compared with that of the control.

4.9. MassArray-Based Mutation Characterization

The MassDetect CRC panel (v2.0), enabling identification of 139 mutations in 12 genes, was selected from hotspots found in a previous study and the COSMIC database [37,54]. PCR and extension primers for 139 mutations were designed using MassArray Assay Design 3.1 software (Sequenom, San Diego, CA, USA). The PCR products were spotted onto SpectroCHIP II arrays, and the DNA fragments were resolved using a MassArray Analyzer 4 System (Sequenom). Each spectrum was then analyzed by Type 4.0 software (Sequenom) to identify mutations. We defined 5% abnormal signals as a putative mutation.

4.10. Cell Lines and Cell Culture

Nine human CRC cell lines, DLD-1, H3347, SW480, SW620, Caco-2, HCT116, HT29, RKO, and RKO-E6, were used. DLD-1 (CCL-221), SW480 (CCL-228), SW620 (CCL-227), CACO-2 (HTB-37), HCT116 (CCL-247), HT29 (HTB-38), RKO (CRL-2577), and RKO-E6 (CRL-2578) cells were purchased from the American Type Culture Collection (ATCC). H3347 was kindly provided by Shih-Ching Chang (Taipei Veterans General Hospital, Taipei, Taiwan). All cell lines were cultured in Dulbecco’s Modified Eagle’s Medium (DMEM) (Thermo Fisher Scientific) with 10% fetal blood serum (FBS), L-glutamine, 100 U/mL of penicillin and 100 µg/mL of streptomycin at 37 °C in humidified air with 5% CO2.

4.11. Bisulfite Sequencing PCR (BSP)

BSP was performed as described previously [55]. Briefly, bisulfite-modified DNA was prepared and used as the template for amplification of the EPDR1 gene promoter using AmpliTaq Gold®DNA Polymerase (Applied Biosystems, Carlsbad, CA, USA). The primers used for BSP are listed in Supplementary Table S2. The PCR products were subcloned into the TA cloning vector (Bioman Scientific, Taipei, Taiwan) and transformed into DH5α competent cells (Bioman Scientific). The plasmids were purified and sequenced. For all BSP assays, 15–20 independent clones for each CRC cell line were isolated and sequenced.

4.12. Western Blotting

Western blotting was performed as previously described [55,56]. Briefly, equal amounts of protein were electrophoretically separated by sodium dodecyl sulfate-polyacrylamide gel electrophoresis (SDS-PAGE) and were electrotransferred onto polyvinylidene fluoride (PVDF) membranes. The membranes were blocked and incubated overnight with primary antibodies against human EPDR1 (sc-81820; Santa Cruz Biotechnology, Santa Cruz, CA, USA). β-Actin (#ab6276; Abcam, Cambridge, UK) was used as a loading control.

4.13. 5-Aza-2’-Deoxycytidine (5-aza-dC) Treatment

CRC cells were seeded in 100-mm culture dishes. After incubation overnight, the culture medium was replaced with fresh medium containing 5 μM 5-aza-dC (Sigma-Aldrich, St. Louis, MO, USA) or dimethyl sulfoxide (DMSO), followed by incubation for 96 h. The culture medium was carefully replaced every 2 days. At the end of treatment, the cells were collected for qRT-PCR assays.

4.14. siRNA Transfection

DLD-1 and SW620 cells in 6-well plates were transfected with siRNA using the Lipofectamine 3000 transfection reagent (Invitrogen, Carlsbad, CA, USA) according to the manufacturer’s instructions. Validated double-stranded siRNAs for EPDR1 (stB0005769A) or non-target control siRNAs (siN05815122147) (One Array, Hsinchu, Taiwan) were mixed with the transfection reagent and then were added to the cell culture. After 72 h, the cells were harvested for subsequent proliferation and invasion assays. Cell proliferation was determined using the PrestoBlue cell viability reagent (Thermo Fisher Scientific) according to the manufacturer’s protocol. EPDR1 expression levels in the siRNA-transfected cells were examined by western blotting.

4.15. Invasion Assay

The invasion assay was performed as previously described [56]. Briefly, an upper chamber containing a polycarbonate filter (8-μm pore size; Corning, Lowell, MA, USA) was coated with Geltrex (Life Technologies, Carlsbad, CA, USA); the lower chamber contained 700 μL of 10% FBS growth medium. In total, 1 × 10⁵ cells in 500 µL of 1% FBS growth medium were plated in the upper chamber and were allowed to move overnight toward the growth medium in the lower chamber. The invasive cells were fixed with 100% cold ethanol and were stained with Giemsa stain (Sigma-Aldrich) for 30 min.

4.16. Statistical Analysis

The distribution of each clinicopathological variable was compared using the two-tailed Fisher’s exact test and chi-squared test. Numerical values were compared using Student’s t test. The data are expressed as the means ± standard deviation (SD). Statistical significance was defined as p < 0.05. The Kaplan–Meier method using the log-rank test was used to estimate overall survival (SPSS software 17.0; SPSS Inc., Chicago, IL, USA).

5. Conclusions

The present study demonstrated that EPDR1 hypermethylation is significantly correlated with a negative node status, a lower tumor stage, BRAF and TGFβR2 mutations and better prognosis in CRC patients. We further showed that DNA methylation modulated EPDR1 expression in CRC cells. The biological functions and involvement of EPDR1 in CRC progression may be related to CRC cell invasion. Understanding the biological functions and regulatory mechanisms of EPDR1 in CRC progression may provide new insight into the development of novel strategies for CRC treatment.

Supplementary Materials

The following are available online at https://www.mdpi.com/2072-6694/10/10/393/s1, Table S1: Q-MSP primer and probe; Table S2: Bisulfite-sequencing PCR (BSP) primer sequences for EPDR1 gene; Figure S1: Differential DNA methylation patterns in microsatellite stability (MSS), microsatellite instability (MSI)-methylated hMLH1 and MSI-mutated MMR CRC; Figure S2: The figure generated using cBioportal (http://www.cbioportal.org/). Shown are selected genomic profiles including mutations, putative copy-number alterations from GISTIC and mRNA expression data based on mRNA expression z-scores (RNA Seq RPKM). EPDR1 was entered under Gene Set. The plot indicating the correlation between EPDR1 mRNA expression (horizontal axis) and DNA methylation (vertical axis) was downloaded for visualization. These data were download to assess p values using linear regression; Figure S3: Mutation patterns of seven genes in 59 CRC patients; Figure S4: Methylation status of the +64 to +437 region of EPDR1 in CRC cell lines; Figure S5: Four CRC cell lines were treated with 5-aza-dC (5 μM) or DMSO (Ctrl) for 96 h and then were analyzed by qRT-PCR.

Author Contributions

C.-H.C., K.-C.L., and T.-C.L. conceived and designed the experiments. C.-H.C., S.-C.C., and H.-H.W. performed the experiments. C.-H.C., S.-C.C., H.-H.W. and S.-H.Y. analyzed the data. C.-H.C, K.-C.L. and T.-C.L. contributed to the writing and critical reading of the paper. All authors read and gave their approval for the final version of the manuscript.

Funding

This work was supported by CRC grants of Institute of Biomedical Sciences, Academia Sinica (IBMS-CRC97-P01 and IBMS-CRC102-P03) to T.-C.L. and grant of the Ministry of Science and Technology of Taiwan (MOST 107-2320-B-320-003) to K.-C.L.

Conflicts of Interest

The authors declare no conflicts of interest.

References

  1. American Cancer Society. Cancer Facts & Figures; American Cancer Society: Atlanta, GA, USA, 2016. [Google Scholar]
  2. Marmol, I.; Sanchez-de-Diego, C.; Pradilla Dieste, A.; Cerrada, E.; Rodriguez Yoldi, M.J. Colorectal carcinoma: A general overview and future perspectives in colorectal cancer. Int. J. Mol. Sci. 2017, 18, 197. [Google Scholar] [CrossRef] [PubMed]
  3. Biasco, G.; Derenzini, E.; Grazi, G.; Ercolani, G.; Ravaioli, M.; Pantaleo, M.A.; Brandi, G. Treatment of hepatic metastases from colorectal cancer: Many doubts, some certainties. Cancer Treat. Rev. 2006, 32, 214–228. [Google Scholar] [CrossRef] [PubMed]
  4. Rees, M.; Tekkis, P.P.; Welsh, F.K.; O’Rourke, T.; John, T.G. Evaluation of long-term survival after hepatic resection for metastatic colorectal cancer: A multifactorial model of 929 patients. Ann. Surg. 2008, 247, 125–135. [Google Scholar] [CrossRef] [PubMed]
  5. Bosman, F.T. Molecular pathology of colorectal cancer. Cytogenet. Cell Genet. 1999, 86, 112–117. [Google Scholar] [CrossRef] [PubMed]
  6. Esteller, M.; Gonzalez, S.; Risques, R.A.; Marcuello, E.; Mangues, R.; Germa, J.R.; Herman, J.G.; Capella, G.; Peinado, M.A. K-ras and p16 aberrations confer poor prognosis in human colorectal cancer. J. Clin. Oncol. 2001, 19, 299–304. [Google Scholar] [CrossRef] [PubMed]
  7. Grady, W.M. Genomic instability and colon cancer. Cancer Metastasis Rev. 2004, 23, 11–27. [Google Scholar] [CrossRef] [PubMed]
  8. Breivik, J.; Lothe, R.A.; Meling, G.I.; Rognum, T.O.; Borresen-Dale, A.L.; Gaudernack, G. Different genetic pathways to proximal and distal colorectal cancer influenced by sex-related factors. Int. J. Cancer 1997, 74, 664–669. [Google Scholar] [CrossRef] [Green Version]
  9. Boland, C.R.; Goel, A. Microsatellite instability in colorectal cancer. Gastroenterology 2010, 138, 2073–2087. [Google Scholar] [CrossRef] [PubMed]
  10. Toyota, M.; Ahuja, N.; Ohe-Toyota, M.; Herman, J.G.; Baylin, S.B.; Issa, J.P. CpG island methylator phenotype in colorectal cancer. Proc. Natl. Acad. Sci. USA 1999, 96, 8681–8686. [Google Scholar] [CrossRef] [PubMed] [Green Version]
  11. Dienstmann, R.; Vermeulen, L.; Guinney, J.; Kopetz, S.; Tejpar, S.; Tabernero, J. Consensus molecular subtypes and the evolution of precision medicine in colorectal cancer. Nat. Rev. Cancer 2017, 17, 268. [Google Scholar] [CrossRef] [PubMed]
  12. Kim, J.H.; Bae, J.M.; Cho, N.Y.; Kang, G.H. Distinct features between MLH1-methylated and unmethylated colorectal carcinomas with the CpG island methylator phenotype: Implications in the serrated neoplasia pathway. Oncotarget 2016, 7, 14095–14111. [Google Scholar] [CrossRef] [PubMed]
  13. Popat, S.; Hubner, R.; Houlston, R.S. Systematic review of microsatellite instability and colorectal cancer prognosis. J. Clin. Oncol. 2005, 23, 609–618. [Google Scholar] [CrossRef] [PubMed]
  14. Ward, R.; Meagher, A.; Tomlinson, I.; O’Connor, T.; Norrie, M.; Wu, R.; Hawkins, N. Microsatellite instability and the clinicopathological features of sporadic colorectal cancer. Gut 2001, 48, 821–829. [Google Scholar] [CrossRef] [PubMed] [Green Version]
  15. Jass, J.R.; Do, K.A.; Simms, L.A.; Iino, H.; Wynter, C.; Pillay, S.P.; Searle, J.; Radford-Smith, G.; Young, J.; Leggett, B. Morphology of sporadic colorectal cancer with DNA replication errors. Gut 1998, 42, 673–679. [Google Scholar] [CrossRef] [PubMed] [Green Version]
  16. Phillips, S.M.; Banerjea, A.; Feakins, R.; Li, S.R.; Bustin, S.A.; Dorudi, S. Tumour-infiltrating lymphocytes in colorectal cancer with microsatellite instability are activated and cytotoxic. Br. J. Surg. 2004, 91, 469–475. [Google Scholar] [CrossRef] [PubMed]
  17. Storojeva, I.; Boulay, J.L.; Heinimann, K.; Ballabeni, P.; Terracciano, L.; Laffer, U.; Mild, G.; Herrmann, R.; Rochlitz, C. Prognostic and predictive relevance of microsatellite instability in colorectal cancer. Oncol. Rep. 2005, 14, 241–249. [Google Scholar] [PubMed]
  18. Lanza, G.; Gafa, R.; Santini, A.; Maestri, I.; Guerzoni, L.; Cavazzini, L. Immunohistochemical test for MLH1 and MSH2 expression predicts clinical outcome in stage II and III colorectal cancer patients. J. Clin. Oncol. 2006, 24, 2359–2367. [Google Scholar] [CrossRef] [PubMed]
  19. Bertagnolli, M.M.; Niedzwiecki, D.; Compton, C.C.; Hahn, H.P.; Hall, M.; Damas, B.; Jewell, S.D.; Mayer, R.J.; Goldberg, R.M.; Saltz, L.B.; et al. Microsatellite instability predicts improved response to adjuvant therapy with irinotecan, fluorouracil, and leucovorin in stage III colon cancer: Cancer and leukemia group b protocol 89803. J. Clin. Oncol. 2009, 27, 1814–1821. [Google Scholar] [CrossRef] [PubMed]
  20. Ribic, C.M.; Sargent, D.J.; Moore, M.J.; Thibodeau, S.N.; French, A.J.; Goldberg, R.M.; Hamilton, S.R.; Laurent-Puig, P.; Gryfe, R.; Shepherd, L.E.; et al. Tumor microsatellite-instability status as a predictor of benefit from fluorouracil-based adjuvant chemotherapy for colon cancer. N. Engl. J. Med. 2003, 349, 247–257. [Google Scholar] [CrossRef] [PubMed]
  21. Weisenberger, D.J.; Siegmund, K.D.; Campan, M.; Young, J.; Long, T.I.; Faasse, M.A.; Kang, G.H.; Widschwendter, M.; Weener, D.; Buchanan, D.; et al. CpG island methylator phenotype underlies sporadic microsatellite instability and is tightly associated with braf mutation in colorectal cancer. Nat. Genet. 2006, 38, 787–793. [Google Scholar] [CrossRef] [PubMed]
  22. Merlo, A.; Herman, J.G.; Mao, L.; Lee, D.J.; Gabrielson, E.; Burger, P.C.; Baylin, S.B.; Sidransky, D. 5’ CpG island methylation is associated with transcriptional silencing of the tumour suppressor p16/CDKN2/MTS1 in human cancers. Nat. Med. 1995, 1, 686–692. [Google Scholar] [CrossRef] [PubMed]
  23. Esteller, M.; Corn, P.G.; Baylin, S.B.; Herman, J.G. A gene hypermethylation profile of human cancer. Cancer Res. 2001, 61, 3225–3229. [Google Scholar] [PubMed]
  24. Esteller, M.; Risques, R.A.; Toyota, M.; Capella, G.; Moreno, V.; Peinado, M.A.; Baylin, S.B.; Herman, J.G. Promoter hypermethylation of the DNA repair gene o(6)-methylguanine-DNA methyltransferase is associated with the presence of g:C to a:T transition mutations in p53 in human colorectal tumorigenesis. Cancer Res. 2001, 61, 4689–4692. [Google Scholar] [PubMed]
  25. Kim, Y.H.; Lee, H.C.; Kim, S.Y.; Yeom, Y.I.; Ryu, K.J.; Min, B.H.; Kim, D.H.; Son, H.J.; Rhee, P.L.; Kim, J.J.; et al. Epigenomic analysis of aberrantly methylated genes in colorectal cancer identifies genes commonly affected by epigenetic alterations. Ann. Surg. Oncol. 2011, 18, 2338–2347. [Google Scholar] [CrossRef] [PubMed]
  26. Ashktorab, H.; Brim, H. DNA methylation and colorectal cancer. Curr. Colorectal Cancer Rep. 2014, 10, 425–430. [Google Scholar] [CrossRef] [PubMed]
  27. Yi, J.M.; Dhir, M.; Van Neste, L.; Downing, S.R.; Jeschke, J.; Glockner, S.C.; de Freitas Calmon, M.; Hooker, C.M.; Funes, J.M.; Boshoff, C.; et al. Genomic and epigenomic integration identifies a prognostic signature in colon cancer. Clin. Cancer Res. 2011, 17, 1535–1545. [Google Scholar] [CrossRef] [PubMed]
  28. Melotte, V.; Lentjes, M.H.; van den Bosch, S.M.; Hellebrekers, D.M.; de Hoon, J.P.; Wouters, K.A.; Daenen, K.L.; Partouns-Hendriks, I.E.; Stessels, F.; Louwagie, J.; et al. N-myc downstream-regulated gene 4 (NDRG4): A candidate tumor suppressor gene and potential biomarker for colorectal cancer. J. Natl. Cancer Inst. 2009, 101, 916–927. [Google Scholar] [CrossRef] [PubMed]
  29. Hellebrekers, D.M.; Lentjes, M.H.; van den Bosch, S.M.; Melotte, V.; Wouters, K.A.; Daenen, K.L.; Smits, K.M.; Akiyama, Y.; Yuasa, Y.; Sanduleanu, S.; et al. GATA4 and GATA5 are potential tumor suppressors and biomarkers in colorectal cancer. Clin. Cancer Res. 2009, 15, 3990–3997. [Google Scholar] [CrossRef] [PubMed]
  30. Nimmrich, I.; Erdmann, S.; Melchers, U.; Chtarbova, S.; Finke, U.; Hentsch, S.; Hoffmann, I.; Oertel, M.; Hoffmann, W.; Muller, O. The novel ependymin related gene UCC1 is highly expressed in colorectal tumor cells. Cancer Lett. 2001, 165, 71–79. [Google Scholar] [CrossRef]
  31. Feng, Y.; Dai, X.; Li, X.; Wang, H.; Liu, J.; Zhang, J.; Du, Y.; Xia, L. EGF signalling pathway regulates colon cancer stem cell proliferation and apoptosis. Cell Prolif. 2012, 45, 413–419. [Google Scholar] [CrossRef] [PubMed] [Green Version]
  32. Moon, J.W.; Lee, S.K.; Lee, J.O.; Kim, N.; Lee, Y.W.; Kim, S.J.; Kang, H.J.; Kim, J.; Kim, H.S.; Park, S.H. Identification of novel hypermethylated genes and demethylating effect of vincristine in colorectal cancer. J. Exp. Clin. Cancer Res. 2014, 33, 4. [Google Scholar] [CrossRef] [PubMed] [Green Version]
  33. Mukai, S.; Oue, N.; Oshima, T.; Mukai, R.; Tatsumoto, Y.; Sakamoto, N.; Sentani, K.; Tanabe, K.; Egi, H.; Hinoi, T.; et al. Overexpression of transmembrane protein BST2 is associated with poor survival of patients with esophageal, gastric, or colorectal cancer. Ann. Surg. Oncol. 2017, 24, 594–602. [Google Scholar] [CrossRef] [PubMed]
  34. Liu, T.Q.; Wang, G.B.; Li, Z.J.; Tong, X.D.; Liu, H.X. Silencing of rac3 inhibits proliferation and induces apoptosis of human lung cancer cells. Asian Pac. J. Cancer Prev. 2015, 16, 3061–3065. [Google Scholar] [CrossRef] [PubMed]
  35. Ahmed, D.; Eide, P.W.; Eilertsen, I.A.; Danielsen, S.A.; Eknaes, M.; Hektoen, M.; Lind, G.E.; Lothe, R.A. Epigenetic and genetic features of 24 colon cancer cell lines. Oncogenesis 2013, 2, e71. [Google Scholar] [CrossRef] [PubMed]
  36. Simmer, F.; Brinkman, A.B.; Assenov, Y.; Matarese, F.; Kaan, A.; Sabatino, L.; Villanueva, A.; Huertas, D.; Esteller, M.; Lengauer, T.; et al. Comparative genome-wide DNA methylation analysis of colorectal tumor and matched normal tissues. Epigenetics 2012, 7, 1355–1367. [Google Scholar] [CrossRef] [PubMed] [Green Version]
  37. Cancer Genome Atlas, N. Comprehensive molecular characterization of human colon and rectal cancer. Nature 2012, 487, 330–337. [Google Scholar] [CrossRef] [PubMed] [Green Version]
  38. Morkel, M.; Riemer, P.; Blaker, H.; Sers, C. Similar but different: Distinct roles for KRAS and BRAF oncogenes in colorectal cancer development and therapy resistance. Oncotarget 2015, 6, 20785–20800. [Google Scholar] [CrossRef] [PubMed]
  39. Phipps, A.I.; Limburg, P.J.; Baron, J.A.; Burnett-Hartman, A.N.; Weisenberger, D.J.; Laird, P.W.; Sinicrope, F.A.; Rosty, C.; Buchanan, D.D.; Potter, J.D.; et al. Association between molecular subtypes of colorectal cancer and patient survival. Gastroenterology 2015, 148, 77–87. [Google Scholar] [CrossRef] [PubMed] [Green Version]
  40. Fang, M.; Ou, J.; Hutchinson, L.; Green, M.R. The braf oncoprotein functions through the transcriptional repressor MAFG to mediate the CpG island methylator phenotype. Mol. Cell 2014, 55, 904–915. [Google Scholar] [CrossRef] [PubMed]
  41. Kohli, R.M.; Zhang, Y. TET enzymes, TDG and the dynamics of DNA demethylation. Nature 2013, 502, 472–479. [Google Scholar] [CrossRef] [PubMed] [Green Version]
  42. O’Hagan, H.M.; Wang, W.; Sen, S.; Destefano Shields, C.; Lee, S.S.; Zhang, Y.W.; Clements, E.G.; Cai, Y.; Van Neste, L.; Easwaran, H.; et al. Oxidative damage targets complexes containing DNA methyltransferases, SIRT1, and polycomb members to promoter CpG islands. Cancer Cell 2011, 20, 606–619. [Google Scholar] [CrossRef] [PubMed]
  43. Riviere, G.; Lienhard, D.; Andrieu, T.; Vieau, D.; Frey, B.M.; Frey, F.J. Epigenetic regulation of somatic angiotensin-converting enzyme by DNA methylation and histone acetylation. Epigenetics 2011, 6, 478–489. [Google Scholar] [CrossRef] [PubMed] [Green Version]
  44. Shashoua, V.E.; Hesse, G.W.; Milinazzo, B. Evidence for the in vivo polymerization of ependymin: A brain extracellular glycoprotein. Brain Res. 1990, 522, 181–190. [Google Scholar] [CrossRef]
  45. Miranda, E.; Destro, A.; Malesci, A.; Balladore, E.; Bianchi, P.; Baryshnikova, E.; Franchi, G.; Morenghi, E.; Laghi, L.; Gennari, L.; et al. Genetic and epigenetic changes in primary metastatic and nonmetastatic colorectal cancer. Br. J. Cancer 2006, 95, 1101–1107. [Google Scholar] [CrossRef] [PubMed] [Green Version]
  46. Shirahata, A.; Sakata, M.; Sakuraba, K.; Goto, T.; Mizukami, H.; Saito, M.; Ishibashi, K.; Kigawa, G.; Nemoto, H.; Sanada, Y.; et al. Vimentin methylation as a marker for advanced colorectal carcinoma. Anticancer Res. 2009, 29, 279–281. [Google Scholar] [PubMed]
  47. Mizukami, H.; Shirahata, A.; Goto, T.; Sakata, M.; Saito, M.; Ishibashi, K.; Kigawa, G.; Nemoto, H.; Sanada, Y.; Hibi, K. PGP9.5 methylation as a marker for metastatic colorectal cancer. Anticancer Res. 2008, 28, 2697–2700. [Google Scholar] [PubMed]
  48. Yamazaki, T.; Hibi, K.; Takase, T.; Tezel, E.; Nakayama, H.; Kasai, Y.; Ito, K.; Akiyama, S.; Nagasaka, T.; Nakao, A. PGP9.5 as a marker for invasive colorectal cancer. Clin. Cancer Res. 2002, 8, 192–195. [Google Scholar] [PubMed]
  49. Boland, C.R.; Thibodeau, S.N.; Hamilton, S.R.; Sidransky, D.; Eshleman, J.R.; Burt, R.W.; Meltzer, S.J.; Rodriguez-Bigas, M.A.; Fodde, R.; Ranzani, G.N.; et al. A national cancer institute workshop on microsatellite instability for cancer detection and familial predisposition: Development of international criteria for the determination of microsatellite instability in colorectal cancer. Cancer Res. 1998, 58, 5248–5257. [Google Scholar] [PubMed]
  50. Chadwick, R.B.; Pyatt, R.E.; Niemann, T.H.; Richards, S.K.; Johnson, C.K.; Stevens, M.W.; Meek, J.E.; Hampel, H.; Prior, T.W.; de la Chapelle, A. Hereditary and somatic DNA mismatch repair gene mutations in sporadic endometrial carcinoma. J. Med. Genet. 2001, 38, 461–466. [Google Scholar] [CrossRef] [PubMed] [Green Version]
  51. Grady, W.M.; Rajput, A.; Lutterbaugh, J.D.; Markowitz, S.D. Detection of aberrantly methylated hMLH1 promoter DNA in the serum of patients with microsatellite unstable colon cancer. Cancer Res. 2001, 61, 900–902. [Google Scholar] [PubMed]
  52. Eads, C.A.; Danenberg, K.D.; Kawakami, K.; Saltz, L.B.; Blake, C.; Shibata, D.; Danenberg, P.V.; Laird, P.W. Methylight: A high-throughput assay to measure DNA methylation. Nucleic Acids Res. 2000, 28, E32. [Google Scholar] [CrossRef] [PubMed]
  53. Wu, M.M.; Li, C.F.; Lin, L.F.; Wang, A.S.; Pu, Y.S.; Wang, H.H.; Mar, A.C.; Chen, C.J.; Lee, T.C. Promoter hypermethylation of LGALS4 correlates with poor prognosis in patients with urothelial carcinoma. Oncotarget 2017, 8, 23787–23802. [Google Scholar] [CrossRef] [PubMed]
  54. Lin, J.K.; Lin, P.C.; Lin, C.H.; Jiang, J.K.; Yang, S.H.; Liang, W.Y.; Chen, W.S.; Chang, S.C. Clinical relevance of alterations in quantity and quality of plasma DNA in colorectal cancer patients: Based on the mutation spectra detected in primary tumors. Ann. Surg. Oncol. 2014, 2, S680–S686. [Google Scholar] [CrossRef] [PubMed]
  55. Wang, H.H.; Wu, M.M.; Chan, M.W.; Pu, Y.S.; Chen, C.J.; Lee, T.C. Long-term low-dose exposure of human urothelial cells to sodium arsenite activates lipocalin-2 via promoter hypomethylation. Arch. Toxicol. 2014, 88, 1549–1559. [Google Scholar] [CrossRef] [PubMed]
  56. Lai, K.C.; Liu, C.J.; Chang, K.W.; Lee, T.C. Depleting IFIT2 mediates atypical PKC signaling to enhance the migration and metastatic activity of oral squamous cell carcinoma cells. Oncogene 2013, 32, 3686–3697. [Google Scholar] [CrossRef] [PubMed]
Figure 1. Methylation levels of (A) EGF, (B) CHST10, (C) EPDR1, (D) BST2 and (E) RAC3 in 75 colorectal cancer (CRC) tissues and adjacent non-cancerous tissues, as determined by quantitative methylation-specific polymerase chain reaction (Q-MSP). Normalization to β-actin (ACTB) was performed for all genes. p values were derived from the Mann-Whitney U test. EGF: epidermal growth factor; CHST10: carbohydrate sulfotransferase 10; EPDR1: ependymin related 1; BST2: bone marrow stromal antigen 2; RAC3: Rac family small GTPase 3.
Cancers 10 00393 g001
Figure 2. Kaplan-Meier analysis of overall survival in 75 CRC patients according to the methylation status of (A) EGF, (B) CHST10, (C) EPDR1, (D) BST2 and (E) RAC3. CRC patients were divided into two groups based on the methylation cut-off points of five genes, as described in the Materials and Methods section. p values were derived from the log-rank test.
Cancers 10 00393 g002
Figure 3. Methylation status of EPDR1 and corresponding EPDR1 mRNA levels in 23 paired CRC tissue specimens. (A) The mRNA level of EPDR1 was analyzed by qRT-PCR. (B) The DNA methylation level of EPDR1 was analyzed by Q-MSP. The mRNA and methylation levels of the EPDR1 gene are expressed on the log10 scale. Box-and-whisker plots represent data with boxes ranging from the 25th to 75th percentile of the observed values, with the horizontal bar at the median value. The correlation between the qRT-PCR and Q-MSP results was assessed using linear regression.
Cancers 10 00393 g003
Figure 4. EPDR1 expression and DNA methylation status in CRC cell lines. (A) The protein level of EPDR1 in CRC cell lines was examined by western blotting using β-actin as a loading control. (B) The mRNA level of EPDR1 in CRC cell lines was examined by qRT-PCR using GAPDH as a loading control. The data are the means and SD of three independent experiments. The relative expression of EPDR1 mRNA is expressed compared with that in DLD-1 cells. (C) The methylation levels of EPDR1 in CRC cell lines were determined by bisulfite sequencing PCR (BSP) and were quantified as histograms. (D) The upper graph presents the detailed 5-aza-dC treatment schedule; (Bottom) Four CRC cell lines were treated with 5-aza-dC (5 μM) or dimethyl sulfoxide (DMSO; Ctrl) for 96 h and then were analyzed by qRT-PCR. The data are presented as the means and SD of three independent experiments. * p < 0.05 compared with Ctrl cells.
Cancers 10 00393 g004
Figure 5. EPDR1 knockdown suppresses invasion in CRC cells. Two CRC cell lines, DLD-1 and SW620, were transfected with either EPDR1 small interfering RNA (siRNA, siEPDR1) or control siRNA (siCtrl). (A) The efficacy of EPDR1 knockdown was examined by western blotting using β-actin as a loading control. (B) Cell proliferation was determined using the PrestoBlue cell viability reagent. The data are presented as the means and SD of three independent experiments. (C) The invasiveness of siEPDR1- and siCtrl-transfected cells was analyzed using Boyden chambers coated with a layer of Geltrex. The data are presented as the means and SD of three independent experiments. * p < 0.05 compared with siCtrl cells.
Cancers 10 00393 g005
Table 1. Clinicopathological features of 75 patients with colorectal cancer (CRC).
nMSS *MSI #p Value
Gender
Male4228 (66.7)14 (33.3)0.004
Female3311 (33.3)22 (66.7)
Age 76.9 ± 3.662.9 ± 14.3<0.001
Stage
I–II4419 (43.2)25 (56.8)0.069
III–IV3120 (64.5)11 (35.5)
Differentiation
Well-moderate6338 (60.3)25 (39.7)0.001
Poor121 (8.3)11 (91.7)
Location
Proximal colon 275 (18.5)22 (81.5)<0.001
Distal colon4834 (70.8)14 (29.2)
Histology
Adenocarcinoma6836 (52.9)32 (47.1)0.704
Mucinous73 (42.9)4 (57.1)
* MSS: microsatellite-stable. # MSI: microsatellite instability.
Table 2. The association of methylation of EGF, CHST10, EPDR1, BST2, and RAC3 with clinicopathologic features in CRC patients.
EGFCHST10EPDR1BST2RAC3
Hypo-MHyper-MpHypo-MHyper-MpHypo-MHyper-MpHypo-MHyper-MpHypo-MHyper-Mp
Differentiation
Well-moderate33 (52.4)30 (47.6) 29 (46.0)34 (56.0) 33 (52.4)30 (47.6) 29 (46.0)34 (54.0) 32 (52.5)29 (47.5)
Poor5 (41.7)7 (58.3)0.4963 (25.0)9 (75.0)0.1775 (41.7)7 (58.3)0.4968 (66.7)4 (33.3)0.1909 (75.0)3 (25.0)0.150
Invasion depth
T1/T25 (38.5)8 (61.5) 5 (38.5)8 (61.5) 6 (46.2)7 (53.8) 6 (46.2)7 (53.8) 6 (54.5)5 (45.5)
T3/T433 (53.2)29 (46.8)0.33327 (43.5)35 (56.5)0.73632 (51.6)30 (48.4)0.72031 (50.0)31 (50.0)0.80135 (56.5)27 (43.5)1.00
Node stage
Negative23 (52.3)21 (47.7) 16 (36.4)28 (63.6) 18 (40.9)26 (59.1) 22 (50.0)22 (50.0) 26 (61.9)16 (38.1)
Positive15 (48.4)16 (51.6)0.74016 (51.6)15 (48.4)0.18920 (64.5)11 (35.5)0.04415 (48.4)16 (51.6)0.89115 (48.4)16 (51.6)0.250
AJCC stage
I–II23 (52.3)21 (47.7) 16 (36.4)28 (63.6) 18 (40.9)26 (59.1) 22 (50.0)22 (50.0) 26 (61.9)16 (38.1)
III–IV15 (48.4)16 (51.6)0.74016 (51.6)15 (48.4)0.18920 (64.5)11 (35.5)0.04415 (48.4)16 (51.6)0.89115 (48.4)16 (51.6)0.250
Microsatellite status
MSS18 (46.2)21 (53.8) 23 (59.0)16 (41.0) 28 (71.8)11 (28.2) 14 (35.9)25 (64.1) 14 (35.9)25 (64.1)
MSI20 (55.6)16 (44.4)0.4169 (25.0)27 (75.0)0.00310 (27.8)26 (72.2)<0.00123 (63.9)13 (36.1)0.01528 (77.8)8 (22.2)<0.001
EGF: epidermal growth factor; CHST10: carbohydrate sulfotransferase 10; EPDR1: ependymin related 1; BST2: bone marrow stromal antigen 2; RAC3: Rac family small GTPase 3.
Table 3. Mutation status of APC, TP53, KRAS, BRAF, TGFβR2, PIK3CA and SMAD4 in 59 patients with CRC.
nEPDR1 HYPER-M # (n = 27)EPDR1 HYPO-M (n = 32)p Value
APC
Wild type4120 (74.1)21 (65.6)0.483
Mutation187 (25.9)11 (34.4)
TP53
Wild type4622 (81.5)24 (75.0)0.550
Mutation135 (18.5)8 (25.0)
KRAS
Wild type4521 (77.8)24 (75.0)0.803
Mutation146 (22.2)8 (25.0)
BRAF
Wild type4917 (63.0)32 (100.0)<0.001
Mutation1010 (37.0)0 (0.0)
TGFBR2
Wild type5221 (77.8)31 (96.9)0.040
Mutation76 (22.2)1 (3.1)
PIK3CA
Wild type4619 (70.4)27 (84.4)0.196
Mutation138 (29.6)5 (15.6)
SMAD4
Wild type5725 (92.6)32(100.0)0.205
Mutation22 (7.4)0 (0.0)
# The cutoff value of EPDR1 was log (tumor methylated value) >0.5. APC: adenomatous polyposis coli; TP53: tumor protein 53; SMAD4: SMAD family member 4; KRAS: K-ras proto-oncogene; PI3KCA: phosphoinositide 3-kinase catalytic subunit-α.

