Sustainable Water Resource Management and Participatory System Dynamics. Case Study: Developing the Palouse Basin Participatory Model

Abstract
: The complexity of explaining highly scientific information and juggling a plethora of social values is leading agencies and communities such as those in the Palouse Basin to explore the use of participatory modeling processes using system dynamics. Participatory system dynamics as a methodology creates a transparent nexus of science, policy options, social concerns and local knowledge that enhances discussion of issues surrounding the use of natural resources. The process of developing a systems model uses the tenets of scientific theory, hypothesis testing and clear statements of assumptions. A unique aspect of the Palouse basin project is the use of system dynamics to describe ground water dynamics in a sole source confined aquifer system. There are, as of yet, no standards for analyzing participatory modeling projects, therefore, we use case study analysis to describe the process, insights and qualitative measurements of success.1. Introduction
Natural and social systems each have high levels of complexity and, when combined, as in the case of natural resource management, the magnitudes of complexity increase dramatically. Further complicating matters is the level of comfort people have when asked to step out of their discipline and assess information which may be the result of unfamiliar types of data and analysis. System Dynamics is a methodology that focuses on system behavior through the development and explanation of causal relationships thus making it an ideal bridge across disciplines. Furthermore because it focuses on causal relationships, the process of building a system dynamics model teaches people about the often synergistic elements that create feedback and delay within a system. We introduced participatory system dynamics modeling to a group of water managers and users in order to improve collaboration, and enhance scientific understanding and long-term future focused management of aquifer resources in the Palouse basin. The group created the Palouse Basin Water Resource Visioning tool so that others could learn about aquifer behavior in the context of infrastructure development, growth and changes in individual behavior.
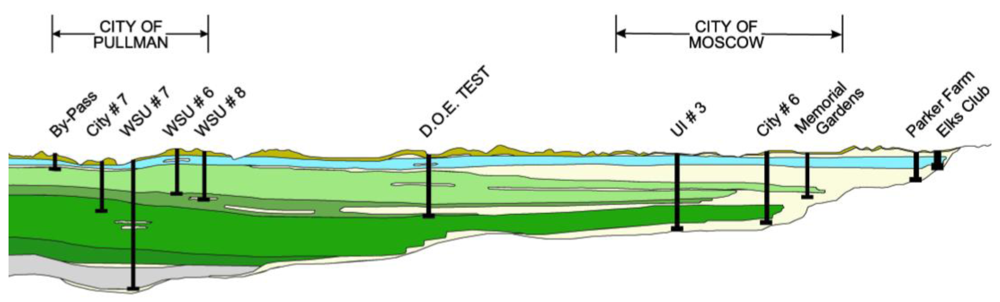
The Palouse Basin is located on the border of northwest central Idaho and southeastern Washington (Figures 1 and 2). The basin contains two aquifers, the Wanapum and the Grande Ronde, both named for the basalt formations in which the aquifers are located. The aquifers are the sole source of water supply for municipal, commercial, university, residential, and rural needs. The universities are the primary employers for both cities. The Grande Ronde is a magnitude larger than the Wanapum and has great quality water whereas the Wanapum water contains significant levels of minerals such as iron. The combined annual pumping total for major pumpers using the Grande Ronde in 2009 was 2.68 billion gallons, with the Wanapum supplying 300 million gallons (to one of the major pumpers). The Grande Ronde straddles the state line and multiple jurisdictions of local government. In an effort to coordinate management so as to assure a long range water supply, the Palouse Basin Aquifer Committee (PBAC) was formed (under a different name) in 1967 because of declining groundwater levels in municipal wells [1]. The committee has representatives from the cities, counties, universities and state water resource agencies. In 1988 PBAC officially became a multi-jurisdictional, cooperative group with the initiation of a cooperative ground water management plan that was completed in 1992 [1]. Their mission is “to ensure a long-term, quality water supply for the Palouse Basin region [1]. Water allocation is a function of state law. PBAC functions under a non-binding Resolution of Understanding between the water management agencies of Washington and Idaho. Some basin residents are concerned that there is no legally binding agreement across the state line for bi-state management of this water resource. Others support the status quo; “PBAC is purposely and proudly a voluntarily-cooperative effort between entities”.
Early wells first accessed the aquifers in the late 1800s. Some wells in the Grande Ronde were flowing artesian; one had adequate pressure to supply the third floor of a local hotel [1]. Residents realized that the uncapped wells were losing significant amounts of water each day and made the decision to cap the wells in the early 1900s. Records dating back to the 1930s indicate an average of 0.45 m/year drop in the Grande Ronde aquifer level (∼36 m over 80 years). Current well data indicate that the rate of decline has dropped to approximately 0.3 m/year [1]. Furthermore, tests to date have indicated little or no recharge. Demand on the Wanapum increased until the mid 1960s when, in response to rapidly falling well levels, the municipality of Moscow, Idaho drilled wells into the Grande Ronde that currently satisfies 70% of its demand. Moscow had nearly stopped using the Wanapum until the 1980s when well levels had recovered to the point that pumping was again possible. This aquifer currently supplies 30% of the demand for the city. Wanapum well levels have for the most part recovered and are showing signs that the current use may be sustainable. That said, the Wanapum currently supports only a small percentage of the total basin population.
In spite of an increase in basin population, the Grande Ronde is now showing an average rate of decline of 0.3 m/year. Hypothetically the increase in demand by population growth is being offset with infrastructure improvements and conservation efforts although, as will be discussed later, accounting for different uses and changes in use is complex and problematic. In addition, the Grande Ronde basalt structure is sufficiently heterogeneous that to date traditional ground water models, such as Modflow, have offered little insight into the overall nature of the aquifer [4]. To date there are hypotheses about how long supply will last, however those concerned with water supply tend to view information and interpret the scientific uncertainty from different perspectives. Local communities have constituents promoting growth and development who have the view “there is and will be enough water” as well as constituents who feel that the communities should be advocating the precautionary principle and conservation. This diversity of opinion has led to political tensions that have caused strained relationships within communities and across the state line. Water managers who are aware of the scientific uncertainty and the differing public opinions must still work together to manage the resource, advise their political entities, and report to the public.
In response to this issue, researchers at the University of Idaho Waters of the West Program invited the local aquifer committee to join in a participatory project to create a model that could be used to explore “what if” scenarios using system dynamics. These scenarios were designed to look at aspects of management including growth, conservation and the addition of new sources of water. The research group began with a pilot project that offered participants the opportunity to explore the use of participatory modeling for education and outreach and the use of system dynamics as a decision support platform. Researchers also felt that through the use of a pilot they could develop trust in the non-traditional modeling platform that it would not create a “black box”, and trust that the process would be transparent and politically neutral. The one-year pilot was successful and the group moved forward for another year during which they produced an online educational tool. The process of developing the model has helped participants better understand the complexities of aquifer science, system opportunities and constraints. This paper describes the process and the model that was created.
It is important to note that even in the light of a declining aquifer the area does not currently have a water availability crisis and scientific studies have not been able to estimate the time when water may run out. Local water managers have decided to become proactive at better understanding different potential futures that may be beyond their tenure as managers. They are moving towards this forward thinking, sustainable, system wide perspective in the hopes that potential future conflict can be avoided and that new and creative thinking will enhance the community as a whole.
A unique aspect of this project is the use of system dynamics to describe ground water dynamics in a confined aquifer. As described in Section 2 of this paper most of the participatory water resource models to date deal primarily with surface water or with systems that have active surface to ground water dynamics. Some of the basins are in high conflict; others like the Palouse are “pre-conflict”—although in the US West many would argue that where there is water there is conflict. Herein, we describe our process so that others can understand the benefits of using this type of approach and move in the direction of sustainable and transparent water resource management. Participatory modeling in the natural resource management arena is relatively new thus there are few established criteria for analysis. Furthermore each process is customized in a variety of ways to fit different situations and described by several names including Shared Vision Planning and Computer Assisted Dispute Resolution [5], mediated modeling [6] and collaborative modeling [7]. Using case study analysis to understand the lessons learned from different processes is an effective method for advancing the field [8,9].
2. Participatory System Dynamics Modeling and Water Resources
As the management of natural resources is becoming increasingly complex, agencies that manage resources have come to realize the value of public input into the decision-making processes and encourage participation in a variety of forums that attempt to both educate and gather public sentiments. Driving this move to greater public participation, as experienced in the Palouse Basin, is the scientific uncertainty about the resource that can polarize the public with the resulting legal and political actions causing paralysis in agency management. Due to the complexity of explaining often highly scientific information and juggling a plethora of social values, agencies and communities such as those in the Palouse Basin are using participatory modeling processes that employ system dynamics to create a transparent nexus of science, policy options, social concerns and local knowledge. In doing so discussion of issues surrounding the use of natural resources is enhanced. This process uses the tenets of scientific theory, hypothesis testing and clear statements of assumptions.
System dynamics was developed by Jay Forrester [10]. Meadows et al. [11] describe system dynamics as a method to help us to see the world as a set of unfolding behavior patterns and in doing so shifts our focus from single pieces of a system to the connections between many pieces. It is based on the premise that all systems have elements of accumulation, flow, feedback and delay that change through time. The dynamics between these elements create behavior patterns such as growth, decay and oscillation [12]. Static or linear models advance understanding of a system at rest or at a discrete place in time; dynamic models provide insight as to how a system changes. System dynamics modeling becomes an effective learning tool when those who are to learn from the model are a part of the model building team [9]. Furthermore, Beall and Ford [8] (p. 74) noted that “when faced with complex, multi-stakeholder environmental issues, system dynamics has the greatest potential when used in a participatory fashion by scientists and managers working together with others who also have a stake in land management decisions.” Sterman [13] (p. 291) reminds us that “[i]f people had a holistic worldview, they would then act in consonance with the long-term best interests of the systems as a whole.” Viewing the system holistically will help natural resource managers better understand the complexities of sustainable management.
System dynamics has been used to help with the complexities of water management whereas hydrologic models are traditionally designed with software systems such as Modflow or Riverware. MODFLOW, for example, first published by the USGS in 1984, is a three-dimensional groundwater model that solves the partial differential equations of flow using finite difference techniques [14]. Riverware simulates river basins and reservoirs using a library of algorithms and solvers that allow the user to create an optimizable basin network model specific to each surface water system's physical make-up and operating policies [15].
These hydrologic models help scientists understand the storage and movement of water in aquifers or river systems and can capture the effects of pumping from such systems but do not include social and economic issues that affect demand. Though Modflow or Riverware are considered conventional or traditional water resource models “the iconic nature of water stocks and flows works well with many types of modeling software” [8] (p. 75). System dynamics software allows modelers to use insights learned from hydrologic studies and then model the relationship between the hydrologic system and other aspects of the system such as economics, growth, conservation, and other non-physical parameters of the system. In doing so modelers and model users can better understand how a change in one type of parameter affects other types of parameter. Furthermore, system dynamics simulations can be run in a matter of seconds so that users may explore multiple “what if” scenarios in a short period of time.
Current work by Winz et al. traces the theoretical and practical evolution of system dynamics in regional planning and river basin management, urban water management, flooding and irrigation [16]. Specific examples of hydrologic modeling in a system dynamics format include the work of Tidwell et al. [17] (p. 357) who used system dynamics modeling to assist citizens with watershed planning in the Middle Rio Grande River valley. Stave used a system dynamics model to facilitate public understanding of water management options in Las Vegas [18]. Saysel and colleagues modeled the impact of water development on social and natural environments in Turkey [19]. Videira et al. used system dynamics to help elucidate policy concerns in a river basin in Portugal [20]. Langsdale et al. modeled the effect of climate change on future water supplies in the Okanagan Basin, British Columbia [21-23]. The US Army Corp of Engineers (USACE) has used participatory processes and systems dynamics software for Shared Vision Planning. USACE projects include: Alabama-Coosa-Tallapoosa-Apalachicola-Chattahoochee-Flint Basins Shared Vision Planning, California State Water Planning Support, Interstate Commission on the Potomac River Basin Cooperative Water Supply Operations, Lake Ontario-St. Lawrence River Study and the National Drought Study [5]. Aspects of both ground water and surface water interactions have been described by aforementioned studies but none deal with a sole source confined aquifer.
3. The Palouse Basin Participatory Model
The University of Idaho Waters of the West Program, the PBAC and its Citizen Advisory Group (CAG), representatives from Washington Department of Ecology and Idaho Department of Water Resources and local citizens engaged in a pilot project to explore the use of participatory modeling to assist with water resource management decisions. The project began with its first workshop in March of 2008. At the completion of the one year pilot PBAC agreed to partner for another year so that the group could explore the system in more depth and produce an educational tool that could be made available to policy makers and the public.
The model developed throughout the two years and currently combines groundwater supply parameters, issues surrounding demand and potential policy considerations for both conservation and “new water”. Model building followed an iterative process that included workshops and model building between workshops. Modelers built simulations of their understanding of stakeholder concerns expressed during the group meetings. They then returned to the group with a simulation model to be vetted by the group. This process followed the scientific method of hypothesis generation and testing and embraces the “simulate early and often” paradigm described by Beall and Ford [8]. The model developed with the input and commentary from each meeting that was elicited though discussion about current simulation results. The process encouraged members of the groups to explore many of the questions frequently asked by local water users (Table 1). It also helped with the exploration of individual participants mental models of water issues in the Palouse Basin as well as the scientific uncertainty that is inherent to the system. The iterative nature of the process helped promote a shared vision of the problem and potential solutions through discussion and model development.
3.1. The Workshops
The process began with an invitation to PBAC from UI Waters of the West. Researchers chose to begin with this group because the “primary role of PBAC is to encourage the pumping entities to implement the Ground Water Management Plan” [1]. PBAC extended the invitation to include members of its CAG and an interested member of the public that frequented meetings. Workshop invitations were sent via email to 35 prospective participants that included representatives from PBAC, the CAG, Washington Department of Ecology, Idaho Department of Water Resources and local scientists with expertise in hydrology and geology. The first workshop had an attendance of 17 with affiliated representation listed below (Table 2). The final workshop during the first year had an attendance of 11 with most interests represented.
Five 3 hour workshops were held at about six week intervals during the first year, four workshops were held during the second year. Attendance was lower during the second year with an average of 6–9 participants. Second year participation primarily included PBAC representatives of the major pumpers who reported back to PBAC during their regular meetings, and one member of the CAG who also reported back to those interests. The State agencies kept apprised of the situation although budget constraints at that time prevented their representatives from attending workshops. As noted above modelers would take insights and information from the workshops and build iterations of the model between workshops. Modelers would also use the time between workshops to meet with local university experts in geology and hydrology. This one on one interaction provided the opportunity for technical discussion and brainstorming over discrete technical elements of the model. The workshop participants trusted this arrangement, as they had relied on many of these experts for advice on other issues, furthermore knowing that these experts were involved in vetting increased trust in the model.
The first workshop began with a brief synopsis of PBAC's mission statement to ensure a long-term, quality water supply for the Palouse Basin through the development and implementation of a balanced basin wide water supply and use program [1]. This set the tone that the group was indeed focused on long-term sustainable management; a view that is far more comprehensive than many local discussions that tend to revolve around very specific, localized issues without little effort placed on characterizing the entire system. The first group exercise was a collaborative effort to create a Palouse Basin timeline. The purpose of producing a timeline was to help participants view ground water in the context of the greater system while recognizing the collective knowledge of the group and the historical context that brought the communities to the place they are today.
The first model mapping exercise split the participants working into three groups who were asked to define the stocks, flows and defining parameters that were important to the Palouse water system. The participants recognized that many of the issues that affect the use of water were extremely difficult to quantify or predict but nevertheless were very important to the behavior of the system. These potential limitations are what make system dynamics so well suited for this issue [24]. “System dynamics was designed specifically to overcome these [types of] limitations and from the beginning stressed the development of useful, realistic models, models unconstrained by the demands of analytic tractability, based on realistic assumptions about human [and other] behavior, grounded in the field study of decision making and utilizing the full range of available data, not only numerical data, to specify and estimate relations” [13] (p. 322).
Over the course of the first year pilot project iterations of the model were presented to the group at each workshop with updates and revisions reflecting the requests of the group. Discussions centered on the types of information to include in the model and how simulation results were displayed. The first year culminated with a presentation at the local annual Water Summit and included model simulations that had been approved by the group. Six months later the process moved into the second phase which produced an educational model available to the public.
The primary challenge the modelers faced was simulating aquifer behavior using parameters that hydrology experts could both accept and agree upon. This was compounded by some of the hydrology experts' lack of exposure to system dynamics. There are different opinions for the Grande Ronde aquifer structure, storage capacity, recharge and outflow; limited available data creates uncertainty that invites dialog on competing conceptualizations. The modelers spent a significant amount of time testing various model structures that could accommodate both the available data as well as the hypotheses concerning multiple parameters [25]. The structure and parameters that are used in the current version of the model were vetted by select local hydrology experts that have stated that although the model is different from what they are accustomed to it does re-create history with plausible parameters and equations. We do not claim that the current model structure is correct, but it is plausible.
Simultaneous to stock, flow and parameter development, the modelers and participants were adapting the interface to accommodate a variety of policy choices and to be user friendly. Half way through the second year an online version of the model hosted on Forio™ [26] was made available to the core group who could share with those who could offer advice. Over the next several months the model-testing group expanded to include all of the initial participatory modeling invitees which included all of PBAC and the CAG, local environmental experts and other interested parties. The Forio™ format allowed the modelers to respond to comments and quickly modify the interface while maintaining a single URL.
3.2. Process Results and Insights
The initial workshop set the tone for the project. One of the goals shared by the facilitators was to move away from the heated and value laden “tell us when we are going to run out of water” to “what would we do as a community if we knew”. The timeline exercise was an important step towards shifting these types of perceptions. The timeline that was produced reflected not only changes in population and water management strategies but also issues that are pertinent to how the communities had developed such as the year the first shopping mall was built, and the development of bike trails and farmers markets. It also highlighted that some of the things that the community was doing to increase quality of life also had the tendency to promote growth; these issues often have contingents on opposing sides of political debates.
Early in the workshop series the group identified important stocks, rates and other parameters that needed to be included in the model. Stocks included water in the Grande Ronde formation, water in the Wanapum formation, and populations of people. There was discussion about the issue of “double counting” people due to the mobile nature of the local population. For example many people who work in one town live in another. The group eventually agreed on the use of basin totals for population divided by total pumping to establish per capita usage. Pumping rate totals for the six primary pumpers were added together to establish total basin pumping. It should be noted that individual wells pumping for domestic use of less than 5,000 gallons per day (141.5 m3/day) in Washington, and 13,000 gallons per day (368 m3/day) in Idaho are not currently required to report volume pumped to the states. Due to the inability to count other users, individual wells were not included in the pumping totals. The group decided that using a single total, or spatially lumped model would enhance the perspective that this is a basin wide issue not one entity versus another. The difficulty of estimating total volume and recreating historic well data led to the question of using the “bathtub” approach for the model by starting with a fixed amount of water and basing different conservation and growth strategies on that fixed amount. The group did not like this approach because of the value-based discussions that come from a “0.45 m/year” issue. Some people think this is a large drop, while others find it of little concern. Essentially the group felt that by using a bathtub approach the model would not simulate individual well data (which it does not) and that it would be of limited use. The group also described rates and other parameters that affected the flows that included: precipitation, evapotranspiration, recharge, growth, conservation, education, social capital and numerous other factors. The group ultimately decided on using a spatially lumped model and understood that the model would not discretely reproduce well behavior for any given year however felt it was reasonable for the lumped model to be vetted by comparing it to the behavior of the WSU test well.
Discussion during the first year illuminated the difficulty of estimating the total volume of the aquifer as well as demand into the future. Prior informal estimates indicate approximately 100 years of water in the aquifer at the current rate of use. Managers have been basing decisions on their 1992 Ground Water Management Plan that recommends pumpers keep their increases in pumping to “1% of their pumping volume based on a five year moving average starting with 1986” [1]. They have been successful in maintaining pumping rates below this 1% in spite of area growth (currently at 1%) primarily through the use of water conservation for example by changing to low flow fixtures, and fixing leaks. Personal conservation may have played a role as well but that change in use is impossible to track. Pumpers have increased efficiency yet they are also working under the “one hundred years of water” assumption that has given them the confidence that no crisis is immediately pending. That said the drop of 0.3 m (current) to 0.45 m (historically) per year is of concern politically.
Other concerns included how the model would be used. As early drafts were available to the group on a regular basis (and thus potentially to those outside the group) there was concern that draft versions of the model could reflect a consensus of the group or that it could be misinterpreted and used for political fodder. It was noted that it would be difficult for people to understand the current model assumptions if they were not in the room when the model was explained. To address this concern a disclaimer was added to the opening page of early versions that stated the model and process were experimental. As time progressed much of this concern was alleviated. Participants gained trust in the model and the iterative vetting process. In addition as participants assisted with the development of the interface they realized that they were creating a transparent and neutral model. As noted earlier, the meetings between workshops with hydrology and geology experts were especially important. It not only helped the modelers more effectively design the model but also increased trust in the final product.
Throughout the workshops there was discussion as to whether the model should be used for public education and/or to support decision-making. The potential of multiple versions was considered with a technical version for internal use and a simplified, educational version for use with the public. There was not sufficient confidence early in the process to make the decision of having the model available to the public at large but as the workshops continued the group decided that developing the model into an educational tool was useful. This was the impetuous for the second phase of the participatory model building process.
The first year culminated with a presentation at the local annual Water Summit. Feedback from both participants and summit attendees was very positive. Summit attendees appreciated the emphasis on the participatory process and the wide cross section of participants added to both credibility and transparency. Summit attendees also seemed to understand that the process and the model had equal importance. One concern of the participants throughout the modeling exercise was that those not part of the process would take something from the model scenario outputs and use the information to further an agenda. This did not seem to be a problem; however the presenter did go to lengths to explain that all models had basic assumptions that should be openly explained and understood before using a model for decision support. In addition it was emphasized that questioning both model inputs and outputs was an important part of not only building models, but also using them. Or in other words models are educational tools to help us make better-informed decisions, not tools to make the decisions for us.
In the six months after the Water Summit researchers discussed taking the model to a next step with participants. When the topic was brought to PBAC for discussion some PBAC members noted that at the time they felt that the scientific uncertainty surrounding available data was still too much for them to have enough confidence in the participatory model and use it as a decision support tool. Others noted that they were currently managing on the basis of uncertain scientific data and mathematical models and that the new model could incorporate the older data as well as be adaptable to new data as they were produced. Some were uneasy with the very concept of a decision support tool. The decision was made to go forward with the idea of creating an educational model. Although concern may not have been brought up at that time the questions “who will have access to the model?”, and “can the model be used for a specific political agenda?”, were not voiced. The modeler/facilitators felt that this indicated that a level of trust had developed concerning the participatory process, system dynamics as a modeling format as well as the modeler/facilitators.
The next set of workshops followed a similar pattern to the first set with iterations of development followed by workshops and vetting. Near the end of the second year the model was presented to a group of policymakers who had joined together for a round table on local water resources. As noted before the basin is not currently experiencing high conflict over water but there have been a few heated skirmishes related to water and development of both new wells and commercial construction. One elected official noted that it is nice to know that the participatory model “was neutral”. There were again multiple questions regarding how the model could be used but this time the concern of using the model for political agendas was not brought up. Questions included: “Can the model be used to understand tradeoffs between the use of the aquifers and a potential surface water supply?” “Can the model include aquifer storage and recovery?” “How much do low-flow fixtures save?”, and “Can you include xeriscaping?” In general the questions were focused on basin wide issues rather that how much can be done by one entity versus another.
The final workshop of the project was directed towards making the model available to the general public through various websites. A link to the model, now known as the Palouse Basin Water Resource Visioning Tool is currently available on the PBAC website and a local water conservation network website. The group plans to make the web link available on city websites and will potentially post the link on local water bills.
3.3. The Model
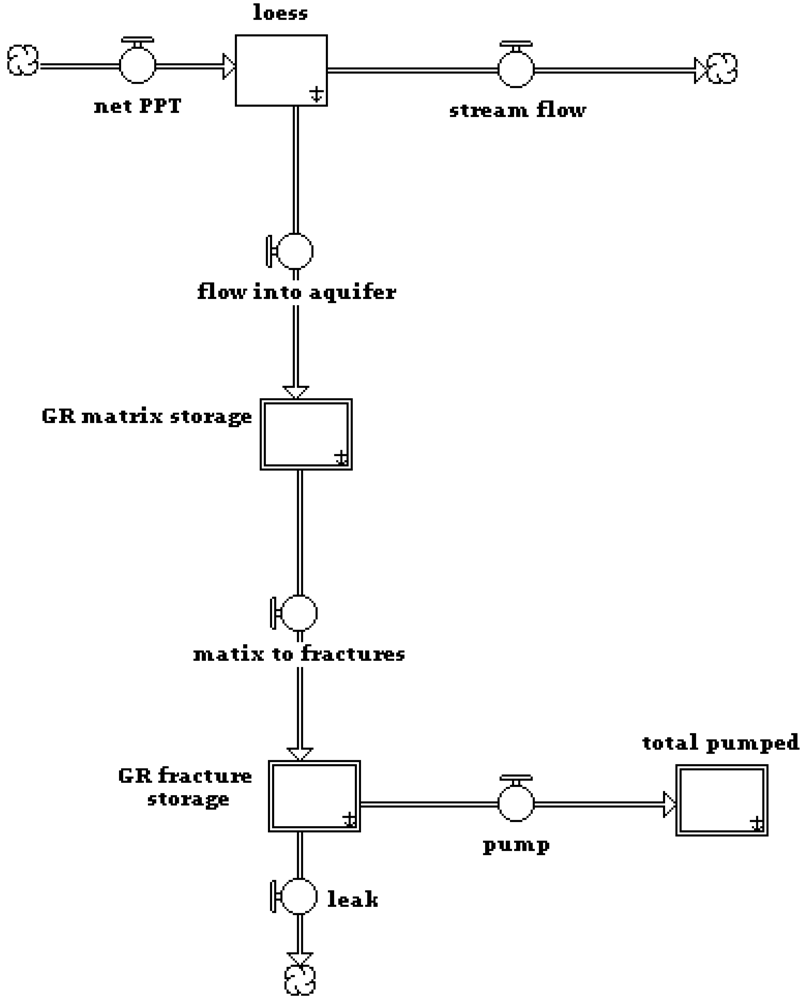
While the focus of this paper is on the participatory elements, a brief overview of the hydrologic model is provided for context. A paper in preparation [25] will provide technical details, parameter values, and additional results. The Palouse Basin Water Resource Visioning Tool includes parameters such as aquifer storativity, recharge, pumping history, projected demand and potential conservation, potential use of reclaimed water, hypothetical reservoirs and the potential contributions of individual conservation measures. The model is designed as a living entity that can be updated as new data or concerns surface. The modelers chose Stella™ [27] software to take advantage of the module capabilities and storytelling capabilities that creates the opportunity for users to unfold an illustration of any chosen model structure one parameter at a time. The model runs at a yearly time step for 200 years. This time step was chosen because the group was interested in long-term basin wide trends. The model runs for 200 years to accommodate 100 years of historic data and another 100 years of potential simulated futures. A schematic of the Grande Ronde is shown in Figure 3. The structure for the Wanapum is similar.
Net precipitation (Net PPT) was determined by precipitation minus evapotranspiration using climate normals (30-yr average values 1971–2000) over the basin area. Recharge, Qr, was computed using the concept of residence time
Each aquifer is represented as two connected stocks, one representing the “matrix” and one representing the “fractures.” While much variation exists, basalt stratigraphy generally can be separated into two zones with dramatically different hydraulic characteristics: flow interiors (matrix), and interflow zones located at the interface of the tops and bottoms of individual flows (fractures). The interflow zones in which water supply wells are completed are generally much more conductive. Thus, the aquifer is conceptualized as a dual porosity/storativity system, with relatively low storativity/high hydraulic conductivity fractures, connected to a higher storativity/low conductivity matrix. This conceptualization is consistent with published conceptualizations [28]. The volume, V, of water in each stock was calculated by the equation
This parameterization is intended to capture the long-term, aggregate behavior of the aquifer system, useful for concomitant planning and management. A modeling conundrum specific to basalt flow with sedimentary interbeds, is that without large recharge rates to the Grande Ronde, which are not supported by isotope age dating or geology, it was difficult to reconcile the storativity obtained from pump tests, geologically derived basin area, and observed decline in head with the amount of water removed from the basin annually. The dual storativity parameterization addresses this conundrum while being generally consistent with the nature of basalt flows. This “new” conceptualization also served to spark significant discussion in the participatory process.
3.4. Model Results
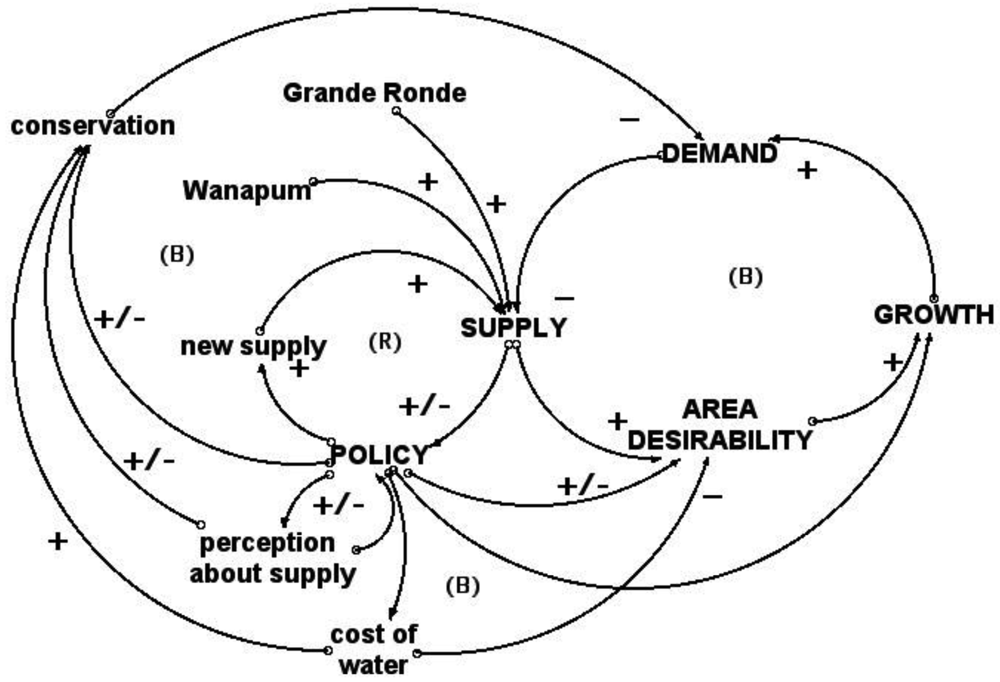
Figure 4 illustrates the resulting story sequence that describes important relationships in the system. The discussion over water in the basin tends to become focused on the issues surrounding supply uncertainty which does have a near term chance of being resolved due to the complexity of the aquifers and available research funding. This causal diagram helps users focus on the bigger picture and their personal mental models. One interesting aspect of this diagram is that supply and demand has the potential to become balanced, yet this is only valid with additional supply because there is little or no recharge to the Grande Ronde aquifer. Nevertheless many people assume that there will always be water and that additional supply will be available with little thought as to the complexities of developing such a supply. As users click through the story sequence this issue and others are highlighted with pop up text boxes. The participants were not able to fully develop the “cost of water”, “area desirability” and perceptions about supply sectors although they felt that including them in part was important. These sectors were not fully developed partly due to time constraints but more pointedly to the nature of the expertise of the stakeholders who were at the table. Stakeholders recognized that additional economic expertise and area politicians should be included before economic and policy related discussions could go forward.
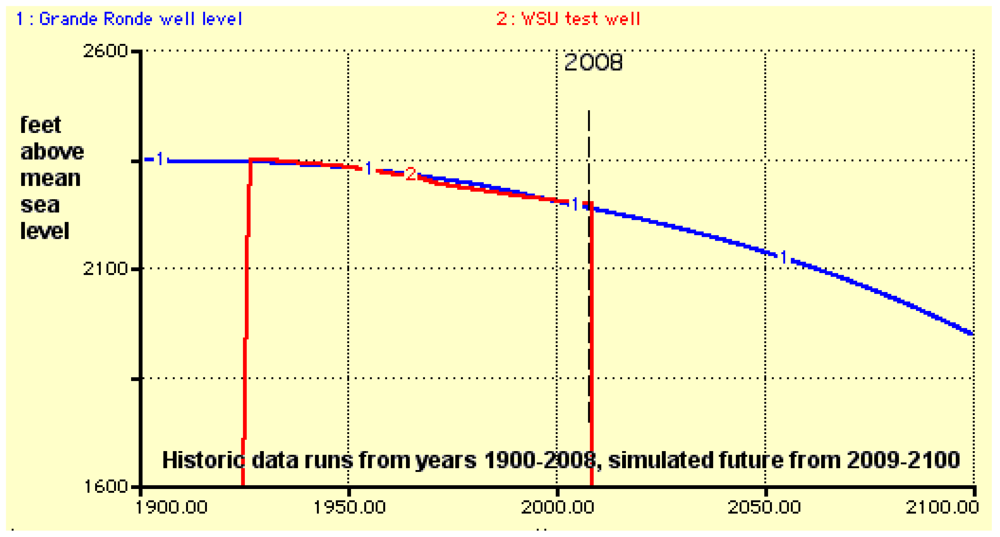
The most important feedbacks in the model are found within the Grande Ronde and Wanapum sectors in the aquifer stock and flow structures that simulate historic aquifer trends [25]. Simulated results are shown with a particular historic well data in Figure 5 with 1% population growth. The WSU “test well” was chosen for comparison to the model simulations because this monitoring well is not pumped and has for the best long term data collection record; note that almost every well in the basin exhibits a similar trend. Figure 6 compares the implications of both 1% and 2.5% population growth scenarios. The 200-year time horizon can be found on all of the simulation graphs so that the perception of history is always present. Mental models often leave people with the impression that “things have always been this way, so they always will be this way”. With long term history always present, users can compare what they have based their mental models on with different potential futures. It also helps better visualize how quickly things can change with increased growth (Figure 6). Another reason for the time horizon is that the cities and both universities were founded just before the turn of the 20th century; 100 years of water remaining could essentially mean that they are at their half-life if no additional supply is secured.
The model interface includes simulation options where users can explore the combined effect of different growth scenarios, conservation scenarios and reservoirs. Users also can input their personal water bill, evaluate their actual use per appliance, showers, toilets and sinks, and explore the implications of increased water use in the summer for outdoor irrigation. A scientific section describes concepts that helped us arrive at storage estimates by walking users through a story of the aquifer structure within the model.
4. Ah-ha Moments
One of the first questions one hears in the system dynamics community after a model has been built is “what were the ah-ha moments?” For the group, especially the hydrology experts accustomed to conventional hydrologic models, coming to the realization that system dynamics was successfully used to simulate lumped aquifer behavior, in a transparent manner and explained visually, was compelling. The participatory model was designed to simulate the aquifers as a whole (lumped), whereas conventional hydrologic models employ classic differential calculus to simulate distributed response; and, though the latter is a process of modeling that is effective and can answer different questions, it is a “black-box” to many non-technical people. Simple illustrative stock and flow exercises early in the participatory process helped the group understand how equations were developed and integrated over time in a system dynamics model. After these exercises the participants were comfortable seeing a structure and then letting the underlying system dynamics software “do the calculus” and integrate values over time.
For the modelers one of the most profound moments was the resulting model behavior created by adding an additional stock to aquifer supply and moving from a single storage concept to a dual storage concept. When this dual storage concept and the simulation results were presented to the group there was also a resounding ah-ha moment followed by the comment that “this makes sense” as it is easy to visualize the binary nature of basalt flows, observable in many area road cuts and canyons. The concept helped resolve inconsistencies between test data, supply calculations, age dating, basin area, and well behavior data [25]. Modelers had been able to recreate behavior in earlier versions of the model with a single stock, or single storage system, but it required the use of highly sensitive exogenous input parameters that dominated model behavior. Hydrology experts indicate that this type of sensitivity is inconsistent with not only the size of the aquifers, but also with recharge rates and residence time. With the aid of graphs illustrating sensitivity and the actual stock and flow structures, modelers, experts and participants discussed the structure and sensitivity issue at length. There was strong consensus that a dual storage system made sense. From a system dynamics perspective adding a stock and including feedbacks between stocks is central to modeling behavior. The ability to modify model structure, discuss those changes and to test hypotheses and question assumptions encouraged scientific inquiry beyond the model and queries as to how to test assumptions in the field.
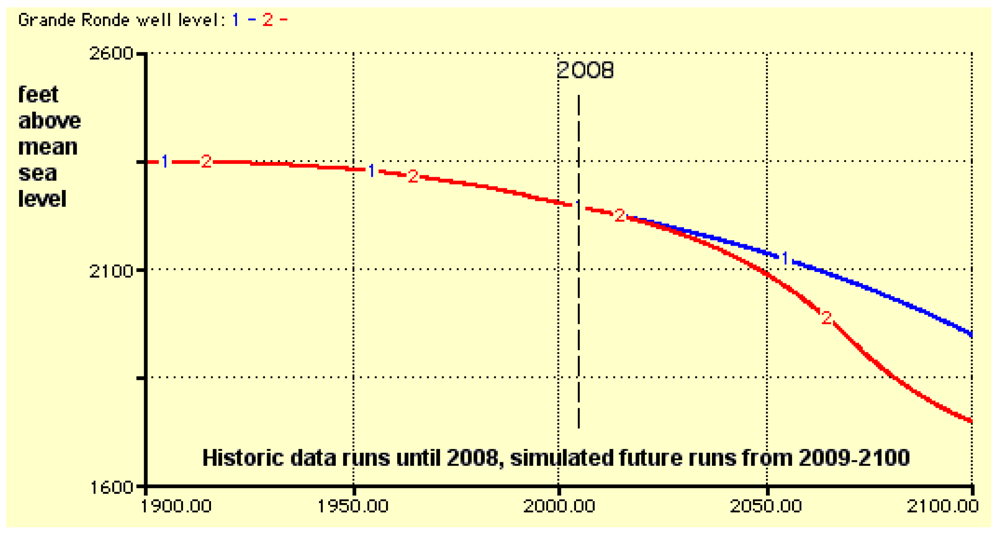
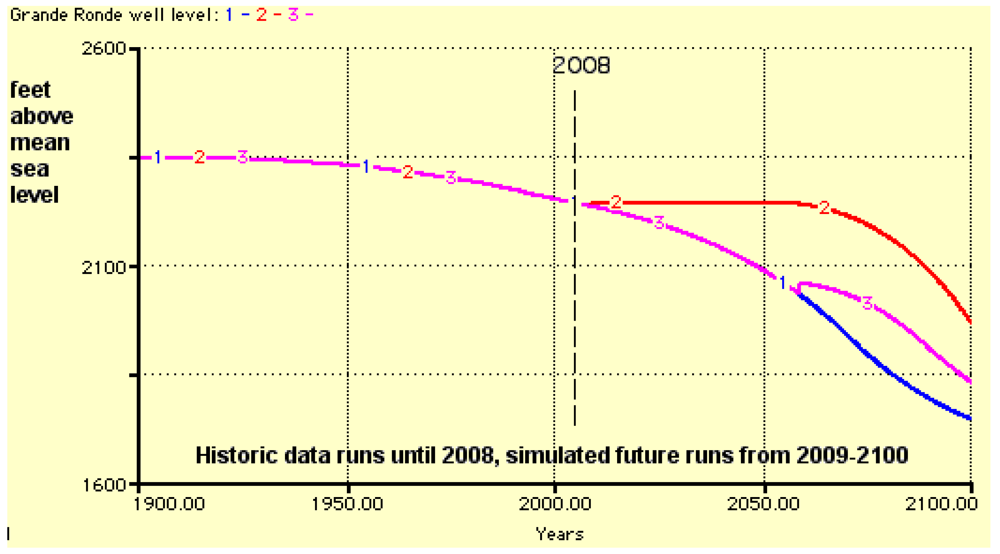
Another ah-ha moment for the group concerned the delay time of adding additional source of water, in this case a surface reservoir. There is a conundrum created by the choice of creating new supply before it is needed and having current users bear the cost or waiting until current supply is stressed and letting the future users pay for the cost of new supply. In the case of this system waiting until the current supply is sufficiently stressed to build additional supply becomes a “no win” situation (Figure 7) because growth has suffïciently depleted the aquifer to the point that the limit of the new, albeit renewable, reservoir supply is immediately reached. Another point of interest in the scenario with the reservoir built right away is that it gives the impression that the area has a sustainable water supply for enough time that people may forget there was, and still is a problem (note supply level from ∼2020–2060 figure 7 line 2).
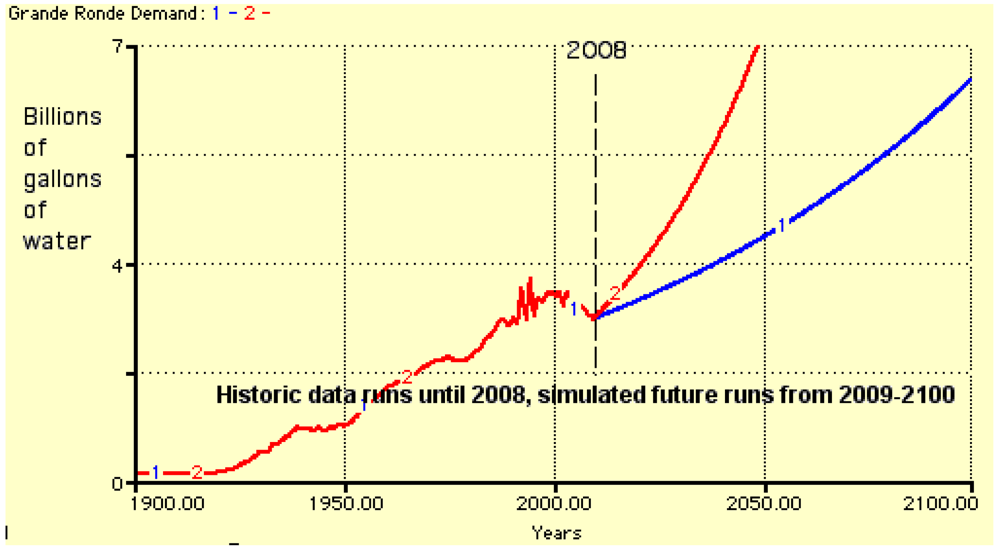
Although perhaps not an ah-ha moment but a warning of a potential for conflict came with the viewing of PBAC's historic pumping record in concert with future demand projections that accommodate growth (Figure 8). As noted earlier the large pumping entities have been able to hold pumping about level from the 1990s with population growth at 1%. The pumping entities have been proactive in engineering and infrastructure measures that have reduced water use but at some point the ability to conserve through engineering efforts will be exhausted and pumping will again follow growth. The potential for the increase in pumping to cause conflict is high if policy makers and the public do not understand why it is taking place. In addition, the differences in perception when viewing what looks like a slowly declining aquifer (business as usual Figure 7) and viewing an increase in demand (business as usual Figure 8) can be striking. When presented with business as usual Figure 7 most participants viewed it as not terribly alarming. When viewing the demand side of the same simulation, however, emotions changed and tension increased. The take away lesson that the manner in which data are presented clearly drives emotion was not lost; moreover it helped some to realize why others get charged up over “the same information”.
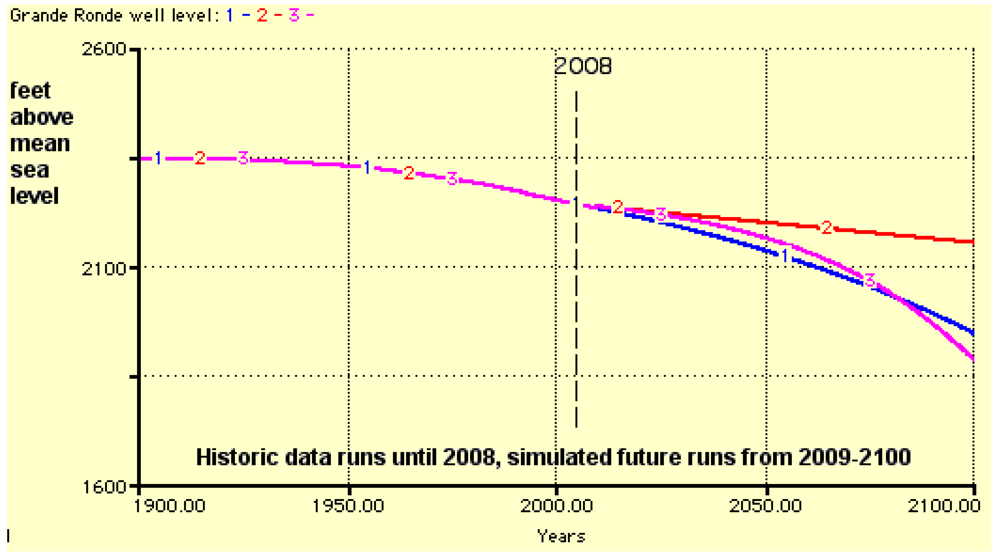
Individual conservation measures can have an impact to offset increase in demand. These measures, however, will require a significant level of education and outreach and willingness of individuals to contribute to area sustainability. Figure 9 shows business as usual and zero growth and high conservation through a 50% reduction in both indoor and outdoor use. This graph points to the fact that curtailment of growth and high conservation can help but in the long term the aquifer will still be depleted. Figure 9, line 3 shows the potential for high conservation to offset 2.5% growth.
The discussion of conservation in of itself has the potential to inspire debate and ah-ha moments for different reasons. Model results indicate that conservation measures can indeed stem increases in demand but also make clear the concept that “we cannot conserve our way out of this problem”. Some residents feel that simply making this statement will discourage conservation, others emphasize that this is, for all practical purposes, a non-renewable resource and that other sources of water eventually will need to be developed. As with the potential development of a reservoir comes the question whether to change behavior and/or incur cost now or to leave that to future generations.
5. Reflection and Insights
Participatory modeling is as much an art as it is a science [8,29,30]. The purpose of environmental participatory modeling projects is to help a group of people better understand and manage the resource of concern while assessing the best available science [8,9]; they facilitate discussion. The idiosyncrasies between projects make it difficult to quantitatively make comparisons or design an assessment that would be useful across projects; furthermore clients may be uninterested in assessments that go beyond their own project. Qualitative measures, however, can indicate success of a project. The success of the Palouse Basin project can be qualified in several ways. Trust in the participatory modeling process itself was reflected by the willingness to move forward from a pilot project. Commitment to the project was indicated by participation; over the course of the two years a core of important stakeholders remained throughout although the participatory group decreased in size. This decrease in participation can be attributed to in part “meeting fatigue” and in part because the initially larger group felt well represented. Participants are providing links to the model on important public websites indicating confidence in the model [31]. Requesting presentations about the model and the process to both policy makers and the public indicate trust in the neutrality of the modeler/facilitators and in project and model transparency.
Researchers used surveys (see appendix) at two of the initial workshops and again at the completion of the project. The surveys indicate that the participants felt this was a good method for providing scientific input to support decisions about water management and that the model is an effective way to convey and explore scientific information. Most participants strongly agreed that the process of building a participatory model was a good method for providing social input into water management decisions and an effective way to communicate personal values. Comments from the survey at the second workshop indicated that the participants felt optimistic about the process in general. Some participants said that they were getting a better understanding of the scientific issues. It was also noted that people were starting to understand that there were diverse perspectives of the system and that “very diverse opinions can work together”. The final survey added a confidence question to which participants agreed that knowing that colleagues and local hydrologic experts were involved in the process increased confidence in the model. A question that addressed using the model or a participatory modeling process with policy makers received mixed responses ranging from “yes” to “this is not the right time”. There was also concern expressed that such a process would end up political and have the potential to be detrimental to relationships that were already fragile. This comment is indicative of the potential for conflict in the basin and of the past heated “skirmishes” that have left some uncomfortable with collaboration. The participation by a technical advisory body (PBAC) was beneficial to helping them get on the same page regarding the degree of uncertainty and the relations between supply and demand. However, lack of participation by decision makers limits both the level of social input to the model and the degree to which it could bring the basin together.
One of the challenges faced by the modeling/facilitation team was that we all live in the Palouse Basin. Maintaining neutrality and transparency in the face of potential conflict over a resource we all use everyday has been vitally important to the project. That said our initial reasons for undertaking this project were twofold. First, we wanted to explore the use of participatory system dynamics as a methodology for system wide, long-term ground water modeling and management. Second, and perhaps more importantly, we wanted to help build relationships in such a way that rather than spending time and effort in future conflict over the resource, members of our community will expend that energy discussing the path to a sustainable future. Although correlations may be difficult to make we have the opportunity to assess the implications of this two year project over the long term. It is still too early to tell if the process or model have had or will have direct impact on decisions. The big questions such as how to manage water across a state line is well beyond the scope of the model. However statements such as we heard after the presentation to policy makers that the model “was neutral” give a hopeful indication that this may be a place for policy makers to begin collaborating. Smaller questions such as how shorter showers could impact long term supply may have a significant impact but we will not be able to measure the influence of the model beyond a small subset of the population. The model has been used by university students, many of whom found their water use analysis “eye opening”. Potential future development of the model, modifications to water management decisions, and a decrease in the potential for future conflict will help us better understand how participatory system dynamics modeling may be used to assist communities with sustainable water resource management.


| Frequently asked questions about water resources in the Palouse Basin |
|---|
|
| Washington | Idaho | ||
|---|---|---|---|
| Agencies/Entities | City of Pullman | Agencies/Entities | City of Moscow |
| WSU | U of I | ||
| Whitman County | Latah County | ||
| Washington Dept of Ecology | Idaho Dept of Water Resources | ||
| Academic experts | WSU | U of I | |
| Citizens | Pullman, WA | Latah Co. Idaho | |
Appendix
Palouse Basin Participatory Model Workshop Survey
The following six questions used a Likert Scale: Strongly disagree, Disagree, Neutral, Agree, Strongly agree.
- 1.
The process of building a participatory model is a good method for providing scientific input into decisions about water management.
- 2.
Final only: The model is an effective way to convey and explore scientific information.
- 3.
The process of building a participatory model is a good method for providing social input into decisions about water management.
- 4.
The process of building a participatory model provides opportunities for participants to communicate constructively about personal values.
- 5.
I felt that my personal values about water resources in Palouse Basin have been reflected in the model.
- 6.
Final survey only: The model could be used to help facilitate dialog among policy makers.
- 7.
Have your perceptions of future water availability in the Palouse basin changed due to this exercise? Likert 0 = no change to 5 = major change
- 8.
Is there anything that the facilitators can do to improve the experience you have had with participatory modeling?
- 9.
Please describe any issues that you feel were not addressed, or not adequately addressed that we should include in a) the model b) at the next workshop.
Final survey only:
- 10.
Did your participation in the workshops and or attendance at presentations about the process and model increase your knowledge and understanding of the state of water resources in the Palouse Basin? If yes, would you please describe what have you learned.
- 11.
Does knowing that your colleagues were involved in the modeling process increase your confidence in the model? Please explain.
- 12.
What could be done to improve the experience you have had with participatory modeling? If you were not directly involved in the process is there something that you would have liked to happen to better inform you about the process and model?
- 13.
Are you interested in exploring what a facilitated model simulation workshop among policy makers could look like? This could give policy makers an opportunity to explore simulated “what ifs” in a situation that would be non political.
Acknowledgments
We would like to thank the Palouse Basin Aquifer Committee and their Citizens Advisory Group for this opportunity. We would also like to thank Steve Robischon, Tom Scallorn, Julie Titone, and Mark Workman, for kindly reviewing this paper.
References
- Palouse Basin Aquifer Committee (PBAC). Available online: http://www.webs.uidaho.edu/pbac/ (accessed on 1 April 2011).
- Robischon, S. Idaho Water Resource Research; Institute University of Idaho: Moscow, ID, USA, Personal Communication; 2011. [Google Scholar]
- Bush, J.H.; Garwood, D.L. Geologic Cross Section of the Moscow-Pullman area Idaho. 2005. Available online: http://www.webs.uidaho.edu/pbac/GeologicMaps/E_W_regional.pdf (accessed on 1 September 2010). [Google Scholar]
- Smoot, J.L.; Ralston, D.R. Hydrogeology and Mathematical Model of Ground Water Flow in the Pullman-Moscow Region, Washington And Idaho; Idaho Water Resources Research Institute: Moscow, ID, USA, 1987; Available through IWRRI contact [email protected]. [Google Scholar]
- USACE Shared Vision Planning. 2009. Available online: http://www.svp.iwr.usace.army.mil/ (accessed on 1 March 2010).
- Van den Belt, M. Mediated Modeling: A System Dynamics Approach to Environmental Consensus Building; Island Press: Washington, DC, USA, 2004. [Google Scholar]
- Langsdale, S.; Beall, A.; Bourget, L.; Hagen, E.; Kudlas, S.; Palmer, R.; Tate, D.; Werrick, B. Collaborative Modeling for Decision Support in Water Resources: Principles and Best Practices. 2011. Available online: http://www.computeraideddisputeresolution.us/bestpractices/index.cfm (accessed on 1 March 2011). [Google Scholar]
- Beall, A.; Ford, A. Reports from the Field: Assessing the art and science of participatory environmental modeling. Int. J. Sys. Soc. Change 2010, 1, 72–89. [Google Scholar]
- Stave, K. 2010 Participatory System Dynamics Modeling for Sustainable Environmental Management: Observations from Four Cases. Sustainability 2010, 2, 2762–2784. [Google Scholar]
- Forrester, J. Industrial Dynamics; Pegasus Communications: Waltham, MA, USA, 1961. [Google Scholar]
- Meadows, D.; Meadows, D.; Randers, J.; Behrens, W. The Limits to Growth; Universe Books: New York, NY, USA, 1972. [Google Scholar]
- Ford, A. Modeling the Environment, 2nd ed.; Island Press: Washington, DC, USA, 2009. [Google Scholar]
- Sterman, J.D. Learning in and about complex systems. Sys. Dyn. Rev. 1994, 10, 291–330. [Google Scholar]
- McDonald, M.G.; Harbaugh, A.W. A Modular Three-Dimensional Finite-Difference Ground-Water Flow Model, Open-File Report 83-875; U.S. Geological Survey. 1984. Available online: http://pubs.er.usgs.gov/usgspubs/ofr/ofr83875 (accessed on 1 January 2011).
- Zagona, E.A.; Fulp, T.J.; Shane, R.; Magee, T.; Goranflo, H.M. RiverWare: A Generalized Tool for Complex Reservoir Systems Modeling. J. Am. Water Resour. Ass. 2001, 37, 913–929. [Google Scholar]
- Winz, I.; Brierley, G.; Trowsdale, S. The use of system dynamics simulation in water resources management. Water Resour. Manag. 2009, 23, 1301–1323. [Google Scholar]
- Tidwell, V.D.; Passell, H.D.; Conrad, S.H.; Thomas, R.P. System dynamics modeling for community-based water planning: Application to the Middle Rio Grande. Aq. Sci. 2004, 66, 357–372. [Google Scholar]
- Stave, K.A. System dynamics model to facilitate public understanding of water management options in Las Vegas, Nevada. J. Env. Manag. 2003, 67, 303–331. [Google Scholar]
- Saysel, A.K.; Barlas, Y.; Yenigün, O. Environmental sustainability in an agricultural development project: a system dynamics approach. J. Env. Manag. 2002, 64, 247–260. [Google Scholar]
- Videira, N.; Antunes, P.; Santos, R. Scoping river basin management issues with participatory modelling: the Baixo Guadiana experience. Ecol. Econ. 2009, 68, 965–978. [Google Scholar]
- Langsdale, S.; Beall, A.; Carmichael, J.; Cohen, S.; Forster, C. An exploration of water resources futures under climate change using system dynamics modeling. Integrat. Ass. 2007, 7, 51–79. [Google Scholar]
- Langsdale, S.; Beall, A.; Carmichael, J.; Cohen, S.; Forster, C.; Neale, T. Shared Learning Through Group Model Building. Participatory Integrated Assessment of Water Management and Climate Change in the Okanagan Basin, British Columbia; Cohen, S., Neale, T., Eds.; Environment Canada and University of British Columbia: Vancouver, Canada Chapter 4. , 2006. Available online: http://waterwiki.net/index.php/Participatory_Integrated_Assessment_of_Water_Management_and_Climate_Change_in_the_Okanagan_Basin,_British_Columbia (accessed on 1 September 2010). [Google Scholar]
- Langsdale, S.; Beall, A.; Carmichael, J.; Cohen, S.; Forster, C.; Neale, T. Exploring the implications of climate change on water resources through participatory modeling: Case study of the Okanagan basin, British Columbia. J. Water Res. Pl-ASCE 2009, 135, 373–381. [Google Scholar]
- Forrester, J. Obvious Truths. Sys. Dyn. Rev. 1987, 3, 156–159. [Google Scholar]
- Fiedler, F.; Beall, A. Dual Storativity Parameterization of a Systems Dynamics Model for Basalt Aquifer Interdecadal Management; Unpublished work; 2011. [Google Scholar]
- Forio Business Simulations. Available online: http://forio.com/ (accessed on 1 April 2011).
- isee Systems. Available online: http://www.iseesystems.com/softwares/Education/StellaSoftware.aspx (accessed on 1 April 2011).
- Singhal, B.B.S.; Gupta, R.P. Applied Hydrogeology of Fractured Rocks; Kluwer Academic Publishers: Dordrecht, The Netherlands, 1999. [Google Scholar]
- Andersen, D.F.; Richardson, G.P.; Vennix, J.A.M. Group model building: Adding more science to the craft. Sys. Dyn. Rev. 1997, 13, 187–201. [Google Scholar]
- Vennix, J.A.M. Group Model Building. Facilitating Team Learning using System Dynamics; John Wiley and Sons: New York, NY, USA, 1996. [Google Scholar]
- Palouse Basin Water Resource Visioning Tool. Available online: http://www.webs.uidaho.edu/pbac/ (accessed on 1 April 2011).
© 2011 by the authors; licensee MDPI, Basel, Switzerland. This article is an open access article distributed under the terms and conditions of the Creative Commons Attribution license (http://creativecommons.org/licenses/by/3.0/).
Share and Cite
Beall, A.; Fiedler, F.; Boll, J.; Cosens, B. Sustainable Water Resource Management and Participatory System Dynamics. Case Study: Developing the Palouse Basin Participatory Model. Sustainability 2011, 3, 720-742. https://doi.org/10.3390/su3050720
Beall A, Fiedler F, Boll J, Cosens B. Sustainable Water Resource Management and Participatory System Dynamics. Case Study: Developing the Palouse Basin Participatory Model. Sustainability. 2011; 3(5):720-742. https://doi.org/10.3390/su3050720
Chicago/Turabian StyleBeall, Allyson, Fritz Fiedler, Jan Boll, and Barbara Cosens. 2011. "Sustainable Water Resource Management and Participatory System Dynamics. Case Study: Developing the Palouse Basin Participatory Model" Sustainability 3, no. 5: 720-742. https://doi.org/10.3390/su3050720