Optimizing Nitrogen Options for Improving Nitrogen Use Efficiency of Rice under Different Water Regimes
by
 , ,
, ,
Fazli Hameed
1 ,
,
Junzeng Xu
1,2,*,
Shah Fahad Rahim
1,
Qi Wei
2,
Anis ur Rehman Khalil
1 and
Qi Liao
2 1
College of Agricultural Engineering, Hohai University, Nanjing 210098, China
2
State Key laboratory of Hydrology-Water Resources and Hydraulic Engineering, Hohai University, Nanjing 210098, China
*
Author to whom correspondence should be addressed.
Agronomy 2019, 9(1), 39; https://doi.org/10.3390/agronomy9010039
Submission received: 27 December 2018
/
Revised: 15 January 2019
/
Accepted: 18 January 2019
/
Published: 21 January 2019
(This article belongs to the Section Soil and Plant Nutrition)
Abstract
:Major challenge in rice production is to achieve the goal of enhancing both food production and fertilizer use efficiency. Rice growth simulation model, ORYZA (v3) was used in the present study to evaluate the model under continuous flooded (CF) and alternate wetting and drying (AWD) regimes with different fertilizer nitrogen (N) rates with different N splits using a historical data of past 45 years. The model satisfactorily simulated crop biomass and nitrogen uptake at both irrigation regimes and fertilizers N rates and splits. The yield differences among the years were large due to climate change, but enhanced by N rates. The response of N curves was different at both water regimes. At 0 N rate, the slope for agronomic efficiency (AE) was high which tends to decrease with increase in N rates. With the one split basal application of N, lowest yield was found with high physiological efficiencies (PE), lowest fertilizer recoveries (RE) and lowest agronomic efficiency (AE). For both water applications and fertilizer levels, high yield with high nitrogen uptake, AE, RE and partial factor productivity (PFP) were witnessed high at four split (3:3:3:1), while having low physiological efficiency. The water productivity (irrigation + rainfall) WPI+R at basal in one N split for AWD at 150 kg N ha−1 was 1.19 kg m−3 and for CF was 0.82 kg m−3, whereas for 225 kg N ha−1 WPI+R of AWD was 1.50 kg m−3 and 1.14 kg m−3 for CF. In general, AWD exhibited high WPI+R with no rice yield penalty compared to CF. Splitting with the proper amount of fertilizer N resulted in good water productivity and nitrogen efficiencies, could lead to high rice yield.
1. Introduction
Rice (Oryza sativa L.) serves as a key nutritional crop and tends to feed almost worlds half population [1]. In the following three decades, overall worldwide utilization of rice is expected by another 116 million tons increase [2]. In China rice is considered the most vital food crop, nearly 30 million hectares of area is being occupied by rice [3]. In order to face the increasing demand for food and to fulfill the needs of a growing population, the production of rice must be enhanced up to 70% by 2050 [4]. Due to environmental deprivation and the lack of labors, the productivity of transplanted rice became susceptible [5,6]. To achieve the potential of high rice cultivar yields, advancement in crop management strategies are essential, which is independent of immense agronomic inputs.
To achieve potential rice yields, modern cultivars of rice require a large number of fertilizers. Among all fertilizers, nitrogen (N) is the most essential for plant development, growth and grain quality [7,8]. However, in developed economies, N use efficiency (NUE; defined as grain dry matter per unit of N available from the soil, fertilizer included), is very low and estimated to be approximately 33% of the applied N source [9]. Thus, in Asia, Europe, and Northern America, intensive agricultural practices [10] have led to both higher production costs and greater risk from environmental hazards, such as ground and surface water pollution by nitrate leaching [11,12,13]. The main challenge for breeders is to minimize the applied amount of fertilizer N to the field without affecting yield, and also in selecting the cultivars that metabolize N more effectively. The average fertilizer N dose in China is roughly 180 kg ha−1 for the production of rice, which is 75% higher than the worldwide average [14]. Furthermore, application of around 300 kg N ha−1 is also practicing in different regions of China [15,16]. Also, over-utilization of N regularly initiates pest destruction and lodging, bringing a decrease in quality and quantity of rice yield [17,18]. Excessive use of N may induce the acidity of the soil [19], water contamination [20] and encourage nitrous oxide (N2O) emission [21].
Because of the significance of nitrogen as a major nutrient for rice crop to attain high grain yield, it is crucial to determine the ideal amount and timing of N application for each rice cultivars and also the impact on agronomic parameters, for example, moisture content, plant height, lodging and other parameters [22]. Therefore, many researchers have identified different fertilization scheduling techniques to achieve the maximum N use efficiency in rice fields [23]. Subsequently, nearly each farmer supply N to get high yields [15] in one single split or up to four splits during crop growth critical stages neglecting crop N demand and temporal changes [24]. Furthermore, a basal dose application of N on transplantation day or day before transplantation has been followed [24]. The N loss likely to be at the basal application as rice take 7 days in recovering from transplanting shock and after developing root, rice N requirement is minimized during that period [25,26]. However, fertilizer application can increase the rice yield matching the indigenous N supply [24]. N splits with basal at panicle initiation irrespective of N rates can increase yield [27,28]. A study has been conducted by Prasad et al. (2018), revealed that four split (basal, tillering, panicle initiation and heading) limited the nitrate (NO3) leaching loss from rice fields [29]. The adjusted splits could result in a reduction of fertilizer N input [30], splitting N can increase spikelet’s per panicle, 1000 grain weight, ripened grain percentage and N uptake [31]. However, an increasing trend has been shown in N application doses in rice fields of China [32].
Water is crucial for the development and growth of rice crops. Though, the consequence of continuous flooding is a substantial amount of inefficient water losses by evaporation, percolation, and seepage [33,34]. Comparatively the production of rice in Asia is about 90%, nearly 80% of fresh water resources around the world is being consumed by irrigated water [35,36]. Because of climate change and rapid urbanization and industrialization, water for agricultural utilization turns out to be progressively scarce [37,38]. About 15 ± 20 million hectares area of irrigated rice in Asia will endure water shortage by the end of 2025 [39]. To handle the increasing demand for food for the rising population agriculturists are confronting a challenge to deliver more per unit area rice with constrained limit water amount. To maintain the food demand this is very crucial for the security of food, especially in dense populous countries like Asian countries, which are mainly depended on subsistence agriculture [40].
Simulation models for crop growth are valuable tools which give the chance to investigate the field data and inspecting the impacts of various crop management practices crosswise over various environment and seasons [41]. The form of any irrigation water [42] and N application [43] can be determined by modeling studies. There have been many studies conducting on different management strategies using different models ORYZA [35], CropSyst [44], DSSAT [45], Infocrop [46], and APSIM-ORYZA [47]. These models have been used for different scenario analysis, like climate change scenarios [48,49], nitrogen management [47,50,51], water management [52,53,54], plant densities [55,56], sowing time [57], splits fertilizers [24,58] and irrigation scheduling [42,59,60]. Hence no study has used a detailed analysis for split doses of N fertilizer with the interaction of different irrigation condition in a rice field.
ORYZA (v3) is the advance release of ORYZA 2000 [61]. Many studies have been conducted using ORYZA model having different rice varieties under different N management, irrigation management, fertilizer splits, seedling age, plant density in the Philippines [62], China [24,26,63], India [42], Indonesia [64] or Iran [41]. However, most of the researchers have conducted the research of fertilizer N application with flooded water condition, but there was no specific study of fertilizer N dosages with N splits under alternate wetting and drying (AWD) condition by using ORYZA model. In the present study, we simulated the combined effect of N fertilizer rates with N splits, water regimes and their interaction in ORYZA (v3). The objectives of the study were: (1) To calibrate and validate ORYZA (v3) model for the different amount of N with water regimes. (2) Simulation of ORYZA (v3) model to identify optimum N rates with different N splits and water regimes and also their response to rice yield.
2. Materials and Methods
2.1. Experiment
Experiment with summer rice was carried out in 2007–2008 at Kunshan, irrigation and drainage experiment station. The experimental site is situated between at 31°15′15″ N and 120°57′43″ E in eastern China, having subtropical monsoon climate. The annual average temperature is 17.5 °C with an annual mean precipitation of 1397.1 mm. This study area has dark-yellow hydromorphic paddy soil and clay in texture (Table 1). Japonica Jia 04-33 rice variety, was transplanted to the fields on 27 June 2007 and 28 June 2008 and harvested on 27 October 2007 and 25 October 2008.
Experimental fields were assigned different levels of nitrogen and two types of irrigation flooded irrigation (FI) and deficit irrigation (DI), when the soil moisture reached to the lower irrigation threshold as measured by time-domain reflectometry (TDR, Soil moisture, Mitchell Instrument Company, Vista, CA, USA), DI paddies was irrigated to saturate the soil. The detailed explanation about DI irrigation regarding water content and root zone is provided in reference [65]. Similarly, irrigation volume for each plot was measured by water gauge mounted at the water supply pipes. Data on plant height and tiller dynamics have been recorded after every five days. Leaf area was calculated from selected three random plants while from roots, panicles, leaves and stem with sheaths was measured for biomass accumulation. CI 203 (CID INC, Camas, WA, USA) leaf area meter was used to measure individual leaf area, and summed for the leaf area index and the total leaf area. Samples of different organs (leaves, stems, and panicles) of rice plants were processed by H2SO4-H2O2 to measure their total nitrogen contents by indophenol blue spectrophotometric method [65]. Yield data was taken from each plot at harvesting. An automated weather station (WS-STD1, DELTA-T, Burwell, Cambridge, UK) was installed at the experimental site to record daily data on relative humidity (RH), air temperature (Ta), sunshine hours (n), atmospheric pressure (Pa), precipitation (Pr) and wind speed (V) every 30 min.
2.2. Model Description, Calibration, and Validation
2.2.1. The ORYZA (V3) Model
ORYZA (v3) is the most updated version of Oryza2000 model and was released in 2013 by international rice research institute (IRRI) Philippines. The model simulates a one-day time step, development, water balance and the growth of lowland rice for both limited and potential production scenarios of water and nitrogen. The model assumes that the crop doesn’t undergo any other yield reduction stresses. For an explanation of the crop model see Reference [43]. The model summary description is given below.
The model simulates different daily dry matter (DM) growth and rate of phonological development of different plant organs. Leaf area grows exponentially as a function of thermal time at the relative leaf growth rate when the canopy has not yet closed. Then, leaf area grows linearly and is calculated from the increase in leaf weight times a specific leaf area. By assimilating these rates over time, developmental stages and dry matter production are simulated throughout the growing season. The daily income canopy CO2 uptake is derived from the daily leaf area index, temperature, and radiation. The accumulated daily dry matter is obtained after subtracting respiration and maintenance requirements. The dry matter which is produced is then divided among stem leaves panicles using derived factors. The spikelet’s number to first flowering period is calculated from total crop growth over panicle initiation. The spikelet’s number at flowering at initial panicle to flowering is calculated from the growth of total crop [24].
The N potential daily demand is derived from the difference between N concentrations of each plant organ, growth rate, and dry weight. Vegetative organs are satisfied by getting their N from soil N uptake and panicles are satisfied with N getting their N uptake from leaves and stems after flowering stage by translocation. The availability of soil N is modeled from simulated with applied N, soil N and, deprived of simulating any N modification processes in soil.
The dynamics of water in the ORYZA (v3) model is estimated in three types of soil by water balance [42]. Which are poorly lowland drained soil, well-drained upland, and regular upland. Furthermore, percolation and evapotranspiration losses accounted for the water gains by irrigation or precipitation. Plant transpiration and soil evaporation on daily basis are combined from pond water layer, afterward from top soil layer and all root layers [35]. The water balance of lowland rice in ORYZA model includes:
where dW is stored water change in, I is irrigation supply, R is rainfall, C is a capillary rise, E is evaporation, T is transpiration, S is seepage, P is percolation, and D is surface drainage/runoff (all units are mm day−1) [35].
2.2.2. Parameterization
The ORYZA (v3) model was parameterized following Bouman and Van Laar [43]. For calibration and evaluation, experimental data of 2007 was calibrated and evaluated with experimental data of 2008. Data of various plant traits, soil properties, cultivation practices, nitrogen contents in different crop organs and weather data (daily basis) were used as subjected input data to in ORYZA (v3) model. The model output is comprised of partitioning total biomass into various components; leaf area index; yield; nitrogen content in leaf, stem, and panicle. Developmental rates and dry biomass partitioning were calculated using DRATES and PARAM of ORYZA (v3) model. The calibrated parameters were: Developmental rates (DVR), partitioning factors of leaf (FLV), partitioning factors of stem (FST), partitioning factors of storage organ/panicle (FSO), partitioning factors of death rate of leaf (DRLV) and partitioning factors of stem reserves fraction (FSTR). Calibrated parameters for nitrogen uptake related were: Residual N concentration in leaves (RFNLV) and residual N concentration in stems (RFNST), storage organ/panicle N maximum concentration (NMAXSO) and storage organ/panicle N minimum concentration (NMINSO). The calibrated values were additionally fine-tuned manually (refining the parameters values until simulated values best match with observed values). It’s worth mentioning that this calibration of model parameters based on field experimental data is very crucial. Because some crop parameters are accommodative standard (likewise IR72) and can be used for all varieties whereas, some parameters are variety and environment specific. The detailed explanation about calibration is provided in reference [43]. The model was calibrated and validated for parameters, including weight of above ground biomass (WAGT), weight of storage organ/panicle (WSO), weight of stem (WST), weight of green leaves (WLVG), amount of nitrogen in leaf (ANLV), amount of nitrogen in stem (ANST) and amount of nitrogen in storage organ/panicle (ANSO). Moreover, the coefficient of determination (R2) and normalized root mean square error (RMSEn) was used to evaluate the uniformity between observed and simulated values [66].
where Xi is the observed value and Yi the corresponding simulated value, N is the number of values.
2.3. Scenario Analysis
Different scenario analysis was carried out to evaluate different water and nitrogen inputs for yield and nitrogen uptake. In simulation set 1 historical data from 1961 to 2005 was run to observe the yield and nitrogen uptake along with different years. The water management scenarios were continuous flooded (CF) and alternate wetting and drying (AWD) with 70 kpa threshold soil water potentials. For AWD regime, about 30 mm of irrigated water was applied to the field after reaching the soil water potential threshold. The AWD management regime was executed after 8 days of transplanting. Different nitrogen rates (0, 50, 75, 100, 125, 150, 175, 200, 225, 250, 275, 300 kg ha−1) were used under CF and AWD conditions. For simulation set 2 different splits ratios (5:5, 6:4, 7:3, 6:2:2, 5:3:2, 4:4:2, 5:2:2:1, 3:3:3:1, 4:3:2:1) were used. N fertilizer ha−1 were applied at transplanting and tillering, for 3 doses N fertilizer ha−1 used at transplanting, tillering and panicle initiation while for 4 doses N fertilizer ha−1 used at transplanting, tillering, panicle initiation and booting stage.
The output of the model was utilized to investigate N number use efficiencies i.e., partial factor productivity (PFP), fertilizer N recovery (RE), Agronomic efficiency (AE) and physiological efficiency (PE), [24]:
where Yo is the yield (kg ha−1) without fertilizer N input, Nr is the N rate (kg ha−1) applied, ∆Y is the incremental increase in yield (kg ha−1) resulting from N application, ∆Np is the increase in crop N accumulation (kg ha−1) resulting from N application.
Water productivity for the simulation of the model was calculated as the ratio of grain yield to the total supplied water [67].
3. Results
3.1. Model Calibration and Validation
3.1.1. Biomass Attributes and Leaf Area Index
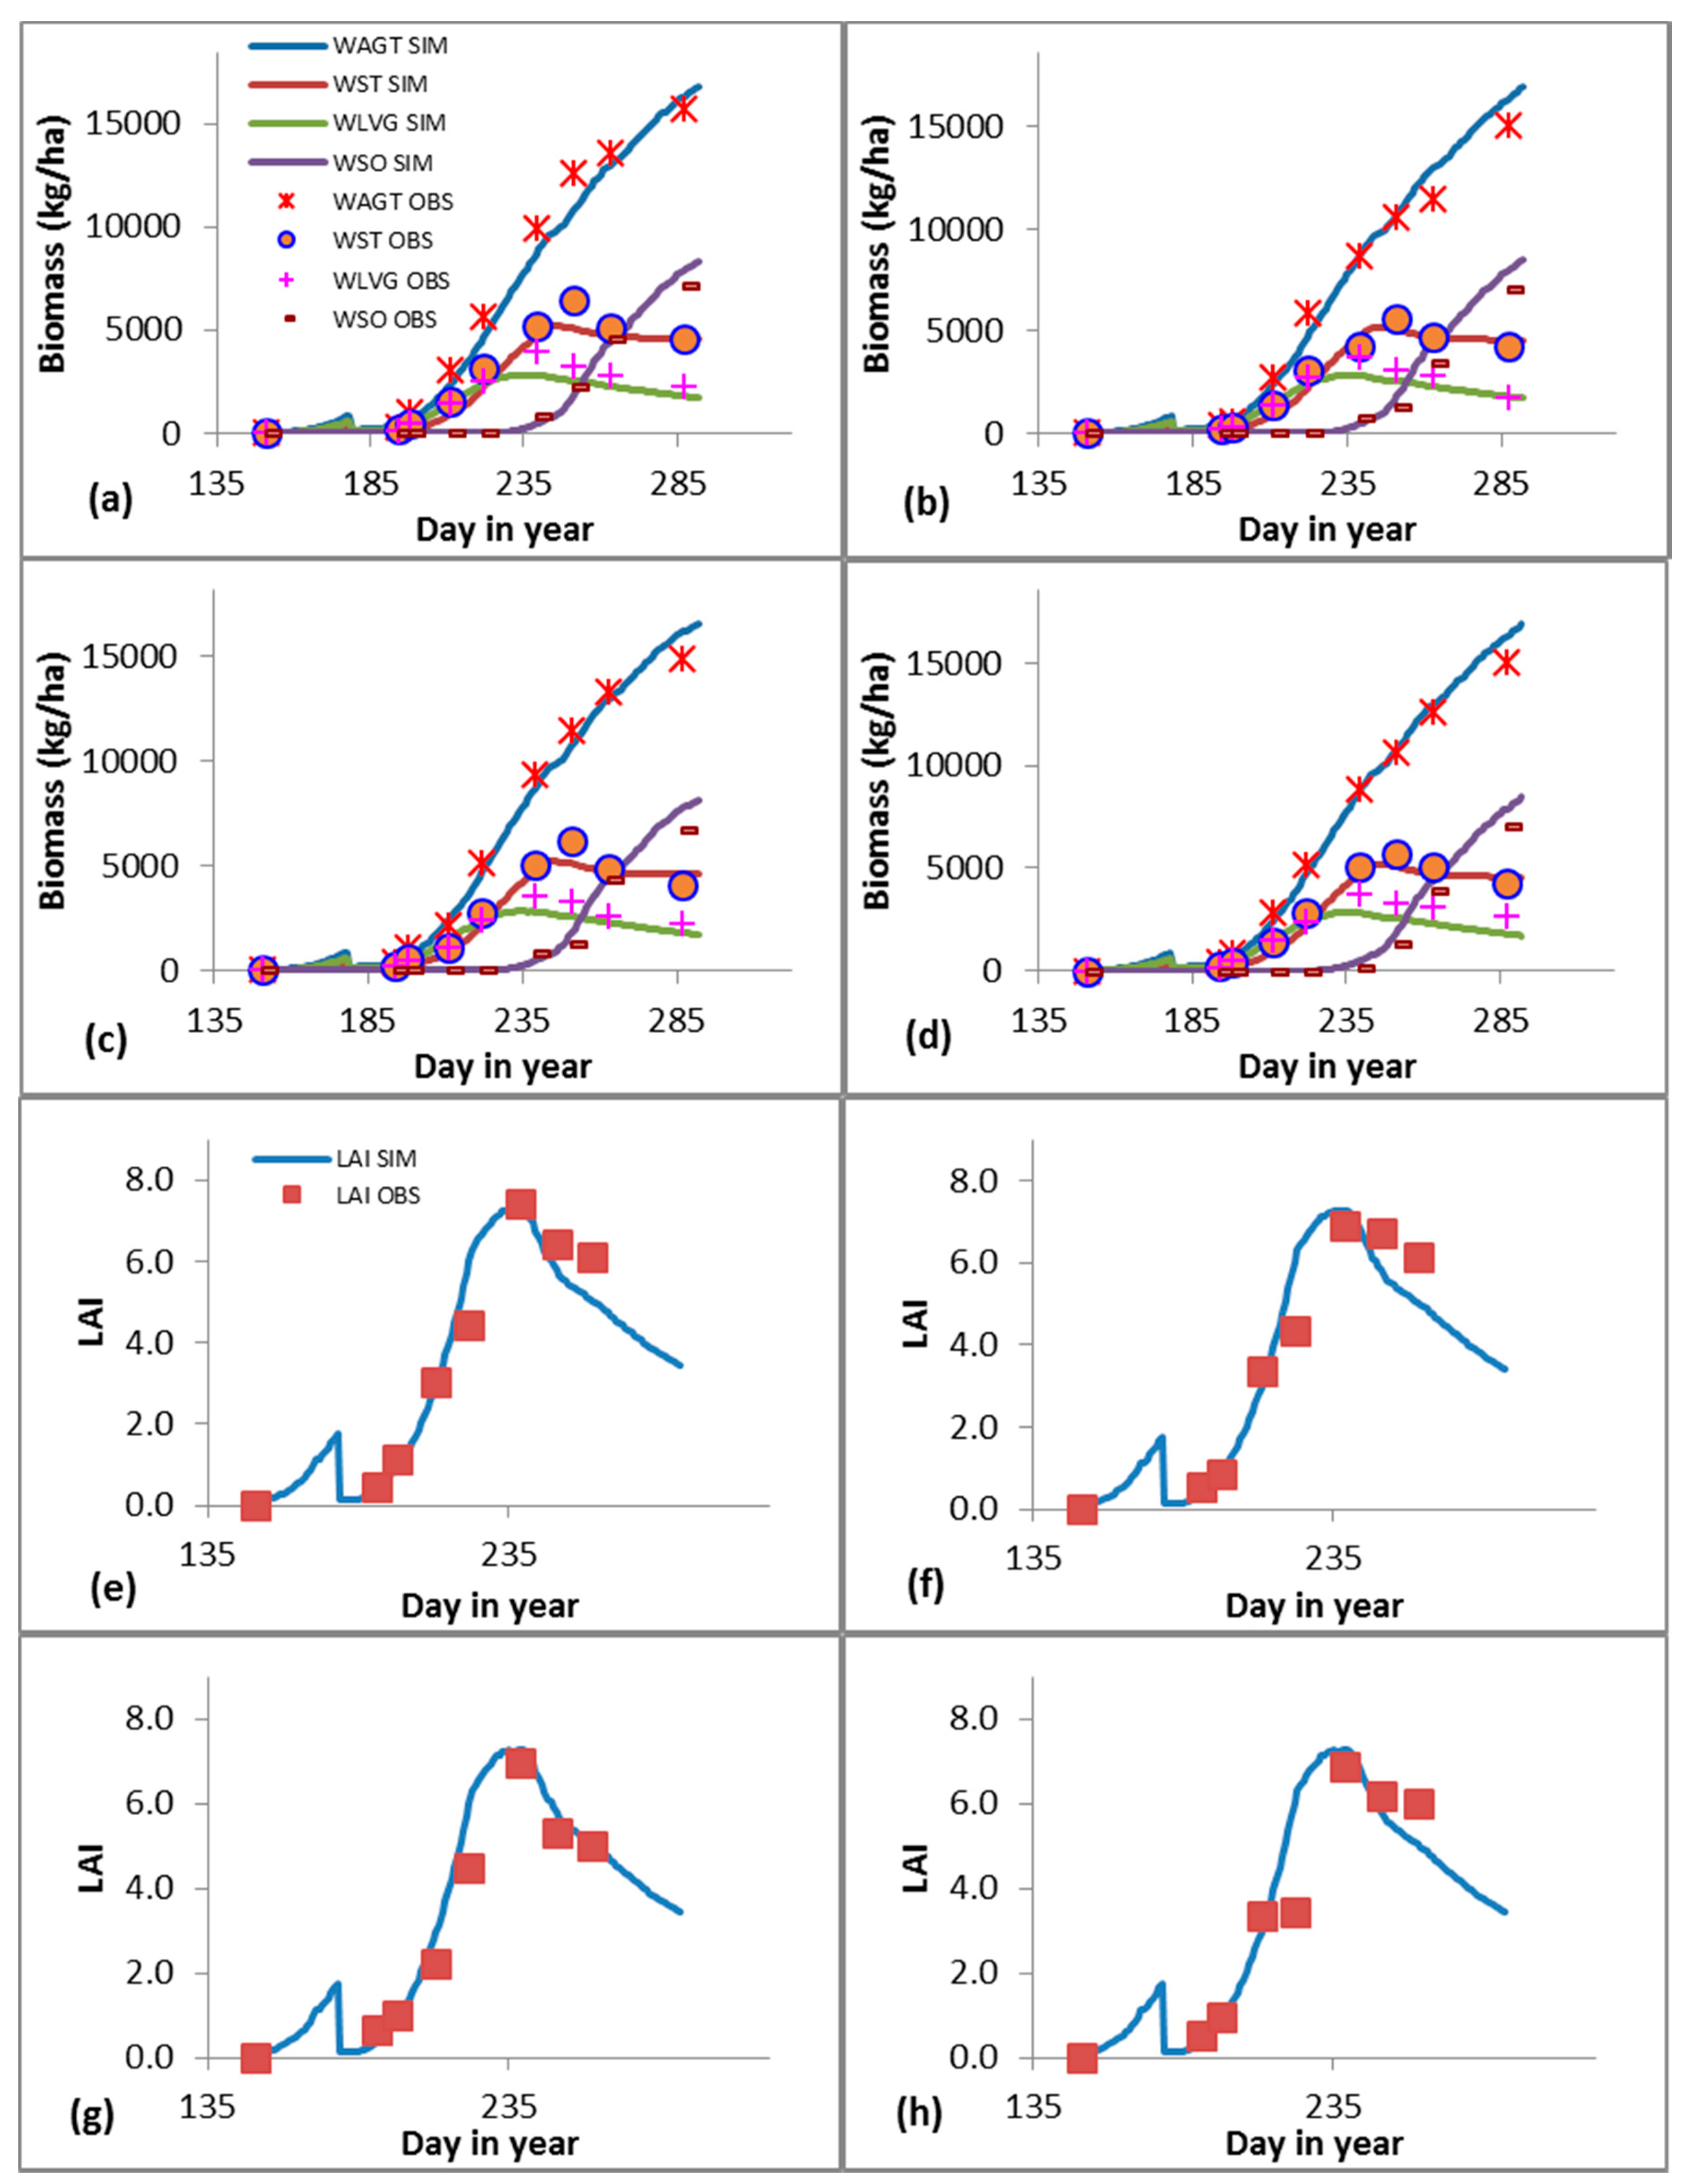
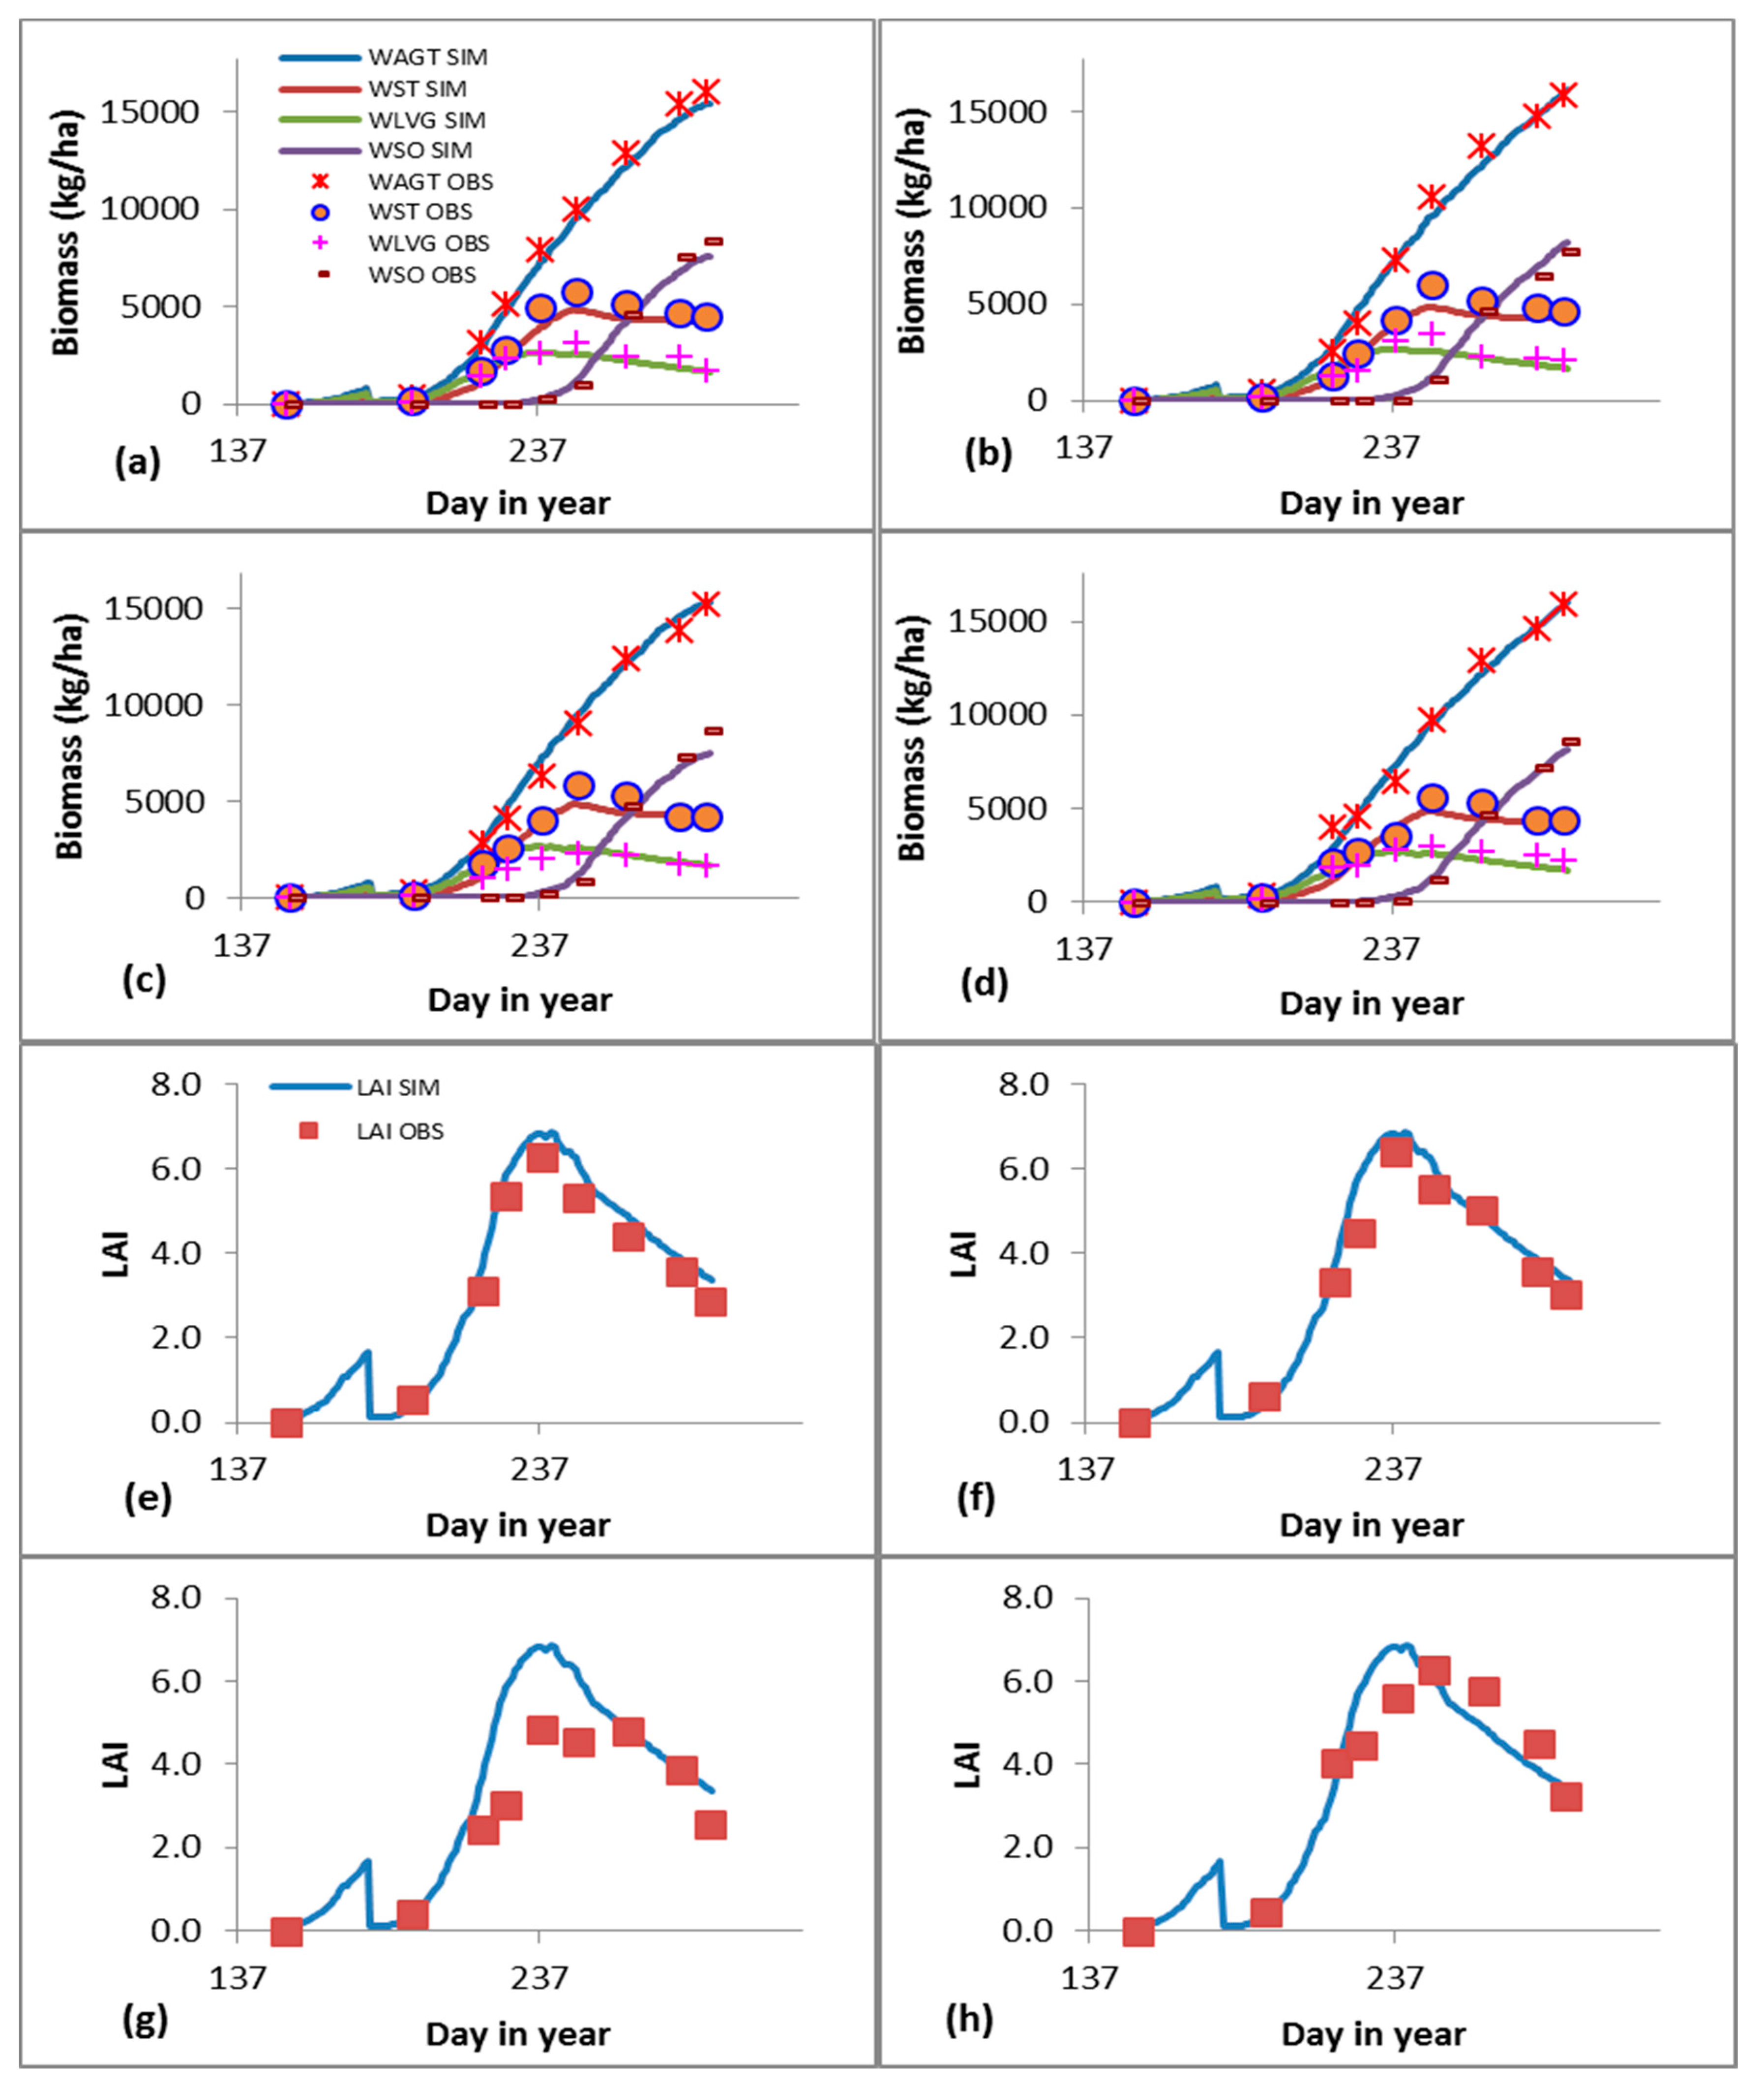
Evaluation of observed and simulated crop biomass attributes are presented in Figure 1 for calibration and in Figure 2 for validation data sets. The observed data fell close or on the simulated lines in biomass attributes and leaf area index (LAI) for both calibration and validation period (Figure 1 and Figure 2). The results for a total above ground biomass represented an adequate agreement between observed (Table S1) and simulated (Table S2) data sets. The total above ground biomass R2 and RMSEn noted for calibrated data set was 0.98 and 10.40% and for validated data set was 0.99 and 6.60%. Panicle biomass displayed a high correlation between measured and simulated data having R2 and RMSEn for calibration was 0.98 and 18.0%, and for validation was 0.99 and 11.89%. Similarly, model exhibited a good relation between observed and simulated data for LAI. The observed R2 was 0.88 and 0.84 and RMSEn was 21.68% and 23.41% for calibration (Table S1) and validation (Table S2) of LAI, respectively. Overall, in between observed and simulated dry whole crop and dry weight organs presented a satisfactory agreement. The dynamic crop variables for goodness-of-fit parameters displayed in Tables S1 and S2. In both data sets the Student’s test displays that all observed values were identical to simulated values with 95% confidence (Tables S1 and S2).
3.1.2. Crop N-Uptake Attributes
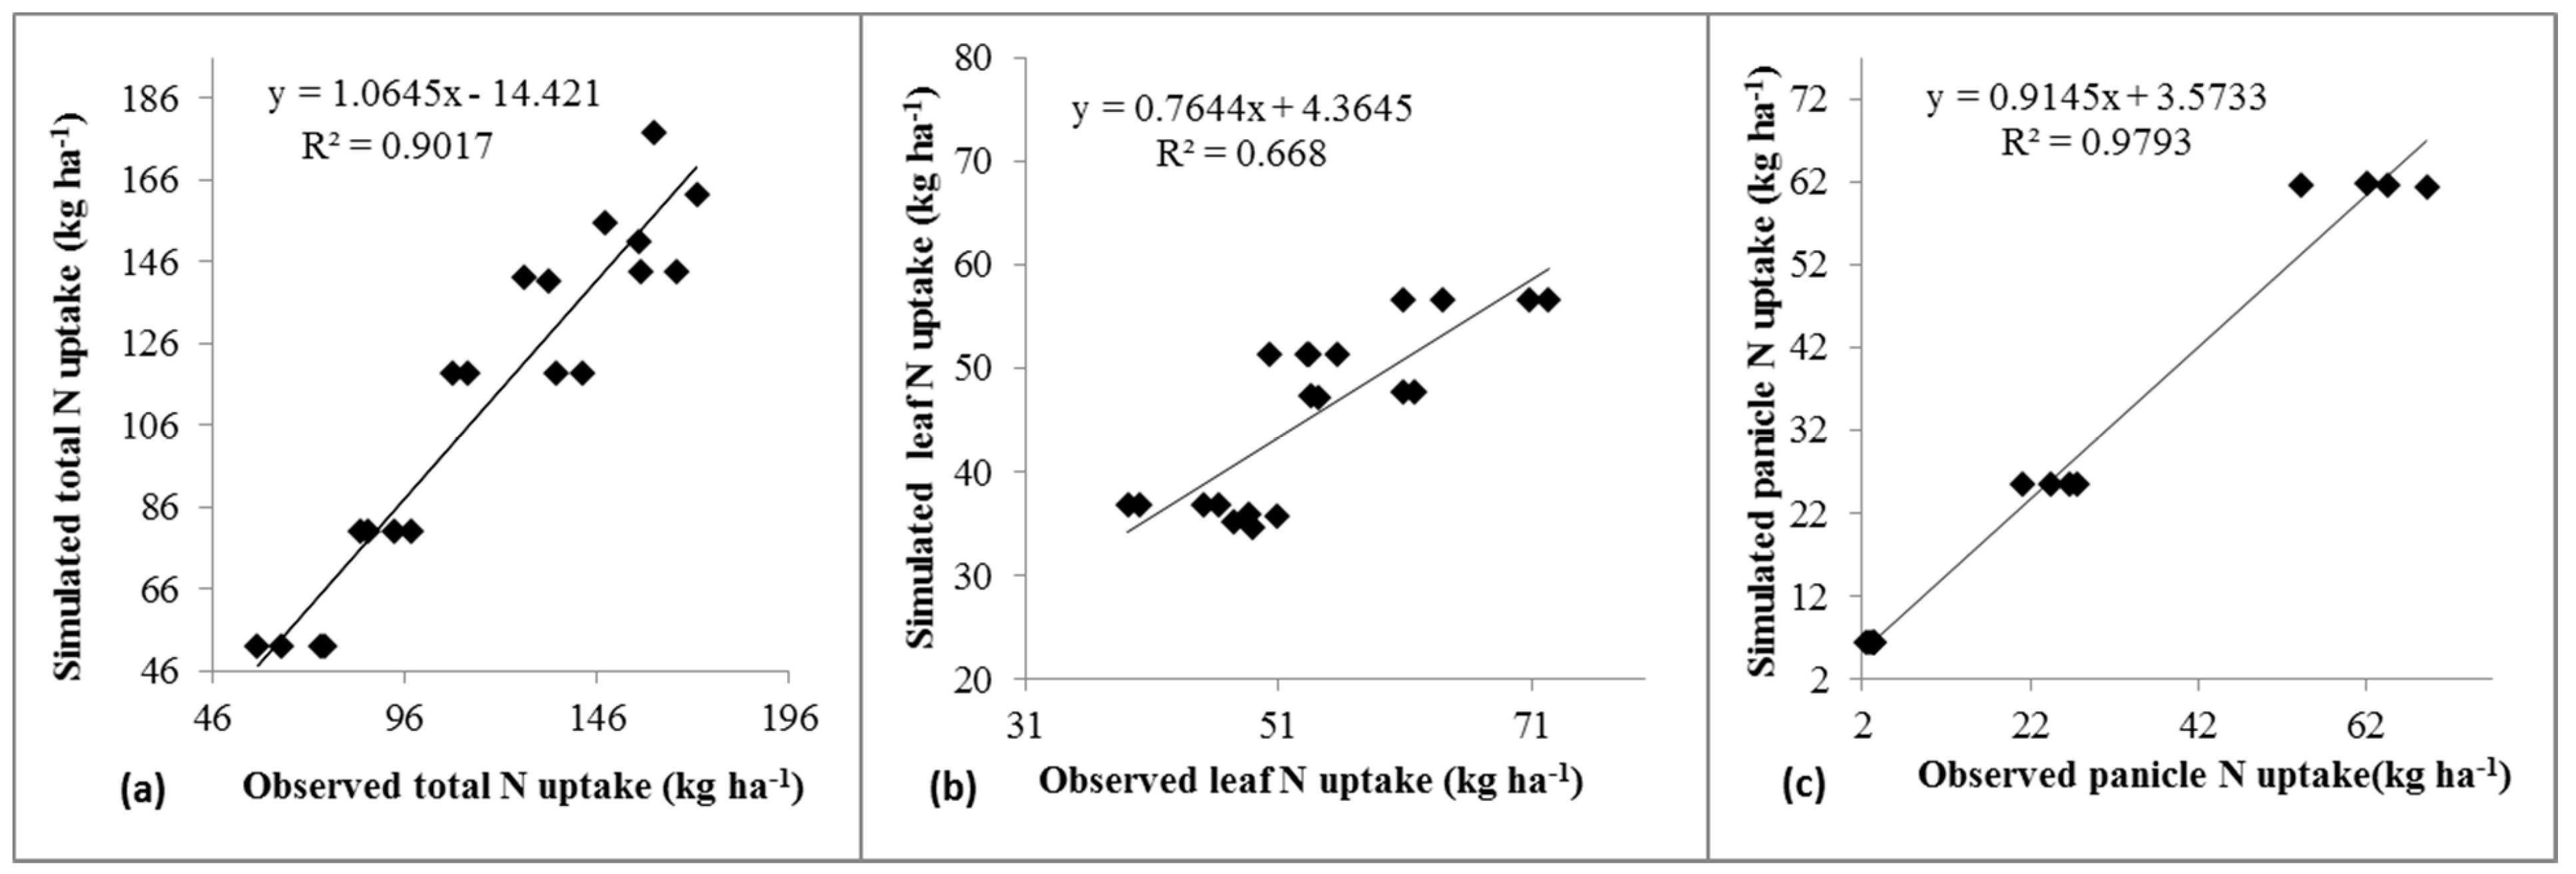
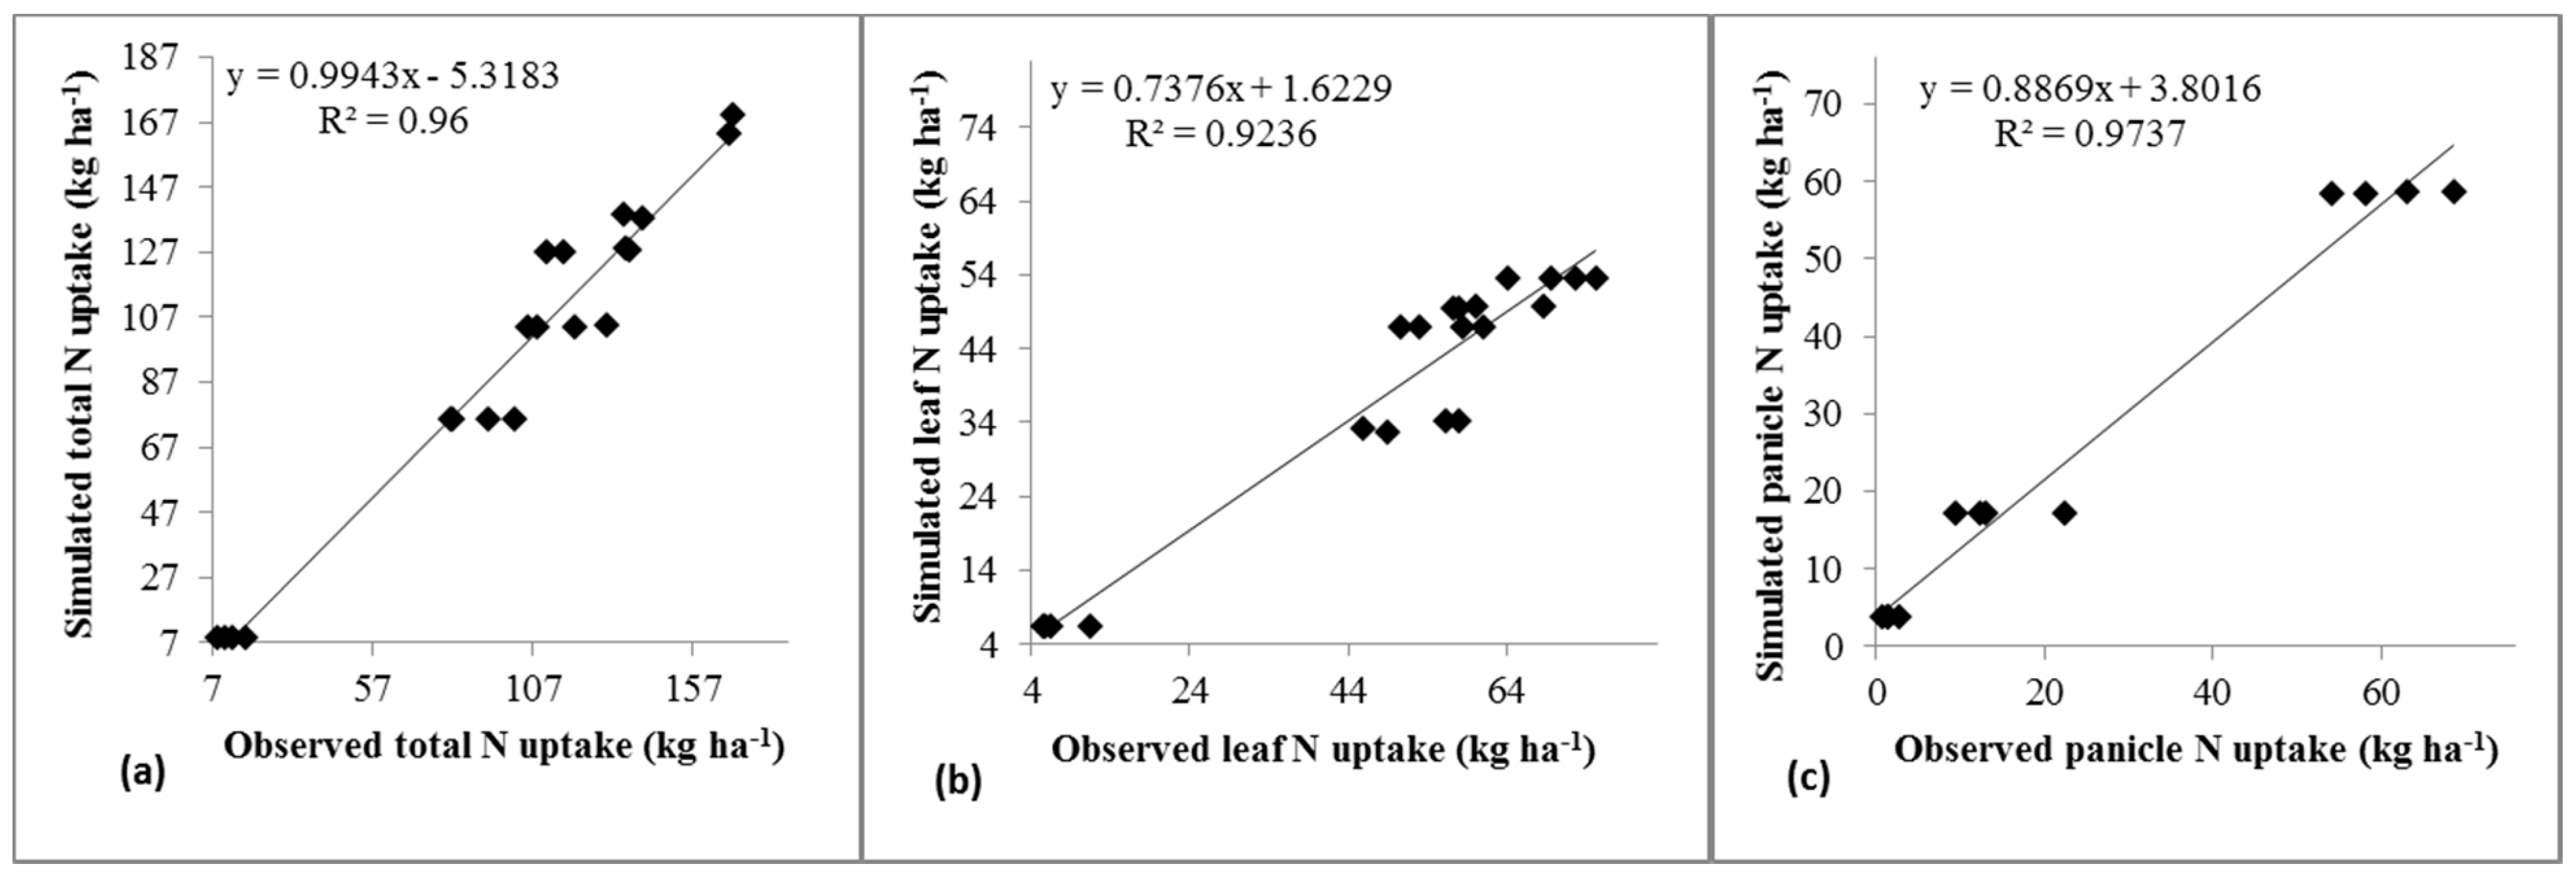
Comparison between observed and simulated crop N uptake attributes are displayed in Figure 3 and Figure 4. The ORYZA model showed a good response (p > 0.01) to N attributes except for leaf N uptake between observed and simulated data which was higher than those in the crop biomass attributes, reflects high values for RMSEn while low for R2 in calibration (Table S1) and validation period (Table S2). Nevertheless, values of RMSEn and R2 for total crop N uptake were 12.35% and 0.90 for calibration, for validation were 11.63% and 0.96 respectively. In calibration and validation, for panicle N uptake RMSEn was 13.38 % and 18.96%, for R2 were 0.98 and 0.97. However, for leaf N uptake, RMSEn was 18.21% and 27.56%, while for R2 leaf N uptake was 0.67 for calibration and 0.92 for the validation period. In addition the statistical evaluation like root mean square error (RMSE) student test (Pt) values, intercept (α), slope (β), for calibration and validation of nitrogen uptake can be found in Tables S1 and S2.
3.2. Scenario Analysis Set 1
3.2.1. Simulation with 0 and 300 N Rates
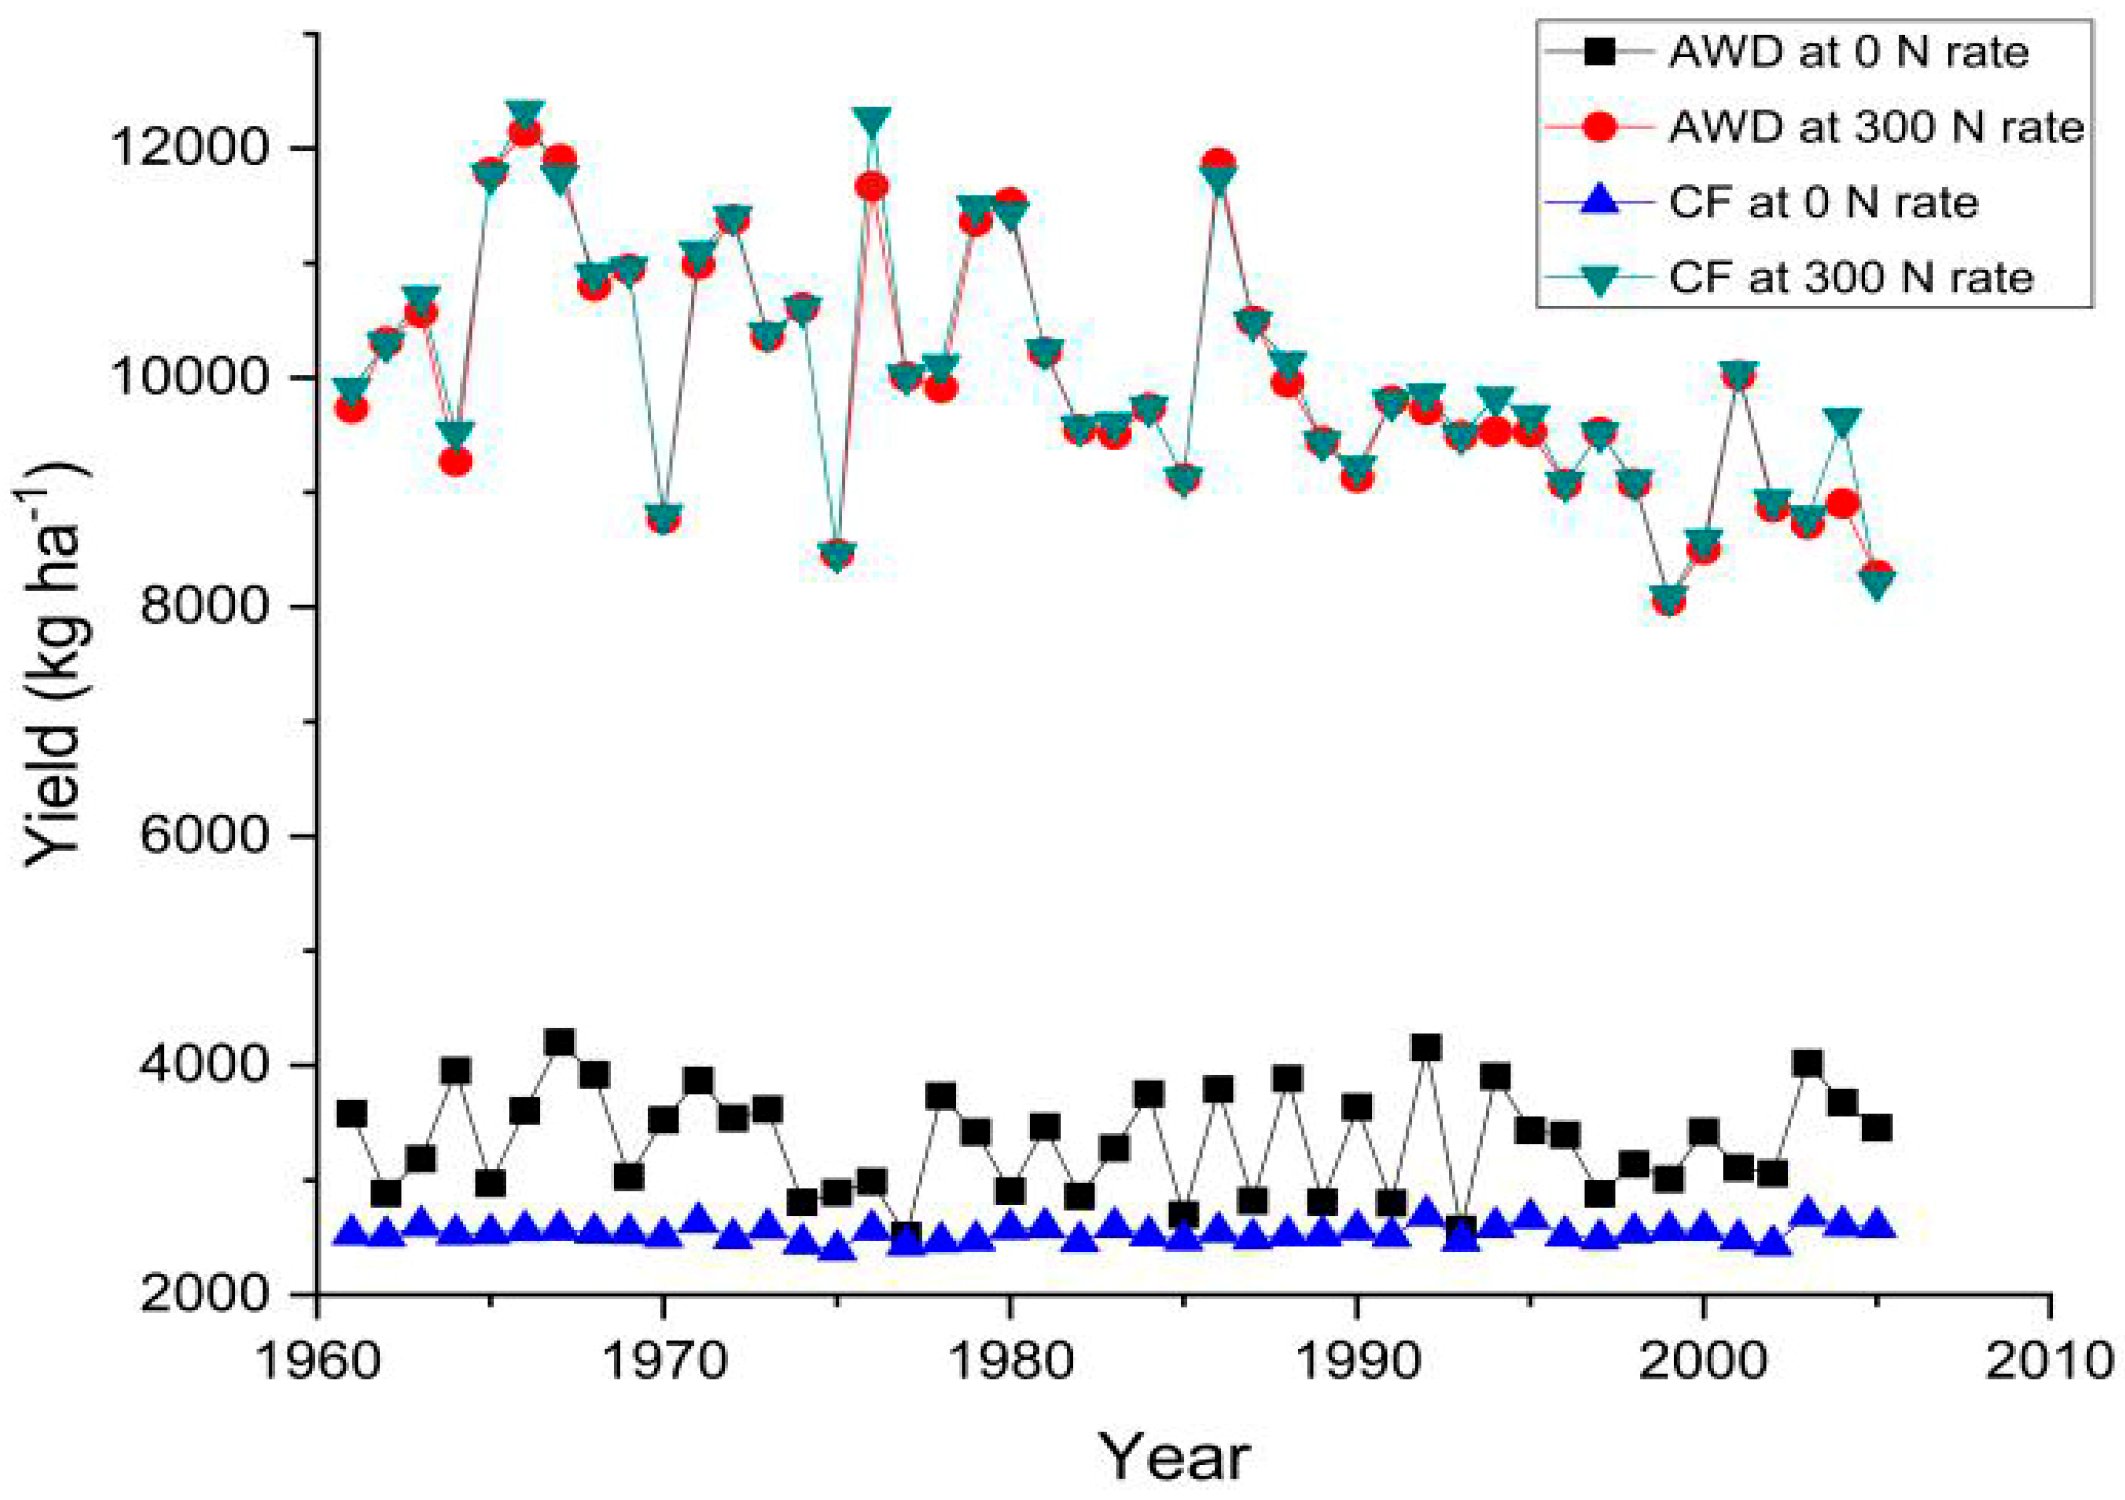
The graphical example of yields simulated for the past 45 years (1961–2005) of evaluation at four combinations of CF and AWD and low (0 N) and high (300 kg N ha−1) fertilizer rates are presented in Figure 5. The yield differences among the years were large, due to climate change but also enhanced by N rates. The differences in yield were witnessed at high (300 kg N ha−1) fertilizer rate. The fluctuation in yield was observed between 8000 and 11,000 kg ha−1 with some year exceeding 12,000 kg ha−1. At Low application rates (0 N), the variation in crop yields at AWD were relatively high than CF and vary between 2500 kg ha−1 and 4000 kg ha−1. The effect of AWD at low fertilizer N (0 N) was high compared to CF. However, the differences in yield at high fertilizer N (300 kg N ha−1) were found close between AWD and CF.
3.2.2. Various Fertilizer N inputs with AWD and CF conditions
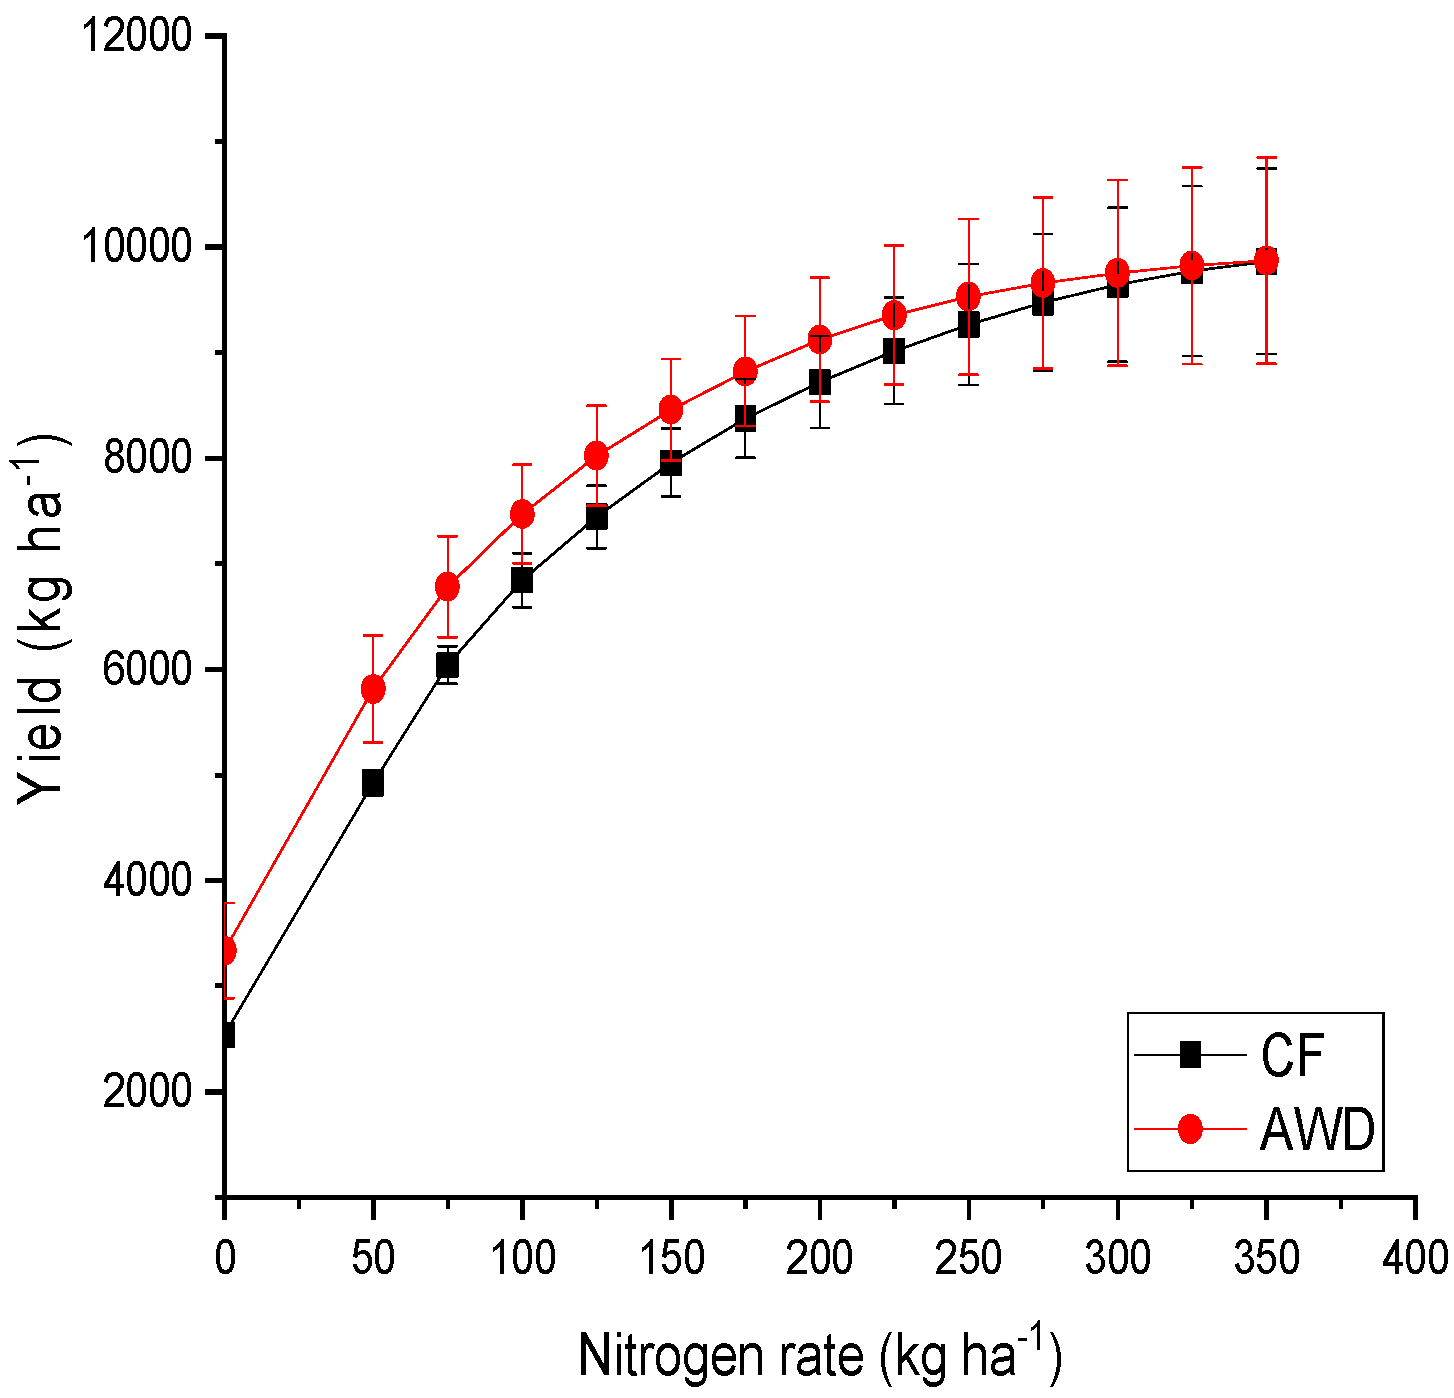
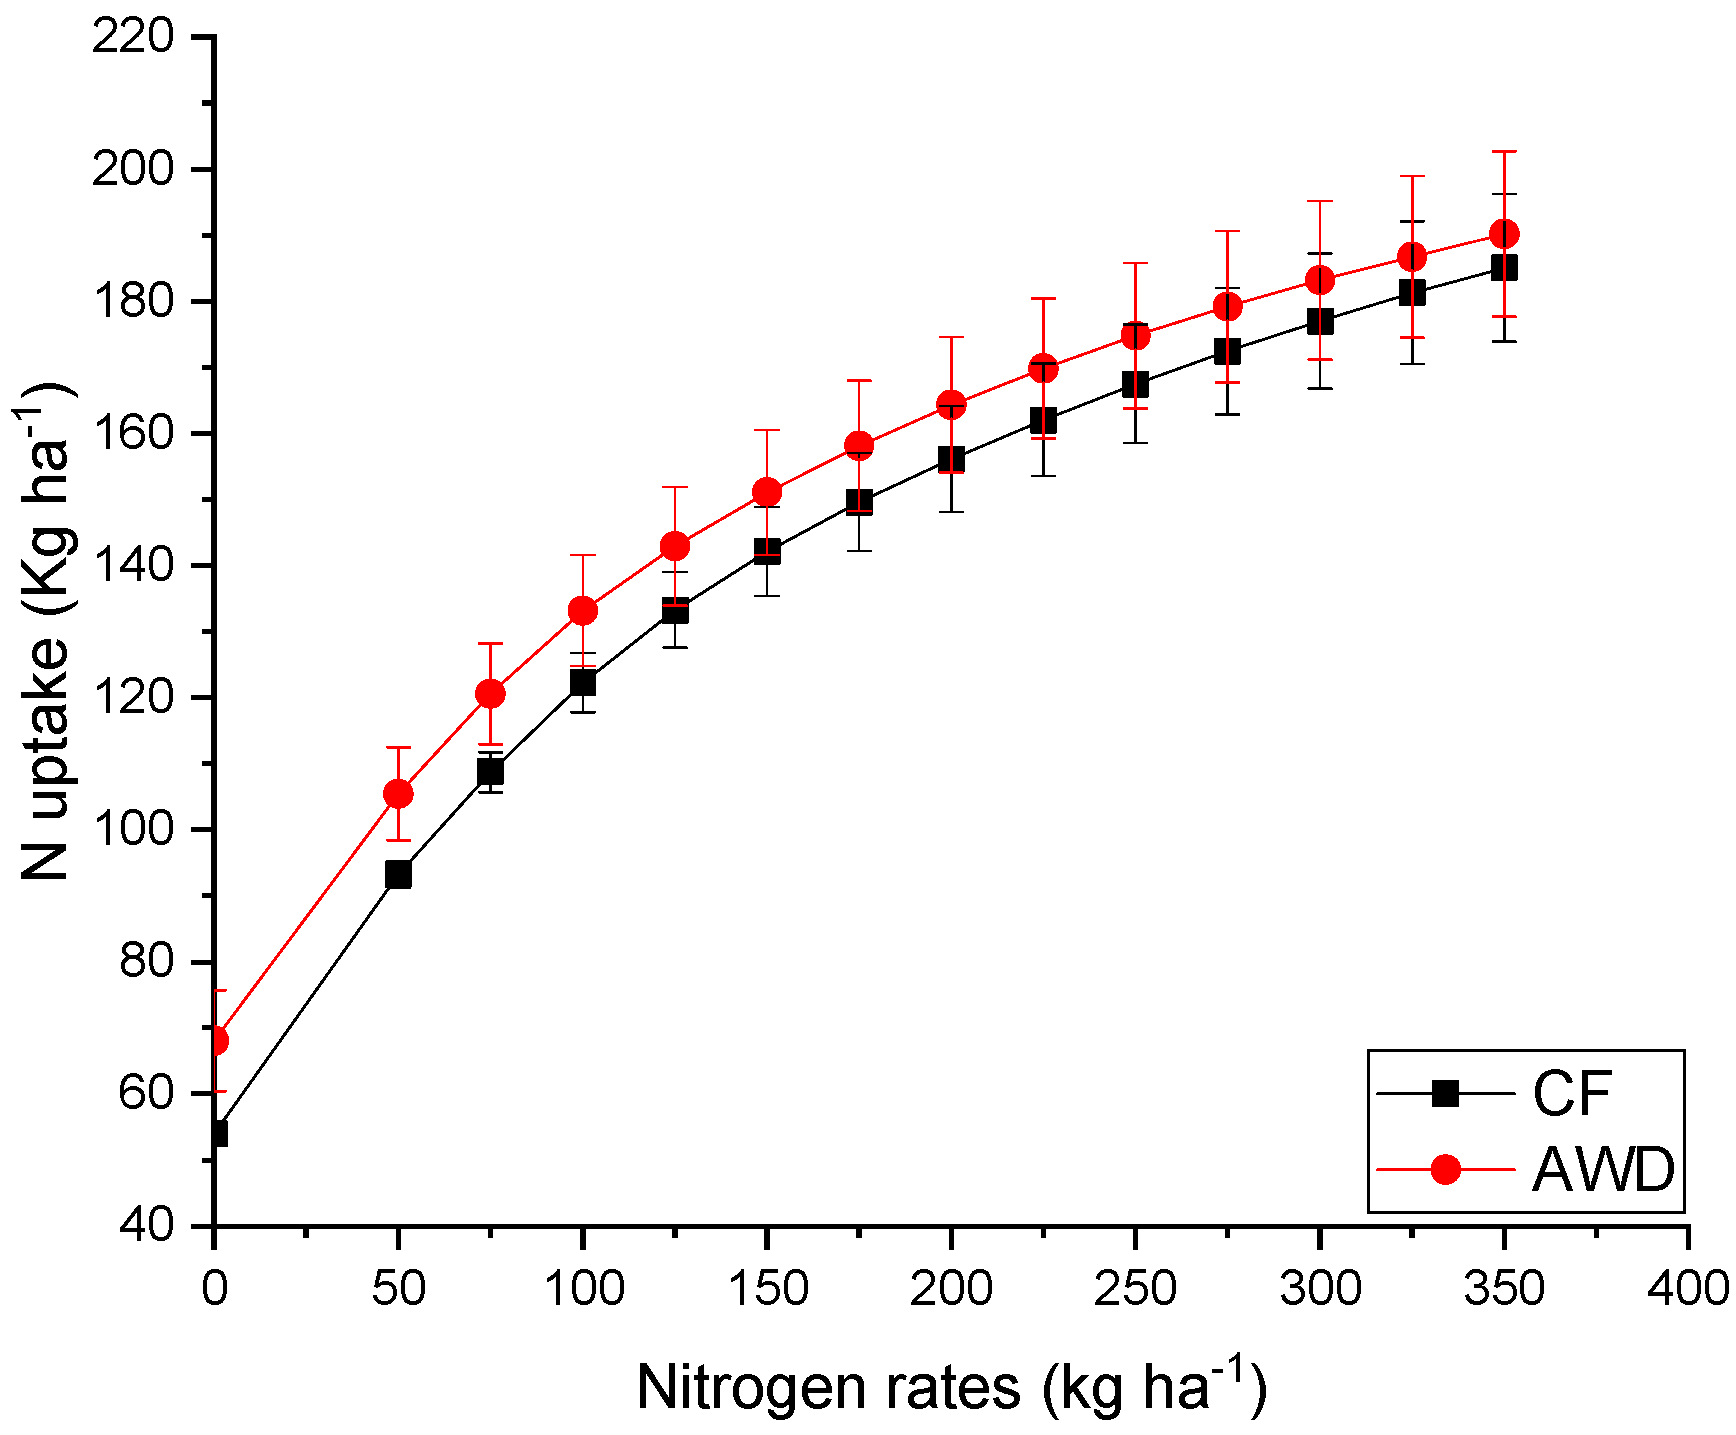
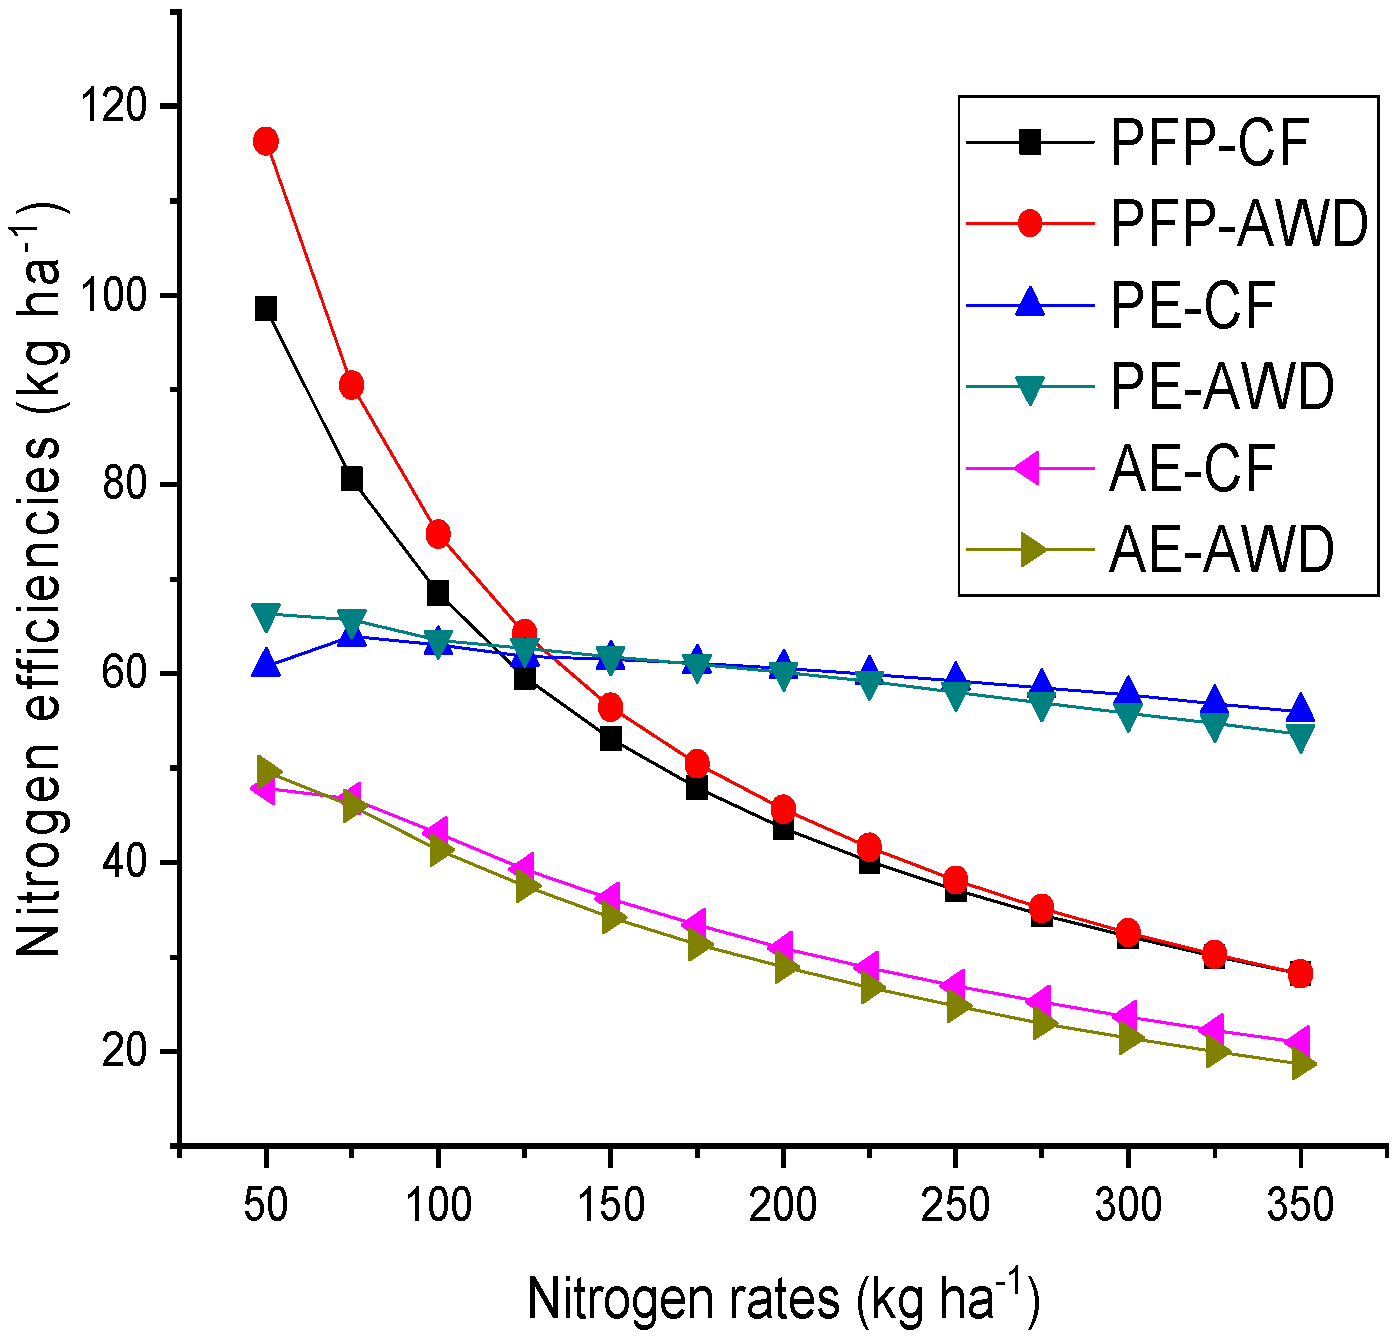
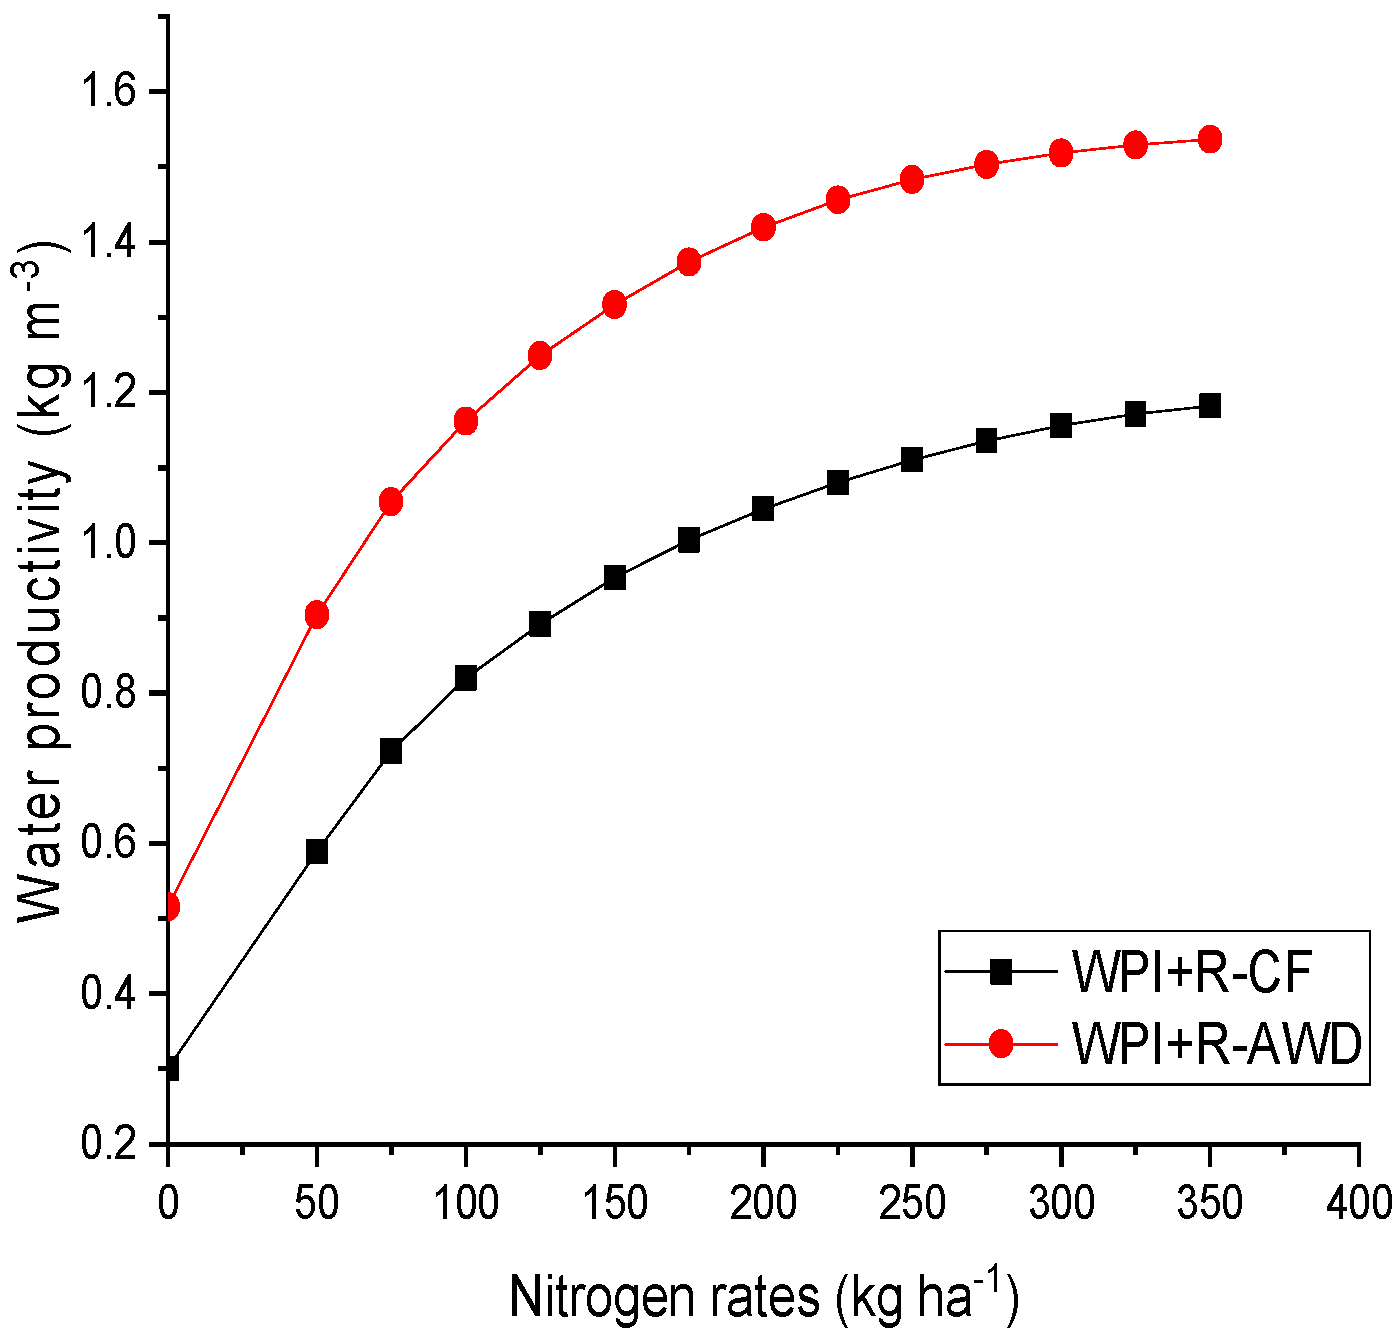
The results in Figure 6 display simulation of different nitrogen inputs at AWD and CF, using values averaged over the 45 years simulation. The response of N curves was different at both water regimes. Yield increases linearly with the input of nitrogen. The slope of the curve between nitrogen input and yield, agronomic efficiency, is high at low N rates and decreases with the increase of nitrogen input. At both water supply AWD and CF there is yield gap at lower fertilizer rates ranged from 0 to 200 kg ha−1 but the difference became very low at high N rates and at above 300 kg N ha−1 were almost plateau. The simulated yield at 225 kg N ha−1 for AWD was 9356 kg ha−1 and for CF was 9015 kg ha−1. Figure 7 showcase the same trend for nitrogen uptake at CF and AWD with different N rates. The increase in N uptake directly proportional to N rates and no significant difference at high fertilizer N (above 225 kg N ha−1) rate at both irrigation regimes. In both CF and AWD partial factor productivity, physiological and agronomic efficiencies decrease with the increase of nitrogen input (Figure 8). Water productivity increases with the increase of fertilizer N rates. However, AWD showed high water productivity compared to CF. The WPI+R at 0 kg ha−1 fertilizer N rate was 0.5 kg m−3 for AWD and 0.3 kg m−3 for CF while at 300 kg ha−1 fertilizer N rate, WPI+R was 1.52 and 1.16 kg m−3 (Figure 9) for AWD and CF, respectively.
3.3. Scenario Analysis Set 2
The simulation scenario set 2 (Table 2) was carried out with different splits and timing of N rates, which has a significant effect on yield for both AWD and CF. However, there were no significant differences between AWD and CF. At basal fertilizer N application in one split, lowest yields were found with high physiological efficiencies and lowest fertilizer recoveries and agronomic efficiencies. For both water application and fertilizer levels, the highest yield, agronomic efficiency, fertilizer recovery, and partial factor productivity were witnessed high at four splits (3:3:3:1), while these indexes were found low at basal in one split application N fertilizers (Table 2). A similar trend was observed for nitrogen uptake indicated that with the increase of fertilizer splits, nitrogen uptake increased specially under AWD regime. Also, the highest nitrogen uptake was observed 182 kg ha−1 and 162 kg ha−1 at split 3:3:3:1 with 225 kg N ha−1 and 150 kg N ha−1 for AWD as compared to CF (Table 2). However, agronomic efficiency at 150 kg N ha−1 and 225 kg N ha−1 for CF was higher than AWD (Table 2). High N rates with splitting showed lower agronomic, physiological, fertilizer recovery efficiency and partial factor productivity (Table 2) at both water application as compared to low fertilizer N rates with different splits. Water productivity (irrigation + rainfall) was increased with the amount and splitting fertilizer N rates at both AWD and CF. The WPI+R at basal in one split N application for AWD at 150 kg N ha−1 was 1.19 kg m−3 and for CF was 0.82 kg m−3, whereas for 225 kg N ha−1 WPI+R of AWD was 1.50 kg m−3 and 1.14 kg m−3 for CF (Table 2). In general, AWD exhibited high WPI+R compared to CF. Splitting in proper amount and timing of fertilizer N resulted in good water productivity and nitrogen efficiencies, could lead to high yield.
4. Discussion
4.1. Model Evaluation
In our study, we evaluated that ORYZA (v3) performed satisfactory in simulating results from both calibration and validation experimental data sets. The goodness of parameters between observed and simulated values like RMSEn, R2 and the graphical analysis of the results of our experimental data were in good comparison to japonica variety Wuxiangjing and IR72 [24,43]. The RMSEn for the biomass partitioning was good as compared to nitrogen uptake especially for leaves, it may be because of the high RMSEn value for LAI, which is also reported in reference [35,55] which might be due to the insufficient precise evidence regarding soil N indigenous supply and soil organic matter in different layers of soil.
4.2. The Response of Sifferent N Fertilizer Rates
For scenario analysis, there was a decreasing trend in historical simulation (Figure 5). AWD has displayed more yield compared to CF at 0 fertilizer N rate, nevertheless exhibited no significant difference at high fertilizer N rates. At 0 N rate, the increase might be due to low leaching of nutrients into the soil, runoff, and drainage [68]. The highest yields at high fertilizer N rates had no significant difference at both AWD and CF. These results are in confirmation with Tan et al. (2013) who reported that the extremely shallow groundwater table guaranteed the success of AWD on grain yields and no significant yield penalty under AWD and an increase in water productivity by 17% as compared with continuous flooding irrigation treatment [69]. Another study also revealed that the adaptation of AWD can conserve around 38% of water without adversely affecting their yields [70]. The yield margin above 225 kg N ha−1 fertilizer N rates was very low (Figure 5) in both AWD and CF [24], also the results are in confirmation with Peng et al. (1999) [71], who reported curvilinear response of rice yield to nitrogen fertilizer applied rate. Linear response of rice to nitrogen rate below 150 kg N ha−1, and a plateau off when the applied N rate is greater than 150 kg N ha−1 was reported by Harell et al. (2011) [72]. Moreover, in China southeast the fertilizer application is more than 260 to 300 kg N ha−1 having 6000–8000 kg ha−1 rice yields [73]. Our study suggested that there is still a scope of high yield with less nitrogen and water application.
4.3. Fertilizer N Splits, Efficiencies and Water Productivity
Application of fertilizer N in China is normally to apply all fertilizer in one either two splits at transplantation or 10 days after transplantation. Our study suggested that splitting the fertilizer N resulted in high N use efficiencies at both AWD and CF conditions. Same reports were also suggested for flooding irrigation in reference [24,74], that N use efficiency can be enhanced by increasing the number of splits and late applications. Small doses of frequently fertilizer application were also suggested by Reference [75]. In AWD the high nitrogen uptake might be the reason of low nitrogen leaching which resulted in high N uptake and yield with high nitrogen efficiencies compared to CF. Re-watering can enhance the photosynthesis process in later stages, increases carbon remobilization from vegetative tissues to grains, increases root biomass associated with high yields and nitrogen uptake [76].
However, agronomic efficiency at CF was higher than AWD which was reported in reference [67]. Nevertheless, yield was increased in AWD, it might be an inferior grain yield in CF conditions which were mainly accredited to a lesser percentage of filled grains at HN (high amount) than at NN (normal amount), although either more spikelet number per panicle or more panicles contributed in the AWD to a higher yield [76]. Partial factor productivity was high at the AWD compared to CF at both high and low fertilizer N rate. Same results were reported in reference [6,67].
The lowest WPI+R values under both irrigation regimes were obtained under zero nitrogen application, and WPI+R increased with applied nitrogen rate [67]. WPI+R at 150 kg ha−1 was observed highest 1.16 kg m−3 at AWD regime with four split (3:3:3:1) and lowest at basal N application 0.94 kg m−3 while for CF was 1.04 kg m−3 and 0.82 kg m−3 respectively. These results are with an agreement with [77,78], who also reported that WPI+R can be increased under intermittent irrigation whereas, it also reported a decline in WPI+R under AWD [79]. The implementation of AWD at field and schemes levels should consider local climate, soil type, rice genotype and season for the improvement of WPI+R.
5. Conclusions
This study concluded that ORYZA (v3) performed satisfactorily the interaction of water and nitrogen conditions. The model simulated biomass partitioning well match with the observed values and also nitrogen related partitioning. The model overestimated the simulated LAI compared to observed data, however it was statistically in the accepted range. ORYZA (v3) can be adopted, to run under different climatic conditions. For scenario analysis from 45 years, historical data indicated that AWD can be adopted as the main irrigation method under optimum fertilizer rates. The study also suggested that N rates should be applied in more splits with the later application. The better split identified was (3:3:3:1) that was at transplanting, tillering, panicle initiating and booting stage. However, splits N doses in AWD performed better as compared to CF. Partial factor productivity was high at AWD and agronomic efficiency was high at CF. High yield was associated with AWD, but there were no significant differences between AWD and CF. AWD can save more water could save energy and labor cost, and with no production reduction. The study suggested that there might be more investigations, essential to explore the effects of different rice genotypes, and their interaction with fertilizer N and AWD under different climatic and soil conditions and also for the future climatic scenarios and its response to yield and biomass of rice crop.
Supplementary Materials
The following are available online at https://www.mdpi.com/2073-4395/9/1/39/s1, Table S1: ORYZA (v3) evaluation results for crop growth variables simulations for calibration data set over the entire growing season; Table S2: ORYZA (v3) evaluation results for crop growth variables simulations for validation data set over the entire growing season.
Author Contributions
J.X. conceived and designed the experiments; F.H collected data for model input Q.L., S.F.R., Q.W., experimental work; F.H., J.X., and S.F.R., analyzed the data and model calibration and paper writing; Q.W. and A.u.R.K., concise the paper. All authors have read and approved the final manuscript.
Funding
This project was supported financially by National Key Research and Development Plan (No. 2016YFC0400103), Jiangsu Province Water Conservancy Science and Technology Project (No.2018065), and A Project Funded by the Priority Academic Program Development of Jiangsu Higher Education Institutions.
Conflicts of Interest
The authors declare no conflict of interest.
References
- Fan, X.; Tang, Z.; Tan, Y.; Zhang, Y.; Luo, B.; Yang, M.; Lian, X.; Shen, Q.; Miller, A.J.; Xu, G. Overexpression of a pH-sensitive nitrate transporter in rice increases crop yields. Proc. Natl. Acad. Sci. USA 2016, 113, 7118–7123. [Google Scholar] [CrossRef] [PubMed]
- Seck, P.A.; Diagne, A.; Mohanty, S.; Wopereis, M.C.S. Crops that feed the world 7: Rice. Food Secur. 2012, 4, 7–24. [Google Scholar] [CrossRef]
- Huang, J.; Rozelle, S.; Hu, R.; Li, N. China’s Rice Economy and Policy: Supply, Demand, and Trade in the 21st Century. In Developments in the Asian Rice Economy; IRRI: Los Baños, Philippines, 2002; pp. 3–5. [Google Scholar]
- Godfray, H.C.J.; Beddington, J.R.; Crute, I.R.; Haddad, L.; Lawrence, D.; Muir, J.F.; Pretty, J.; Robinson, S.; Thomas, S.M.; Toulmin, C. Food security: The challenge of feeding 9 billion people. Science 2010, 327, 812–818. [Google Scholar] [CrossRef] [PubMed]
- Peng, S. Reflection on China’s rice production strategies during the transition period. Sci. Sin. Vitae 2014, 44, 845–850. [Google Scholar] [CrossRef]
- Shaobing, P. Dilemma and way-out of hybrid rice during the transition period in China. Acta Agron. Sin. 2016, 42, 313–319. [Google Scholar]
- Kichey, T.; Hirel, B.; Heumez, E.; Dubois, F.; Le Gouis, J. In winter wheat (Triticum aestivum L.), post-anthesis nitrogen uptake and remobilisation to the grain correlates with agronomic traits and nitrogen physiological markers. Field Crop. Res. 2007, 102, 22–32. [Google Scholar] [CrossRef]
- Mae, T. Physiological nitrogen efficiency in rice: Nitrogen utilization, photosynthesis, and yield potential. Plant Soil 1997, 196, 201–210. [Google Scholar] [CrossRef]
- Raun, W.R.; Johnson, G.V. Improving nitrogen use efficiency for cereal production. Agron. J. 1999, 91, 357–363. [Google Scholar] [CrossRef]
- Singh, U. Integrated nitrogen fertilization for intensive and sustainable agriculture. J. Crop Improv. 2006, 15, 259–288. [Google Scholar] [CrossRef]
- Qian, X.; Shen, G.; Wang, Z.; Zhang, X.; Hong, Z. Effect of swine liquid manure application in paddy field on water quality, soil fertility and crop yields. Paddy Water Environ. 2018, 16, 15–22. [Google Scholar] [CrossRef]
- Nkoa, R. Agricultural benefits and environmental risks of soil fertilization with anaerobic digestates: A review. Agron. Sustain. Dev. 2014, 34, 473–492. [Google Scholar] [CrossRef]
- Aleem, M.; Shun, C.; Li, C.; Aslam, A.; Yang, W.; Nawaz, M.; Ahmed, W.; Buttar, N. Evaluation of groundwater quality in the vicinity of Khurrianwala industrial zone, Pakistan. Water 2018, 10, 1321. [Google Scholar] [CrossRef]
- Peng, S.-B.; Huang, J.-L.; Zhong, X.-H.; Yang, J.-C.; Wang, G.-H.; Zou, Y.-B.; Zhang, F.-S.; Zhu, Q.-S.; Buresh, R.; Witt, C. Challenge and opportunity in improving fertilizer-nitrogen use efficiency of irrigated rice in China. Agric. Sci. China 2002, 1, 776–785. [Google Scholar]
- Peng, S.; Buresh, R.J.; Huang, J.; Zhong, X.; Zou, Y.; Yang, J.; Wang, G.; Liu, Y.; Hu, R.; Tang, Q.; et al. Improving Nitrogen Fertilization in Rice by Site-Specific N Management. In Sustainable Agriculture Volume 2; Springer: Dordrecht, The Netherlands, 2011; pp. 943–952. [Google Scholar]
- Roelcke, M.; Schleef, K.H.; Richter, J. Recent trends and recommendations for nitrogen fertilization in intensive agriculture in eastern China. Proc. Natl. Acad. Sci. USA 2004, 14, 449–460. [Google Scholar]
- Cassman, K.G.; Harwood, R.R. The nature of agricultural systems: Food security and environmental balance. Food Policy 1995, 20, 439–454. [Google Scholar] [CrossRef]
- Cu, R.M.; Mew, T.W.; Cassman, K.G.; Teng, P.S. Effect of sheath blight on yield in tropical, intensive rice production system. Plant Dis. 1996, 80, 1103. [Google Scholar] [CrossRef]
- Guo, J.H.; Liu, X.J.; Zhang, Y.; Shen, J.L.; Han, W.X.; Zhang, W.F.; Christie, P.; Goulding, K.W.T.; Vitousek, P.M.; Zhang, F.S. Significant acidification in major Chinese croplands. Science 2010, 327, 1008–1010. [Google Scholar] [CrossRef]
- Diaz, R.J.; Rosenberg, R. Spreading dead zones and consequences for marine ecosystems. Science 2008, 321, 926–929. [Google Scholar] [CrossRef] [PubMed]
- Smil, V. Nitrogen in crop production: An account of global flows. Glob. Biogeochem. Cycles 1999, 13, 647–662. [Google Scholar] [CrossRef] [Green Version]
- Shrawat, A.K.; Carroll, R.T.; DePauw, M.; Taylor, G.J.; Good, A.G. Genetic engineering of improved nitrogen use efficiency in rice by the tissue-specific expression of alanine aminotransferase. Plant Biotechnol. J. 2008, 6, 722–732. [Google Scholar] [CrossRef] [Green Version]
- Deng, F.; Wang, L.; Ren, W.-J.; Mei, X.-F. Enhancing nitrogen utilization and soil nitrogen balance in paddy fields by optimizing nitrogen management and using polyaspartic acid urea. Field Crop. Res. 2014, 169, 30–38. [Google Scholar] [CrossRef]
- Jing, Q.; Bouman, B.A.M.; Hengsdijk, H.; Van Keulen, H.; Cao, W. Exploring options to combine high yields with high nitrogen use efficiencies in irrigated rice in China. Eur. J. Agron. 2007, 26, 166–177. [Google Scholar] [CrossRef]
- Singh, B.; Singh, Y.; Ladha, J.K.; Bronson, K.F.; Balasubramanian, V.; Singh, J.; Khind, C.S. Chlorophyll meter—And leaf color chart—Based nitrogen management for rice and wheat in Northwestern India. Agron. J. 2002, 94, 821–829. [Google Scholar] [CrossRef]
- Fan, M.; Lu, S.; Jiang, R.; Liu, X.; Zhang, F. Triangular transplanting pattern and split nitrogen fertilizer application increase rice yield and nitrogen fertilizer recovery. Agron. J. 2009, 101, 1421–1425. [Google Scholar] [CrossRef]
- Sathiya, K.; Ramesh, T. Effect of split application of nitrogen on growth and yield of aerobic rice. Asian J. Exp. Sci. 2009, 23, 303–306. [Google Scholar]
- Russo, S. Rice yield as affected by the split method of N application and nitrification inhibitor DCD. Cah. Opt. Mediterr. 1996, 15, 43–53. [Google Scholar]
- Prasad, L.R.V.; Mailapalli, D.R. Evaluation of nitrogen fertilization patterns using DSSAT for enhancing grain yield and nitrogen use efficiency in rice. Commun. Soil Sci. Plant Anal. 2018, 49, 1–17. [Google Scholar] [CrossRef]
- Jeong, H.; Jang, T.; Seong, C.; Park, S. Assessing nitrogen fertilizer rates and split applications using the DSSAT model for rice irrigated with urban wastewater. Agric. Water Manag. 2014, 141, 1–9. [Google Scholar] [CrossRef]
- Pan, S.; Huang, S.; Jing, Z.; Wang, J.; Cao, C.; Cai, M.; Ming, Z.; Tang, X. Effects of N management on yield and N uptake of rice in central China. J. Integr. Agric. 2012, 11, 1993–2000. [Google Scholar] [CrossRef]
- Li, H.; Zhang, W.; Zhang, F.; Li, L. Analysis of the changes in chemical fertilizer use and efficiency of the main grain crops in China. Plant Nutr. Fertil. Sci. 2010, 16, 1136–1143. [Google Scholar]
- Alberto, M.C.R.; Wassmann, R.; Hirano, T.; Miyata, A.; Hatano, R.; Kumar, A.; Padre, A.; Amante, M. Comparisons of energy balance and evapotranspiration between flooded and aerobic rice fields in the Philippines. Agric. Water Manag. 2011, 98, 1417–1430. [Google Scholar] [CrossRef]
- Shao, G.; Cui, J.; Lu, B.; Brian, B.J.; Ding, J.; She, D.; Yu, S. Impacts of controlled irrigation and drainage on the yield and physiological attributes of rice. Agric. Water Manag. 2015, 149, 156–165. [Google Scholar] [CrossRef]
- Bouman, B.A.M.; Tuong, T.P. Field water management to save water and increase its productivity in irrigated lowland rice. Agric. Water Manag. 2001, 49, 11–30. [Google Scholar] [CrossRef]
- Khush, G.S. What it will take to feed 5.0 billion rice consumers in 2030. Plant Mol. Biol. 2005, 59, 1–6. [Google Scholar] [CrossRef] [PubMed]
- Bates, B.C.; Kundzewicz, Z.W.; Wu, S.; Palutikof, J.P. Climate change and water. Technical paper of the intergovernmental panel on climate change, IPCC secretariat, Geneva. Clim. Chang. Policy Renewed Environ. Ethic 2008, 21, 85–101. [Google Scholar]
- Yan, T.; Wang, J.; Huang, J. Urbanization, agricultural water use, and regional and national crop production in China. Ecol. Modell. 2015, 318, 226–235. [Google Scholar] [CrossRef] [Green Version]
- Tuong, T.P.; Bouman, B.A.M. Rice production in water-scarce environments. Water Product. Agric. Limits Oppor. Improv. 2003, 1, 13–42. [Google Scholar]
- Belder, P.; Bouman, B.A.M.; Cabangon, R.; Guoan, L.; Quilang, E.J.P.; Yuanhua, L.; Spiertz, J.H.J.; Tuong, T.P. Effect of water-saving irrigation on rice yield and water use in typical lowland conditions in Asia. Agric. Water Manag. 2004, 65, 193–210. [Google Scholar] [CrossRef]
- Amiri, E.; Razavipour, T.; Farid, A.; Bannayan, M. Effects of crop density and irrigation management on water productivity of rice production in Northern Iran: Field and modeling approach. Commun. Soil Sci. Plant Anal. 2011, 42, 2085–2099. [Google Scholar] [CrossRef]
- Yadav, S.; Li, T.; Humphreys, E.; Gill, G.; Kukal, S.S. Evaluation and application of ORYZA2000 for irrigation scheduling of puddled transplanted rice in north west India. Field Crop. Res. 2011, 122, 104–117. [Google Scholar] [CrossRef]
- Bouman, B.A.M.; Van Laar, H.H. Description and evaluation of the rice growth model ORYZA2000 under nitrogen-limited conditions. Agric. Syst. 2006, 87, 249–273. [Google Scholar] [CrossRef]
- Stöckle, C.O.; Donatelli, M.; Nelson, R. CropSyst, a cropping systems simulation model. Eur. J. Agron. 2003, 18, 289–307. [Google Scholar] [CrossRef] [Green Version]
- Jones, J.W.; Hoogenboom, G.; Porter, C.H.; Boote, K.J.; Batchelor, W.D.; Hunt, L.A.; Wilkens, P.W.; Singh, U.; Gijsman, A.J.; Ritchie, J.T. The DSSAT cropping system model. Eur. J. Agron. 2003, 18, 235–265. [Google Scholar] [CrossRef]
- Aggarwal, P.K.; Kalra, N.; Chander, S.; Pathak, H. InfoCrop: A dynamic simulation model for the assessment of crop yields, losses due to pests, and environmental impact of agro-ecosystems in tropical environments. I. Model description. Agric. Syst. 2006, 89, 1–25. [Google Scholar] [CrossRef]
- Zhang, X.; Lee, J.-H.; Abawi, Y.; Kim, Y.; McClymont, D.; Kim, H.-D. Testing the simulation capability of APSIM-ORYZA under different levels of nitrogen fertiliser and transplanting time regimes in Korea. Aust. J. Exp. Agric. 2007, 47, 1446–1454. [Google Scholar] [CrossRef]
- Kang, Y.; Khan, S.; Ma, X. Climate change impacts on crop yield, crop water productivity and food security—A review. Prog. Nat. Sci. 2009, 19, 1665–1674. [Google Scholar] [CrossRef]
- Tubiello, F.N.; Donatelli, M.; Rosenzweig, C.; Stockle, C.O. Effects of climate change and elevated CO2 on cropping systems: Model predictions at two Italian locations. Eur. J. Agron. 2000, 13, 179–189. [Google Scholar] [CrossRef]
- Liu, L.; Zhu, Y.; Tang, L.; Cao, W.; Wang, E. Impacts of climate changes, soil nutrients, variety types and management practices on rice yield in East China: A case study in the Taihu region. Field Crop. Res. 2013, 149, 40–48. [Google Scholar] [CrossRef] [Green Version]
- Thorp, K.R.; DeJonge, K.C.; Kaleita, A.L.; Batchelor, W.D.; Paz, J.O. Methodology for the use of DSSAT models for precision agriculture decision support. Comput. Electron. Agric. 2008, 64, 276–285. [Google Scholar] [CrossRef] [Green Version]
- Amarasingha, R.; Suriyagoda, L.D.B.; Marambe, B.; Gaydon, D.S.; Galagedara, L.W.; Punyawardena, R.; Silva, G.; Nidumolu, U.; Howden, M. Simulation of crop and water productivity for rice (Oryza sativa L.) using APSIM under diverse agro-climatic conditions and water management techniques in Sri Lanka. Agric. Water Manag. 2015, 160, 132–143. [Google Scholar] [CrossRef]
- Heinemann, A.B.; Hoogenboom, G.; De Faria, R.T. Determination of spatial water requirements at county and regional levels using crop models and GIS: An example for the State of Parana, Brazil. Agric. Water Manag. 2002, 52, 177–196. [Google Scholar] [CrossRef]
- Yang, X.; Chen, F.; Lin, X.; Liu, Z.; Zhang, H.; Zhao, J.; Li, K.; Ye, Q.; Li, Y.; Lv, S.; et al. Potential benefits of climate change for crop productivity in China. Agric. For. Meteorol. 2015, 208, 76–84. [Google Scholar] [CrossRef]
- Yuan, S.; Peng, S.; Li, T. Evaluation and application of the ORYZA rice model under different crop managements with high-yielding rice cultivars in central China. Field Crop. Res. 2017, 212, 115–125. [Google Scholar] [CrossRef]
- Kumar, R.; Sharma, H.L. Simulation and validation of CERES-rice (DSSAT) model in north-western Himalayas. Indian J. Agric. Sci. 2004, 74, 133–137. [Google Scholar]
- Wajid, A.; Hussain, A.; Ahmed, A.; Rafiq, M.; Goheer, A.R.; Ibrahim, M. Effect of sowing date and plant density on growth, light interception and yield of wheat under semi arid condition. Int. J. Agric. Biol. 2004, 6, 1119–1123. [Google Scholar]
- Confalonieri, R.; Gusberti, D.; Bocchi, S.; Acutis, M. The CropSyst model to simulate the N balance of rice for alternative management. Agron. Sustain. Dev. 2006, 26, 241–249. [Google Scholar] [CrossRef]
- Patel, C.; Nema, A.K.; Singh, R.S.; Yadav, M.K.; Singh, S.K.; Singh, S.M. Evaluation of DSSAT-CERES model for irrigation scheduling of wheat crop in Varanasi region of Uttar Pradesh. J. Agrometeorol. 2017, 19, 120–124. [Google Scholar]
- Marsal, J.; Stöckle, C.O. Use of CropSyst as a decision support system for scheduling regulated deficit irrigation in a pear orchard. Irrig. Sci. 2012, 30, 139–147. [Google Scholar] [CrossRef]
- Li, T.; Angeles, O.; Marcaida, M., III; Manalo, E.; Manalili, M.P.; Radanielson, A.; Mohanty, S. From ORYZA2000 to ORYZA (v3): An improved simulation model for rice in drought and nitrogen-deficient environments. Agric. For. Meteorol. 2017, 237, 246–256. [Google Scholar] [CrossRef]
- Li, T.; Raman, A.K.; Marcaida, M., III; Kumar, A.; Angeles, O.; Radanielson, A.M. Simulation of genotype performances across a larger number of environments for rice breeding using ORYZA2000. Field Crop. Res. 2013, 149, 312–321. [Google Scholar] [CrossRef]
- Bouman, B.A.M.; Peng, S.; Castaneda, A.R.; Visperas, R.M. Yield and water use of irrigated tropical aerobic rice systems. Agric. Water Manag. 2005, 74, 87–105. [Google Scholar] [CrossRef]
- Boling, A.; Tuong, T.P.; Jatmiko, S.Y.; Burac, M.A. Yield constraints of rainfed lowland rice in Central Java, Indonesia. Field Crop. Res. 2004, 90, 351–360. [Google Scholar] [CrossRef]
- Xu, J.; Peng, S.; Yang, S.; Wang, W. Ammonia volatilization losses from a rice paddy with different irrigation and nitrogen managements. Agric. Water Manag. 2012, 104, 184–192. [Google Scholar] [CrossRef]
- Feng, L.; Bouman, B.A.M.; Tuong, T.P.; Cabangon, R.J.; Li, Y.; Lu, G.; Feng, Y. Exploring options to grow rice using less water in northern China using a modelling approach: I. Field experiments and model evaluation. Agric. Water Manag. 2007, 88, 1–13. [Google Scholar] [CrossRef]
- Djaman, K.; Mel, V.; Diop, L.; Sow, A.; El-Namaky, R.; Manneh, B.; Saito, K.; Futakuchi, K.; Irmak, S. Effects of alternate wetting and drying irrigation regime and nitrogen fertilizer on Yield and nitrogen use efficiency of irrigated rice in the Sahel. Water 2018, 10, 711. [Google Scholar] [CrossRef]
- Yang, X.; Zhang, J.; Ni, W.; Dobermann, A. Characteristics of nitrogen nutrition in hybrid rice. Int. Rice Res. Notes 1999, 24, 5–8. [Google Scholar]
- Tan, X.; Shao, D.; Liu, H.; Yang, F.; Xiao, C.; Yang, H. Effects of alternate wetting and drying irrigation on percolation and nitrogen leaching in paddy fields. Paddy Water Environ. 2013, 11, 381–395. [Google Scholar] [CrossRef]
- Rejesus, R.M.; Palis, F.G.; Rodriguez, D.G.P.; Lampayan, R.M.; Bouman, B.A.M. Impact of the alternate wetting and drying (AWD) water-saving irrigation technique: Evidence from rice producers in the Philippines. Food Policy 2011, 36, 280–288. [Google Scholar] [CrossRef]
- Peng, S.; Cassman, K.G.; Virmani, S.S.; Sheehy, J.; Khush, G.S. Yield potential trends of tropical rice since the release of IR8 and the challenge of increasing rice yield potential. Crop Sci. 1999, 39, 1552–1559. [Google Scholar] [CrossRef]
- Harrell, D.L.; Tubana, B.S.; Lofton, J.; Kanke, Y. Rice response to nitrogen fertilization under stale seedbed and conventional tillage systems. Agron. J. 2011, 103, 494–500. [Google Scholar] [CrossRef]
- Shaobing, P.; Jianliang, H. Research strategy in improving fertilizer-nitrogen use efficiency of irrigated rice in China. Zhongguo Nongye Kexue (China) 2002, 35, 1095–1103. [Google Scholar]
- Cabangon, R.J.; Tuong, T.P.; Castillo, E.G.; Bao, L.X.; Lu, G.; Wang, G.; Cui, Y.; Bouman, B.A.M.; Li, Y.; Chen, C.; et al. Effect of irrigation method and N-fertilizer management on rice yield, water productivity and nutrient-use efficiencies in typical lowland rice conditions in China. Paddy Water Environ. 2004, 2, 195–206. [Google Scholar] [CrossRef]
- Ten Berge, H.F.M.; Thiyagarajan, T.M.; Shi, Q.; Wopereis, M.C.S.; Drenth, H.; Jansen, M.J.W. Numerical optimization of nitrogen application to rice. Part I. Description of MANAGE-N. Field Crop. Res. 1997, 51, 29–42. [Google Scholar] [CrossRef]
- Wang, Z.; Zhang, W.; Beebout, S.S.; Zhang, H.; Liu, L.; Yang, J.; Zhang, J. Grain yield, water and nitrogen use efficiencies of rice as influenced by irrigation regimes and their interaction with nitrogen rates. Field Crop. Res. 2016, 193, 54–69. [Google Scholar] [CrossRef]
- Pascual, V.J.; Wang, Y.-M. Impact of water management on rice varieties, yield, and water productivity under the system of rice intensification in Southern Taiwan. Water 2016, 9, 3. [Google Scholar] [CrossRef]
- Ceesay, M.; Reid, W.S.; Fernandes, E.C.M.; Uphoff, N.T. The effects of repeated soil wetting and drying on lowland rice yield with System of Rice Intensification (SRI) methods. Int. J. Agric. Sustain. 2006, 4, 5–14. [Google Scholar] [CrossRef]
- Carrijo, D.R.; Lundy, M.E.; Linquist, B.A. Rice yields and water use under alternate wetting and drying irrigation: A meta-analysis. Field Crop. Res. 2017, 203, 173–180. [Google Scholar] [CrossRef]
Figure 1.
Simulated and observed total biomass (WAGT), green leaves (WLVG), stems (WST), storage organs/panicles (WSO) are presented in (a–d) and leaf area index (LAI) is presented in (e–h), for calibration period 2007, in Kunshan, Nanjing, China.
Figure 1.
Simulated and observed total biomass (WAGT), green leaves (WLVG), stems (WST), storage organs/panicles (WSO) are presented in (a–d) and leaf area index (LAI) is presented in (e–h), for calibration period 2007, in Kunshan, Nanjing, China.

Figure 2.
Simulated and observed total biomass (WAGT), green leaves (WLVG), stems (WST), storage organs/panicles (WSO) are presented in (a–d) and leaf area index (LAI) is presented in (e–h), for validation period 2008, in Kunshan, Nanjing, China.
Figure 2.
Simulated and observed total biomass (WAGT), green leaves (WLVG), stems (WST), storage organs/panicles (WSO) are presented in (a–d) and leaf area index (LAI) is presented in (e–h), for validation period 2008, in Kunshan, Nanjing, China.

Figure 3.
Simulated vs. observed total N uptake, leaf N uptake and panicle N uptake, (a–c) for 2007 calibration period, in Kunshan, Nanjing, China.
Figure 3.
Simulated vs. observed total N uptake, leaf N uptake and panicle N uptake, (a–c) for 2007 calibration period, in Kunshan, Nanjing, China.

Figure 4.
Simulated vs. observed total N uptake, leaf N uptake and panicle N uptake, (a–c) for 2008 validation period, in Kunshan, Nanjing, China.
Figure 4.
Simulated vs. observed total N uptake, leaf N uptake and panicle N uptake, (a–c) for 2008 validation period, in Kunshan, Nanjing, China.

Figure 5.
Simulated yields between 1961 and 2005, with AWD and CF conditions with 0 and 300 fertilizer N rates.
Figure 5.
Simulated yields between 1961 and 2005, with AWD and CF conditions with 0 and 300 fertilizer N rates.

Figure 6.
Simulated yield and applied fertilizer N, with AWD and CF conditions. Each value is the average of 45 years between 1961 and 2005. The bars show the standard deviation among years for each N rate.
Figure 6.
Simulated yield and applied fertilizer N, with AWD and CF conditions. Each value is the average of 45 years between 1961 and 2005. The bars show the standard deviation among years for each N rate.

Figure 7.
Simulated Nitrogen uptake and applied fertilizer N, with AWD and CF conditions. Each value is the average of 45 years between 1961 and 2005. The bars show the standard deviation among years for each N rate.
Figure 7.
Simulated Nitrogen uptake and applied fertilizer N, with AWD and CF conditions. Each value is the average of 45 years between 1961 and 2005. The bars show the standard deviation among years for each N rate.

Figure 8.
Simulated different nitrogen efficiencies and applied fertilizer N, with AWD and CF conditions. Each value is the average of 45 years between 1961 and 2005.
Figure 8.
Simulated different nitrogen efficiencies and applied fertilizer N, with AWD and CF conditions. Each value is the average of 45 years between 1961 and 2005.

Figure 9.
Simulated water productivity and applied fertilizer N, with AWD and CF conditions. Each value is the average of 45 years between 1961 and 2005.
Figure 9.
Simulated water productivity and applied fertilizer N, with AWD and CF conditions. Each value is the average of 45 years between 1961 and 2005.


Table 1.
Soil properties of the experimental site.
| Characteristic | Value |
|---|---|
| Soil bulk density (g cm−3) | 1.30 |
| Soil organic matter (g kg−1) | 21.88 |
| Soil nitrogen (TN, g kg−1) | 1.03 |
| Soil phosphorus (TP, g kg−1) | 1.35 |
| Soil K (g kg−1) | 20.86 |
| pH | 7.4 |
Table 2.
Simulated grain yield Means, N use efficiency parameters N uptake and water productivity at different N splits, rates with AWD and CF, analyzing 45 years historic weather data from 1961 to 2005.
Table 2.
Simulated grain yield Means, N use efficiency parameters N uptake and water productivity at different N splits, rates with AWD and CF, analyzing 45 years historic weather data from 1961 to 2005.
| Irrigation Application | Fertilizer N Rate (kg ha−1) | Fertilizer N Splits) (kg ha−1) | Grain Yield (kg ha−1) | Total N Uptake (kg ha−1) | PFP (kg kg−1) | Yo/Nr (kg kg−1) | AE (kg kg−1) | PE (kg kg−1) | RE (%) | WPI+R (kg m−3) |
|---|---|---|---|---|---|---|---|---|---|---|
| CF | 150 | Basal | 6878 | 122 | 46 | 17 | 29 | 64 | 45 | 0.82 |
| 5, 5 | 7412 | 132 | 49 | 17 | 32 | 63 | 52 | 0.89 | ||
| 6, 4 | 7310 | 130 | 49 | 17 | 32 | 63 | 51 | 0.88 | ||
| 7, 3 | 7206 | 128 | 48 | 17 | 31 | 63 | 49 | 0.86 | ||
| 6, 2, 2 | 7773 | 139 | 52 | 17 | 35 | 62 | 57 | 0.93 | ||
| 5, 3, 2 | 7865 | 141 | 52 | 17 | 36 | 62 | 58 | 0.94 | ||
| 4, 4, 2 | 7958 | 142 | 53 | 17 | 36 | 61 | 59 | 0.95 | ||
| 5, 2, 2, 1 | 8383 | 149 | 56 | 17 | 39 | 62 | 63 | 1.00 | ||
| 3, 3, 3, 1 | 8671 | 156 | 58 | 17 | 41 | 60 | 68 | 1.04 | ||
| 4, 2, 3, 1 | 8447 | 150 | 56 | 17 | 39 | 61 | 64 | 1.01 | ||
| 225 | Basal | 7847 | 139 | 35 | 11 | 24 | 62 | 38 | 0.94 | |
| 5, 5 | 8436 | 150 | 37 | 11 | 26 | 61 | 43 | 1.01 | ||
| 6, 4 | 8327 | 148 | 37 | 11 | 26 | 61 | 42 | 1.00 | ||
| 7, 3 | 8212 | 146 | 36 | 11 | 25 | 62 | 41 | 0.98 | ||
| 6, 2, 2 | 8837 | 158 | 39 | 11 | 28 | 60 | 46 | 1.06 | ||
| 5, 3, 2 | 8928 | 160 | 40 | 11 | 28 | 60 | 47 | 1.07 | ||
| 4, 4, 2 | 9016 | 162 | 40 | 11 | 29 | 60 | 48 | 1.08 | ||
| 5, 2, 2, 1 | 9424 | 172 | 42 | 11 | 31 | 58 | 52 | 1.13 | ||
| 3, 3, 3, 1 | 9688 | 179 | 43 | 11 | 32 | 57 | 56 | 1.16 | ||
| 4, 2, 3, 1 | 9487 | 173 | 42 | 11 | 31 | 58 | 53 | 1.14 | ||
| AWD | 150 | Basal | 7704 | 137 | 51 | 22 | 29 | 63 | 46 | 1.19 |
| 5, 5 | 8082 | 144 | 54 | 22 | 32 | 63 | 50 | 1.25 | ||
| 6, 4 | 8011 | 143 | 53 | 22 | 31 | 63 | 50 | 1.24 | ||
| 7, 3 | 7943 | 141 | 53 | 22 | 31 | 63 | 49 | 1.23 | ||
| 6, 2, 2 | 8338 | 149 | 56 | 22 | 33 | 62 | 54 | 1.29 | ||
| 5, 3, 2 | 8399 | 150 | 56 | 22 | 34 | 62 | 55 | 1.30 | ||
| 4, 4, 2 | 8458 | 151 | 56 | 22 | 34 | 62 | 55 | 1.31 | ||
| 5, 2, 2, 1 | 8790 | 157 | 59 | 22 | 36 | 61 | 60 | 1.36 | ||
| 3, 3, 3, 1 | 9015 | 162 | 60 | 22 | 38 | 60 | 63 | 1.40 | ||
| 4, 2, 3, 1 | 8837 | 158 | 59 | 22 | 37 | 61 | 60 | 1.37 | ||
| 225 | Basal | 8616 | 154 | 38 | 15 | 23 | 61 | 38 | 1.33 | |
| 5, 5 | 9006 | 162 | 40 | 15 | 25 | 60 | 42 | 1.40 | ||
| 6, 4 | 8938 | 160 | 40 | 15 | 25 | 61 | 41 | 1.38 | ||
| 7, 3 | 8863 | 159 | 39 | 15 | 25 | 61 | 40 | 1.37 | ||
| 6, 2, 2 | 9263 | 167 | 41 | 15 | 26 | 60 | 44 | 1.43 | ||
| 5, 3, 2 | 9313 | 169 | 41 | 15 | 27 | 59 | 45 | 1.45 | ||
| 4, 4, 2 | 9365 | 170 | 42 | 15 | 27 | 59 | 45 | 1.45 | ||
| 5, 2, 2, 1 | 9630 | 178 | 43 | 15 | 28 | 57 | 49 | 1.49 | ||
| 3, 3, 3, 1 | 9752 | 182 | 43 | 15 | 29 | 56 | 51 | 1.51 | ||
| 4, 2, 3, 1 | 9656 | 179 | 43 | 15 | 28 | 57 | 49 | 1.50 |
The fertilizer splits are applied at transplanting for one split, at transplanting, tillering for two splits, transplanting, tillering and panicle at three splits, transplanting, tillering, panicle and booting for four splits. PFP is partial factor productivity for applied N; Yo is grain yield at 0 kg N ha−1; Nr is the amount of applied fertilizer N; PE is physiological N efficiency; RE is fertilizer recovery, and AE is agronomic N efficiency, WPI+R is the water productivity.
© 2019 by the authors. Licensee MDPI, Basel, Switzerland. This article is an open access article distributed under the terms and conditions of the Creative Commons Attribution (CC BY) license (http://creativecommons.org/licenses/by/4.0/).
Share and Cite
MDPI and ACS Style
Hameed, F.; Xu, J.; Rahim, S.F.; Wei, Q.; Rehman Khalil, A.u.; Liao, Q. Optimizing Nitrogen Options for Improving Nitrogen Use Efficiency of Rice under Different Water Regimes. Agronomy 2019, 9, 39. https://doi.org/10.3390/agronomy9010039
AMA Style
Hameed F, Xu J, Rahim SF, Wei Q, Rehman Khalil Au, Liao Q. Optimizing Nitrogen Options for Improving Nitrogen Use Efficiency of Rice under Different Water Regimes. Agronomy. 2019; 9(1):39. https://doi.org/10.3390/agronomy9010039
Chicago/Turabian StyleHameed, Fazli, Junzeng Xu, Shah Fahad Rahim, Qi Wei, Anis ur Rehman Khalil, and Qi Liao. 2019. "Optimizing Nitrogen Options for Improving Nitrogen Use Efficiency of Rice under Different Water Regimes" Agronomy 9, no. 1: 39. https://doi.org/10.3390/agronomy9010039
Note that from the first issue of 2016, this journal uses article numbers instead of page numbers. See further details here.