2. Methods
2.1. Description of Scenario and Modeling Process
We used both participatory system dynamics modeling and scenario visioning as facilitation tools, in order to combine the strengths and offset some of the weaknesses of each approach. For example, participatory system dynamics modeling was used to examine selected scenarios for their consistency or inconsistency with current data trends, and to compare scenarios using quantitative measures. In turn, scenarios allowed researchers and community partners to explore surprising and “game-changing” events that can arise exogeneously to the Minnesota system and could not have been modeled.
Other types of dynamic, quantitative modeling (agent-based or spatial modeling, for example) may also generate systemic understanding and strategic insights when used in a participatory manner. We chose system dynamics modeling for this exercise because of its emphasis on feedback mechanisms and its whole-systems perspective. We were aware that our approach to combining imaginative scenario and quantitative modeling methodologies was not the only one possible; however, based on the modeling and scenario literature, we believed that our approach had merit and the potential to generate insight into planning processes.
Figure 1 gives a diagrammatic depiction of the Minnesota 2050 process.
Figure 1.
The Minnesota 2050 scenario and model-building process. Gray shading highlights the elements of the process which are discussed in depth in this manuscript. Other papers focus on social learning outcomes from the scenario building process [
21], and on the design and effectiveness of the overall learning system [
16].
2.2. Regional Scenario Process Phases
The regional scenario process was conducted in two phases. Workshop participants were selected by the Regional Partnership boards, and represented a wide variety of professions and community leadership roles. Because of the nature of the Regional Partnerships, almost all participants had a keen interest in sustainability and tended to be concerned about environmental issues and community development.
During Phase I, participants working in small groups used the (I)NSPECT process to generate plausible scenarios of their region (this process was adapted by Richard Bawden from Schwartz [
22]). They focused these scenarios around the question, “How are we interacting with the landscape and natural resources in 2050 and how is the environment affecting our quality of life?” The participants considered the natural, social, political, economic, cultural, and technological elements of the future scenario separately by making notes on these elements. They then grouped the notes into coherent scenarios first within small groups and then for the larger group as a whole, while considering the underlying drivers of imagined future conditions. This introduction of thinking about drivers and responses was important for the subsequent modeling work.
Phase I generated between six and ten scenarios in each of seven regions around the state. We the researchers then selected one to two scenarios for modeling, and four to five scenarios for use in Phase II. Modeling scenarios were selected for their ability to illustrate biophysical constraints of the region—often, they were variations on a “regional self-sufficiency” scenario, in which workshop participants envisioned all regional food and energy needs being met internally. Scenarios for use in Phase II were selected for internal consistency, and scenarios with similar themes were usually edited into one combined scenario.
Phase II was centered around exploring the scenarios created in Phase I. The overall goal of this phase was to evaluate the strategic actions of the partnerships in light of the multiple plausible futures represented by the scenarios. Participants “inhabited” the scenarios, imagining themselves living in the year 2050 under the scenario conditions and performing both mundane tasks (for example, commuting to work or fixing breakfast) and important strategic initiatives (securing clean water for their communities). Afterwards, the initial modeling results were presented and discussed with workshop participants. Finally, participants underwent a “back-casting” exercise to describe current (2008) actions that would make their communities more resilient in each scenario.
Post-workshop surveys were collected from 39 participants (out of 70 surveys distributed). These surveys included questions about all aspects of the Minnesota 2050 process. Three questions pertained to how well the modeling component supported the overall project goal of fostering systemic thinking and promoting dialogue between different stakeholders and types of knowledge. These questions were: “The modeling focused on the most important issues in my region”; “The modeling and INSPECT process produced different insights”; and “The modeling analysis changed my perception of the most important issues in my region”.
2.3. Modeling Variables and Methodologies
All modeling variables and relations, as well as the overall model structure, are described in detail in the
appendices. Modeling of regional scenarios focused on population growth, energy, land, and water use. Given time constraints, not all of the scenarios for a given region were modeled. We focused on scenarios with the potential to yield insights about quantitative limits to economic and population growth in each region.
The modeling “logic” was taken directly from the driver/response formulations found in the scenarios, and from exploration of historical data patterns in Minnesota. We then constructed a causal loop diagram depicting scenario-specific relations between variables as envisioned by the participants (see
Figure 2 for an example). The variable relations in the causal loop diagram depicted the secondary effects of conditions described in the scenario. For example, if the scenario described a higher population growth rate, electricity demand would also increase if no change in lifestyle or consumption patterns were part of the scenario. The relation between population and electricity demand may not have been explicitly described in the scenario, but we felt it was important to include these feedback loops in the model, to enhance systemic thinking by the participants.
The model relations were quantified with existing data drawn from the literature (see
Appendices A–B for comprehensive list of data sources). Resource efficiencies (for example, the energetic conversion of biomass into ethanol) were assumed to remain at current levels (
Appendix A lists the conversion factors). Production per unit land area for biomass and food crops was assumed to be constant at current levels. As often as possible, these data were specific to the region where the scenario was generated. If regional data were unavailable, state or national-level data were used.
Figure 2.
Example of a causal loop diagram; in this case representing transportation fuel production in a regional “self-sufficiency” scenario. See
Appendix C for full model structure.
Figure 2.
Example of a causal loop diagram; in this case representing transportation fuel production in a regional “self-sufficiency” scenario. See
Appendix C for full model structure.
In most of the scenarios, variables were described in relative terms (e.g., “higher population growth”, or “less travel”). In these cases, we modeled a range of quantitative values (for example, 1.5 times and 2 times current population) to examine the effects on other scenario variables. Assumptions about variable values were discussed in Phase II of the workshops, along with the model output. We chose to use Excel in order to link the extensive databases of information collected for this project with the model, and with a variety of graphical tools to display model output. Many excellent software packages for system dynamics modeling exist; we chose Excel mainly as a matter of preference and for ease of database handling and transformation.
The model was intended to provide a “snapshot” of each scenario, meaning that the modeled relationships represented only the year 2050. This was a deliberate choice, as we wanted to retain the imaginative and disruptive feel of the scenarios, rather than assuming that current system rules would persist until 2050. Most of the scenarios assumed a change in the system “rules”, which is, by definition, a change generated from outside of the system. System dynamics is primarily concerned with internally-generated behavior [
23], so it would have been inappropriate to represent these system rule changes with the model itself. We felt that the imaginative richness and story of the scenario process was a more appropriate vehicle than modeling for exploring disruptive, “black swan” type events [
24].
In some participatory modeling exercises, researchers and participants construct a model together during workshops. We took a slightly more indirect approach, in which participants developed the scenarios to be modeled, but were not present when researchers chose the parameters and assumptions for the modeled variables. However, workshop participants did have the opportunity to comment on these assumptions and suggest alternatives during the Phase II workshops. These comments were taken into consideration in preparation for the statewide workshop.
2.4. Statewide Workshop
At the culmination of the project, state legislators, state agency representatives, members of nonprofit organizations, and selected participants from the regional workshops were invited to a statewide scenario workshop. This workshop was intended to apply systemic insights from the scenarios to explicit reflection of a new Statewide Conservation and Preservation Plan (SCPP) [
17], which was developed concurrently with the Minnesota 2050 project by teams of researchers from the University of Minnesota, Minnesota state agencies, and private consultancies. Some legislators and agency representatives had requested a tool for linking the more conventional trend projections and scientific analysis contained in the SCPP with potential future “shocks”, exogenous drivers, and consideration of outlier scenarios. Our Minnesota 2050 tools (scenarios and modeling) were ideal for this task.
Prior to the statewide workshop, we selected five “archetypal” scenarios from the regional workshops; that is, some version of these scenarios was common to all regions of the state. These “archetypal” scenarios were chosen from among the scenarios modeled at the regional level, but were scaled up to include all of Minnesota, not just a single region. Statewide workshop participants used the “inhabiting” exercises from Phase II of the regional process to imagine themselves accomplishing critical tasks in each scenario.
For the five archetypal scenarios, we used a system dynamics model to represent water consumption, land use, and energy use by fuel type in each future scenario, and the modeling output was presented and discussed in the workshop. As part of the interactivity of the statewide workshop, we devised an input sheet that allowed participants to alter key assumptions about the scenario to view the effect on model outputs regarding energy, water and land use (
Appendix D).
3. Results
Although each region’s scenarios emphasized a slightly different natural resource and socio-economic focus, approximately five types of scenarios recurred with some variations in each region around the state. We labeled these “archetypal” scenarios, and used them in regional modeling and in the statewide modeling exercise at the conclusion of the Minnesota 2050 project. These scenarios are described below, along with corresponding modeling results that were discussed with stakeholders in the Phase II and statewide workshops (See
Appendices for complete model output and modeled parameters). Some of these modeling results generated vigorous dialogue and even controversy, and these examples are elaborated below.
Regional Self-Reliance: As the name implies, this scenario depicts a Minnesota dominated by regionally-owned and operated industries, and regionally-produced renewable energy. International and interstate economic trade has collapsed, and climate change has altered temperature and rainfall patterns in the state. Household consumption is considerably lower than current levels. Land for wildlife and open space is highly desirable.
This scenario generated the most discussion around model output, in part because workshop participants tended to be invested in the concept of regional self-reliance and most viewed this scenario as “positive”. On the statewide scale, Minnesota would only have enough land to produce all of its own heating fuels and cellulosic ethanol if vehicle miles driven per person were scaled back to half of 1990 levels and vehicle fleet fuel efficiency were increased to 35 miles per gallon on average (population for this scenario was set at 1.25 times current Minnesota population), assuming cellulosic ethanol technologies would be available by 2050 (
Figure 3). This surprised some workshop participants, who had not previously envisioned the high land requirements for biofuel production on a large scale.
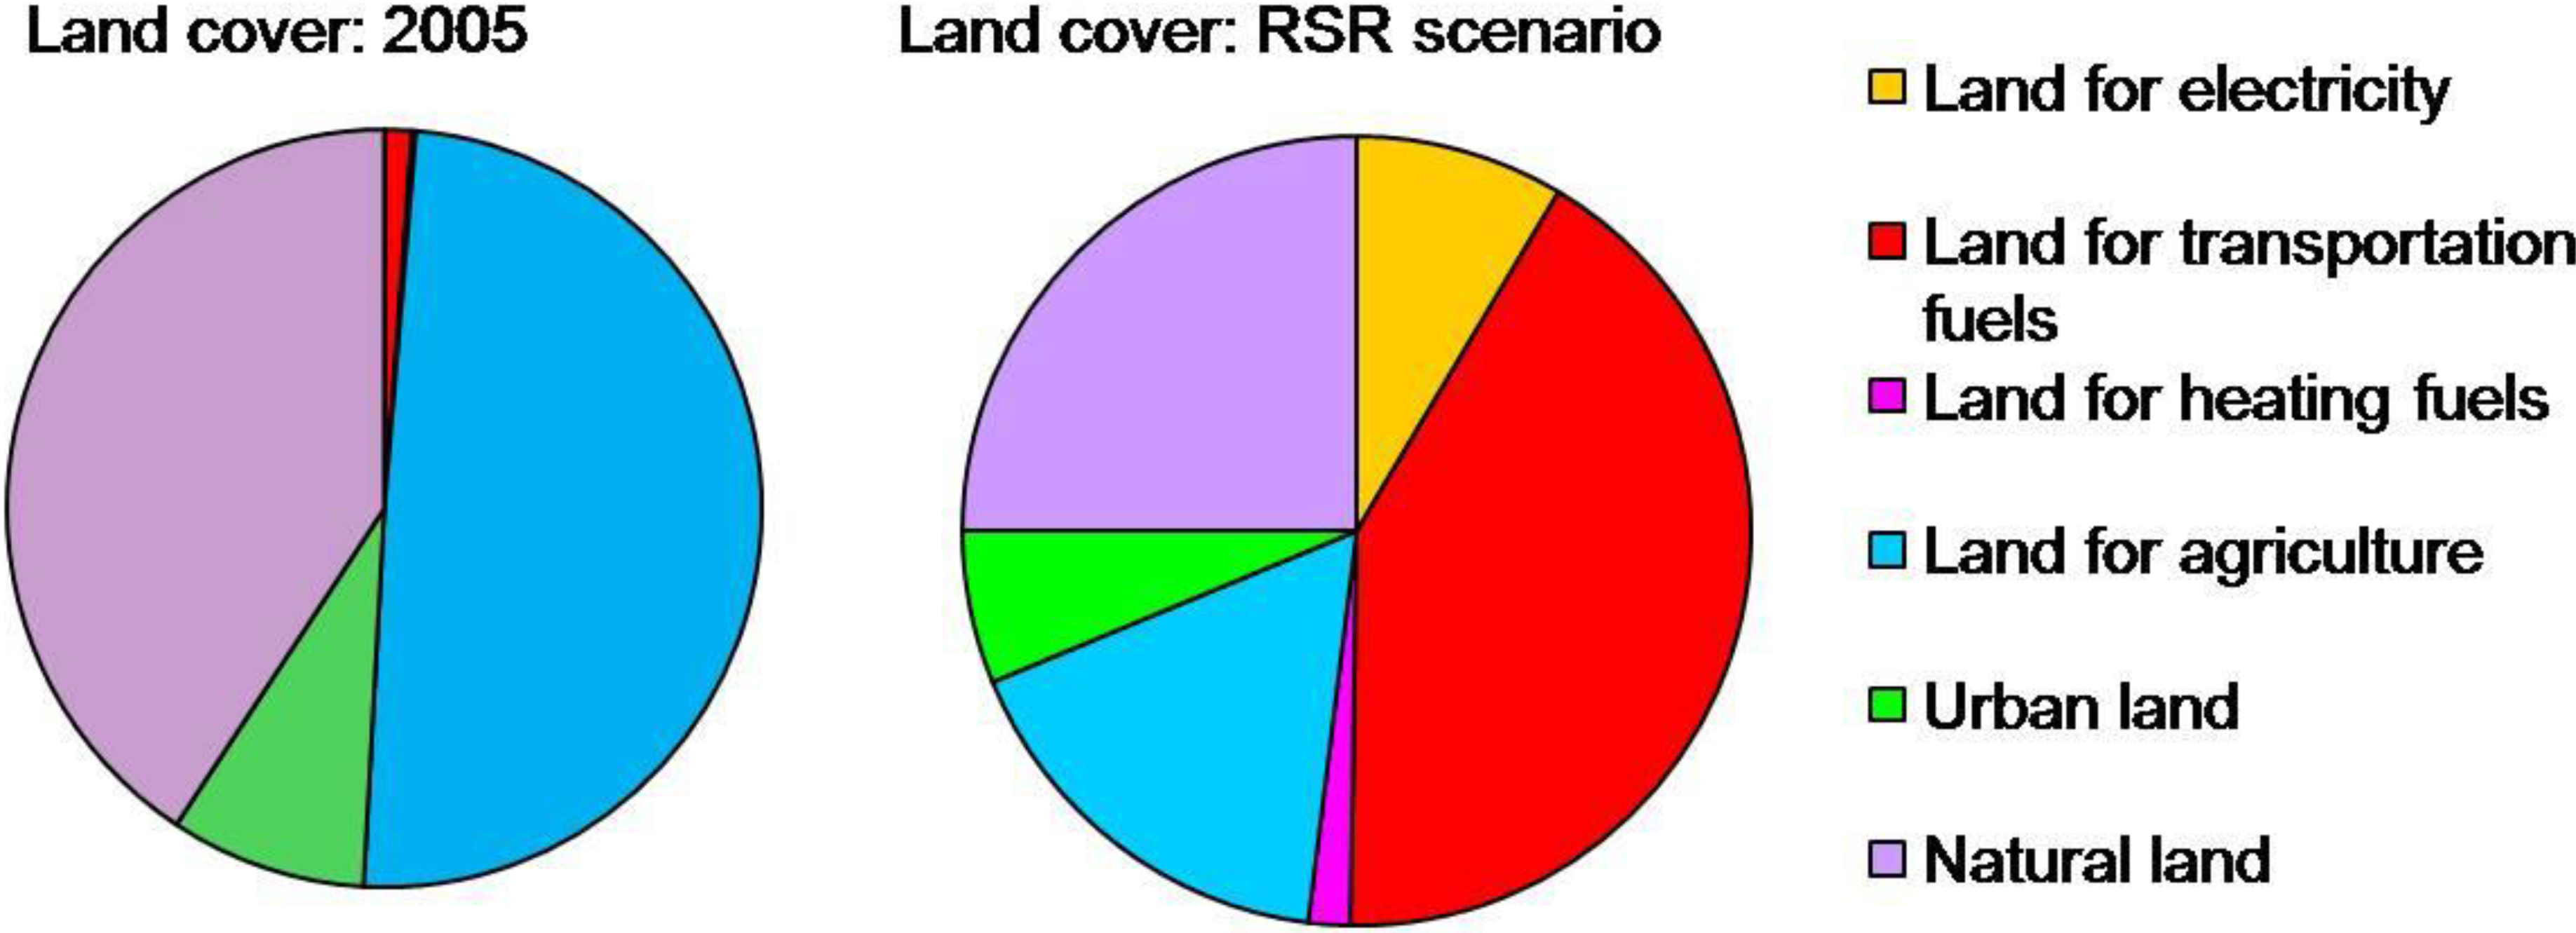
Figure 3.
Proportion of Minnesota land cover by type in the year 2005 and under the Regional Self-Reliance scenario. Note that the amount of land devoted to transportation fuels in this scenario is 21 million acres, or approximately 41% of Minnesota’s land area. This presumes that vehicle fleet fuel efficiency is increased to 35 miles per gallon, and that vehicle miles driven per person fall to ½ of 1990 levels (with this scenario’s population being 1.25 times Minnesota’s current population).
In Northwestern Minnesota, Phase I workshop participants developed a version of the regional self-reliance scenario titled, “Saudi Arabia of Biomass”, in which they envisioned producing enough cellulosic biofuels from native prairie grasses to fill all their own transportation needs and to export across the upper Midwest. Modeling output presented during Phase II revealed that there was not enough land in northwestern Minnesota to accomplish this type of production and simultaneously grow enough food for regional consumption. Some participants stated that seeing the model output helped them to understand the vast amounts of land required for motor fuel production, and the systemic connections between population, energy, and consumption. Other participants were more critical of the model, and questioned the model assumptions that vehicle miles traveled per person and average vehicle fleet fuel efficiency would be the same in 2050 as in 2005. A vigorous discussion ensued about how feasible it would be to reduce vehicle miles driven in rural Minnesota communities, given the relatively remote locations of stores, schools, and places of work.
In West Central Minnesota, a discussion of that region’s version of the regional self-reliance scenario centered on the amount of land allocated for regional food production. The modelers had parameterized the amount of land needed to produce enough food for one person throughout the year at 0.2 acres by consulting the literature (see
Appendices A–B). Several participants (some of whom were farmers) objected to this number, claiming that it was not applicable in Minnesota—but couldn’t agree on whether the number was too high or too low. The amount of land required to feed one person in Minnesota was therefore identified as a critical unexplored research question, and all agreed that this amount would depend on the type of diet consumed. In preparation for the statewide workshop, the modelers took participant feedback into account by interviewing several farmers and devising different land requirements for different types of diet corresponding with each scenario (see
Appendix B).
Corporate Industrialism: This scenario envisions a powerful state enforcing regulatory control over consumption of natural resources and pollution. Environmental refugees from other regions, fleeing climate change impacts are kept out of Minnesota through force. Greenhouse gas emissions of individuals and companies are monitored and tightly controlled. Minnesota’s economy is dominated by industrial production.
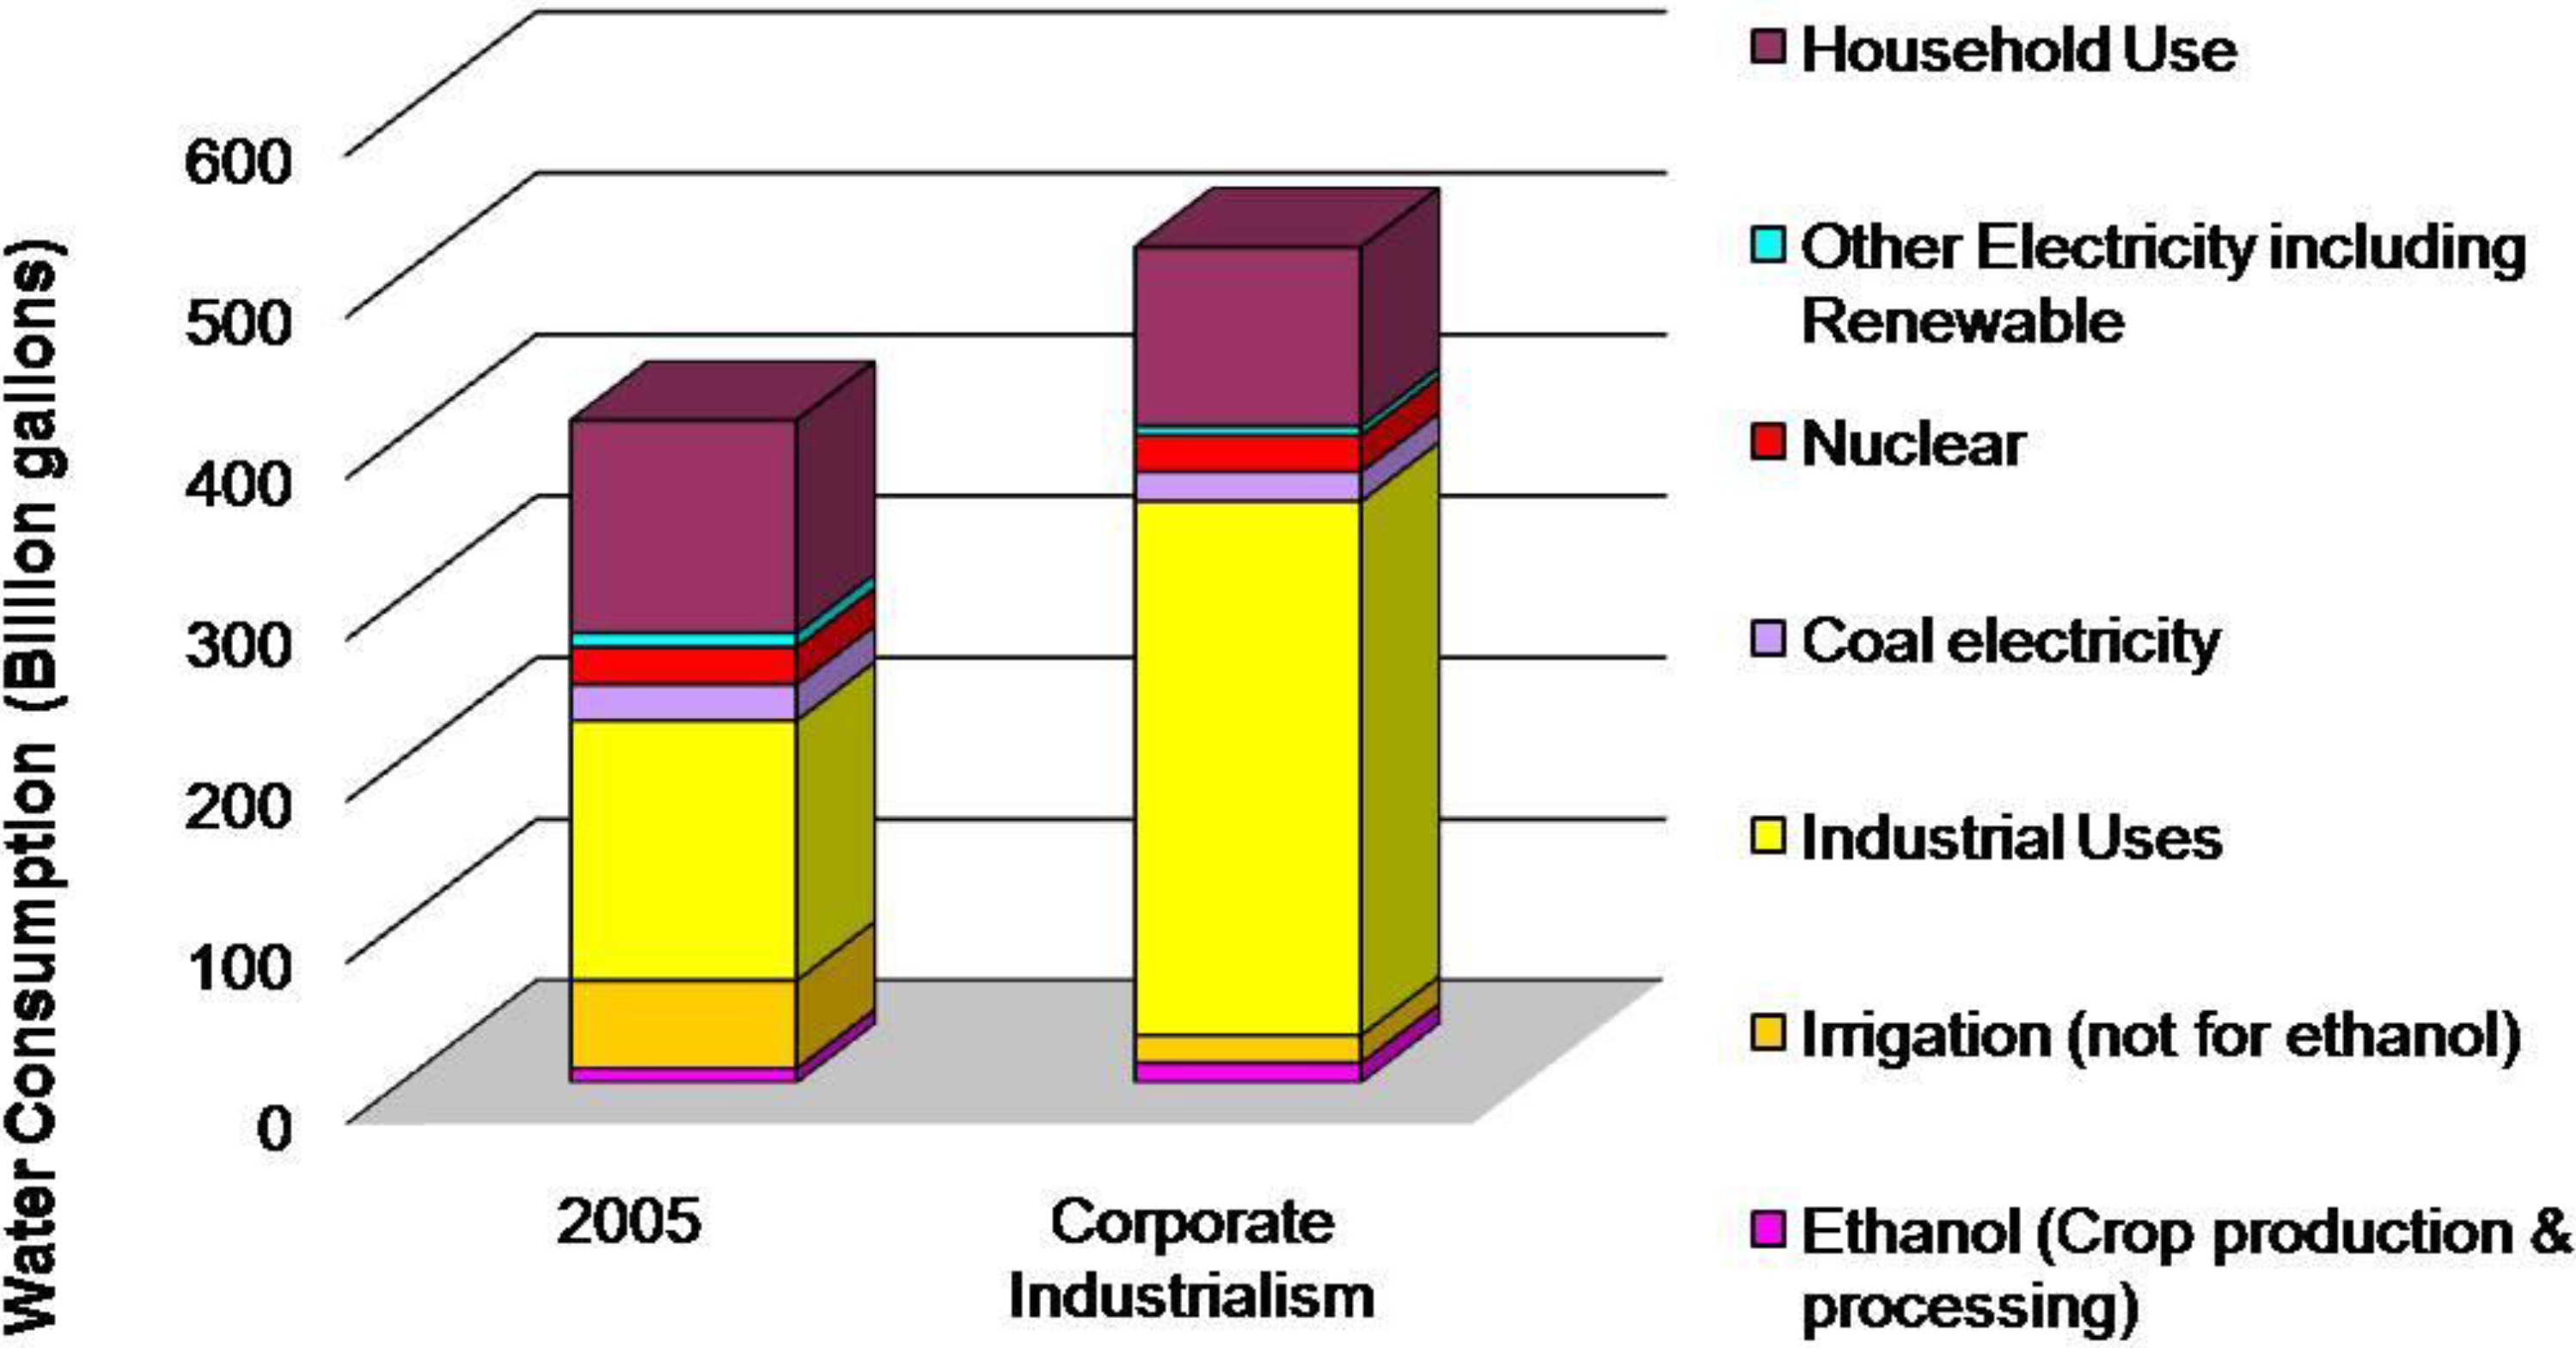
Due to strict regulatory controls on consumption in this scenario, energy use was lower in the model output compared with Minnesota in 2005. However, water consumption was higher due to the scenario’s shift towards industrial production rather than natural resource industries. The particular industries which might use water in this scenario were not specified. Some workshop participants were surprised to learn that more water is currently consumed in Minnesota for industrial purposes than for agricultural irrigation (
Figure 4). This figure depicts water
consumption rather than withdrawals, so water returned to rivers or lakes after being used for cooling is not included as part of the total.
Figure 4.
Water consumption by end use, in billion gallons annually, for Minnesota in the year 2005 and for the Corporate Industrial scenario.
Figure 4.
Water consumption by end use, in billion gallons annually, for Minnesota in the year 2005 and for the Corporate Industrial scenario.
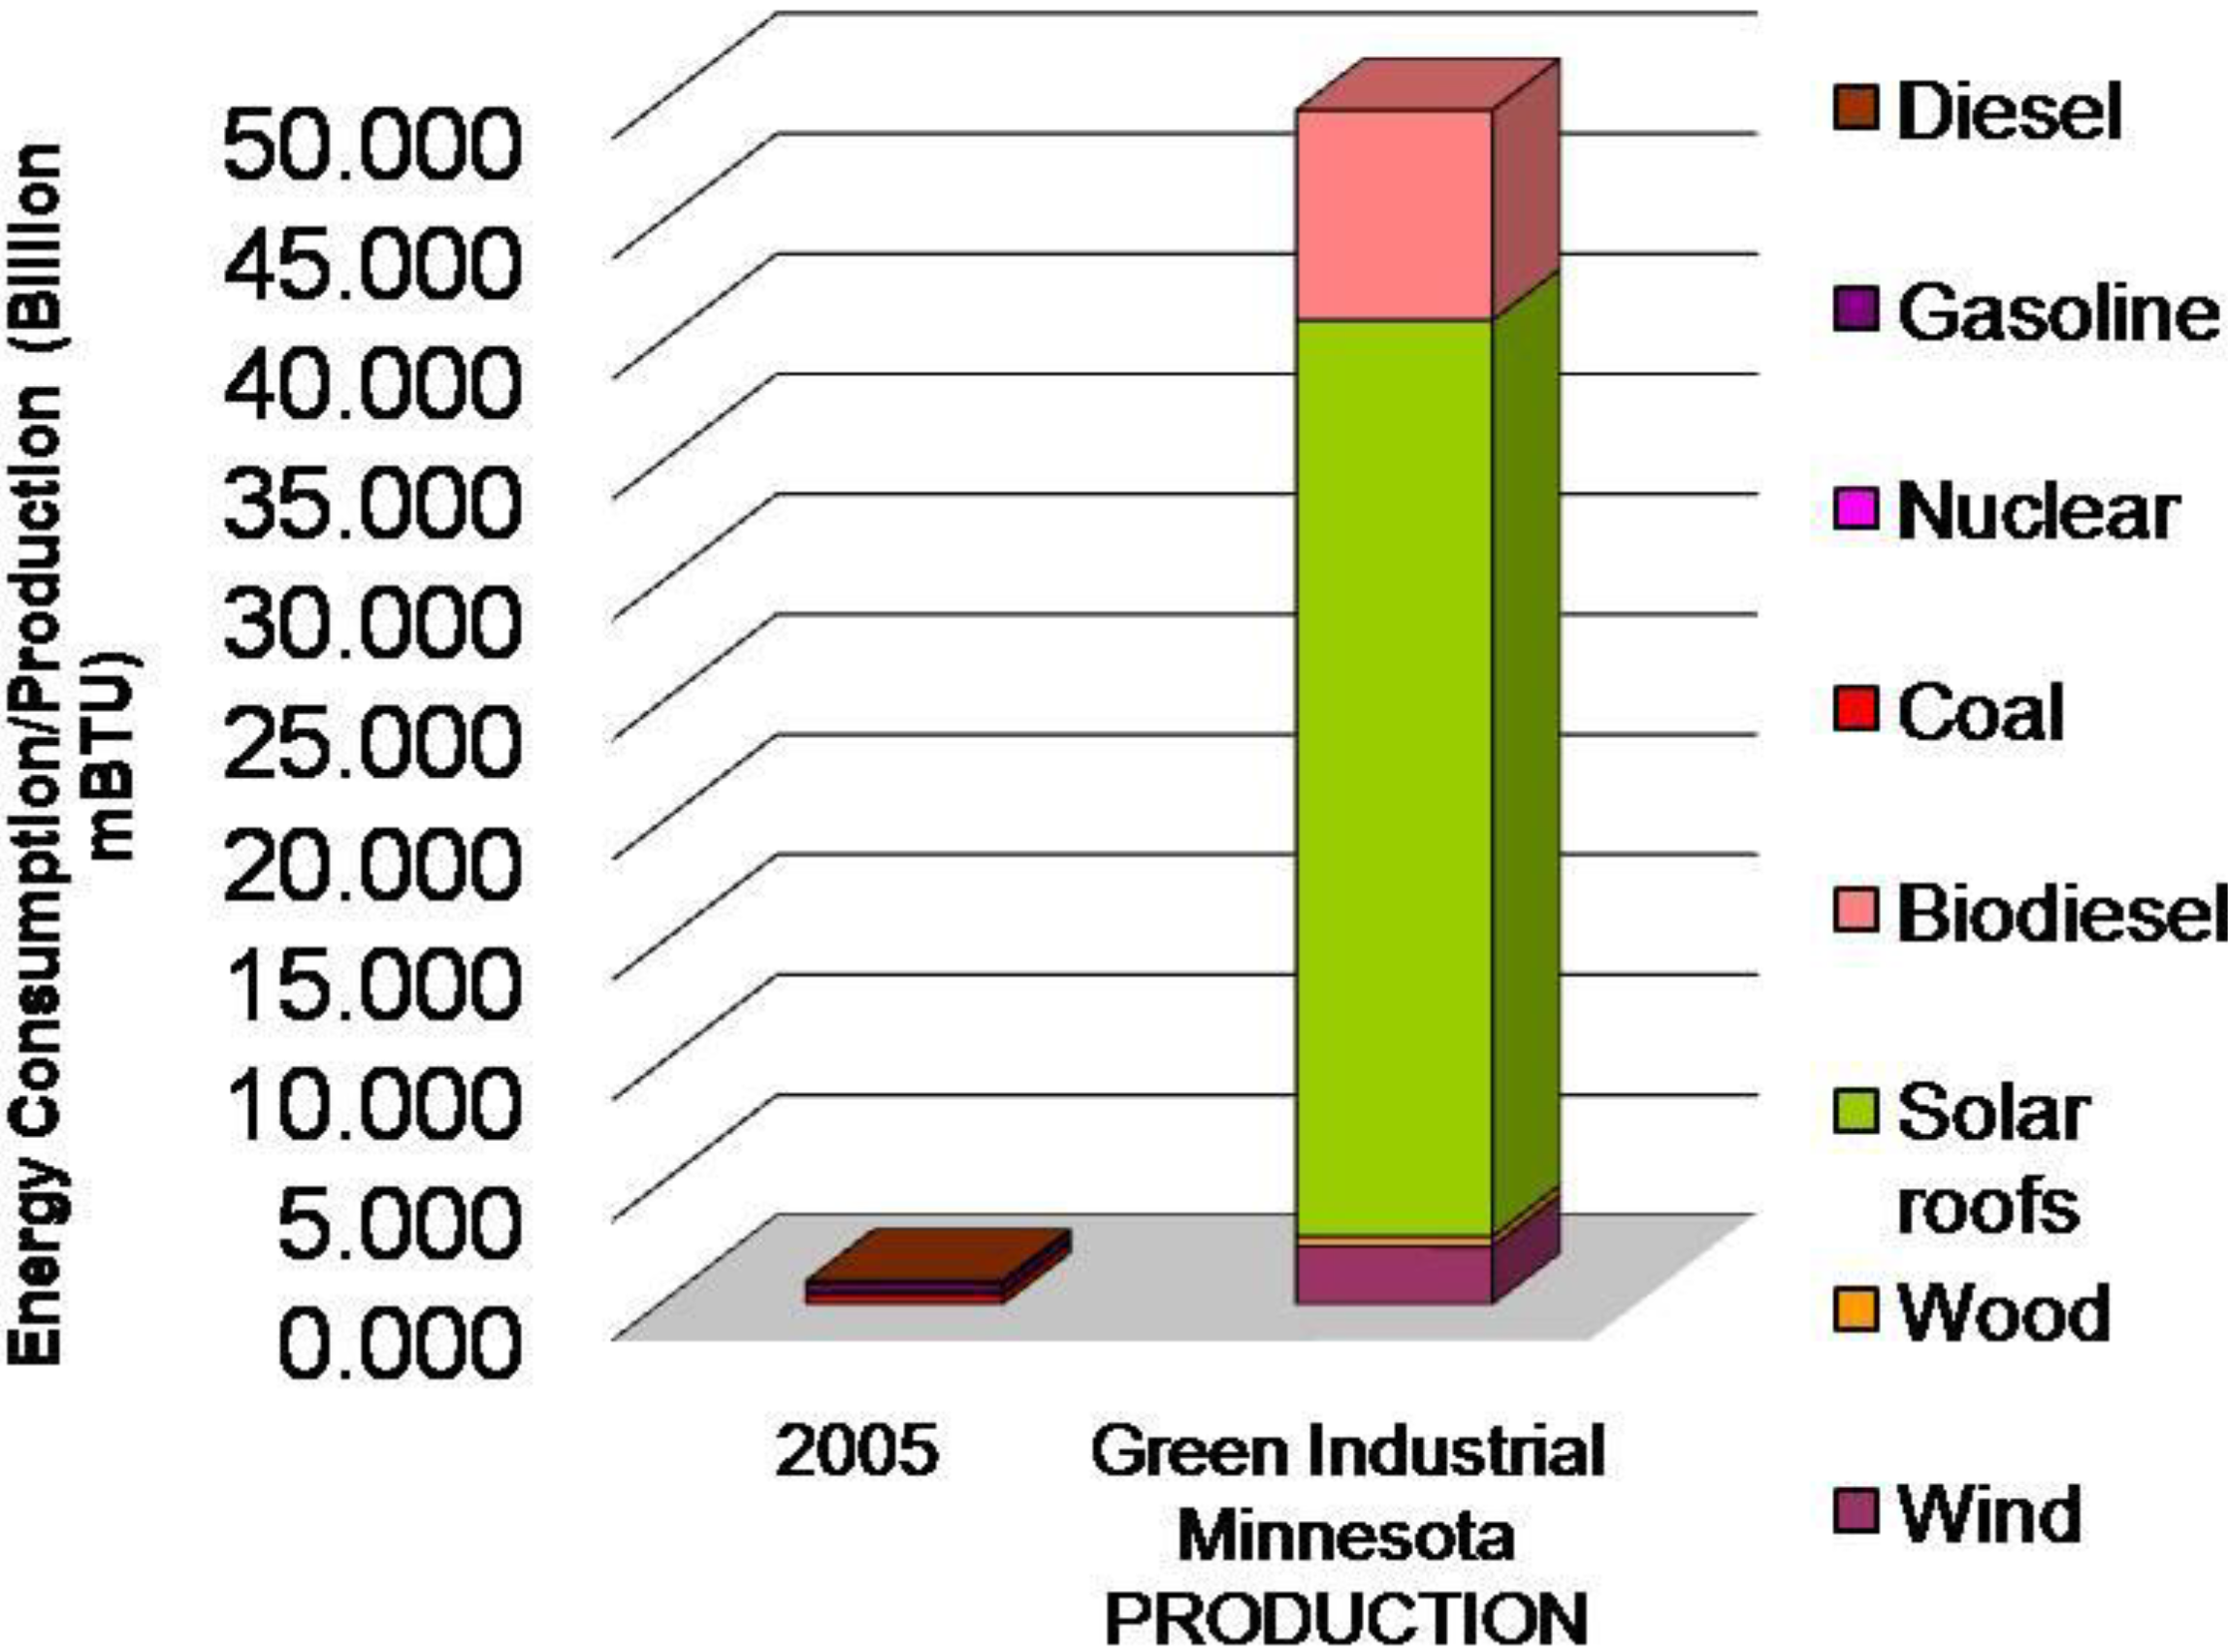
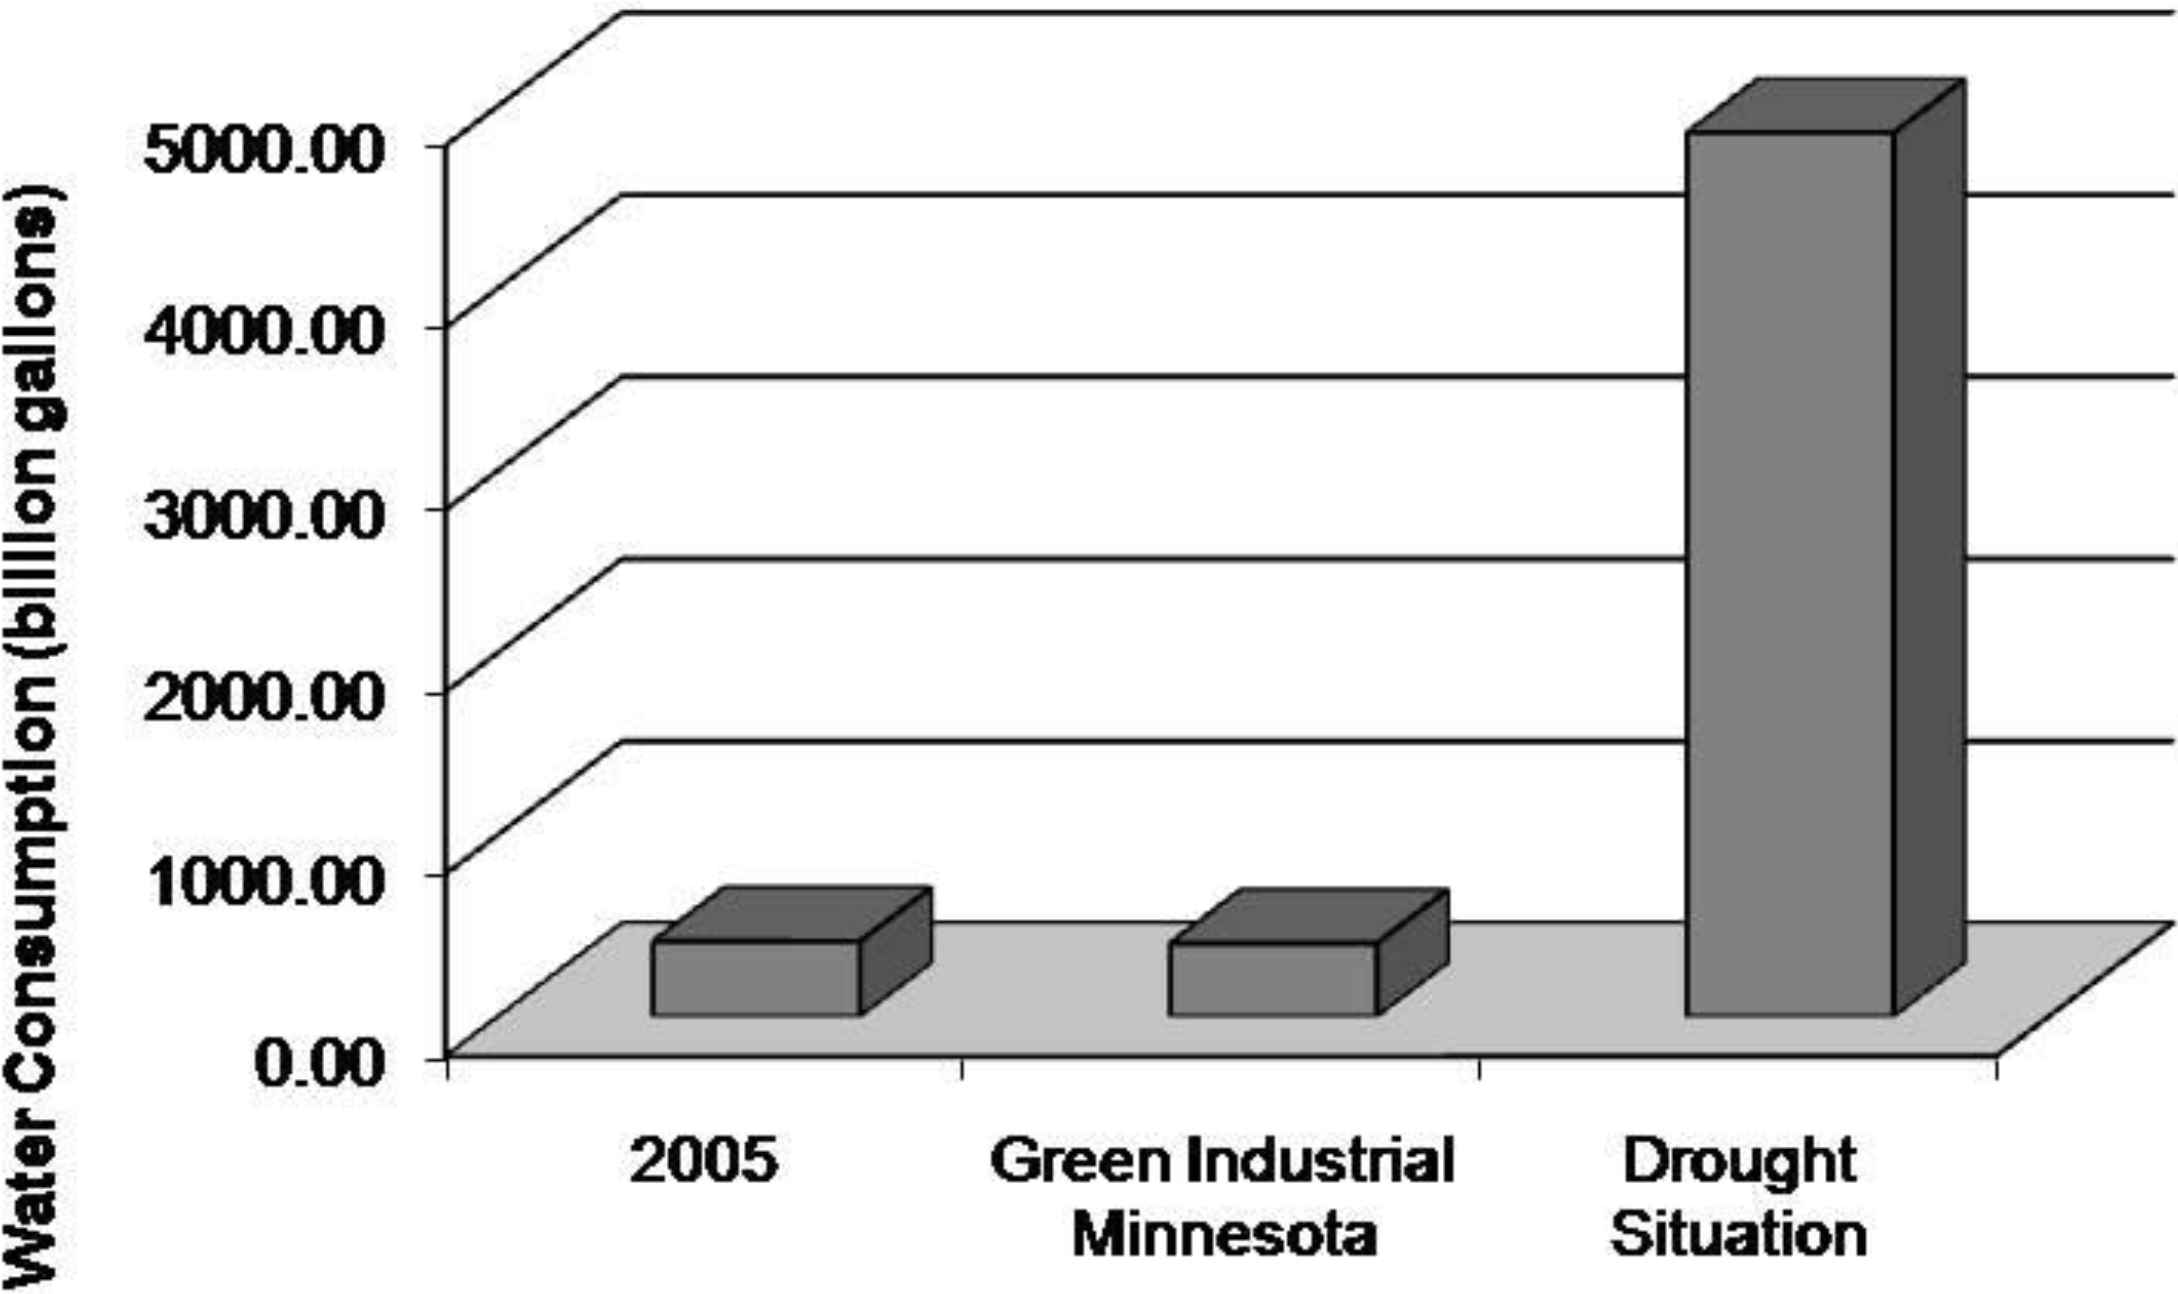
Green Industrial Minnesota: In this scenario, Minnesota has become a center of alternative fuel production. The state is energy-independent, and its energy portfolio includes electric train transport, hydrogen fuel cell cars, wave power generation in Lake Superior, biofuel produced from wood, waste, agricultural by-products, and algae, and solar panels. All of the state’s land is given over to fuel production, and population has increased as people move to Minnesota to work in the energy sector.
This scenario also generated considerable discussion, with the modeling output demonstrating the large renewable energy potential in Minnesota, but also the impact of producing this energy on the state’s natural resources (
Figure 5). With all land that could feasibly be covered by a solar panel, an (indoor) algal bed, or woody biofuel crops in production, only a tiny amount of land is left for natural areas (
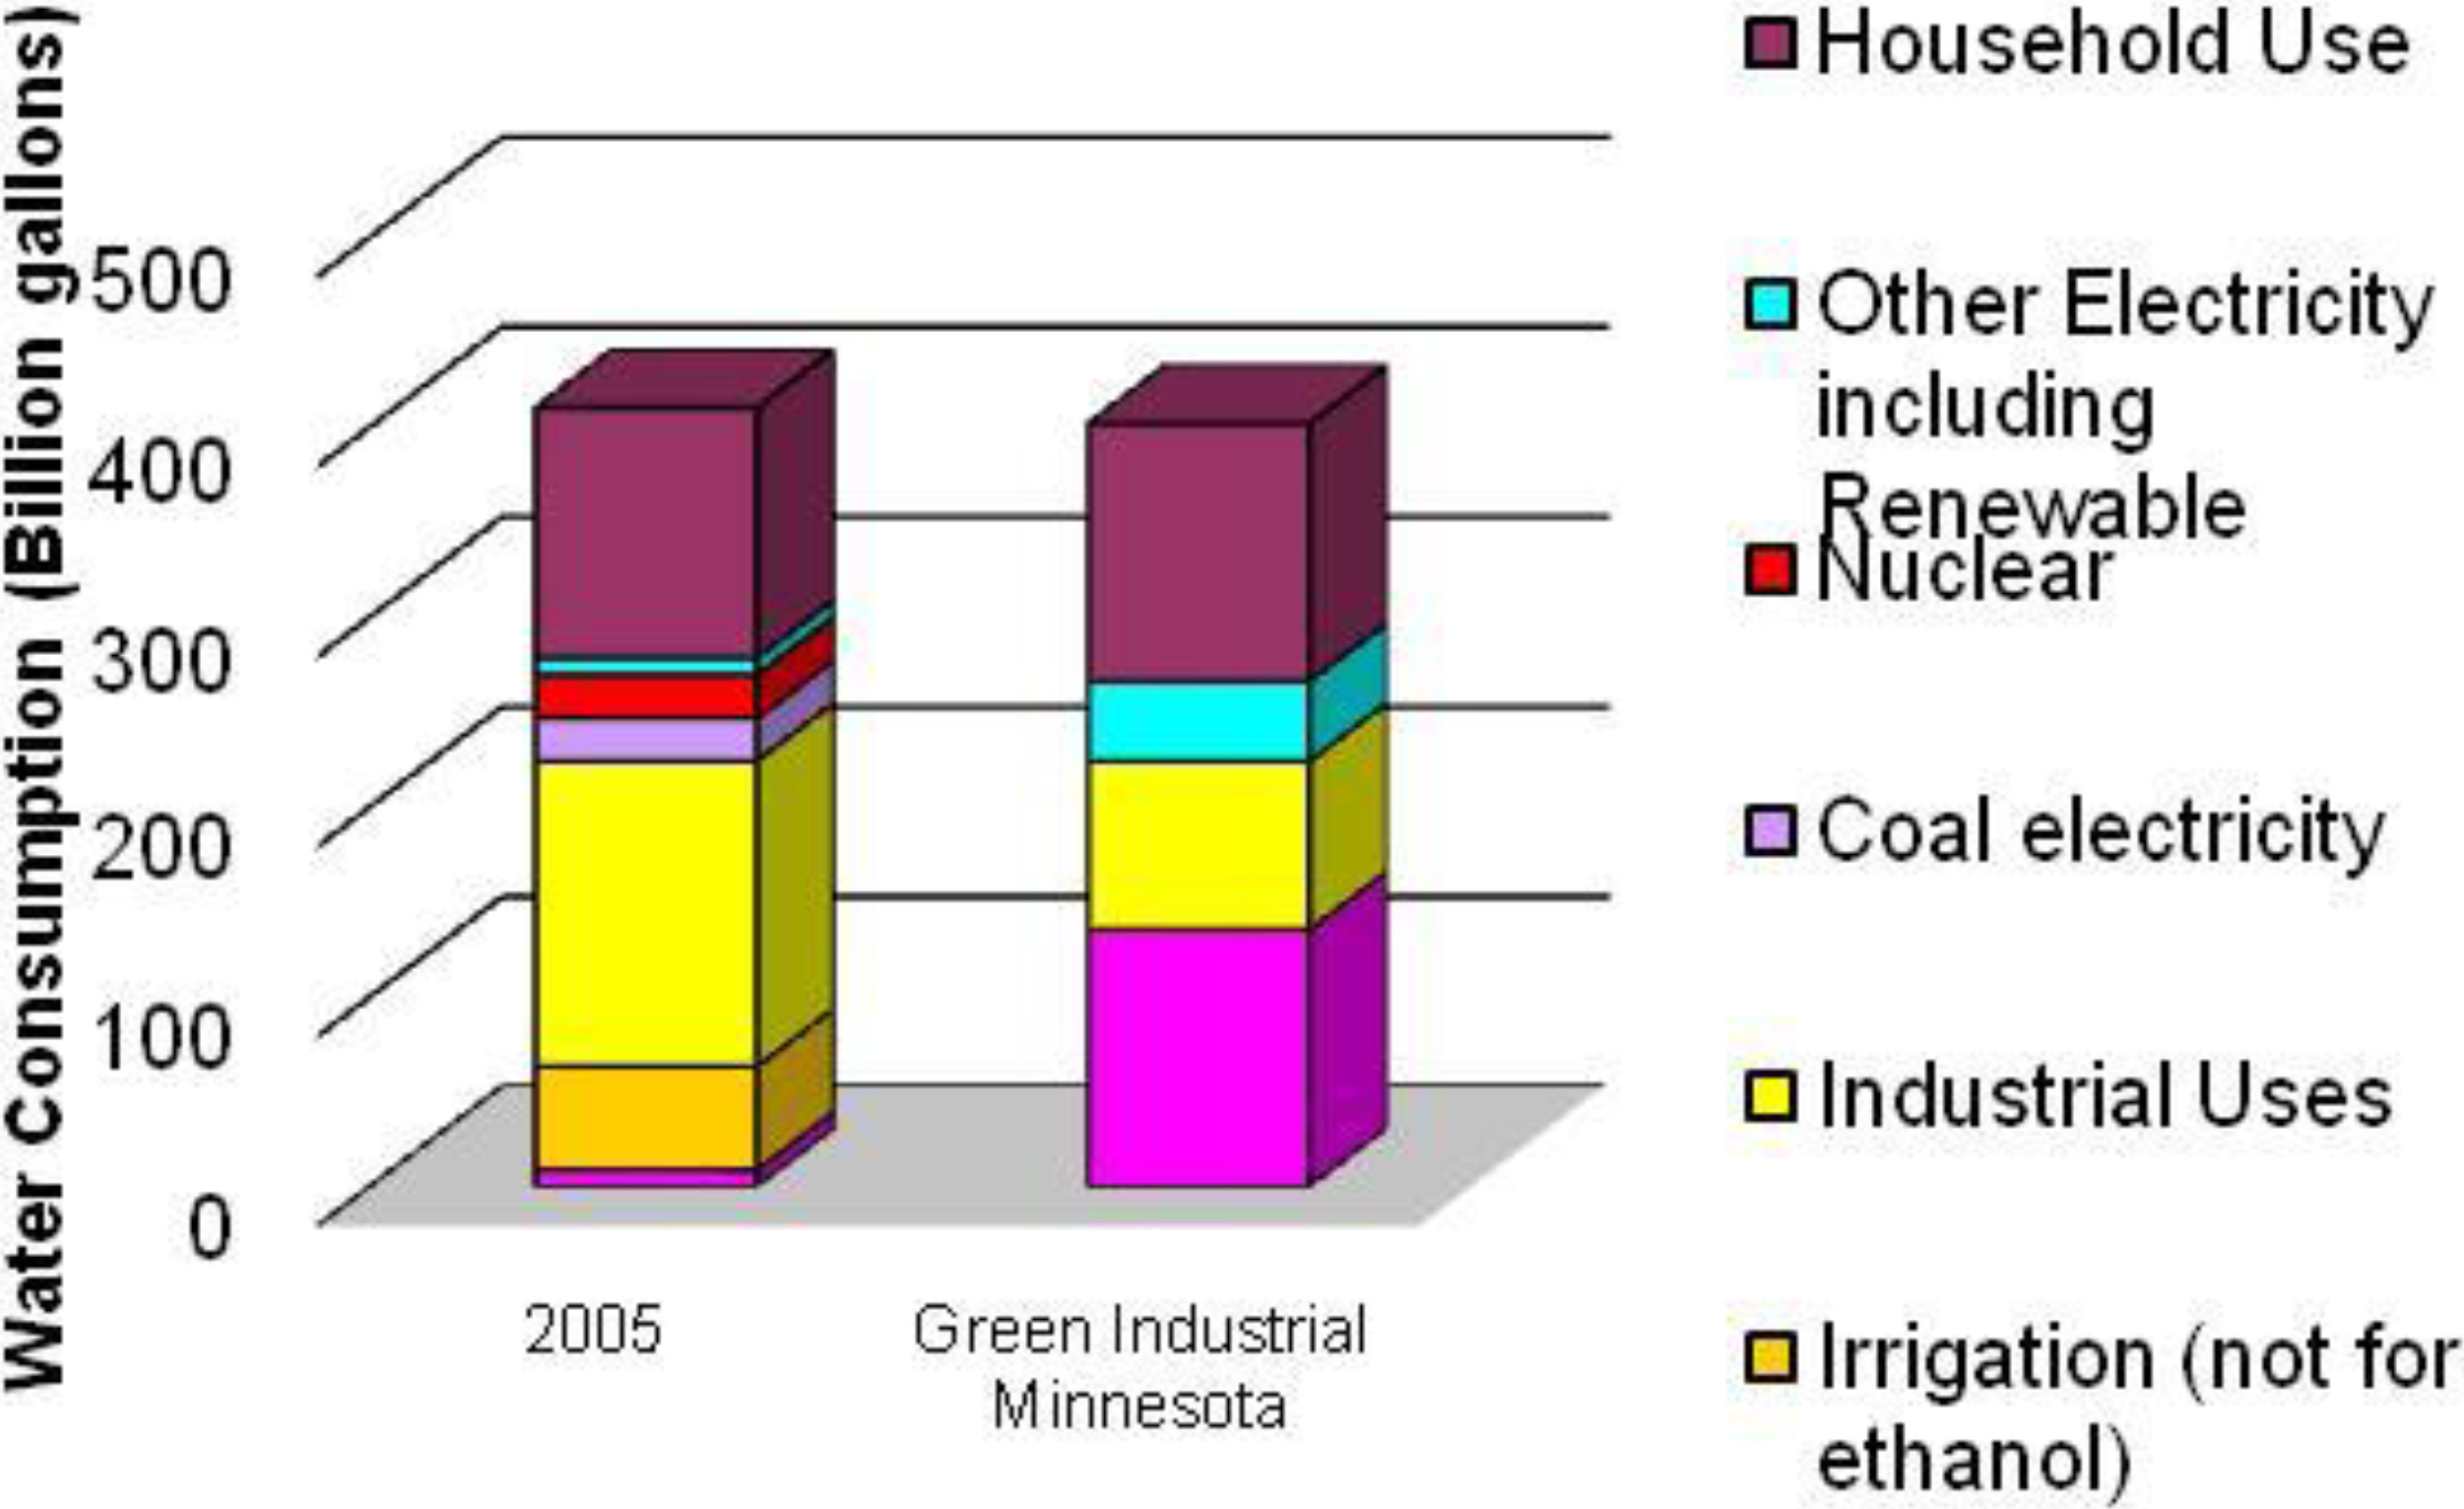
Figure 6). Water requirements in this scenario are not more than 2005 water consumption in Minnesota, in spite of the high levels of alternative energy production. This is because of water re-use programs in both electricity and biofuel production processes, as well as a presumed increased efficiency in household water use (
Figure 7). However, this scenario is viewed as drought-susceptible, because more water would be required to irrigate short-rotation woody biofuel crops in a low rainfall year. In an extremely dry year, therefore, irrigation requirements would increase to the point at which aquifer levels would be drawn down statewide (
Figure 8).
Figure 5.
Energy consumption by fuel type, in billion mmbtus, for Minnesota in the year 2005 and energy production for the Green Industrial Minnesota scenario. Note that energy production in this scenario reaches 2.9 times current United States electricity production and 1.5 times current United States diesel fuel consumption.
Figure 6.
Proportion of Minnesota land cover by type in the year 2005 and under the Green Industrial Minnesota scenario.
Figure 6.
Proportion of Minnesota land cover by type in the year 2005 and under the Green Industrial Minnesota scenario.
Figure 7.
Water consumption by end use, in billion gallons annually, for Minnesota in the year 2005 and for the Green Industrial Minnesota scenario.
Figure 7.
Water consumption by end use, in billion gallons annually, for Minnesota in the year 2005 and for the Green Industrial Minnesota scenario.
Figure 8.
Water consumption, in billion gallons annually, for Minnesota in the year 2005, for the Green Industrial Minnesota scenario, and for the same scenario under a drought. Water consumption is higher in this case because of increased biofuel crop irrigation requirements during a drought. Note that the estimated amount of water available for human consumption annually in Minnesota (before water needed for aquifer recharge and natural systems is depleted) is between 500 and 1500 billion gallons; and this scenario’s consumption in a drought year is far above that amount (See
Appendices A–B for data sources).
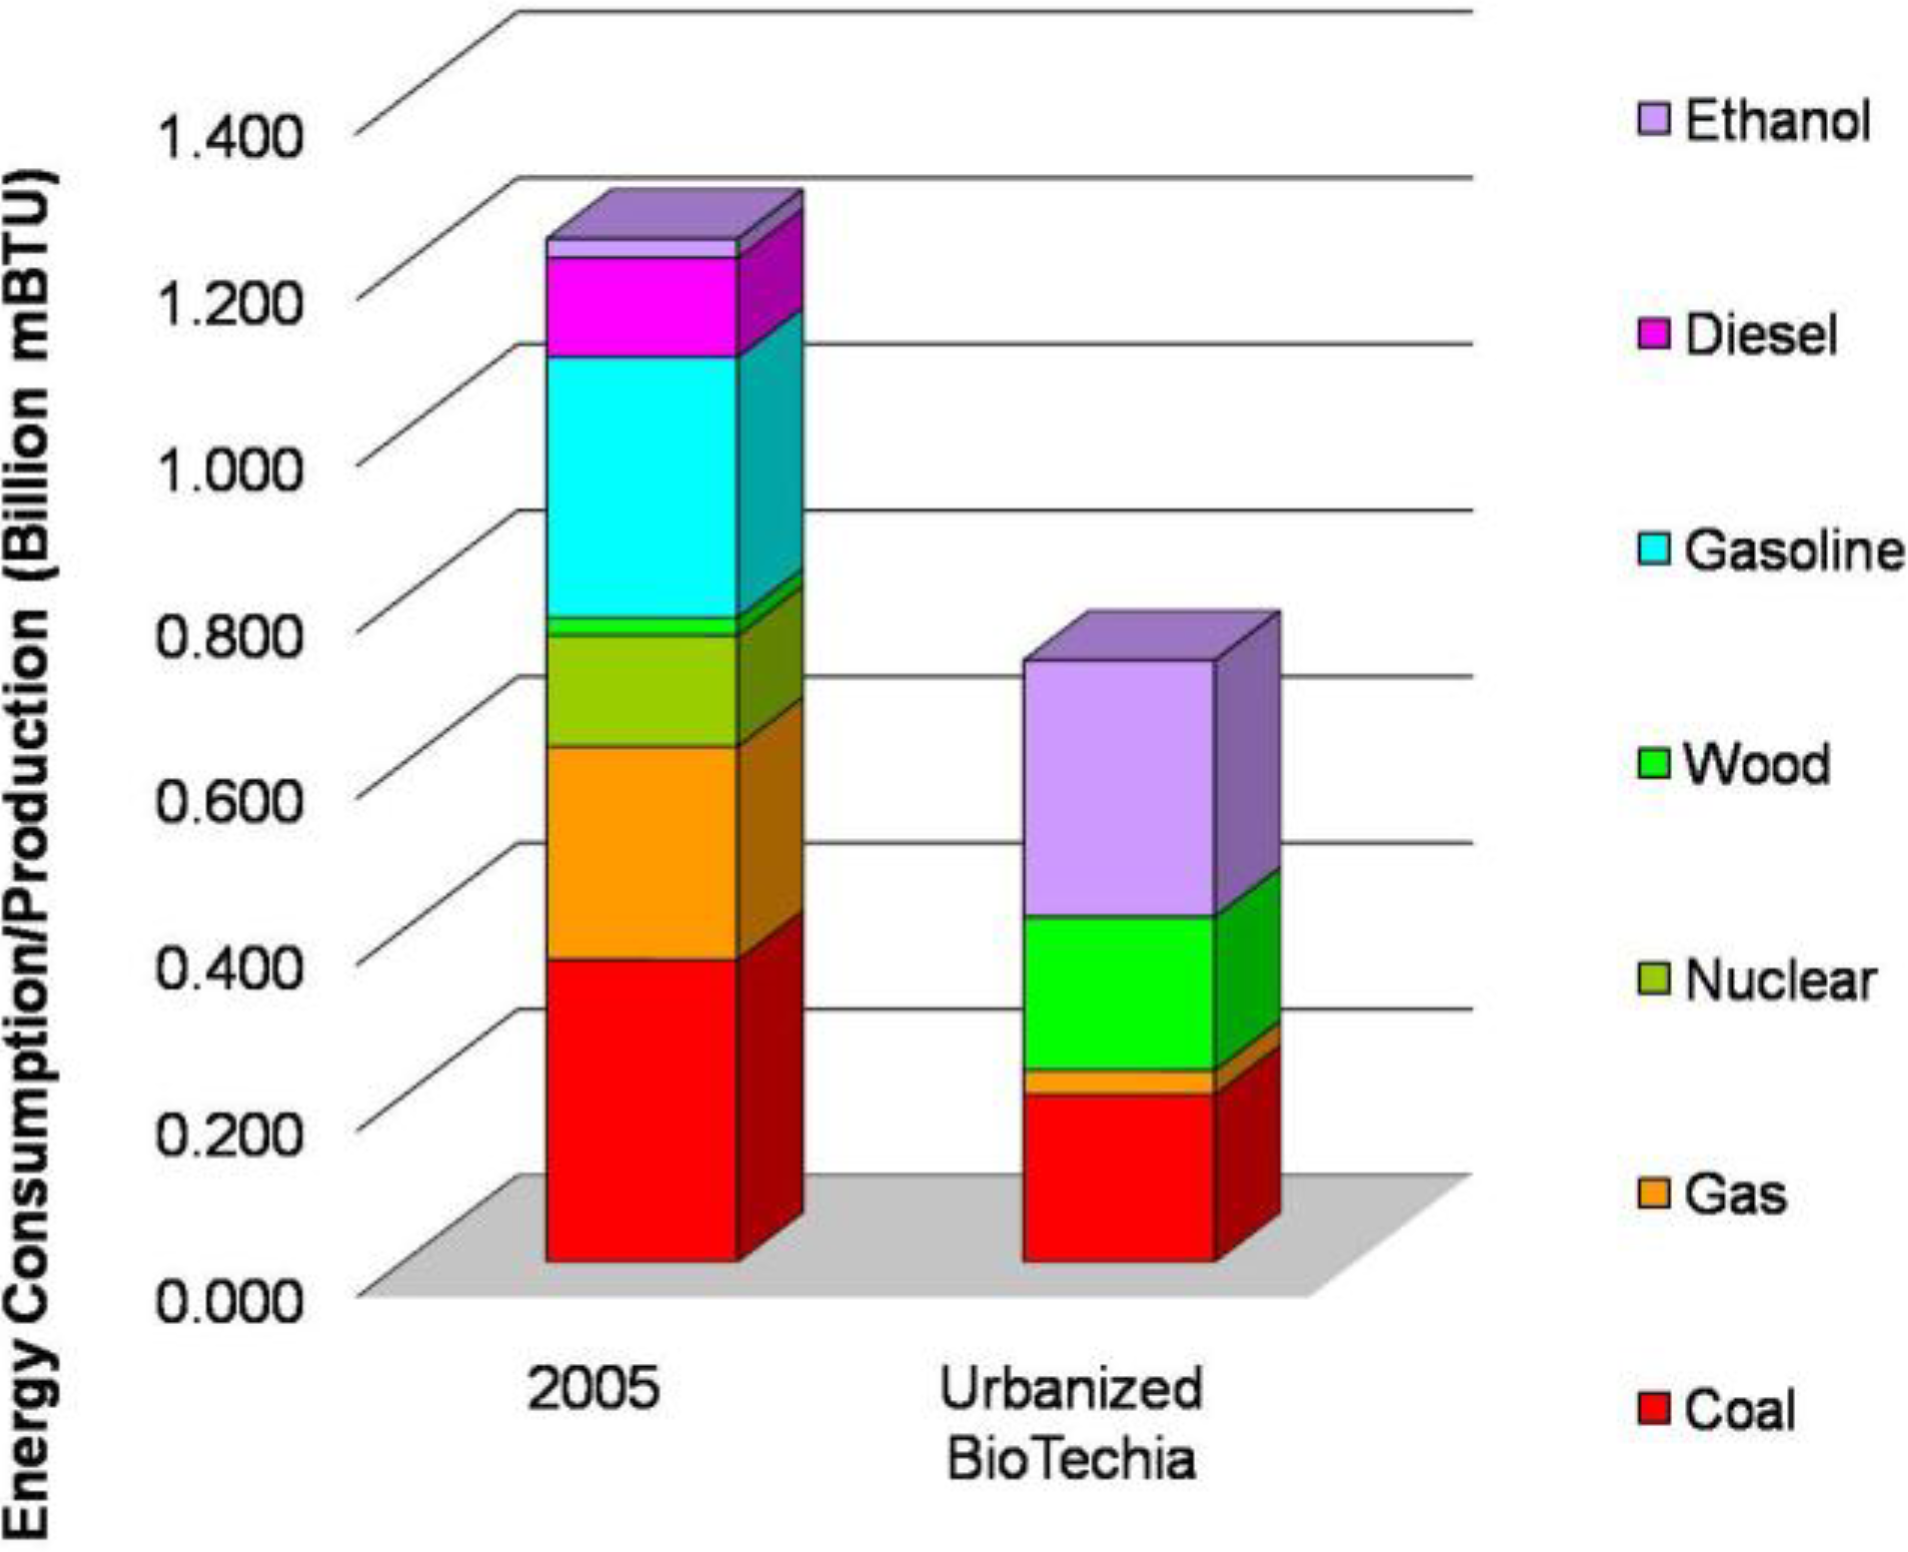
Urbanized BioTechia: Minnesota has become predominantly urbanized in this scenario, and the economy focuses on manufacturing (pharmaceutical and biomedical commodities; hence the scenario name), rather than natural resource-based industries. However, this scenario differs from the Corporate Industrialism scenario in that society is relatively lawless; the wealthy hire private armies to protect their assets. Energy trade is restricted to the upper Midwest region, as international conflict and rising oil prices have made fossil fuel imports prohibitively expensive. Coal from the Dakotas supplies fuel for electricity, and biofuel is used for transportation. There is a small middle class population and many urban poor, while the few wealthy control many of the resources.
The modeling output demonstrated that an urbanized Minnesota, with fewer middle class households, would also have a lower overall energy consumption, which was surprising to some participants. Part of the vision for this scenario was an increase in nuclear power, which supplants some coal-powered electricity (
Figure 9).
Figure 9.
Energy consumption by fuel type, in billion mmbtus, for Minnesota in the year 2005 and for the Urbanized BioTechia scenario.
Figure 9.
Energy consumption by fuel type, in billion mmbtus, for Minnesota in the year 2005 and for the Urbanized BioTechia scenario.
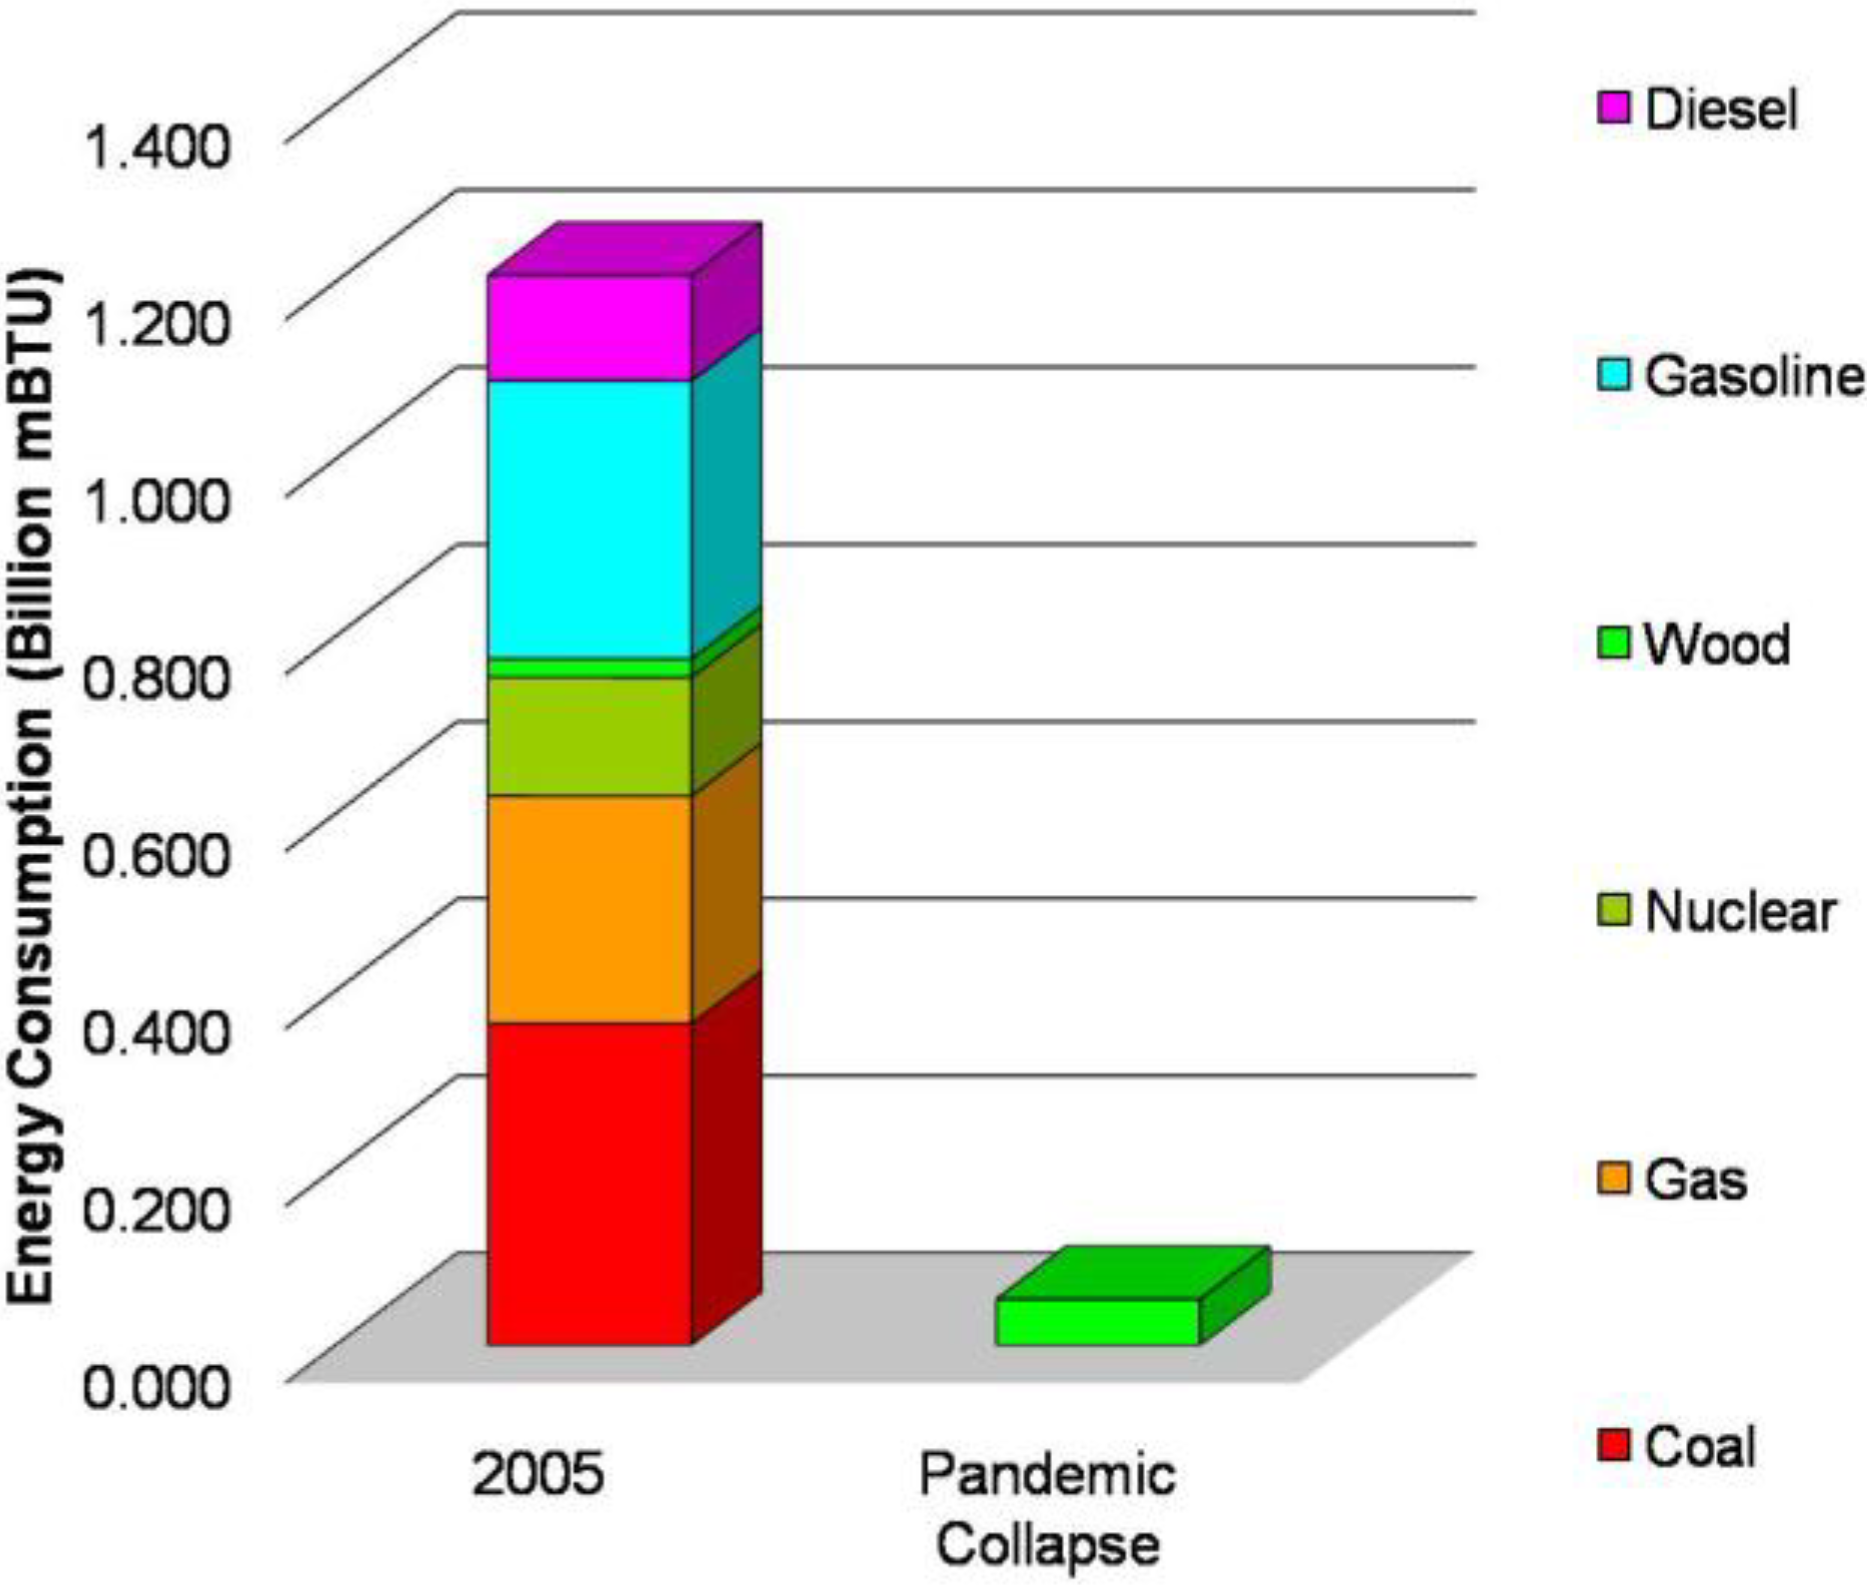
Pandemic Collapse. This scenario envisioned global populations being decimated by a highly virulent disease, causing a nearly complete breakdown of government infrastructure, energy, and food production systems. This leads to an immediate and sharp reduction in greenhouse gas emissions and consumption by Minnesota’s population. Residents flee the cities to rural temporary encampments, in order to avoid contagion.
Modeling output for this scenario demonstrated the tight linkage between affluence and consumption. With Minnesota’s population regressing to a level of resource use associated with the modern developing world, the use of any fuel source except for wood declined to zero (
Figure 10).
Statewide Workshop Modeling: At the statewide workshop, participants interacted with the model by filling out input sheets for parameters to be entered into the model. After viewing the model output from the five “archetypal” scenarios, participants expressed awareness of the environmental impacts of energy consumption, and many wanted to reduce these impacts by lowering consumption—thus, entering lower numbers on the input sheet for electricity use per person, heating fuel use per person, or vehicle miles traveled per person. Almost all participants viewed algal biodiesel as a promising fuel (which may or may not be true), while the expansion of nuclear power remained an unpopular option—no one included increased nuclear power output in their desired model parameters.
Figure 10.
Energy consumption by fuel type, in billion mmbtus, for Minnesota in the year 2005 and for the Pandemic Collapse scenario.
Figure 10.
Energy consumption by fuel type, in billion mmbtus, for Minnesota in the year 2005 and for the Pandemic Collapse scenario.
After the modeling exercise, statewide workshop participants were encouraged to reflect on the Statewide Conservation and Preservation Plan conclusions in light of the scenarios generated during the Minnesota 2050 project. Participants identified conservation-based community planning, keeping water “on the landscape” (i.e., conserving water and preventing excessive runoff), and protecting priority wildlife habitat as the SCPP recommendations that aligned most closely with the goal of ensuring the long-term sustainability of Minnesota communities and resources.
4. Discussion
In designing the Minnesota 2050 project, we were careful to avoid an excessive focus on the scenarios and the model output as “products”. As described above, the objectives of Minnesota 2050 were to enhance systemic thinking and strategic agility on the part of the workshop participants, and to identify critical knowledge gaps around energy, food, and water systems in Minnesota. Any five scenarios and corresponding model output could have achieved these objectives, which is why this discussion will focus on the learning from the scenarios and model outputs and from participants’ experience of the interaction between the model and the scenarios, rather than the scenarios and output themselves.
Because we were not deliberately crafting the modeled scenarios to represent divergent futures from which to choose (as with the Intergovernmental Panel on Climate Change’s climate scenarios, for example), we do not claim any scientific “likelihood” associated with these scenarios. All of the variable relations in the model are supported by the literature and by historical data, and informally validated through discussions with workshop participants (see
Appendices). We therefore believe the internal logic of the scenarios to be sound. However, we are making no quantitative claims about the probability of any scenario coming to pass; this was not the objective of our work.
It was clear during the model output discussions at both regional and statewide levels that modeling introduced a new element into the scenario discussion by emphasizing feedbacks, tradeoffs, and biophysical limits. We provide two examples. First, many workshop participants envisioned using Minnesota’s land to grow alternative fuels—but were unaware of the potential consequences for land and water resources. Such knowledge gaps are not limited to stakeholder workshops: a Minnesota state panel appointed by the Governor formally recommended a variety of biofuel and land sequestration policies as a means of meeting a state goal on reducing greenhouse gas emissions [
25], but careful quantitative analysis showed that many of these recommendations would not work as planned because of failure to consider the realities of a limited land base and competing uses [
26,
27]. A coupled scenario and systems dynamics approach could have helped avoid such a problem.
Second, many MN 2050 participants envisioned increasing regional population in Minnesota’s rural areas—but hadn’t considered the additional energy and resources these new people would consume. If these residents moved from urban to rural Minnesota (a plausible and even desirable scenario envisioned by some rural residents), overall state consumption of both energy and water would increase, as consumption rates are higher in rural areas than in urban environments. The model output presentation allowed us to bring to the surface these feedback relations and talk about them explicitly.
As other participatory modelers have pointed out, the modeling process can enhance learning and understanding for researchers as well. We were relatively unaware of an intriguing research gap identified through Minnesota 2050: the land requirements of a regionally produced diet. The local food movement is becoming increasingly popular in American culture and political discourse, but real quantitative analysis of the impacts of a local diet on land, water and energy resources remains lacking, with few exceptions [
28,
29].
The modeling component of this project was not as participatory as it might have been, in part due to logistical constraints and in part as a design feature. It was not constructed with stakeholders and researchers working together in the same room throughout the process [
5]. Rather, workshop output was passed between community leaders and modelers successively. Because the model scenarios were based on community leaders’ own visions, workshop participants tended to recognize their beliefs and priorities embedded in the model. However, some workshop participants questioned how the model was built, and the quantitative assumptions behind modeled relationships, because they were not involved with these steps of model building. Working with community leaders to build a quantitative model and define parameters and assumptions would have been time-consuming, but perhaps would have increased acceptance of model output and would have improved dialogue between the imaginative scenarios and the model output.
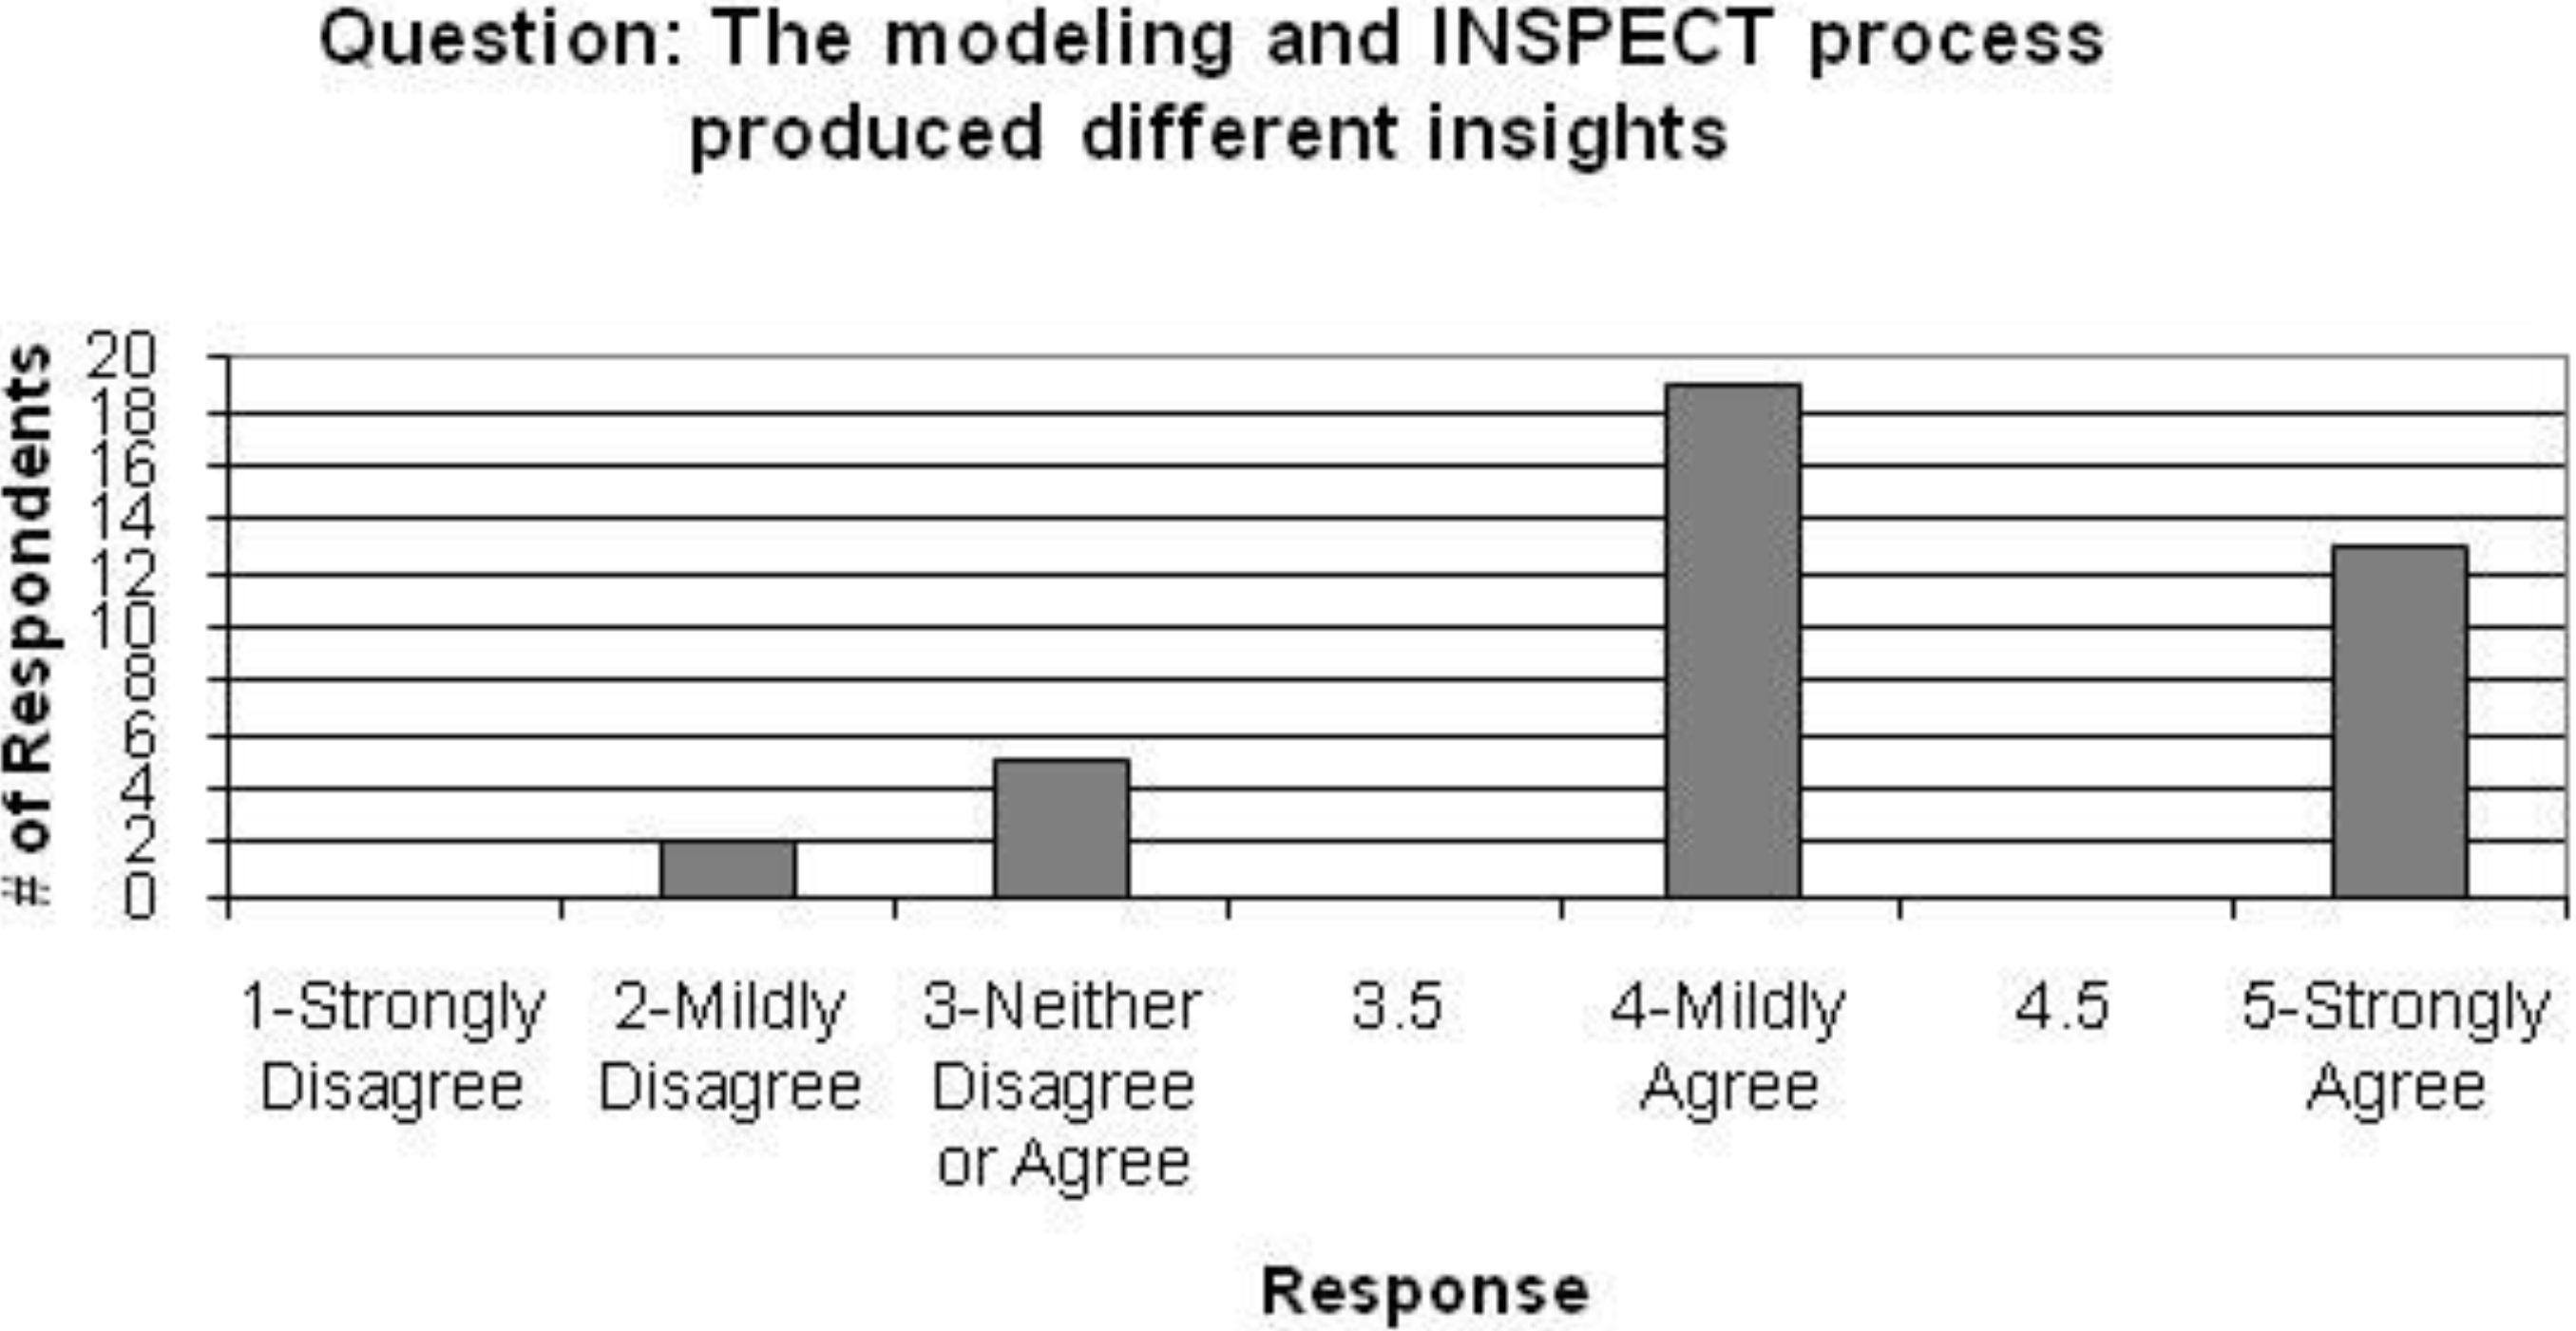
At another extreme, some workshop participants, after viewing model output that seemed to challenge assumptions of envisioned scenarios, immediately stated that the scenarios must be “wrong” and the quantitative model output “right”. Through discussion, we attempted to mediate participant tendencies to either dismiss model output entirely or to privilege it above the scenario narratives, by discussing the importance of assumptions. A result was that 82% of surveyed participants agreed with the statement, “The modeling and INSPECT [scenario process] produced different insights” (
Figure 11). This leads us to posit that similar kinds of participatory interactions could mediate the extremes of distrust or blind acceptance the American public holds for other widely used quantitative models, such as climate or toxicology models [
30].
Figure 11.
Participant response from post-workshop surveys regarding the insights gained from modeling and scenario processes.
Figure 11.
Participant response from post-workshop surveys regarding the insights gained from modeling and scenario processes.
We made a deliberate decision to use model output as a “snapshot”; that is, to use scenario-derived relations to run the model only for the year 2050. We did this so that workshop participants would focus on sustainable thinking across multiple plausible futures, rather than attempting to design variable relations and parameters to achieve a desirable future state. However, with enough time and resources, we could have run the model from 2050 to 2100 (for example) to test participants’ suggested actions for efficacy and sustainability in each of the scenarios. We could also have tested participants’ “backcasting” suggestions from Phase II—that is, the present-day actions they suggested for making communities in the year 2050 resilient to any plausible future. This type of modeling would be especially appropriate and useful for communities using this combined scenario-modeling methodology to generate specific action recommendations towards achieving a goal, such as devising an alternative energy plan.
One less successful aspect of the modeling exercise was the interactive modeling we attempted at the statewide workshop. Statewide workshop participants (including Minnesota state legislators and state agency representatives) had not participated in constructing the scenarios or model assumptions during Phases I and II. Therefore, we intended for the modeling exercise to provide a briefer way for them to participate in constructing their own scenarios, by altering assumptions about key water, energy and population parameters and observing the modeled results. We were unable to use the (I)NSPECT scenario construction process because it required more time than would be allotted by much of our target audience of state-wide leaders, particularly state legislators. (Even though the one-day statewide workshop was half the length of prior workshops, one-quarter of the participants, including several state legislators, did not attend all of it). However, unlike the (I)NSPECT process, which encourages participants to imagine system shifts and discontinuities, inputting variables into a model encouraged participants to think they could design an “ideal” Minnesota energy system—the opposite of the message we intended to convey, which was that multiple futures could plausibly unfold over the next 40 years, and control over which of these futures comes to pass may be minimal at best [
16]. Compounding this design impulse was the fact that we had very limited time to discuss the model output and point out unexpected consequences of decisions, which would have emphasized that it is impossible to “design” the future of a system as complex as the state of Minnesota. This is something on which both scenario visioning practitioners and participatory system dynamics modelers would agree [
9,
31]. An alternative which, in retrospect, would have more effectively emphasized the complexity and un-predictability of Minnesota’s future would have been to work with participants to construct a conceptual model of the state’s energy sector. Feedback loops and system behavior could have been discussed, and leverage points identified. We could then have used the model to examine different plausible future scenarios, and it would have been apparent to workshop participants that the future state of Minnesota’s energy and food systems are highly dependent on factors exogeneous to Minnesota (international fuel price dynamics, climate change,
etc.), over which state actors have only minimal control. It was apparent to us that many policy-makers want analysts and scientists to provide extremely high quality accurate predictive models of complex processes, which they can “plug into” to help identify best possible policy options.
While the modeling exercise in the statewide workshop was not successful in encouraging participants to consider multiple plausible futures, participant reflection around the SCPP did reveal an orientation towards preserving fundamental support systems (land, water, and the ability to manage/plan at the community level) for the variety of futures that could plausibly unfold. After the Phase II regional scenario workshops, approximately half (51%) of survey respondents agreed with the statement, “The modeling analysis changed my perception of the most important issues in my region”.
Members of the research team are still documenting the “ripple effect” outcomes of the Minnesota 2050 project. Two years after the end of the project, it is difficult to say with certainty which events or developments have been influenced by Minnesota 2050 and which would have taken place anyway. Follow-up interviews have been conducted with workshop participants, and these afford some insight into the long-term impacts of Minnesota 2050 on participants’ thinking and leadership—although similar difficulty lies in distinguishing which changes participants would have made on their own, even without attending the workshops [
21]. Members of the research team have been invited to present output from Minnesota 2050 to a hearing of the state House Environment and Natural Resources Finance Division. Scenario processes similar to that used in Minnesota 2050 have also been used as part of the planning exercises around land use and water management for various regional groups in Minnesota [
16]. However, we acknowledge that our difficulty in pinpointing long-term effects of the Minnesota 2050 workshops is one of the weaknesses of this project.
5. Conclusions
The scenario visioning process used in the Minnesota 2050 project was not designed to achieve a defined decision outcome. Because the process is lengthy, it would not be appropriate for urgent decisions, but we can see its application to making strategic, long-term decisions that must enhance system sustainability. This could be accomplished by using a narrower decision-oriented question for the scenario visioning process (for example, “how is our community providing zero-carbon fuels to its residents and how are we using those fuels?”). Output from Phase II workshops could then include specific strategies that could be evaluated using a participatory system dynamics model.
In designing a project like Minnesota 2050, in which the researchers wanted quantitative information and qualitative perceptions to be in meaningful dialogue with one another, the project team often perceived a tension between imaginative thinking and quantitative analysis. For example, the Northwestern regional group imagined that, in the future, their region would produce enough biofuels to supply all of the Midwest’s energy needs. Present-day quantitative information about biomass productivity, energy use, and conversion efficiencies suggests this would not be plausible. However, if any of those parameters were to change dramatically, this scenario might become plausible. We, the researchers, were resistant to dismissing a community’s vision because of seemingly contradictory quantitative information; nor did we want to avoid challenging a community on a vision that seemed in conflict with data trends and patterns. This tension persisted throughout the Minnesota 2050 process, and was a crucial aspect of how we thought about the plausibility of the scenarios produced [
12].
A second tension unfolded throughout the project between inhabiting and creating the future. The Minnesota 2050 project was designed to assist communities with planning in the face of uncertainty. However, many participants expressed discomfort with the notion that the future of Minnesota cannot be predicted or controlled. This was especially evident at the statewide workshop, in which workshop participants, including state legislators, viewed the interactive component of the model as an invitation to design an ideal future by tweaking parameters related to energy use, water consumption, and population in order to achieve a desired outcome. When the researchers and workshop facilitators emphasized the multiplicity of plausible futures, workshop participants sometimes protested, saying things like, “But it’s not true that we have no control”, or, “We can’t just give up and allow the future to unfold.” Of course, preparing for the future involves a complex interaction between asserting one’s own agency over the things which one can control (one’s own lifestyle, role in the community, etc.), and preparing for changes in the things which are outside of one’s direct control (the impacts of climate change on temperature and precipitation patterns, the price of fossil fuels, etc.). The Minnesota 2050 process therefore provided a means for participants to identify controllable actions in the context of a highly uncertain set of future states.
Ultimately, we found these two tensions (between quantitative and imaginative thinking, and between inhabiting and creating the future) to be productive and useful if facilitated through dialogue and discussion. While designing the participatory workshops, members of the research team were often in disagreement about how far to push one aspect of the process
versus the other (quantitative/imaginative or inhabiting/creating the future), and lengthy discussions were necessary to decide on a course of action. We used a highly skilled and experienced facilitator for the Minnesota 2050 project, and his involvement was a critical aspect of the project’s success, as indicated by workshop participant comments on post-workshop evaluation forms [
21]. Without experienced facilitation, it is likely that participants in this type of project would not be pushed to stretch their thinking to the extent required for considering multiple plausible futures [
7].
Based on our experience in Minnesota, we believe that scenario visioning and participatory system dynamics modeling can indeed work well together, and foster enhanced systemic and sustainability-oriented thinking among both researchers and stakeholders. These two approaches have several characteristics in common. They both acknowledge the dynamic and unpredictable nature of the future in a complex system. They both encourage systemic thinking and an understanding of causal relationships.
By rejecting a dualistic approach (we either create
or inhabit the future; we think quantitatively
or imaginatively, but not both), both researchers and community leaders left the workshop with a larger set of tools with which to understand and plan for the future [
21]. Many scenario exercises privilege either quantitative or qualitative information; we took an approach that privileges neither but encourages dialogue between the two. Without imagination, there can be no creative vision—but if that vision is completely disconnected from a quantitative understanding of current trends and data, it is less compelling and achievable. A completely fatalistic approach to the future disempowers community leaders from making positive changes; however, believing that one can design a future impervious to exogenous forces is a setup for a lack of resilience and inevitable failure and disappointment. We as researchers, in collaboration with community leaders, need to design and practice creative and integrative processes for navigating these oppositional tendencies.


