Development of YSZ Thermal Barrier Coatings Using Axial Suspension Plasma Spraying


1
Forschungszentrum Jülich GmbH, Institute of Energy and Climate Research, Materials Synthesis and Processing (IEK-1), Jülich 52425, Germany
2
JARA-ENERGY, Jülich Aachen Research Alliance (JARA), Jülich 52425, Germany
*
Author to whom correspondence should be addressed.
Coatings 2017, 7(8), 120; https://doi.org/10.3390/coatings7080120
Submission received: 12 July 2017
/
Revised: 30 July 2017
/
Accepted: 7 August 2017
/
Published: 10 August 2017
(This article belongs to the Special Issue Thermal Barrier Coatings)
Abstract
:The axial injection of the suspension in the atmospheric plasma spraying process (here called axial suspension plasma spraying) is an attractive and advanced thermal spraying technology especially for the deposition of thermal barrier coatings (TBCs). It enables the growth of columnar-like structures and, hence, combines advantages of electron beam-physical vapor deposition (EB-PVD) technology with the considerably cheaper atmospheric plasma spraying (APS). In the first part of this study, the effects of spraying conditions on the microstructure of yttria partially-stabilized zirconia (YSZ) top coats and the deposition efficiency were investigated. YSZ coatings deposited on as-sprayed bond coats with 5 wt % solid content suspension appeared to have nicely-developed columnar structures. Based on the preliminary results, the nicely developed columnar coatings with variations of the stand-off distances and yttria content were subjected to thermal cycling tests in a gas burner rig. In these tests, all columnar structured TBCs showed relatively short lifetimes compared with porous APS coatings. Indentation measurements for Young’s modulus and fracture toughness on the columns of the SPS coatings indicated a correlation between mechanical properties and lifetime for the SPS samples. A simplified model is presented which correlates mechanical properties and lifetime of SPS coatings.
1. Introduction
Thermal barrier coatings (TBCs) are widely used in aircraft and industrial gas-turbine engines to improve the durability and efficiency of engines [1,2]. TBCs are complex multilayer systems composed of an oxidation-resistant metallic bond coat (BC) and a thermal insulating ceramic top coat (TC) [3]. The ceramic top coat is typically made of 7–8 wt % yttria partially-stabilized zirconia (YSZ). Due to the refractory nature of YSZ with a melting point of ~2700 °C, high temperature materials processing technology is required [4]. The two primary widely-used methods for depositing TBCs are electron beam-physical vapor deposition (EB-PVD) and atmospheric plasma spraying (APS) [5]. During the EB-PVD process, a high-energy electron beam is used to melt and evaporate ceramic ingots in a vacuum chamber. Subsequently, the vapor deposits onto a preheated substrate at a deposition rate of, typically, several μm/min. Due to the vapor phase condensation and shadowing effect [5], columnar-structured TBCs with a high level of strain tolerance can be achieved [6]. However, the high manufacturing cost limits the use of EB-PVD on severe thermo-mechanically loaded parts, such as first-row blades.
Versatility and low deposition cost make APS an attractive technique for depositing TBCs in commercial applications [7,8]. In the APS process, ceramic powder with a particle size of tens of micrometers is injected into an arc plasma jet and deposited onto the substrates. Within the plasma jet, the particles are accelerated and melted, followed by impaction, rapid solidification, and forming a coating on the substrate [3]. A lamellar microstructure is obtained by stacking splats during deposition. Attributing to deposition-induced defects (pores, arrayed micro-cracks and interfaces), typical APS coatings offer lower thermal conductivity than EB-PVD coatings [5,9]. However, under severe thermo-mechanical loading conditions, lamellar TBCs deposited with APS exhibit lower lifetimes compared with EB-PVD coatings [10]. There seems to be an advantage of the columnar EB-PVD compared to the micro-cracked and porous APS microstructure. Hence, the possibility to achieve such a microstructure by a modified APS process, namely suspension plasma spraying (SPS), is highly attractive.
SPS is a spraying technology with which high-performance TBCs can be deposited at low cost [11,12,13]. In the SPS process, liquids (e.g., ethanol or water) are used as carrier media to inject sub-micron or nano-sized ceramic particles into the plasma jet. With SPS, TBCs with different porosity levels, as well as different microstructures, such as porous, vertically cracked, and columnar structures can be achieved [5,14,15]. Especially, columnar SPS coatings with high porosity, low thermal conductivity, and much finer microstructure than conventional APS coatings have a great potential for industrial applications [16,17]. More recently, a new axially-injected suspension plasma spraying technology has been developed [18]. In this process, the suspension is axially injected into the core of the high-temperature and high-velocity plasma jet. Due to the axial injection method, particles can be well melted and accelerated in the plasma jet [19]. Generally, the porosity bands in SPS coatings between individual spray passages can be often found [20]. These bands are due to not properly injected droplets at the outer fringes of the plasma plume. A central injection is able to reduce this effect considerably.
Even though some work about the effect of bond coat roughness on the microstructure of the top coat layer have been reported, such as [17,21,22], the effect of spraying conditions on the microstructure of top coats sprayed with axial SPS have only be partially investigated so far. The objective of the present work is to investigate the influence of the deposition conditions (bond coat roughness, stand-off distance, input powder, and solid content of suspension) on the microstructures of SPS coatings. Based on the results, appropriate microstructures have been selected for thermal cyclic experiments. The rather moderate thermal cycling lifetime of SPS coatings compared with that of APS coatings are discussed with respect to the mechanical properties of the coatings. Furthermore, a simplified model was used to correlate the mechanical properties and the lifetime of SPS coatings. This study can shed light on improving the lifetime of axial SPS thermal barrier coatings.
2. Materials and Methods
2.1. Materials
Commercially-available 9.7 wt % yttria-stabilized zirconia powder (TZ-5Y, Tosoh Corporation, Tokyo, Japan) and 7.5 wt % yttria-stabilized zirconia powder, which was made by mixing TZ-5Y with TZ-3Y (5.4 wt % YSZ, Tosoh Corporation, Tokyo, Japan) were used in this work. The powder was dispersed in ethanol with the addition of a dispersant (PEI, Ploysciences, Warrington, PA, USA) and zirconia milling balls (d = 3 mm, Sigmund Lindner GmbH, Warmensteinach, Germany). The suspension was milled on a roller cylinder (120 min−1, 24 h) in order to produce a homogeneously-dispersed suspension (30 wt % in solid content). After milling, the suspension was diluted with ethanol to 10 wt % and 5 wt %. After milling, the particle size distribution was measured with a HORIBA LB-550 nanoparticle size analyzer (Retsch Technology GmbH, Haan, Germany). The particle distribution is d10 = 0.16 μm, d50 = 0.19 μm, and d90 = 0.27 μm. The viscosity of 10 wt % and 5 wt % suspension, measured with a viscosimeter (Physica MCR 301, Anton Paar Germany GmbH, Ostfildern, Germany) at a shear rate of 10 s−1, was 1.63 mPa·s and 1.48 mPa·s, respectively.
Stainless steel plates (25 × 25 × 2 mm3) coated with 200 μm high-velocity oxy fuel (HVOF) bond coat (Amdry 9954, Co32Ni21Cr8Al0.5Y, d10 = 11 μm, d50 = 20 μm, d90 = 50 μm) were used as substrates. Before deposition, the surfaces of THE substrates were carefully treated with: (1) mirror polishing; (2) grinding; (3) mirror polishing followed by grit blasting; and (4) as-sprayed. Additionally, rougher HVOF bond coats were prepared with Amdry 995C powder (Co32Ni21Cr8Al0.5Y, d10 = 52 μm, d50 = 69 μm, d90 = 90 μm) which has a larger particle size than Amdry 9954 [23]. The roughness of the surface-treated bond coats was measured with a double-sided non-contact metrology system (CT 350T, Cyber Technologies GmbH, Eching-Dietersheim, Germany). The roughness was determined as:
- Mirror polishing: Ra = 0.06 μm, Rz = 0.27 μm;
- Grinding: Ra = 0.26 μm, Rz = 1.89 μm;
- Mirror polishing and grit blasting: Ra = 2.82 μm, Rz = 21.6 μm;
- As sprayed HVOF bond coat: Ra = 10.4 μm, Rz = 67.4 μm;
- As sprayed rough HVOF bond coat: Ra = 14.4 μm, Rz = 87.5 μm.
For the thermal cycling tests, button-shaped nickel-based superalloy IN 738 (30 mm in diameter, 3 mm in thickness) was used as the substrate. For the purpose of minimizing the effect of stress generated at the edge, a curvature with a radius of 1.5 mm was machined at the outer edge of the substrates. On the IN 738 substrates, a 150 μm thickness MCrAlY bond coat (Amdry 9954, Oerlikon Metco Company, Wohlen, Switzerland) was sprayed with an F4 torch in a vacuum plasma spray (VPS) facility (Oerlikon Metco Company, Wohlen, Switzerland).
2.2. Plasma Spraying Conditions
Ceramic top coats were sprayed with an Axial III high-power plasma torch (Northwest Mettech Corporation, Vancouver, BC, Canada) which was mounted on a six-axis robot. The Axial III torch contains three cathodes and three anodes which are powered by three independent power sources. The liquid suspension was injected axially into the middle of the three plasma jets which converge within an interchangeable nozzle [19]. A feeding system developed by Forschungszentrum Jülich was used in this work [24]. The feeding rate of the suspension was set to be 30 g/min. The speed of the gun was set to be 1000 mm/s. A mixture of Ar (75 vol %), H2 (15 vol %), and N2 (10 vol %) with a flow rate of 245 standard liters per minute (slpm) was used as the working gas. The detailed spraying conditions are listed in Table 1.
2.3. Microstructure and Porosity Characterization
Metallographic cross-sections of samples were prepared to investigate the microstructure of the top coats with scanning electron microscopes (SEM, Zeiss Ultra 55 FEG-SEM, Carl Zeiss Microscopy GmbH, Oberkochen, Germany, and Hitachi TM3000, Hitachi High-Technologies Europe GmbH, Krefeld, Germany). The columns and vertical crack density of the coatings were counted from cross-section SEM images (magnification 300×). Vertical cracks and columns intercepting a fixed length line (7 mm in length) which is parallel and a certain distance from the top coat/bond coat interlayer were counted. The crack and column density were calculated by dividing the number of cracks and columns with the cross-section length. Vertical cracks and columns were defined as follows: (1) vertical cracks are cracks running perpendicular to the ceramic/bond coat interlayer and penetrating at least half the thickness of the coating; (2) columns are conical areas with a high density, secluded by linear porous gaps which are perpendicular to the top coat/bond coat interface.
The deposition efficiency of top coats was calculated by dividing the weight change of samples before and after spraying with the weight of the YSZ powder used during spraying. The deposition efficiency η of top coats was obtained with the following equation:
in which Gc (g) is the weight of top coat deposited on the substrate, Gs (g) is the weight of the YSZ powder injected into the plasma jet during spraying [25].
The porosity of the coatings deposited at different spraying conditions was measured with image analysis (IA). Porosity can be easily detected due to the high degree of contrast between dark pores and high brightness coating material [26]. For each measurement, 10 cross-section SEM images of the top coats with magnification of 300× were used. The defect (pore) size within the columns was also determined with image analysis. The mean equivalent circle diameter (ECD) value of the largest 10% of pores was measured. Assuming all the pores were spheres, the mean diameter of the pores was obtained by multiplying the mean ECD with a constant (4/π) [27]. All the image analysis work was conducted with the software AnalySIS (AnalySIS pro, Olympus Soft Imaging Solutions GmbH, Hamburg, Germany).
For the investigation of phases of the top coats, X-ray diffraction was also carried out with a D4 Endeavor (Bruker, Karlsruhe, Germany) using Cu Kα radiation. A scanning range of 2θ from 10° to 80° with a step size 0.02° and a count time 0.5 s/step were used. The Rietveld refinement technique was used to determine the phases and the amount of different phases existing in the coatings [28].
2.4. Mechanical Property Tests
Mechanical property measurements were performed on the metallographic cross-sections of the samples. The hardness and elastic modulus of top coats were measured with a depth-sensing micro-indentation test (H-100 Fischerscope, Helmut Fischer GmbH, Sindelfingen, Germany). The load applied on the indenter was set to be 1 N. Effective Young’s modulus was calculated from the initial unloading slope [29]. The elastic modulus of the materials can be obtained with the following equation:
where E is the elastic modulus (GPa), E* is effective Young’s modulus (GPa), and ν is the Poission’s ratio; in this work ν = 0.25 was adopted from [30]. In order to obtain reliable values, 15 indentations were performed on each sample.
For the measurements of fracture toughness, an indentation fracture toughness technique was carried out in this work [31]. A Vicker’s indenter with an applied load of 3 N was used to generate proper cracks in metallographic cross-sections of the samples. In order to minimize the effect of column gaps, all the indentations were performed at the central part of the columns. The ratio between surface crack length l (m) and indentation half diagonal length a (m) fell into the following range:
This indicates that the generated cracks are Palmqvist cracks [31]. Thus, the following equation was used for calculating indentation fracture toughness of the top coats.
where KIC is the indentation fracture toughness (MPa·m1/2), H is the indentation hardness (MPa), E is the elastic modulus (MPa), a is the indentation half-diagonal length (m), and l is the crack length (m) [31,32]. Ten indentations were made for each fracture toughness determination.
2.5. Thermal Shock Tests
The thermal shock tests were performed in a gas burner rig facility operating with a natural gas and oxygen mixture. The front sides of the samples were periodically heated up to the target temperature and, simultaneously, the reserve sides of the samples were cooled with compressed air to maintain a temperature gradient across the sample. In the aim of getting reliable lifetime results, two specimens were subjected to thermal cycling tests for each kind of microstructure. The detailed information about the test facility and used samples were given in [33]. Thermal cycling lifetime was defined as the number of thermal cycles that a sample survives before the appearance of visible spallation (25 mm2). During the test, the surface temperature was monitored with an infrared pyrometer, and the substrate temperature was measured with thermocouple which was located in the center of the substrate. In this work, the surface temperature was set to be 1400 ± 30 °C and the substrate temperature was adjusted to 1050 ± 30 °C.
3. Results and Discussion
3.1. Effect of Substrate Roughness on Coating Microstructure
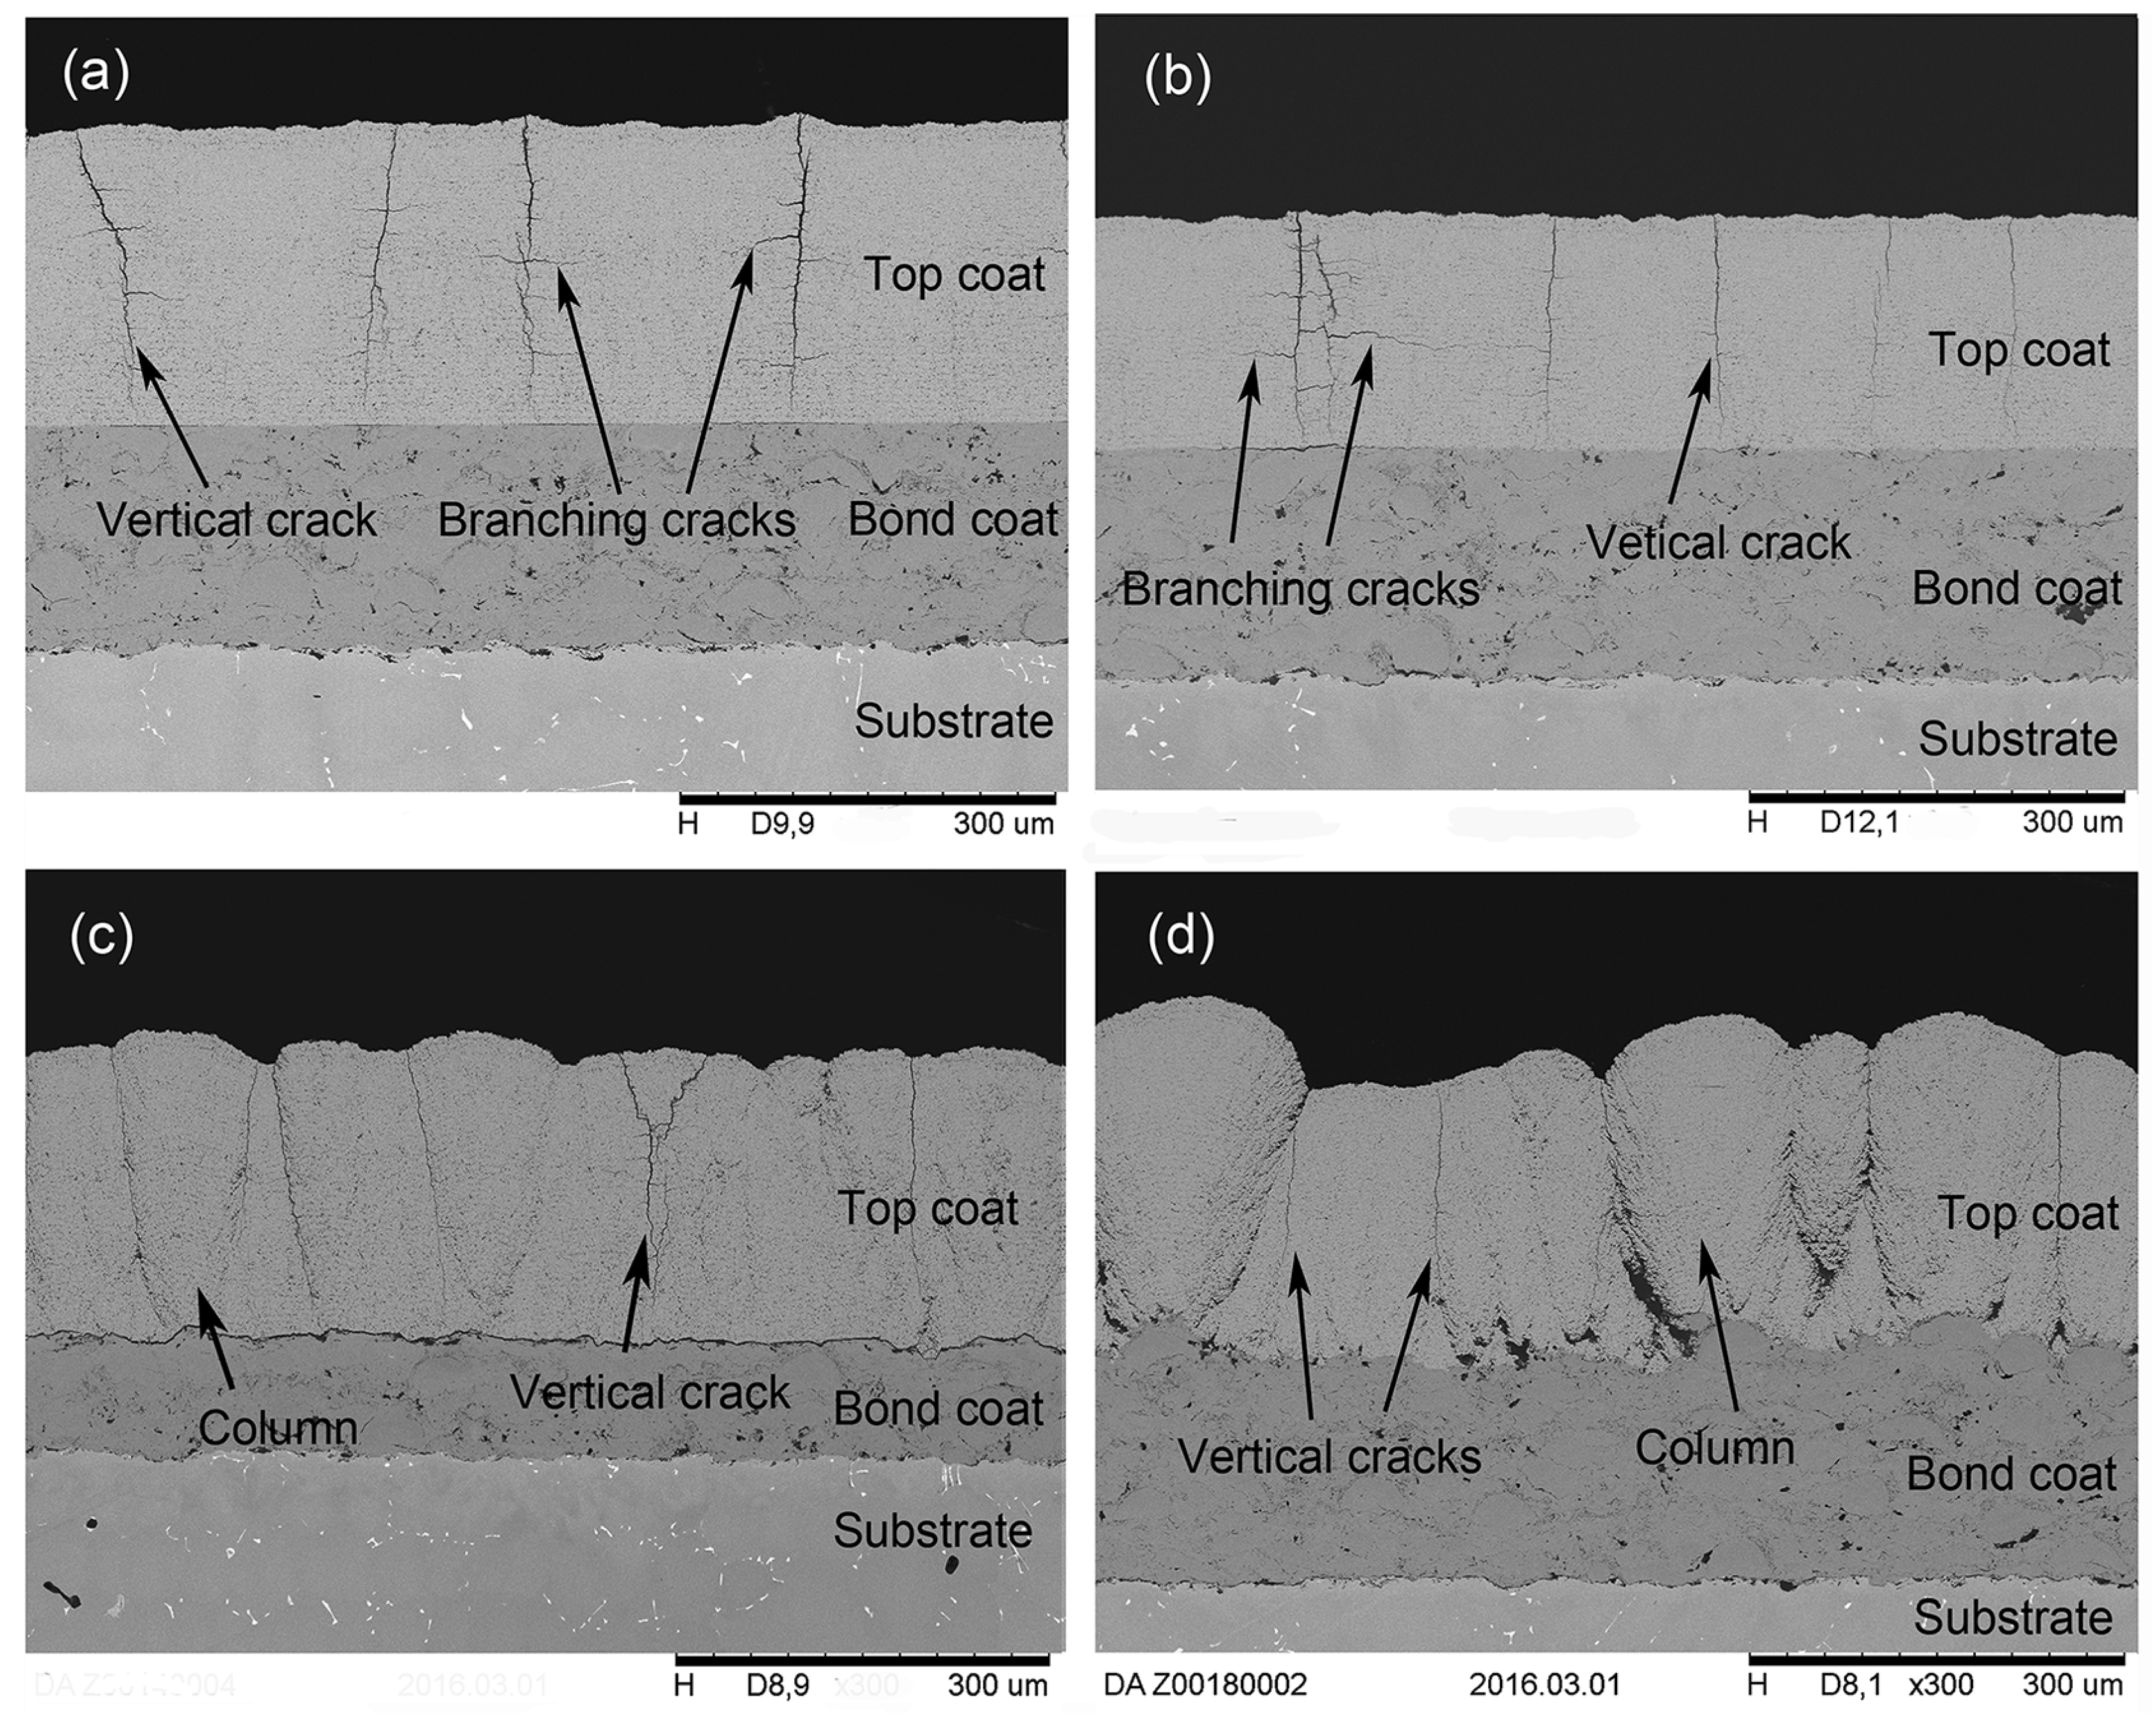
Figure 1 shows the as-sprayed cross-section microstructures of top coats which were sprayed on BCs with different roughness at a stand-off distance of 70 mm. It can be seen that the roughness of the BC layer greatly affects the microstructure of the top coats. Samples A and B, which were deposited onto relatively smooth surfaces, display a microstructure with vertical cracks penetrating through the entire coating thickness. It has been reported that the vertical cracks in the APS TBCs can improve the strain tolerance of TBCs during thermal cycling [34]. It can be expected that vertical cracks in the SPS coatings can increase thermal cycling performance of the coatings, as well. The formation of vertical cracks in traditional APS coatings is related to the cooling and shrinkage of the deposited splats, resulting in large tensile stress and consequent cracking during cooling. This mechanism only works for high depositing temperatures and dense coatings without a large number of micro-cracks for stress relief [35]. For SPS coatings, the splat sizes range from 0.3–2 μm in diameter [15]. Due to the limited size of the splats, the possibility of micro-crack formation during cooling is reduced. Probably, a higher tensile stress level can be built up within the top coat. When the tensile stress level exceeds the strength of the top coat, highly-segmented SPS coatings with vertical cracks are formed.
Branching cracks, which originate from vertical cracks and propagate along porous bands, also exist in top coats (as shown in Figure 1a,b). These branching cracks are detrimental to the thermal lifetime of TBCs. Porous bands existing between successive passes of the spraying gun provide an easy pathway for the propagation of branching cracks under thermal stress. The formation of porous bands is attributed to poorly-heated un-molten particles or resolidifized particles travelling in the jet fringes [36]. The extent of porous bands is largely reduced by axial feeding compared with radial feeding. This is also obvious when comparing the present results to former results using radial feeding (see, e.g., [20]). In addition, the porous bands can also be significantly reduced by changing the spraying pattern and suspension solid load content.
When the roughness of the BCs is increased up to Ra = 2.82 μm, as shown in Figure 1c, columns start to grow on the asperities of the bond coat; at the same time, the vertical cracks coexist in the top coat. Thus, the microstructure of Sample C is composed of a mixture of vertical cracks and columns. For sample D, the top coat was deposited on a surface with a roughness about Ra = 10.4 μm. Even though some vertical cracks can be observed, the microstructure of the top coat, as shown in Figure 1d, is a typical columnar structure. All the columns were separated by porous gaps, growing on the asperities of the surface. This observation is consistent with the proposed deposition mechanism by VanEvery et al. [14]. The plasma drag force changes the particles’ velocity from normal along the substrate surface. Thus, these particles preferentially impact on asperities of the surface leading to the formation of columns. Although the porous gaps between columns can provide an easy way for ingress of hot gas and corrosive media, they also increase the strain tolerance of the top coats leading to higher thermal cycling lifetimes of the TBCs.
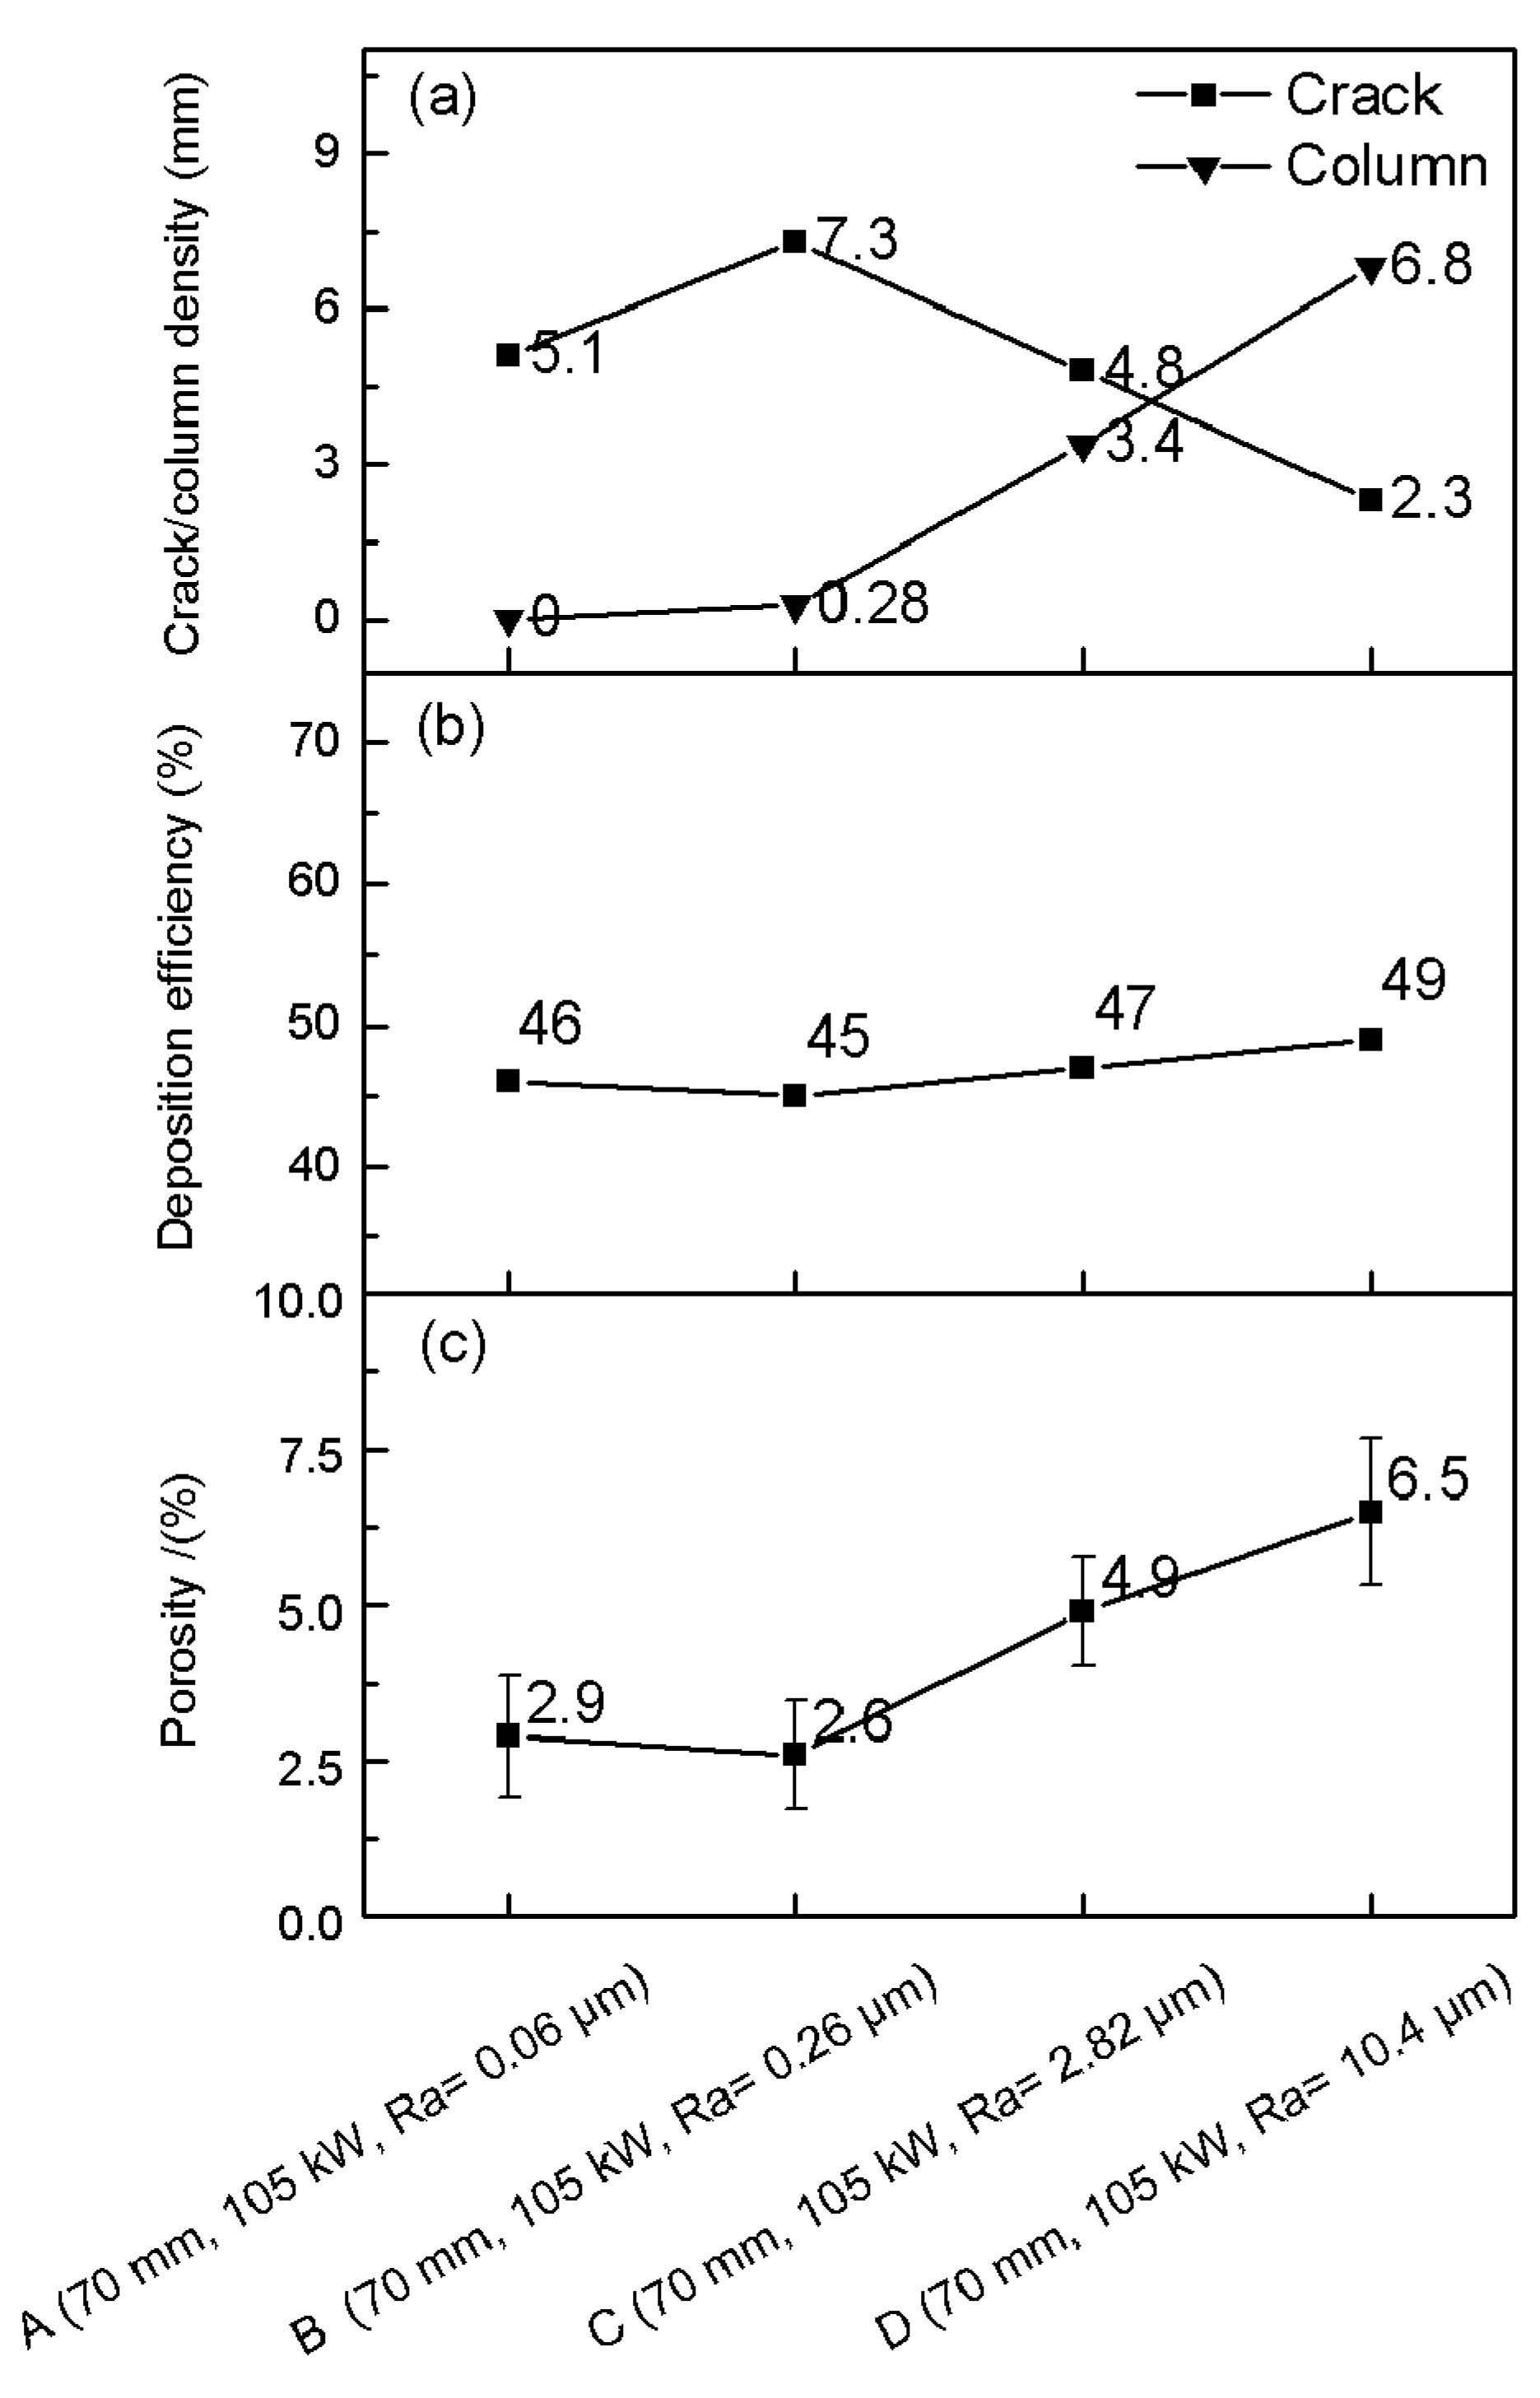
An evaluation of the crack and column density is shown in Figure 2a. The crack density decreases from Sample B to D, while the column density shows an opposite tendency. It seems that vertical cracks compete with columns and so the crack density is greatly affected by the column density. Probably, columns can release tensile stress within the top coat, which is a prerequisite condition for generating vertical cracks. It should be mentioned here that during the deposition of sample A, a small part of the top coat peeled off from the substrate. The tensile stress built in the top coat was probably partially released leading to the unexpected low crack density of Sample A. The deposition efficiency for Samples A, B, C, and D (as shown in Figure 2b) are roughly constant (45–49%). It seems that the roughness of the bond coat barely affects the deposition efficiency in axial SPS.
The porosity of the top coats was also investigated with image analysis. The results shown in Figure 2c exhibit a very low porosity for Samples A and B, only about 2.9% and 2.6%, respectively. The porosity of the top coats increases with the increase of the bond coat roughness (Samples C and D in Figure 2c). Probably, this is a result of the formation of columns which can introduce additional pores, specifically column gaps, into the top coats. In summary, the bond coat roughness can indirectly influence the porosity of top coats by affecting the microstructure of top coats. It should be mentioned here that very fine porosity in the nanometer range is not accessible by the used low-resolution method.
3.2. Effect of Stand-Off Distance on the Coating Microstructure
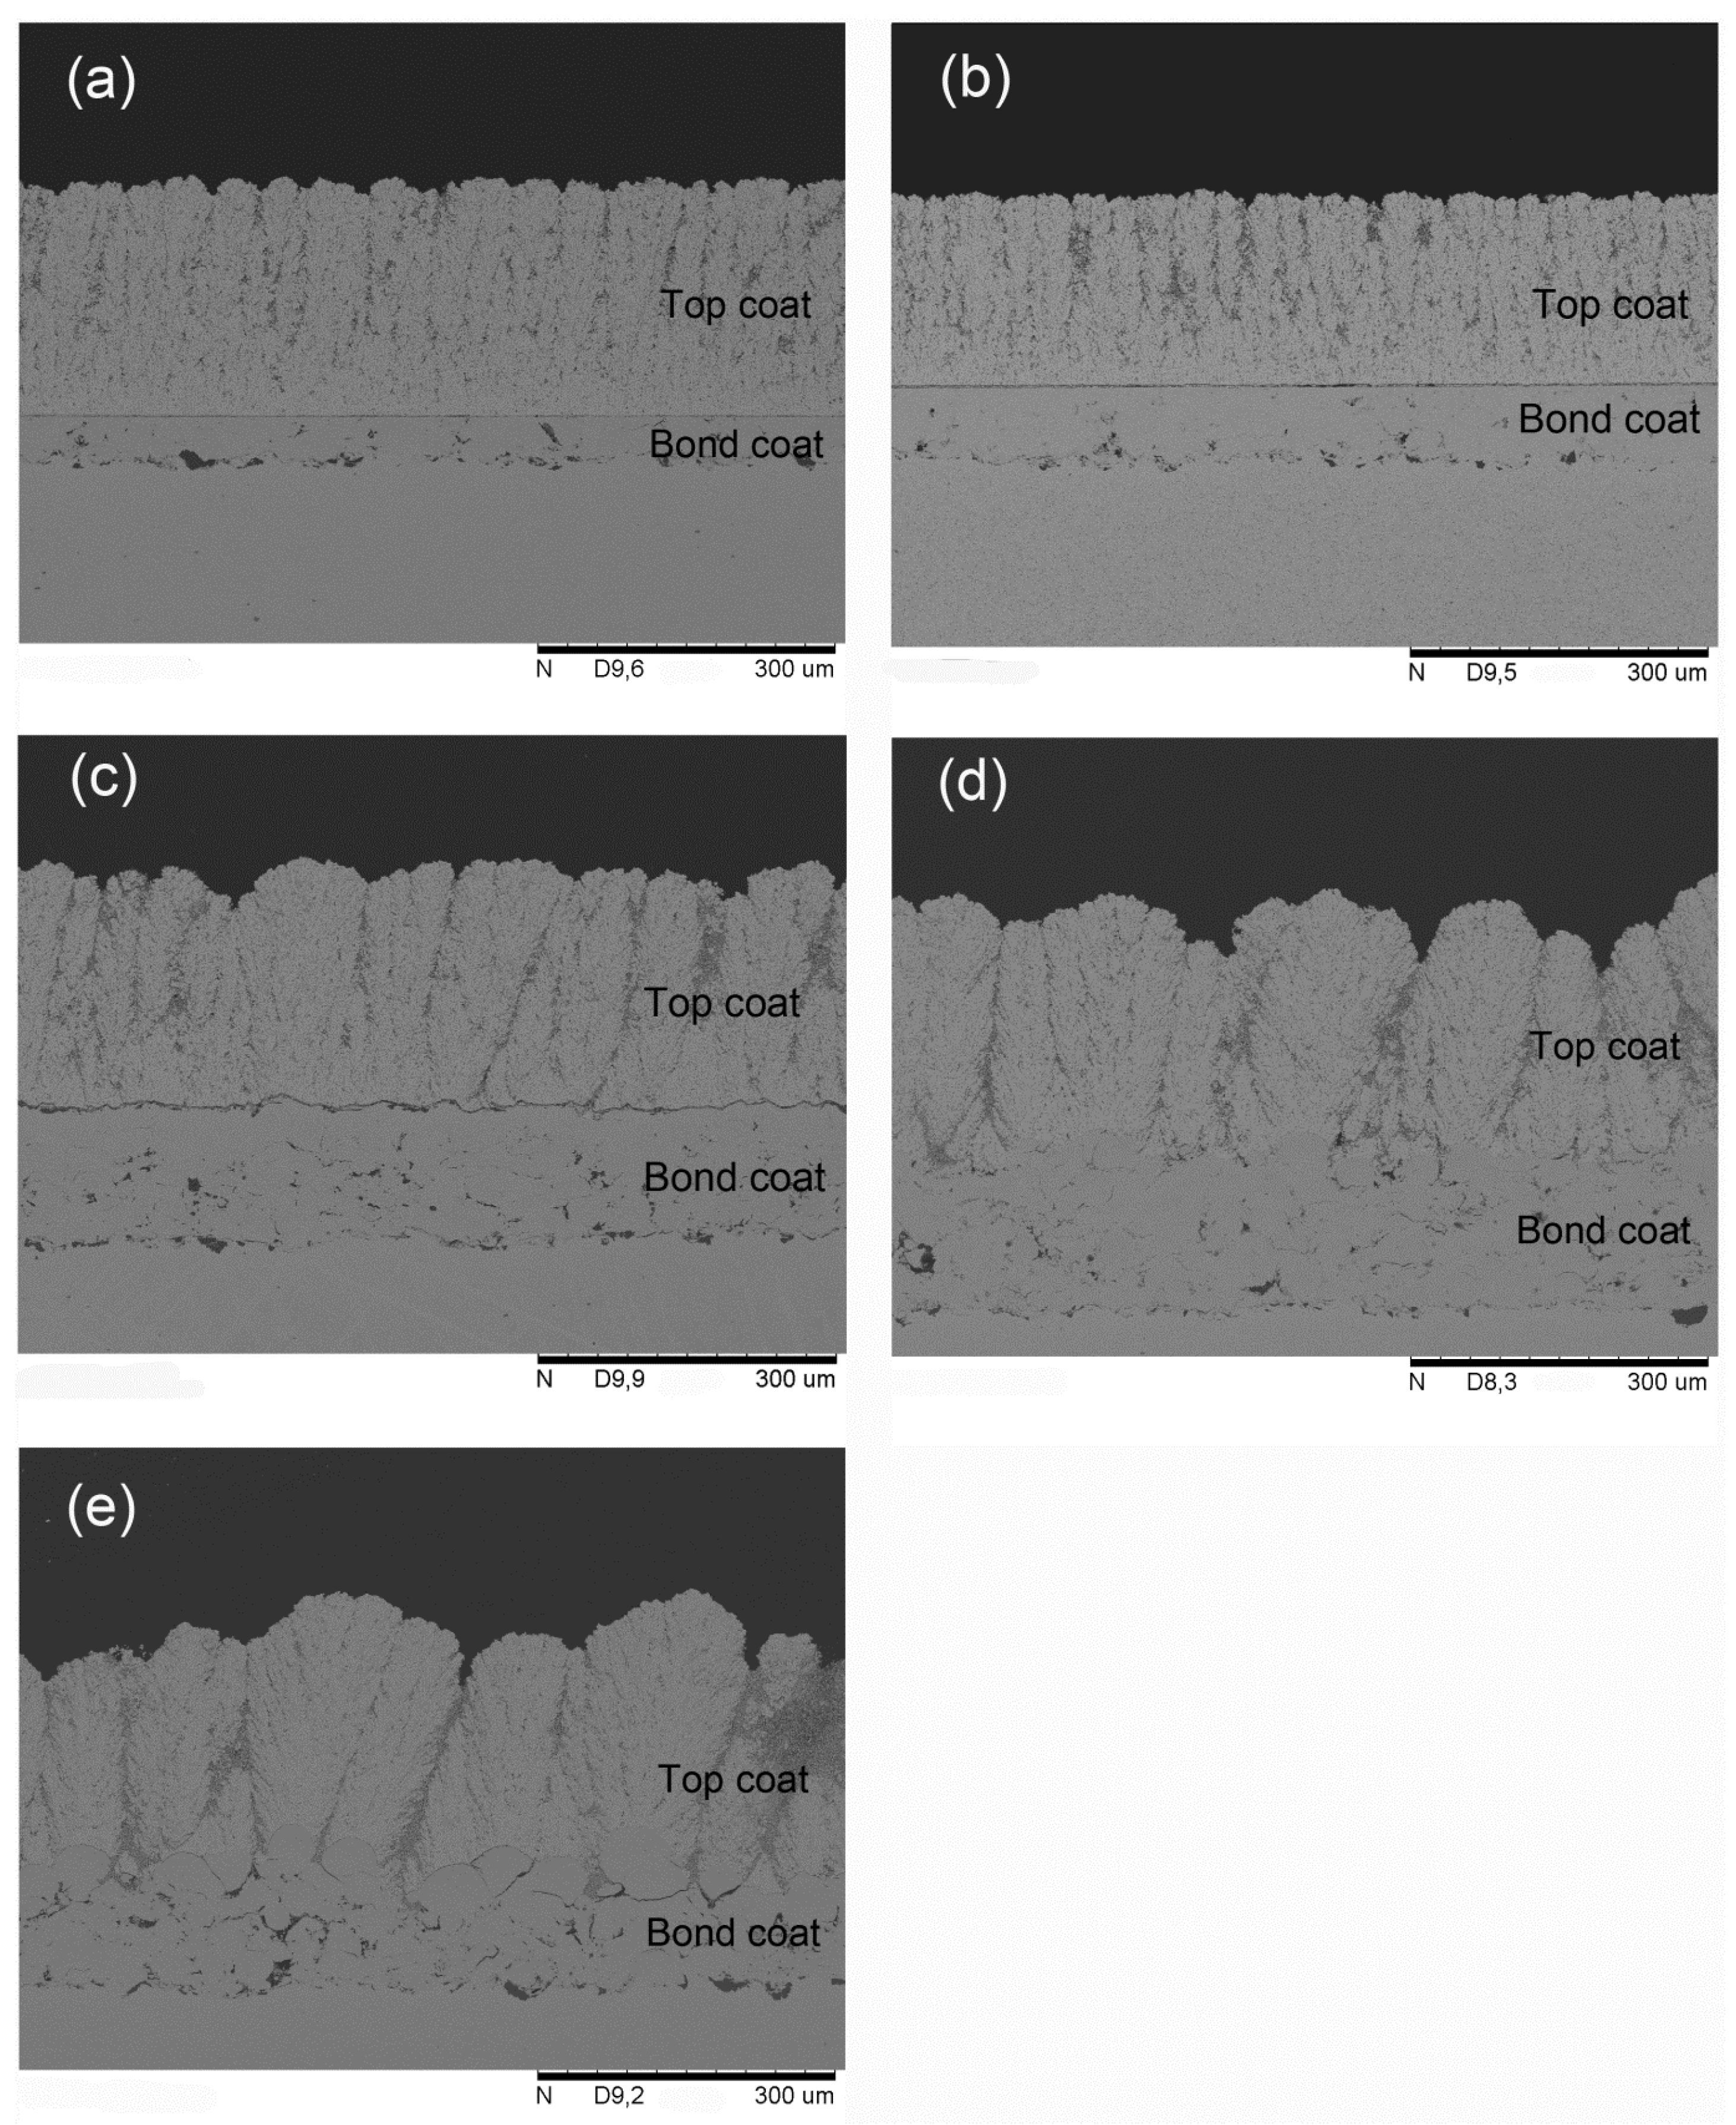
In addition, a set of top coats was deposited on surfaces with different roughness at a longer stand-off distance (100 mm). The cross-section microstructures of the top coats are presented in Figure 3. All top coats show a columnar microstructure. In addition, columnar-structured top coats can be obtained even on smooth surfaces, as shown in Figure 3a,b. This can be explained by considering the Stokes number St:
in which ρp is the particle specific mass (kg/m3); dp is the particle diameter (m); νp is the particle velocity (m/s); μp is the plasma gas molecular viscosity (Pa·s); lbl is the thickness of the flow boundary layer (m), which varies as the inverse of the square root of the gas velocity close to the substrate. A longer stand-off distance will lead to lower particle velocities when approaching the substrate, thicker boundary layers and, hence, a reduction of the particle Stokes number. Particles with lower Stokes numbers are more easily able to follow the plasma gas and deposit preferentially on asperities of the BC surface forming columns. In other words, the increase in stand-off distance promotes the formation of columns. It should be mentioned here that columns formed on smooth surfaces (Figure 3a,b) do not directly grow on the surface of the BC, but at a certain distance away from the BC surface instead. This indicates that the previously-deposited ceramic top coat surface can provide asperities on which columns grow. These asperities should have a proper size, which is related with the spraying conditions before the column growth starts.
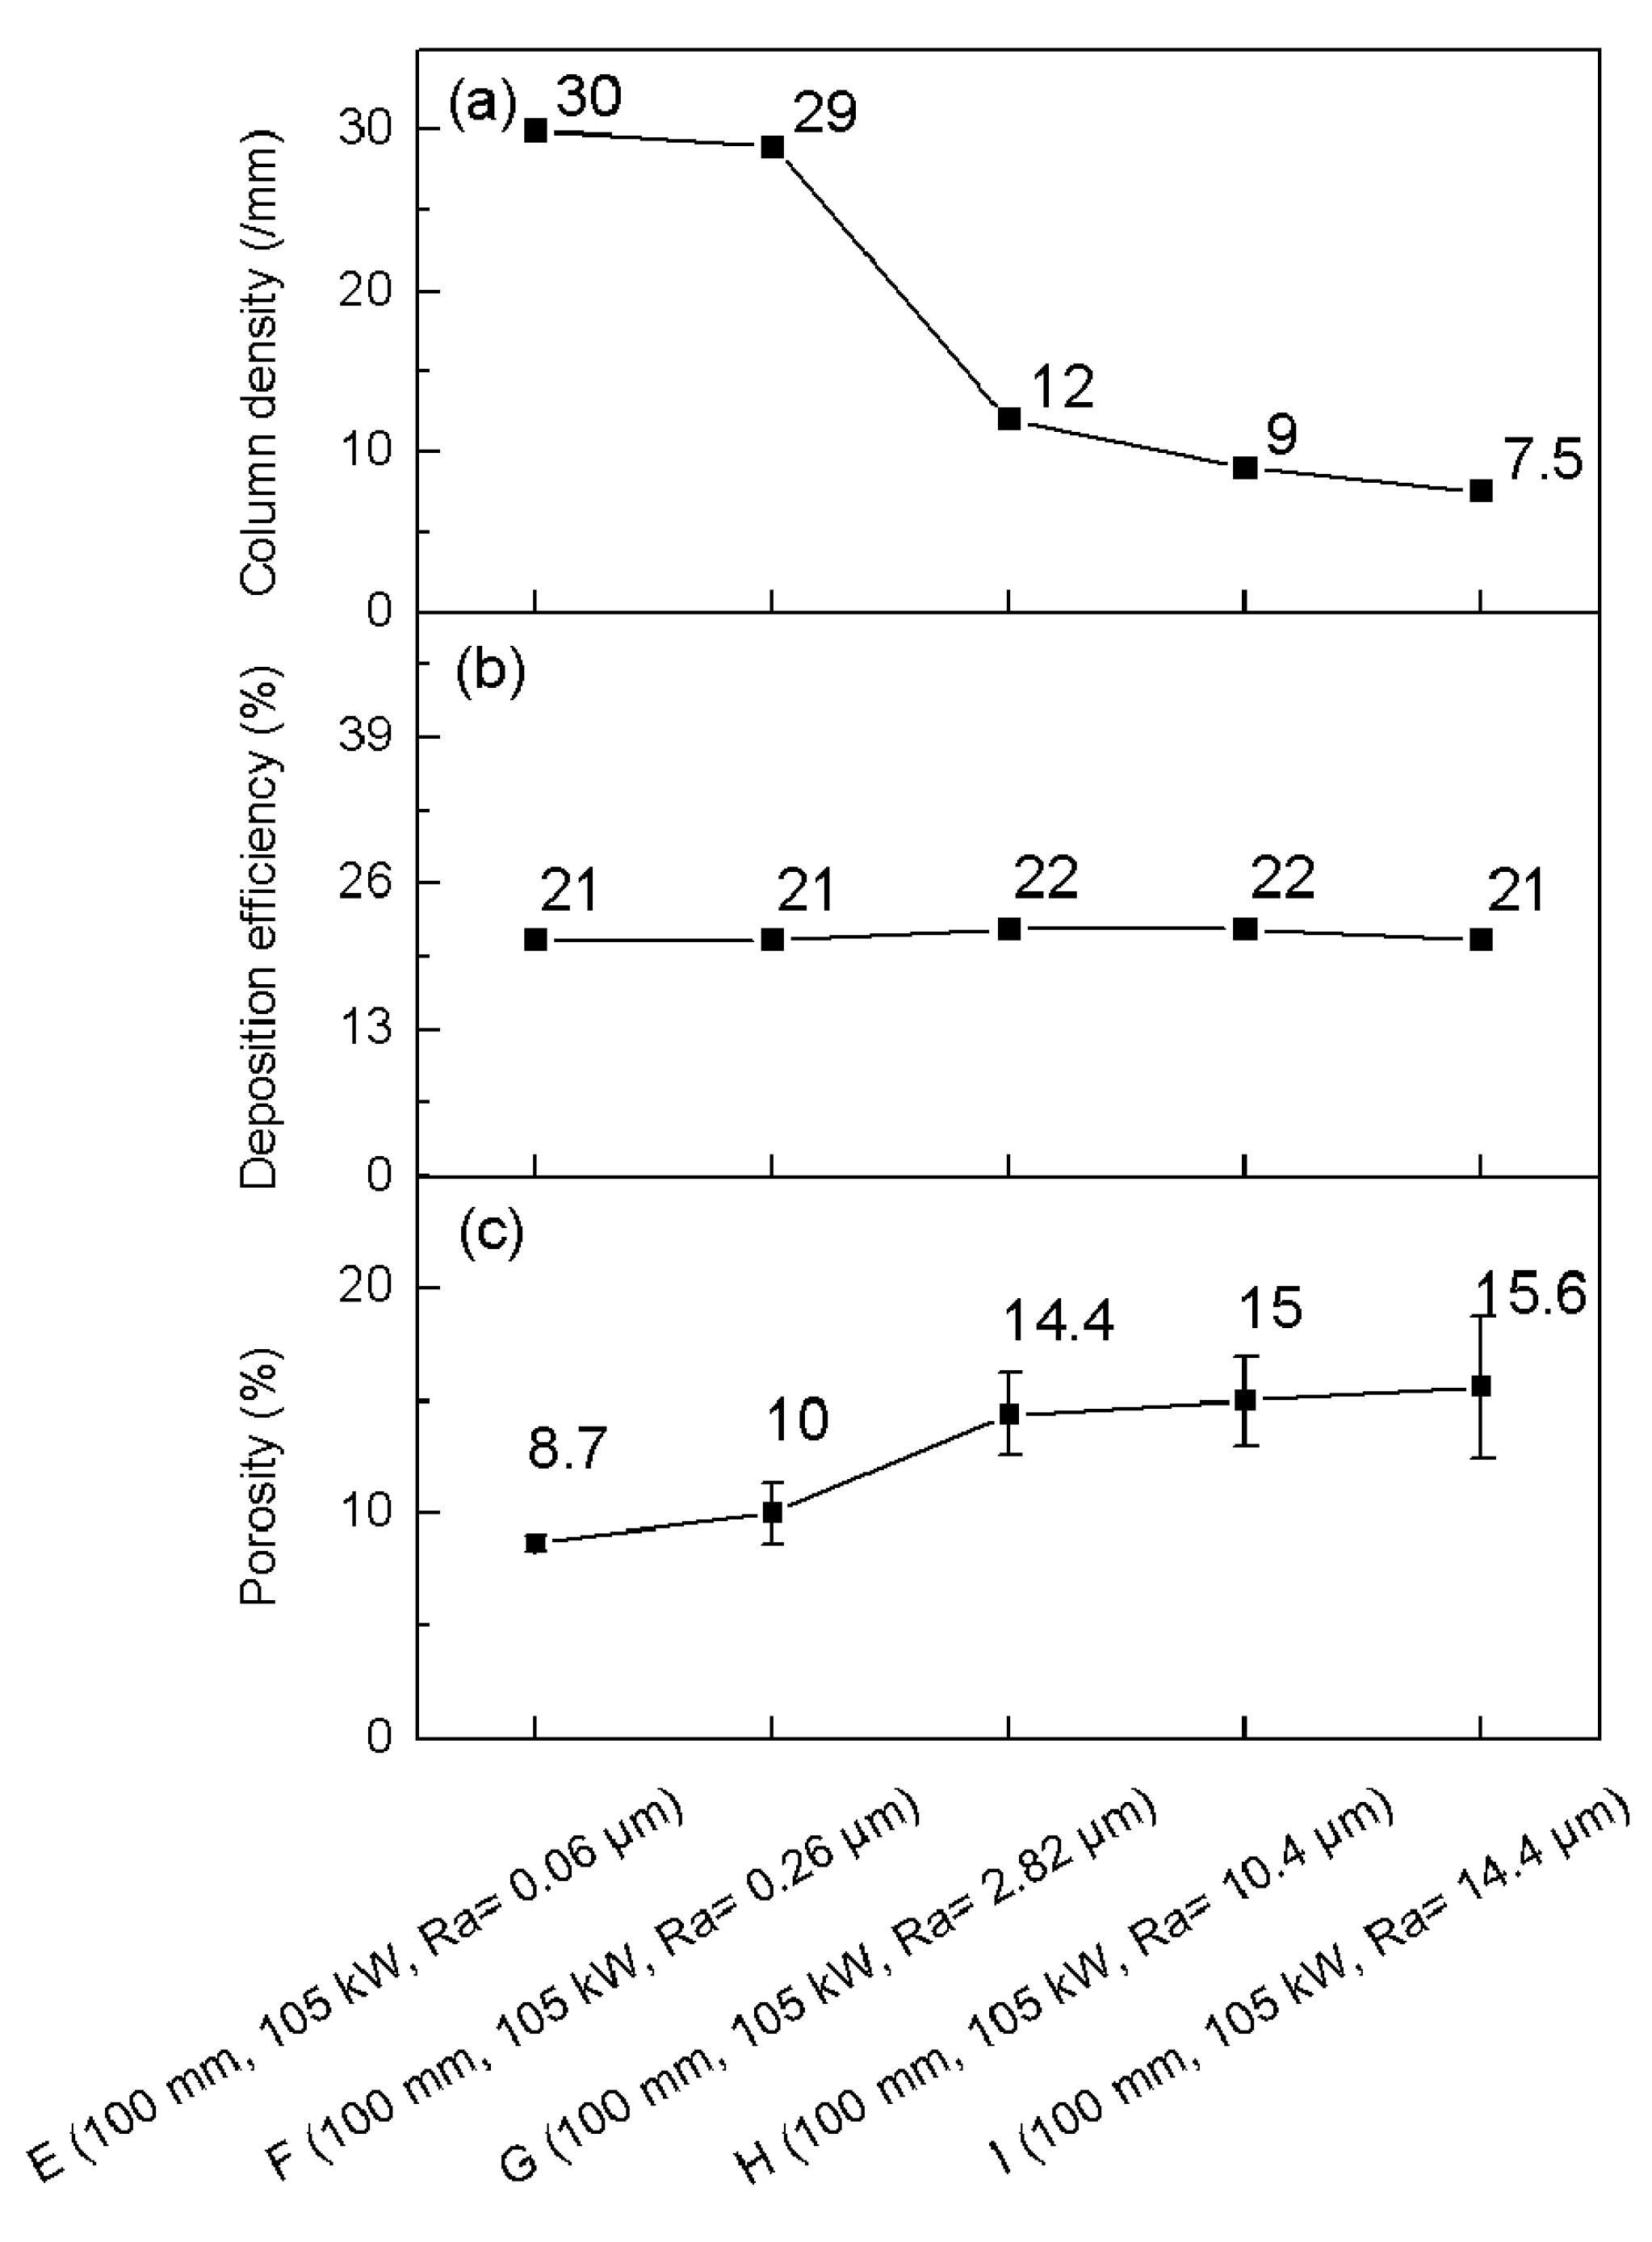
The column density of the top coats is presented in Figure 4a. The column density drops gradually with the increase of the BC roughness. This observation is also consistent with deposition mechanism proposed by VanEvery et al. Increasing the roughness will reduce the number of relevant asperities, which promote the growth of columns in a specific area.
The porosity levels of the top coats deposited on surfaces with different roughness values at a 100 mm stand-off distance are presented in Figure 4c. With increasing surface roughness, from Ra = 0.06 μm up to Ra = 2.82 μm, the porosity of top coat increased gradually, and only slightly, increased at higher roughness values. The deposition efficiency of the top coats is considerably reduced at the higher stand-off distance (compare Figure 2b and Figure 4b). A longer stand-off distance increases the number of particles with Stokes numbers below 1 [3]. These particles will follow the gas flow and might never impact on the substrate. In addition, at a longer stand-off distance particles are already cooling down and the substrate temperature is reduced, as well. Both factors lead to a lower sticking probability on the surface. Comparing the porosity level of the top coats deposited at a stand-off distance of 70 mm (Figure 2c) and 100 mm (Figure 4c), it can be seen that coatings deposited at a longer stand-off distance exhibit a higher porosity. This is probably related to the reduced droplet temperature and velocity impacting on the substrates.
3.3. Effect of the Input Power on the Coating Microstructures
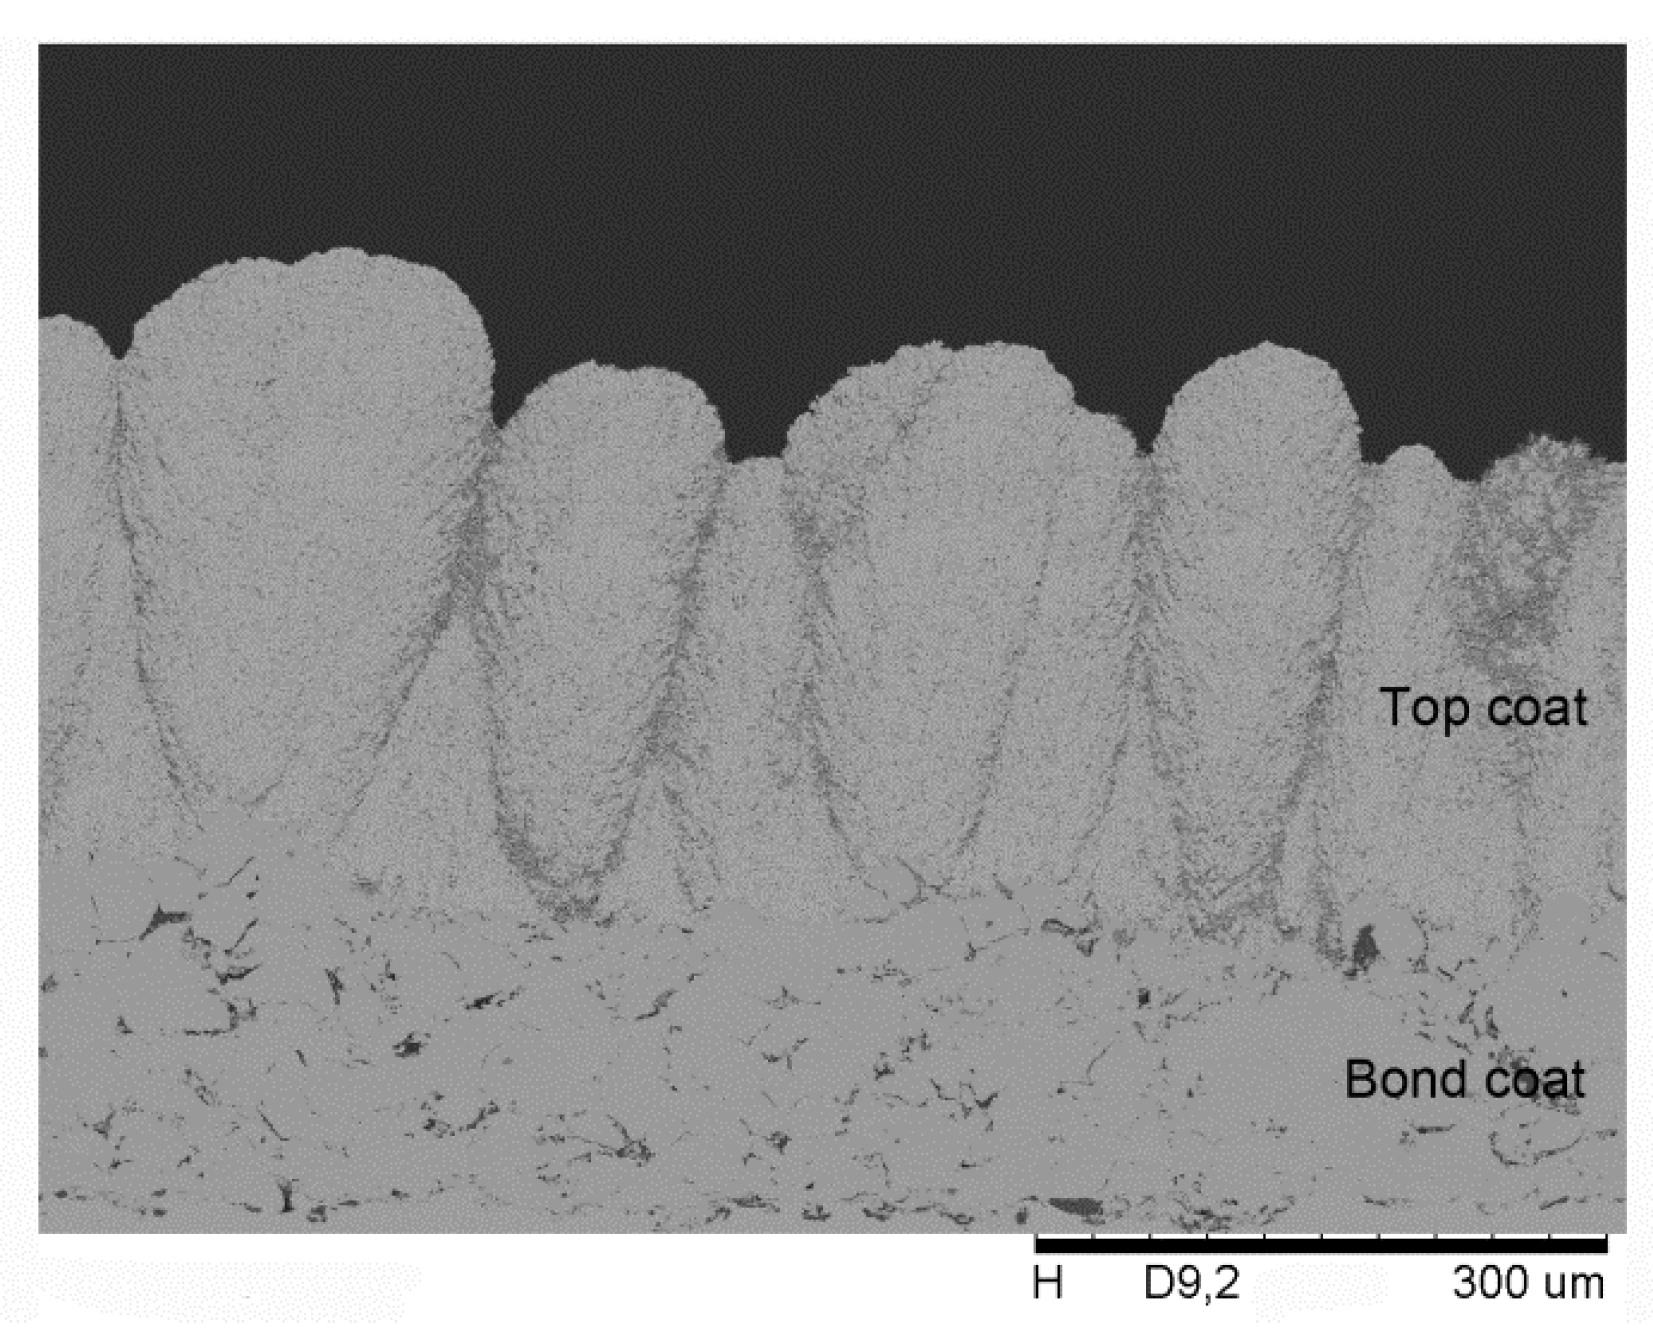
The top coat (Sample J) sprayed with a lower input powder (84 kW instead of 105 kW) was deposited on an as-sprayed HVOF bond coat. The cross-section microstructure of Sample J is presented in Figure 5. It can be seen that Sample J also exhibits a columnar structure. The column density is about 8.8/mm which is higher than the value of Sample D (Figure 2a). Moreover, it has a higher porosity of about 18.5%, surprisingly. It seems that lower input power can greatly increase the porosity of the top coat. The deposition efficiency for Sample J is about 48%, close to the value of Sample D.
3.4. Effect of Solid Content on the Coating Microstructures
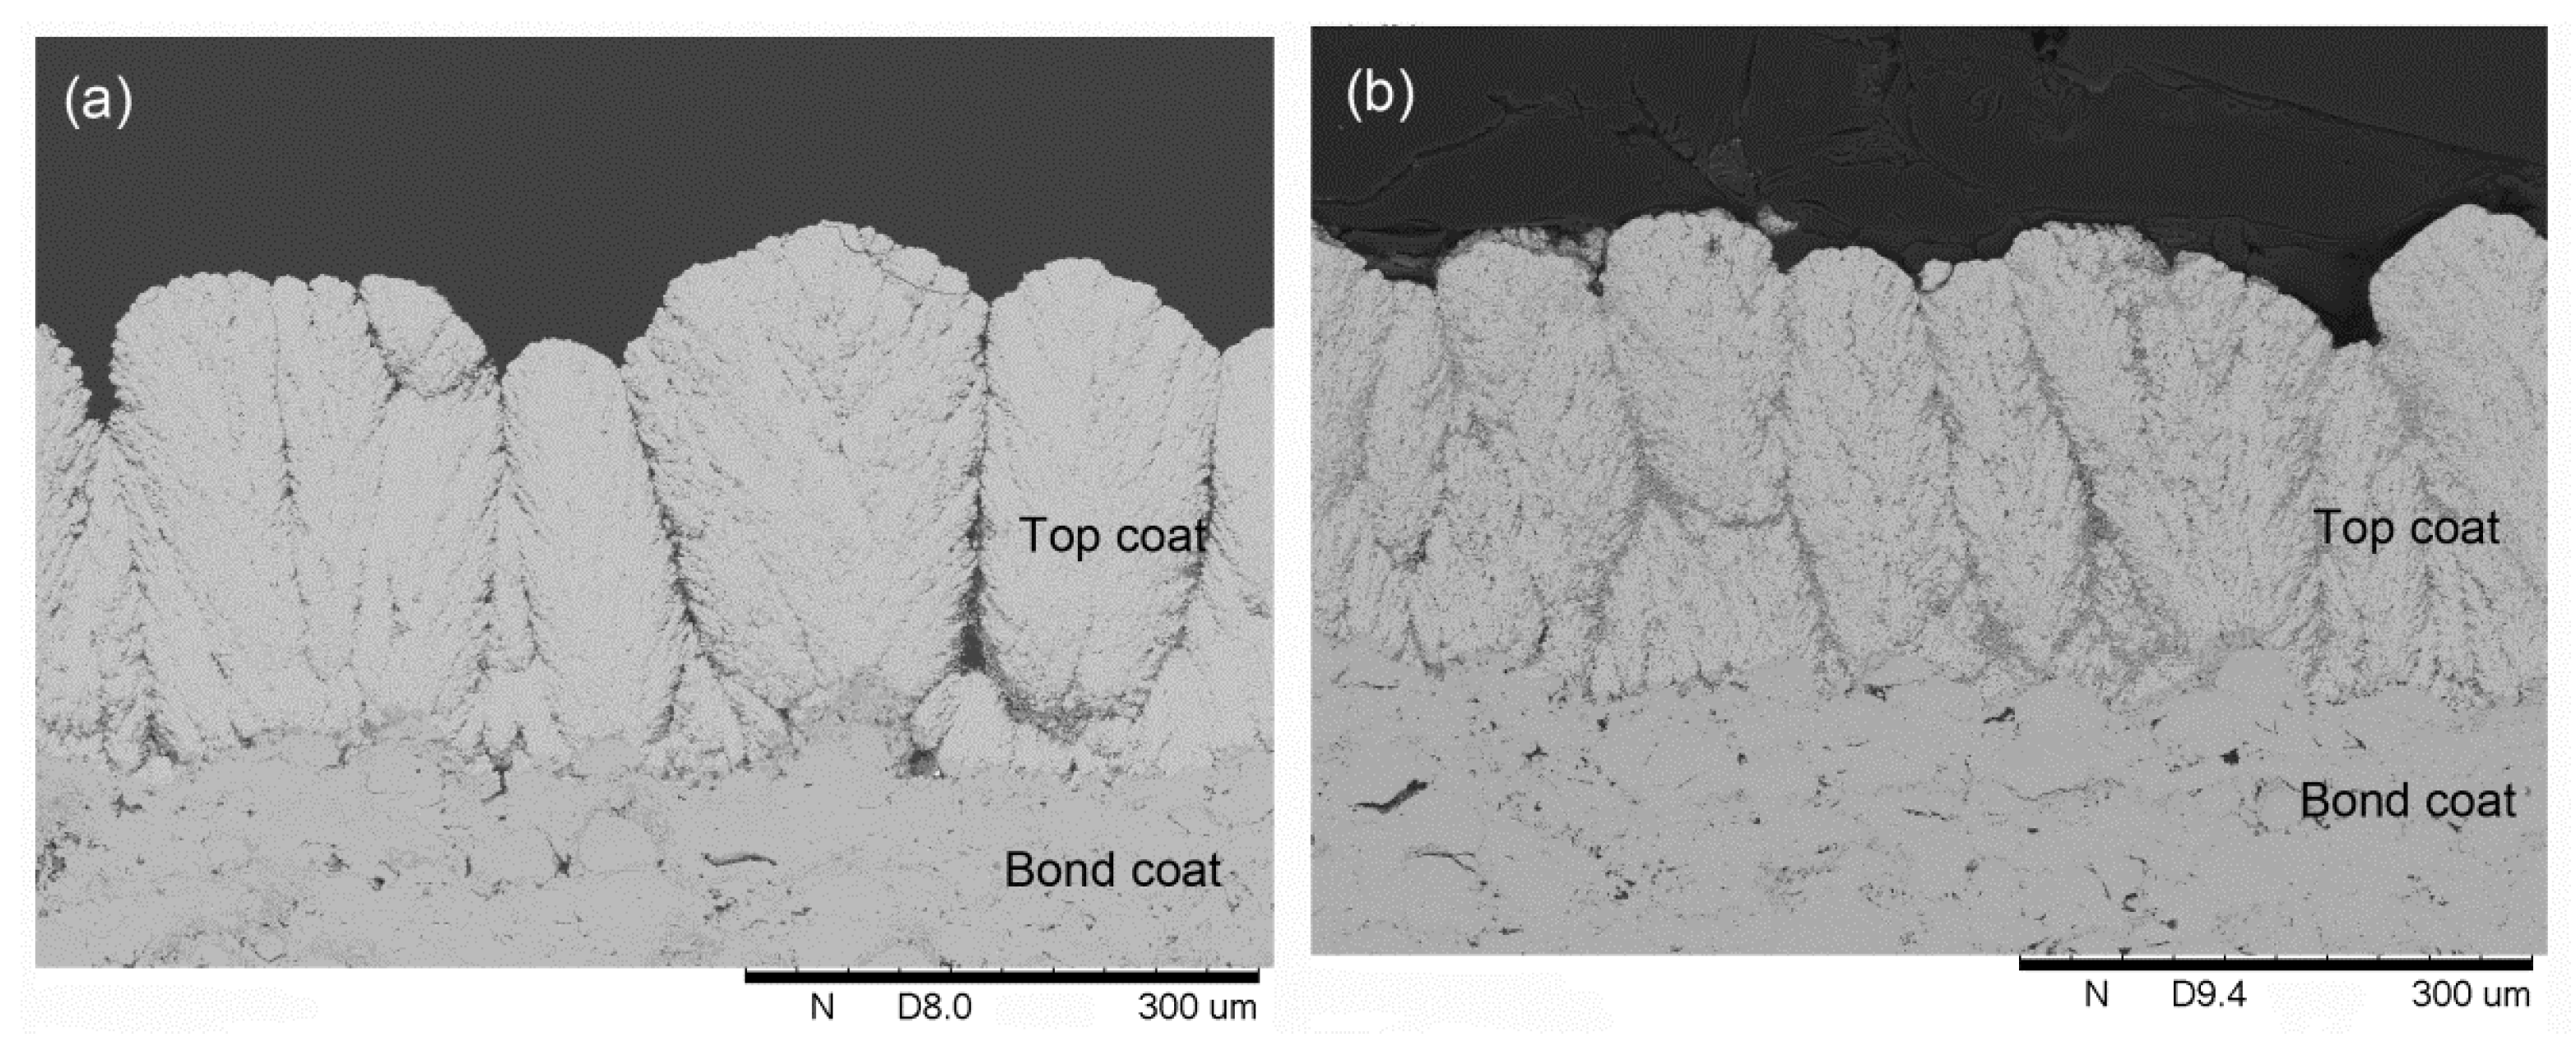
Cross-section SEM images of Samples K and L, which were sprayed with a 5 wt % solid content suspension, are presented in Figure 6. It can be found that both of the top coats have well-developed columnar structures. No vertical cracks can be observed from the cross-section. The column density for Samples K and L is 10.4 and 11/mm, respectively. Furthermore, the density of the top coats are 19.3% and 28.0%. Compared with Samples D (Figure 2) and H (Figure 4), it seems that lowering the solid content in the suspension from 10 wt % to 5 wt % can promote the growth of columns and decrease the density of the top coats. In addition, the deposition efficiency of Samples K and L were measured to be 60.7% and 27.2%. Surprisingly, the deposition efficiency was also increased. Due to the different injection methods, axial SPS shows higher deposition efficiency than radial SPS. The deposition efficiency of axial injection SPS is close to the efficiency of APS, which can be 60% and above [37].
3.5. Thermal Cycling Performance of the Coatings
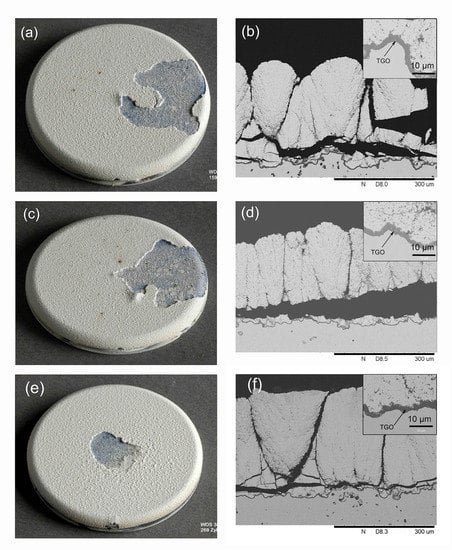
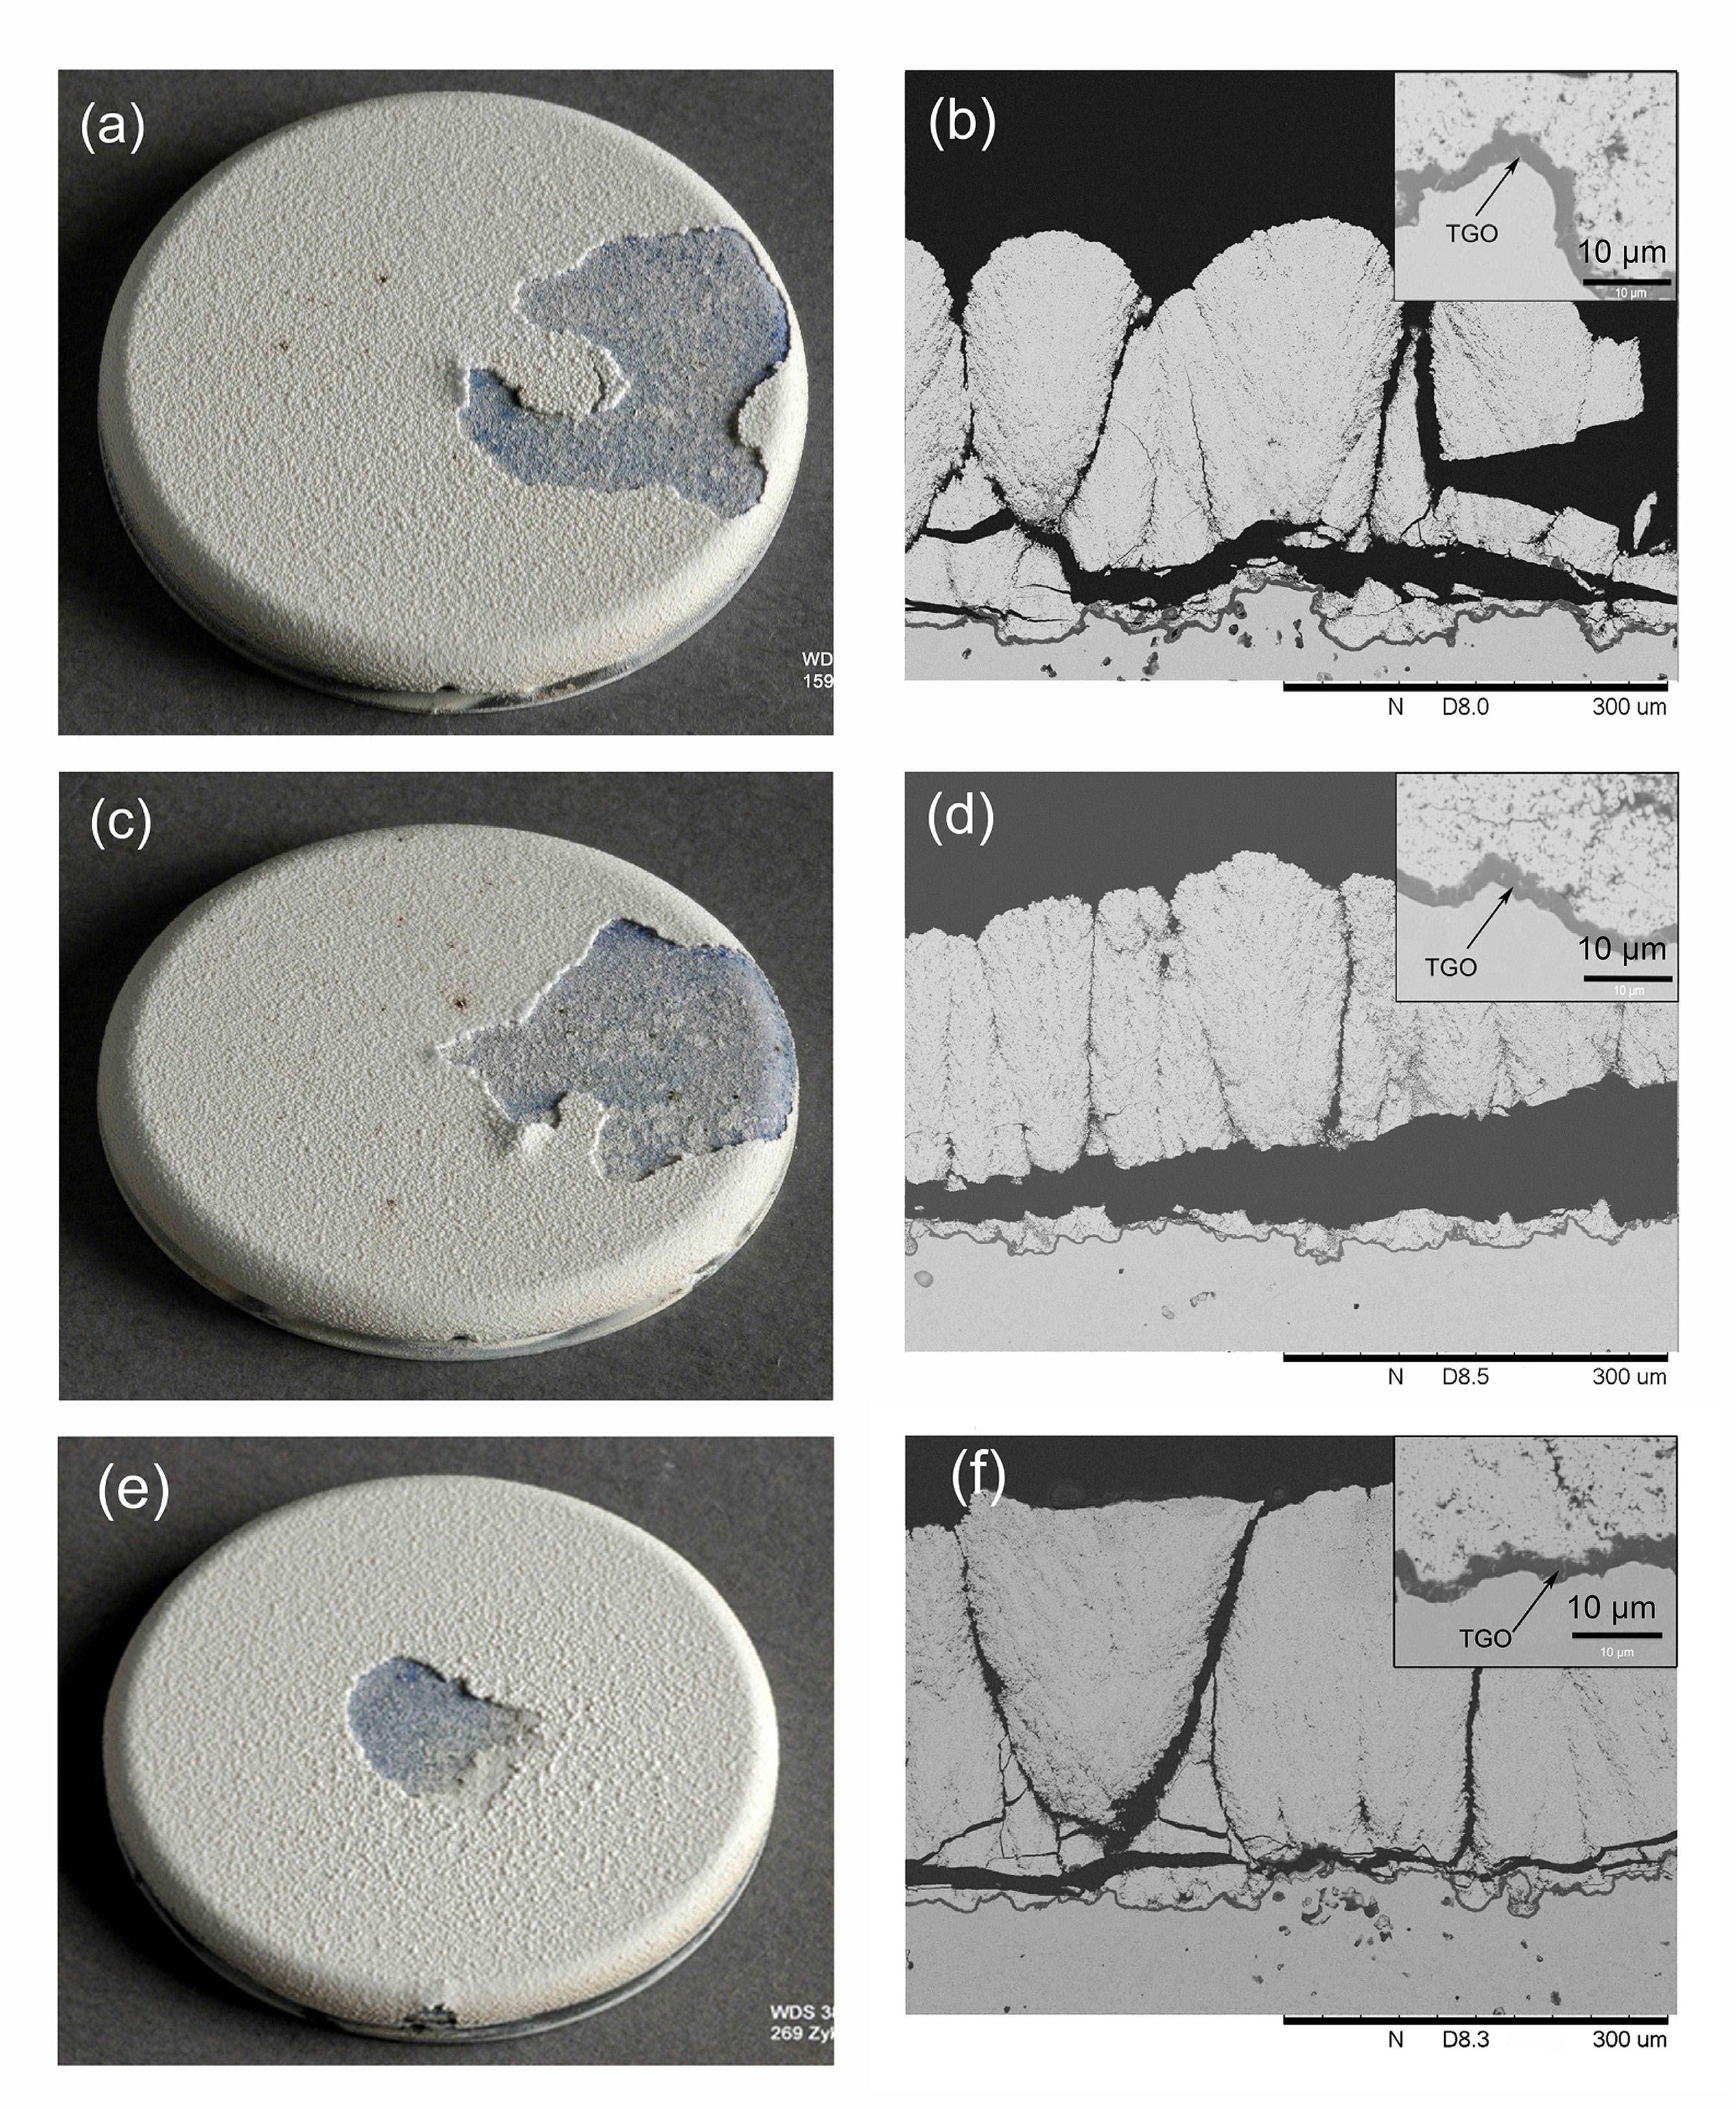
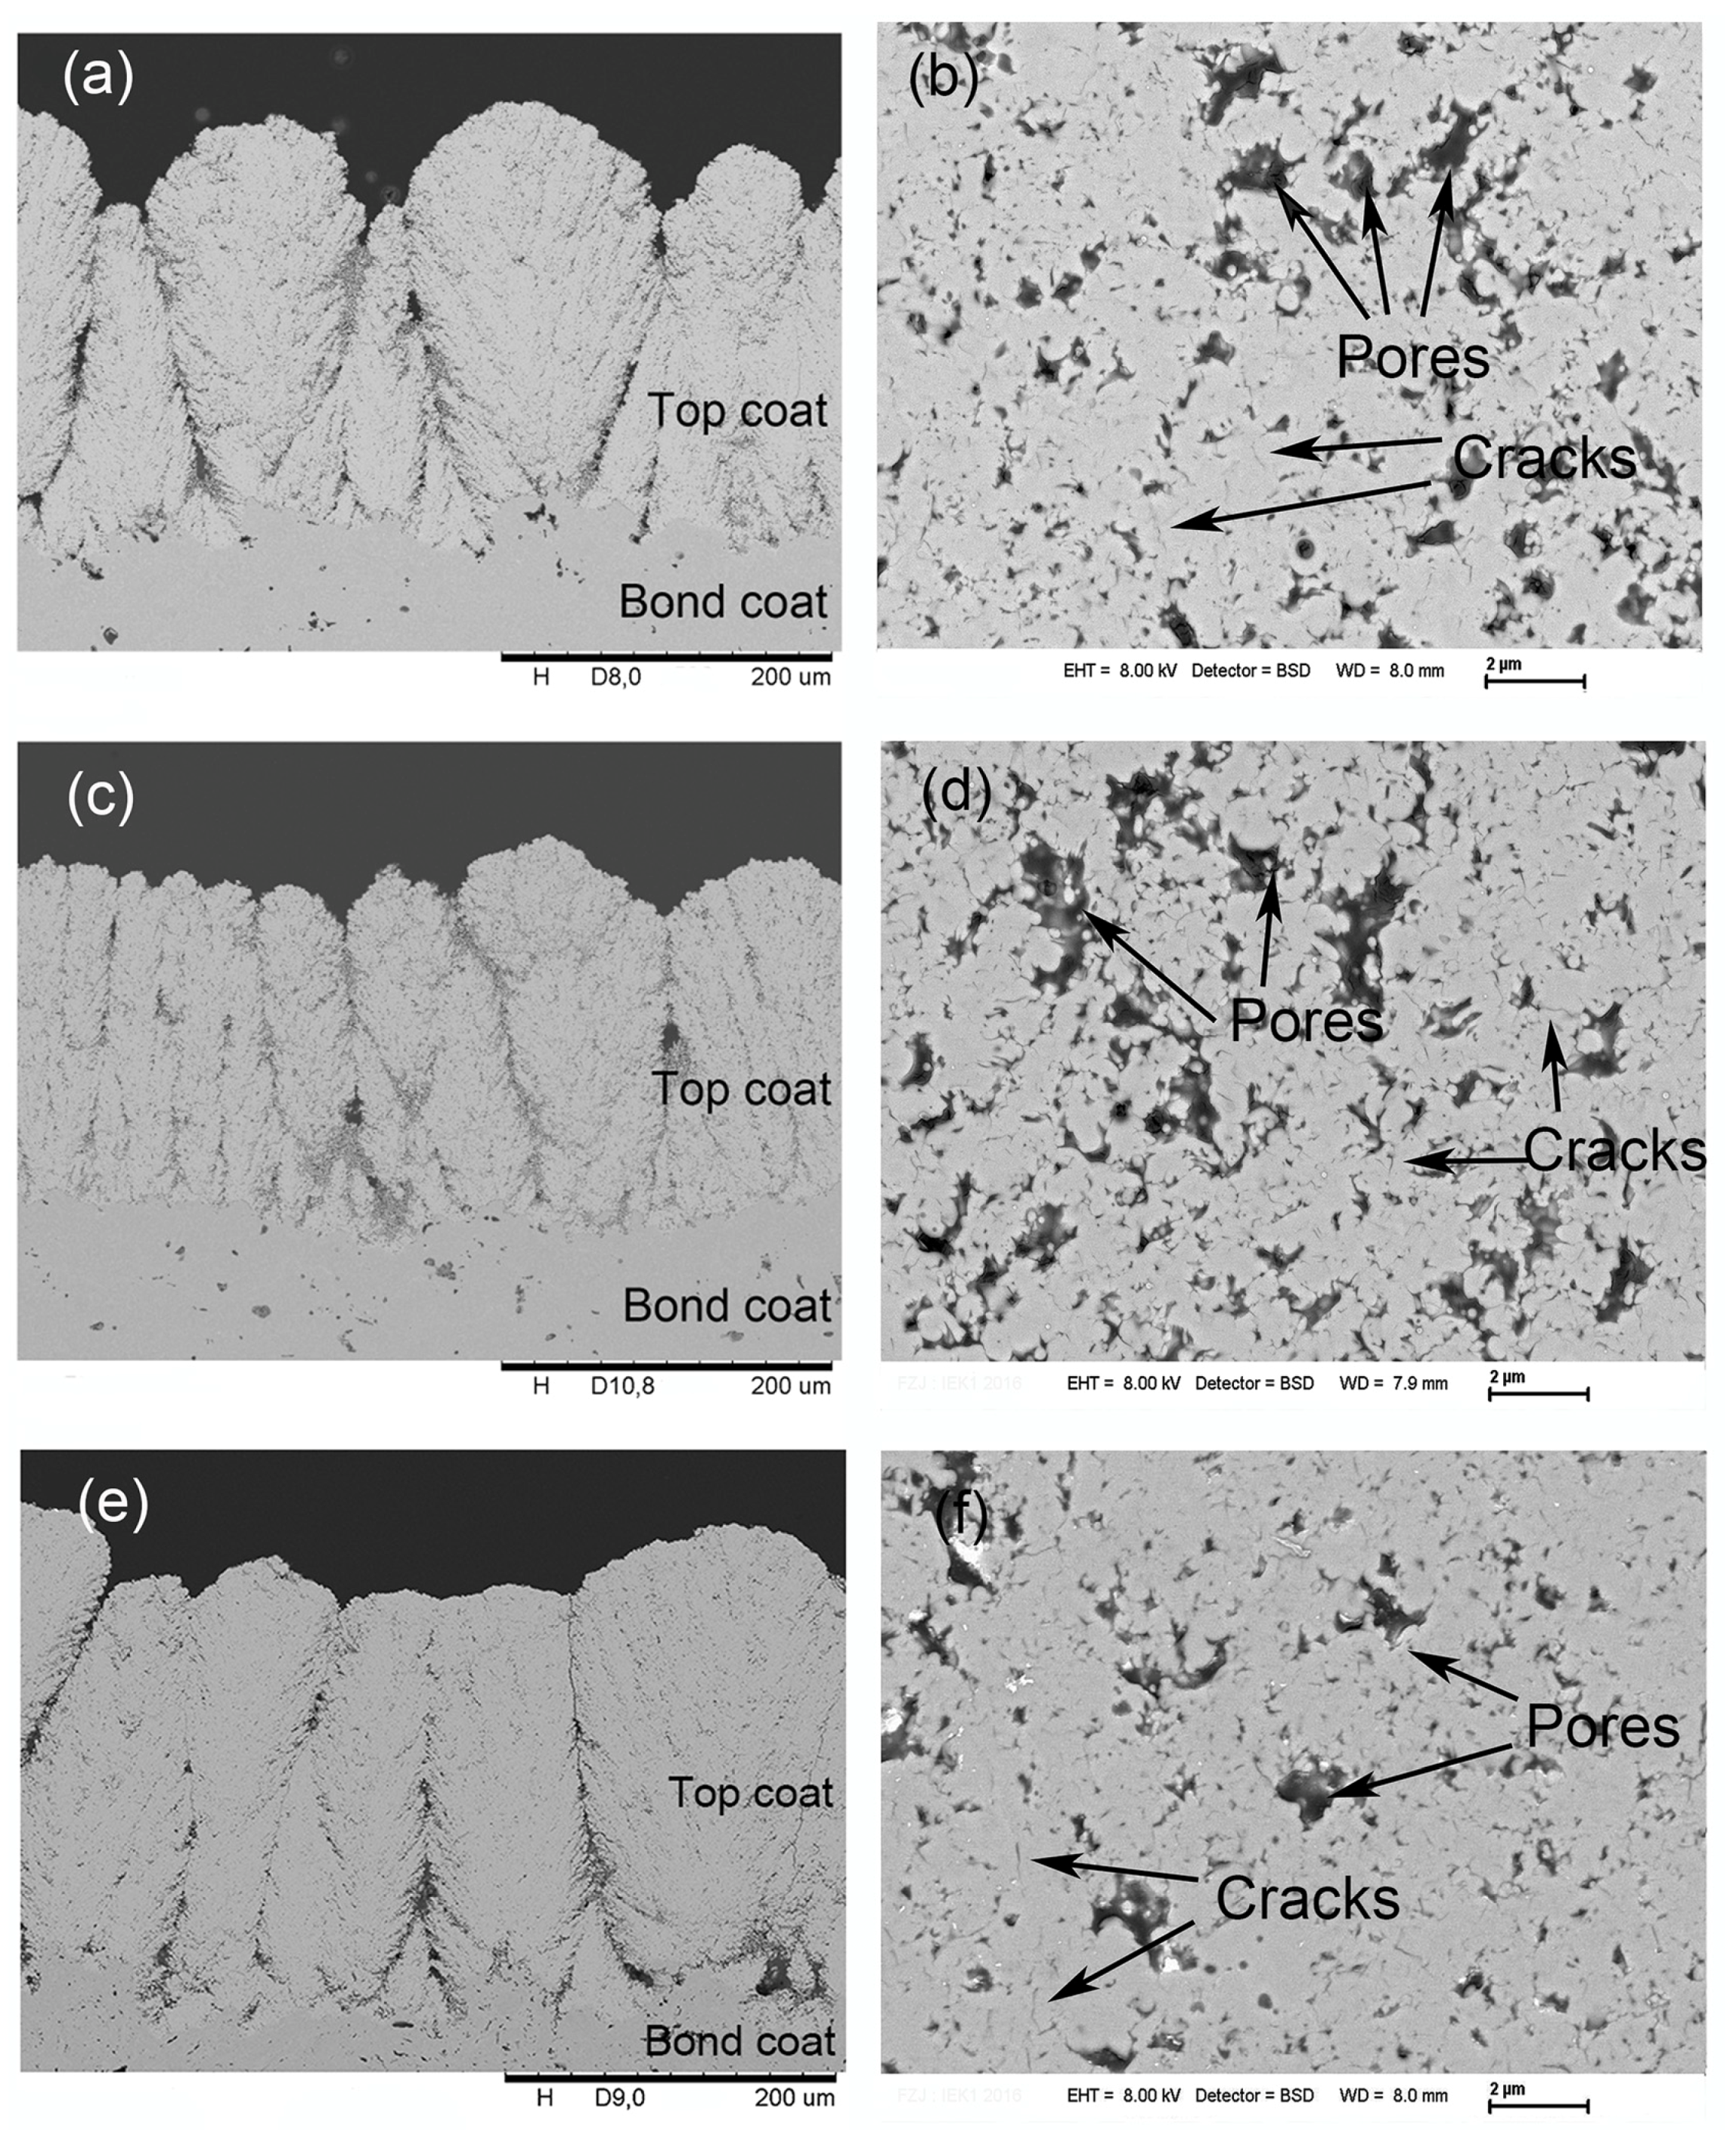
Based on the investigation of spraying conditions on microstructures, two well-developed columnar structured top coat (Samples M and N) were deposited on VPS bond-coated IN738 substrates for thermal cycling tests. The microstructure of the as-sprayed Samples M and N are shown in Figure 7. The column density for Samples M and N were 10.1 and 12.7/mm, respectively; the porosity determined with image analysis for Samples M and N were up to 22.8% and 29.1%. Sample N, which had a higher column density and porosity, was expected to have a higher strain tolerance and, thus, a longer thermal cycling lifetime under thermal load. However, it turned out that the average thermal cycling lifetime for Samples M and N (as shown in Table 2) were 177 and 76 cycles, respectively. The photographs and cross-section SEM images of thermally-cycled samples are presented in Figure 8. It can be seen on the photographs that a bit of white YSZ residue attached to the bond coat in the delaminated regions. From the cross-section images of the samples after thermal cycling testing, a similar delamination mode is found for both cases.
The delamination occurred within the top coats, parallel to the top coat/bond coat interface and just above the bond coat. As shown in Figure 8, for both samples the thermal growth oxide (TGO) were formed on the bond coat, but the thickness was limited (2–3 μm). Compared to typical TGO thickness at failure (6–12 μm) [1] the result indicates that the TGO layer growth is not the major reason for the premature failure of the YSZ top coats.
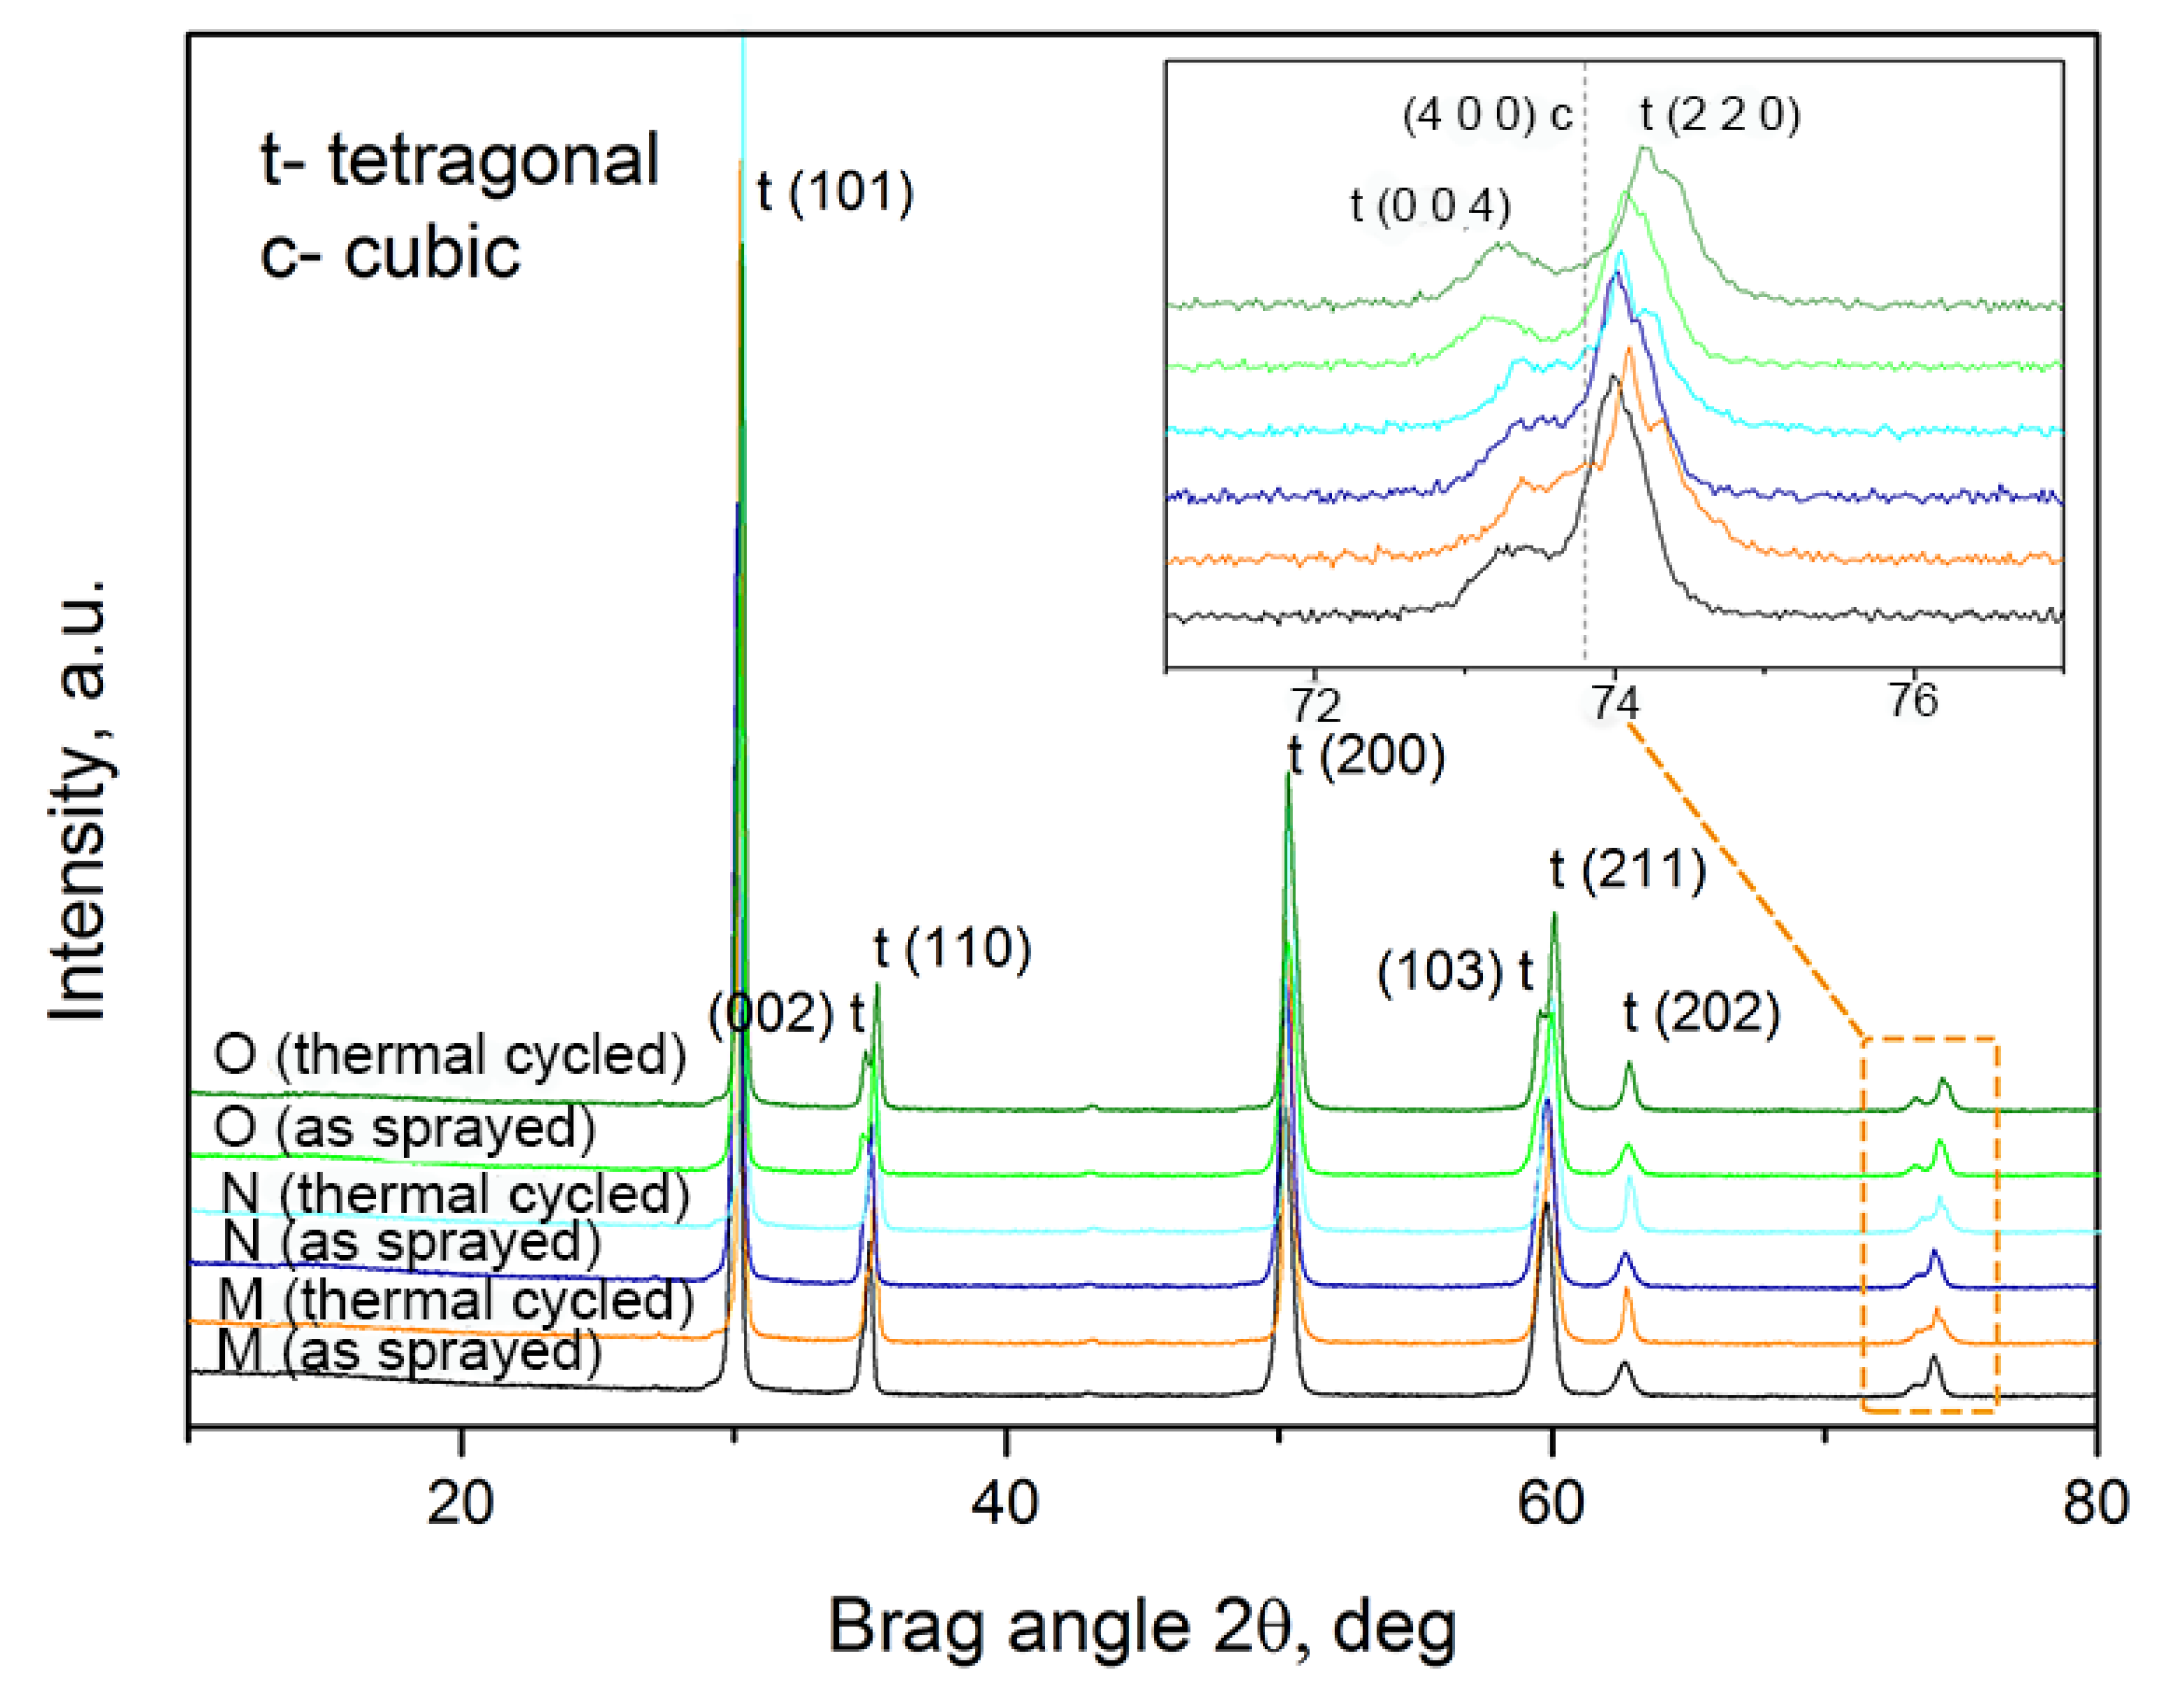
As reported in [38], at a temperature above 1200 °C, YSZ shows an insufficient phase stability. The metastable t’ phase, which is formed due to rapid cooling during the deposition process, undergoes a phase transformation into the equilibrium phases (tetragonal and cubic) at high temperature; and upon cooling, the tetragonal phase will transform into the monoclinic phase companied by a volume change. This volume change leads to stresses in the coating and is detrimental for the thermal cycling lifetime of coatings. Thus, an XRD analysis was performed on thermally-cycled samples to investigate the phase evolution during thermal cycling. As shown in Figure 9, all the observed peaks in the XRD patterns of the as-sprayed samples can be attributed to the tetragonal phase. According to the lattice parameter results, the ratio for the tetragonal phase falls into the range of 1.010 to 1.000. This indicates that the tetragonal phase in the as-sprayed coating is non-transformable [39]. After thermal cycling, no monoclinic phase was detected from the XRD patterns and the tetragonal phase was non-transformable; but a cubic phase was detected from both thermally-cycled Samples M and N. According to quantitative analysis, the amount of cubic phase in the both coatings is around 12 wt %. The cubic phase with low fracture toughness is detrimental to the lifetime of the coatings. The formation of relatively large amounts of the cubic phase during thermal cycling testing is probably due to the fairly high yttria content in the coatings. In order to exclude the effect of relatively higher yttria content on the lifetime of the coatings, Sample O was produced with 7.5 wt % yttria-stabilized zirconia powder. As a result of using the same spraying parameters, Sample O (as shown in Figure 7e) exhibited similar columnar microstructures as Sample M (Figure 7a). After spraying, Sample O was subjected to thermal cycling testing. It showed that the average lifetime of Sample O is 244 cycles. Compared with Sample M, the lifetime of Sample O was improved slightly, but was still short. From the photograph (Figure 8e) and cross-section SEM image (Figure 8f) of thermally-cycled Sample O, it can be seen that the failure mode is similar to that of Samples M and N. Additionally, the thickness of the TGO layer for Sample O was very thin (about 2–3 μm). The XRD diagrams of as-sprayed and thermally-cycled Sample O are presented in Figure 9. According to the lattice parameter results, the tetragonal phase in as-sprayed and thermally-cycled coatings was non-transformable. In addition, the amount of cubic phase in the thermally-cycled coating was decreased to about 7 wt %. It seems that the relatively high yttria content and the phase transformation of YSZ are not the main reasons for the premature failure of SPS coatings.
Another possible explanation for the premature failure of YSZ top coats might be the different mechanical properties, like Young’s modulus and fracture toughness, of the SPS coatings. Hence, indentation tests have been conducted to evaluate these properties.
Mechanical properties of as-sprayed and thermally-cycled Samples M, N, and O are listed in Table 3. The as-sprayed fracture toughness for all three samples is lower than the value of typical APS coatings, which is about 2.0–3.3 MPa·m1/2 [40]. Sample M, with a longer thermal cycling lifetime, exhibits a higher indentation fracture toughness than Sample N. On the other hand, this sample also shows a higher Young’s modulus and, hence, a typically higher stress level was expected during thermal cycling. In order to obtain a better insight into which factor could be the most important one, a simplified evaluation was made.
Due to thermal expansion mismatch between the YSZ top coat and the metallic substrate, thermal stress is built up during thermal cycling. This stress will be determined by the mismatch strain ∆ε which is proportional to the mismatch of the thermal expansion coefficients of coating and substrate (~5 × 10⁻⁶ /K) multiplied by the temperature change during cycling (~1000 K) and the Young’s modulus E of the coating. Of course, the columnar structure leads to an increasing reduction of the stress with the increasing ratio of the coating thickness (for completely penetrating cracks) to crack spacing [41]. On the other hand, stresses will remain in the coating, especially in the center part of the columns close to the top coat/bond coat interface.
Crack propagation and, hence, failure will be governed by the stress intensity factor KI, proportional to the stress multiplied by the square root of the defect size c and a geometry factor Y, which is 2/π1/2 for spherical pores (and assumed here):
Generally, the crack growth rate dc/dt is proportional to the ratio of the stress intensity to the critical stress intensity KIC factor (or toughness) with an (often rather high) exponent n; assuming the initial crack size c is much smaller than the critical crack size ac, the lifetime tf obtained by integration can be approximated by:
This formula has been used to evaluate the lifetime assuming a rather low strain in the columnar structures (reduced by a factor of two due to the columnar structure) [42]. The results are given in Table 4. The initial defect size c was estimated as being the mean value of the largest 10% of pores. The defect size results are presented in Table 4. As a result of sintering, the elastic modulus and fracture toughness of samples increase during thermal cycling tests. The average elastic modulus and fracture toughness of samples before and after thermal cycling testing were used to calculate the lifetime according to Equation (7).
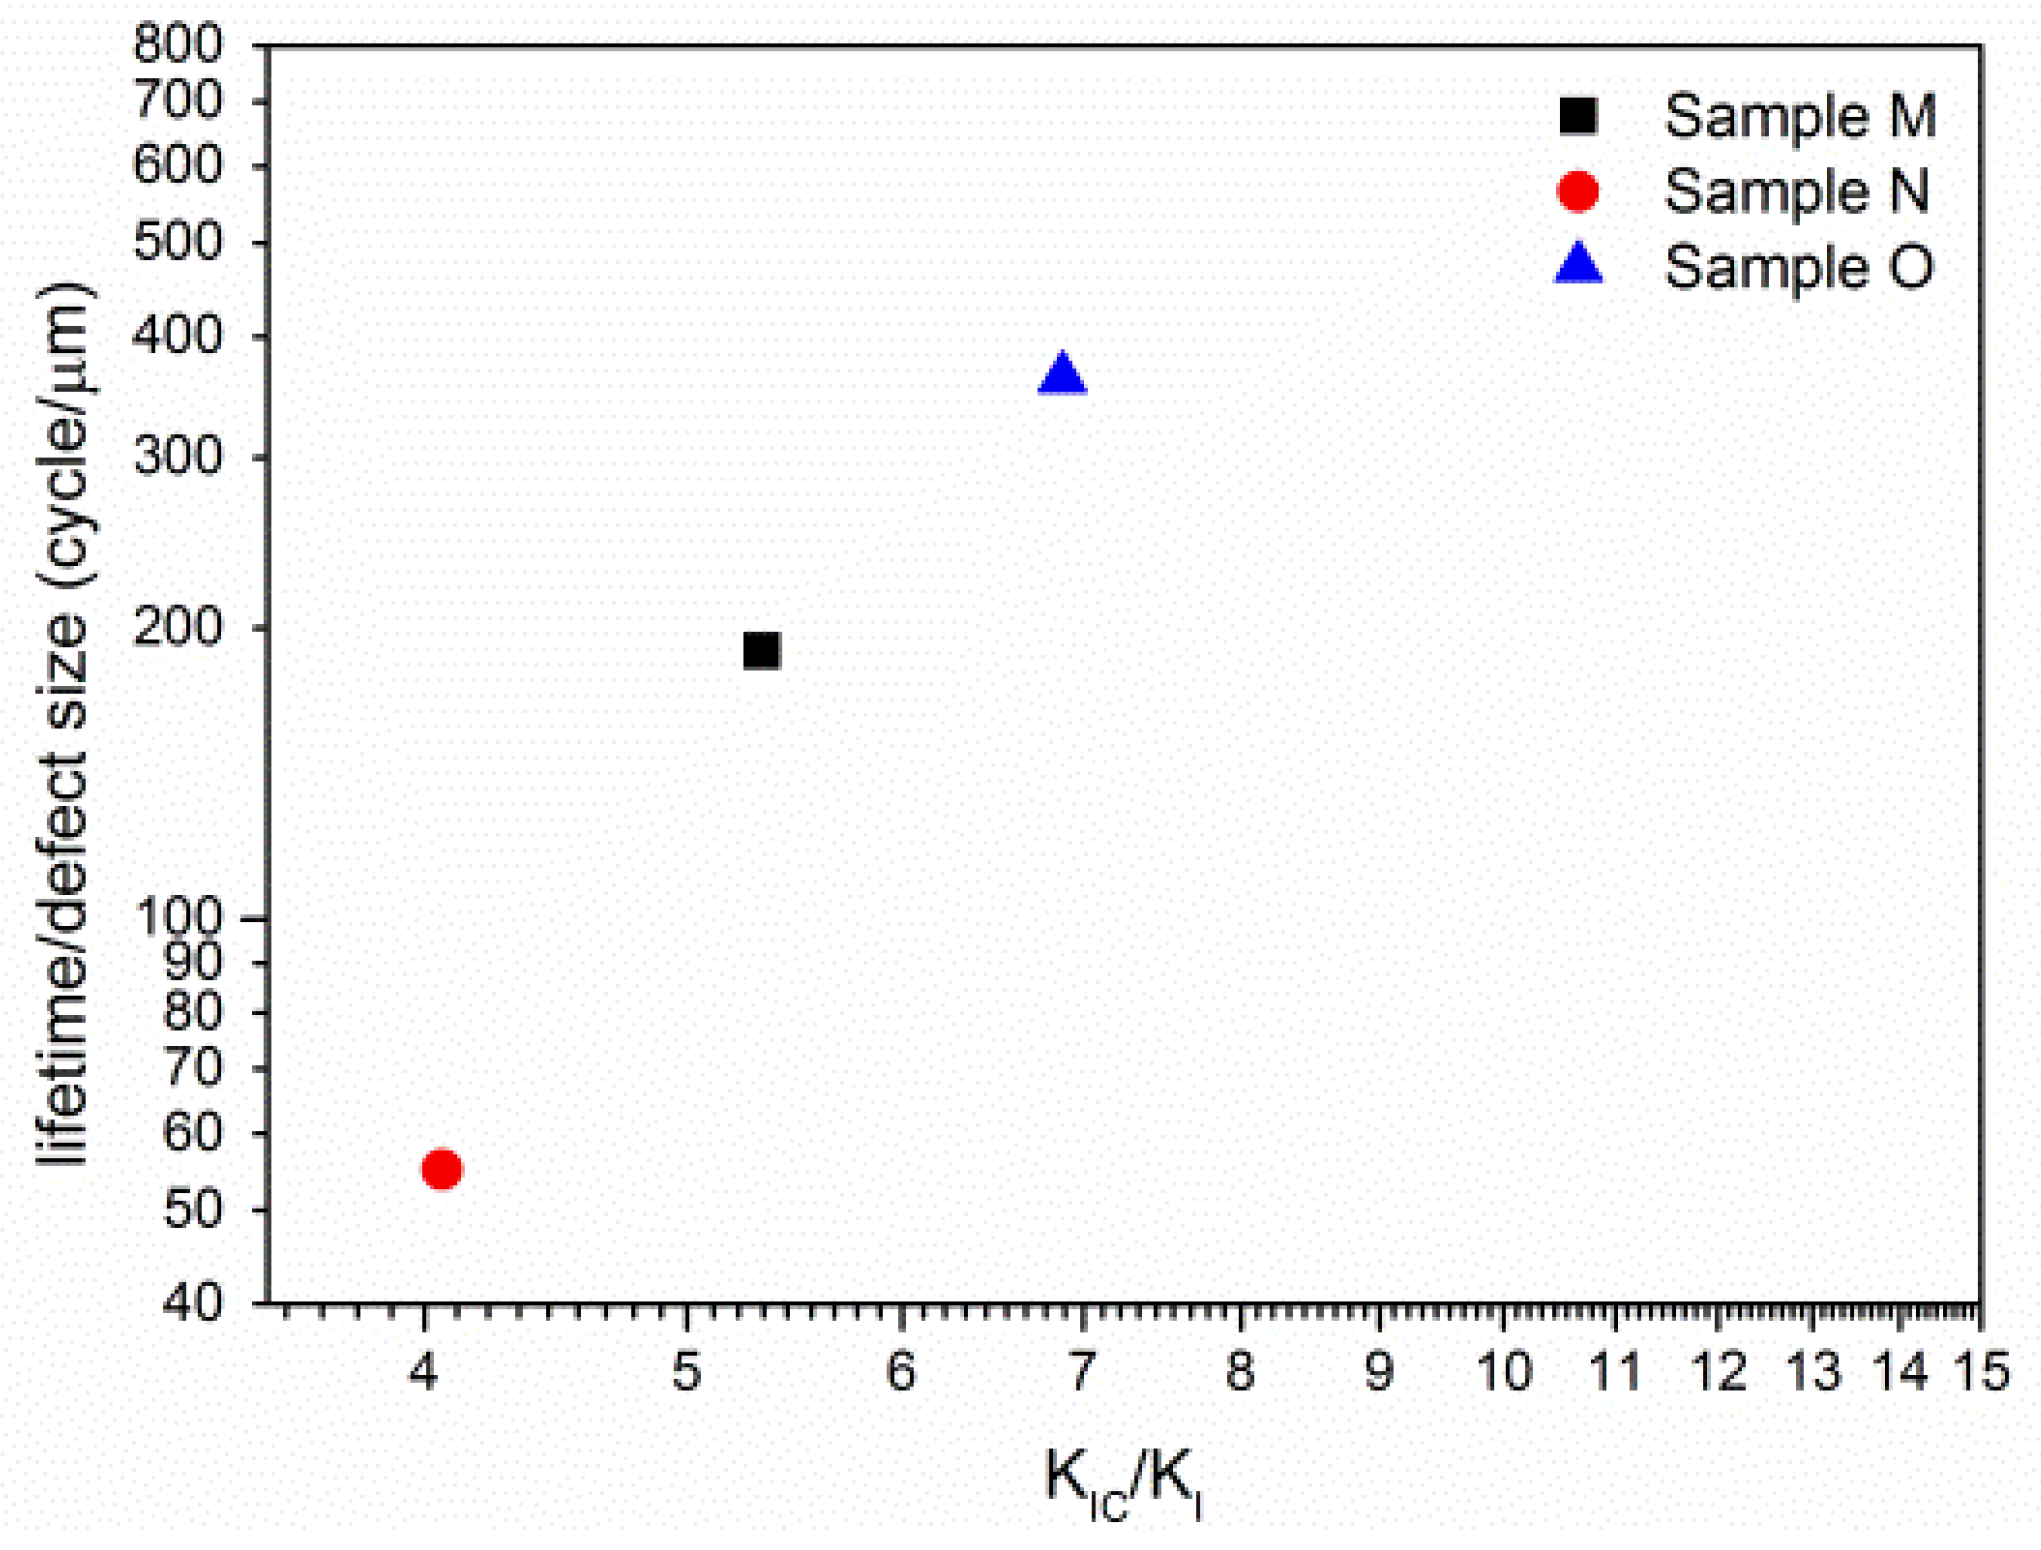
A plot of the data points plotted in a log-log scale is shown in Figure 10. The rather linear distribution of the data points in this plot indicates that Equation (7) might be an appropriate description of the lifetime data. However, it should be noticed that the exponent n obtained from the slope in Figure 10 is 3.5 and this value is rather small compared to typical results found for ceramics [43]. A more elaborate analysis is necessary. However, the main goal of the lifetime evaluation was to distinguish the relevant reasons for the premature failure of SPS TBCs. Here the correlation between toughness and lifetime shed light on the failure mechanism of SPS TBCs, that the lower fracture toughness of SPS coatings could be the major reason for their early failure.
4. Conclusions
In this study, thermal barrier coatings with different microstructures were deposited with axial suspension plasma spraying. The effects of spraying conditions on the microstructure of top coats and deposition efficiency were investigated. Additionally, thermal cycling tests were performed on the columnar structured TBCs. The main conclusions are as follows:
- Among the spraying parameters, bond coat roughness and stand-off distance played a dominant role on the microstructure formation of the top coats. Both increasing stand-off distance and reducing bond coat roughness increased the column density. Lowering the solid content in the suspension promotes the growth of columns. Also bond coat roughness, stand-off distance, and input power also had a significant influence on the microstructure and porosity of the top coats. Increasing bond coat roughness and stand-off distance, lowering input power, as well as the solid content in the suspension could enhance the porosity level of the coatings.
- The SPS process with axial injection had a high deposition efficiency of up to 60.7%. The deposition efficiency was mainly influenced by the stand-off distance. With increase of it, the deposition efficiency dropped greatly.
- Columnar-structured SPS TBCs exhibited a moderate thermal cycling performance. An evaluation of the major influencing factors of the lifetime showed that the relatively low fracture toughness is probably the main reason for the premature failure of the SPS TBCs.
Acknowledgments
This work was financially supported by the Helmholtz Association of German Research Centers and the China Scholarship Council (CSC). The authors sincerely acknowledge the contributions of the following colleagues in our institution: Karl-Heinz Rauwald for his invaluable assistance during suspension plasma spraying, Martin Tandler for carrying out the thermal cycling work, Hiltrud Moitroux for taking photographs, Sohn Yoo Jung for quantitative analysis on XRD results, and Sebold Doris for making part of the SEM images. The authors would also like to thank Jürgen Malzbender (IEK-2) for the support of the indentation tests.
Author Contributions
Dapeng Zhou conceived, designed, and performed the experiments, analyzed the data, and co-wrote the article; Olivier Guillon discussed the results and co-wrote the article; and Robert Vaßen directed the experiments, analyzed the data, and co-wrote the article.
Conflicts of Interest
The authors declare no conflict of interest.
References
- Vaßen, R.; Giesen, S.; Stöver, D. Lifetime of plasma-sprayed thermal barrier coatings: Comparison of numerical and experimental results. J. Therm. Spray Technol. 2009, 18, 835–845. [Google Scholar] [CrossRef]
- Vassen, R.; Stuke, A.; Stöver, D. Recent developments in the field of thermal barrier coatings. J. Therm. Spray Technol. 2009, 18, 181–186. [Google Scholar] [CrossRef]
- Heberlein, J.V.; Fauchais, P.; Boulos, M.I. Thermal Spray Fundamental; Springer: New York, NY, USA, 2014. [Google Scholar]
- Cao, X.Q.; Vassen, R.; Stoever, D. Ceramic materials for thermal barrier coatings. J. Eur. Ceram. Soc. 2004, 24, 1–10. [Google Scholar] [CrossRef]
- Sampath, S.; Schulz, U.; Jarligo, M.O.; Kuroda, S. Processing science of advanced thermal-barrier systems. MRS Bull. 2012, 37, 903–910. [Google Scholar] [CrossRef]
- Schulz, U.; Saruhan, B.; Fritscher, K.; Leyens, C. Review on advanced EB-PVD ceramic topcoats for TBC applications. Int. J. Appl. Ceram. Technol. 2004, 1, 302–315. [Google Scholar] [CrossRef]
- Mauer, G.; Schlegel, N.; Guignard, A.; Jarligo, M.; Rezanka, S.; Hospach, A.; Vassen, R. Plasma spraying of ceramics with particular difficulties in processing. J. Therm. Spray Technol. 2015, 24, 30–37. [Google Scholar] [CrossRef]
- Nordhorn, C.; Mücke, R.; Mack, D.E.; Vassen, R. Probabilistic lifetime model for atmospherically plasma sprayed thermal barrier coating systems. Mech. Mater. 2016, 93, 199–208. [Google Scholar] [CrossRef]
- Bernard, B.; Bianchi, L.; Malié, A.; Joulia, A.; Rémy, B. Columnar suspension plasma sprayed coating microstructural control for thermal barrier coating application. J. Eur. Ceram. Soc. 2015, 36, 1081–1089. [Google Scholar] [CrossRef]
- Padture, N.P.; Gell, M.; Jordan, E.H. Materials science—Thermal barrier coatings for gas-turbine engine applications. Science 2002, 296, 280–284. [Google Scholar] [CrossRef] [PubMed]
- Schlegel, N.; Ebert, S.; Mauer, G.; Vassen, R. Columnar-structured mg-al-spinel thermal barrier coatings (TBCs) by suspension plasma spraying (SPS). J. Therm. Spray Technol. 2015, 24, 144–151. [Google Scholar] [CrossRef]
- Schlegel, N.; Sebold, D.; Sohn, Y.; Mauer, G.; Vassen, R. Cycling performance of a columnar-structured complex perovskite in a temperature gradient test. J. Therm. Spray Technol. 2015, 24, 1205–1212. [Google Scholar] [CrossRef]
- Ganvir, A.; Curry, N.; Markocsan, N.; Nylén, P.; Toma, F.L. Comparative study of suspension plasma sprayed and suspension high velocity oxy-fuel sprayed YSZ thermal barrier coatings. Surf. Coat. Technol. 2015, 268, 70–76. [Google Scholar] [CrossRef]
- VanEvery, K.; Krane, M.J.; Trice, R.W.; Wang, H.; Porter, W.; Besser, M.; Sordelet, D.; Ilavsky, J.; Almer, J. Column formation in suspension plasma-sprayed coatings and resultant thermal properties. J. Therm. Spray Technol. 2011, 20, 817–828. [Google Scholar] [CrossRef]
- Delbos, C.; Fazilleau, J.; Rat, V.; Coudert, J.F.; Fauchais, P.; Pateyron, B. Phenomena involved in suspension plasma spraying part 2: Zirconia particle treatment and coating formation. Plasma Chem. Plasma Process. 2006, 26, 393–414. [Google Scholar] [CrossRef]
- Ganvir, A.; Curry, N.; Markocsan, N.; Nylén, P.; Joshi, S.; Vilemova, M.; Pala, Z. Influence of microstructure on thermal properties of axial suspension plasma-sprayed YSZ thermal barrier coatings. J. Therm. Spray Technol. 2016, 25, 202–212. [Google Scholar] [CrossRef]
- Curry, N.; Tang, Z.; Markocsan, N.; Nylén, P. Influence of bond coat surface roughness on the structure of axial suspension plasma spray thermal barrier coatings—Thermal and lifetime performance. Surf. Coat. Technol. 2015, 268, 15–23. [Google Scholar] [CrossRef]
- Tang, Z.; Kim, H.; Yaroslavski, I.; Masindo, G.; Celler, Z.; Ellsworth, D. Novel Thermal Barrier Coatings Produced by Axial Suspension Plasma Spray. In Proceedings of the International Thermal Spray Conference, Hamburg, Germany, 27–29 September 2011. [Google Scholar]
- Berghaus, J.O.; Legoux, J.-G.; Moreau, C.; Tarasi, F.; Chraska, T. Mechanical and thermal transport properties of suspension thermal-sprayed alumina-zirconia composite coatings. J. Therm. Spray Technol. 2008, 17, 91–104. [Google Scholar] [CrossRef]
- Guignard, A.; Mauer, G.; Vaßen, R.; Stöver, D. Deposition and characteristics of submicrometer-structured thermal barrier coatings by suspension plasma spraying. J. Therm. Spray Technol. 2012, 21, 416–424. [Google Scholar] [CrossRef]
- Sokołowski, P.; Kozerski, S.; Pawłowski, L.; Ambroziak, A. The key process parameters influencing formation of columnar microstructure in suspension plasma sprayed zirconia coatings. Surf. Coat. Technol. 2014, 260, 97–106. [Google Scholar] [CrossRef] [Green Version]
- Joulia, A.; Duarte, W.; Goutier, S.; Vardelle, M.; Vardelle, A.; Rossignol, S. Tailoring the spray conditions for suspension plasma spraying. J. Therm. Spray Technol. 2015, 24, 24–29. [Google Scholar] [CrossRef]
- Rajasekaran, B.; Mauer, G.; Vassen, R. Enhanced characteristics of hvof-sprayed mcraly bond coats for tbc applications. J. Therm. Spray Technol. 2011, 20, 1209–1216. [Google Scholar] [CrossRef]
- Guignard, A. Development of Thermal Spray Processes with Liquid Feedstocks; Forschungszentrum Jülich: Jülich, Germany, 2012. [Google Scholar]
- Schlegel, N. Untersuchungen Zu Suspensionsplasmagespritzten Wärmedämmschichtsystemen; Forschungszentrum, Zentralbibliothek: Jülich, Germany, 2016. (In Germany) [Google Scholar]
- Andreola, F.; Leonelli, C.; Romagnoli, M.; Miselli, P. Techniques used to determine porosity. Am. Ceram. Soc. Bull. 2000, 79, 49–52. [Google Scholar]
- Kong, M.; Bhattacharya, R.N.; James, C.; Basu, A. A statistical approach to estimate the 3d size distribution of spheres from 2d size distributions. Geol. Soc. Am. Bull. 2005, 117, 244–249. [Google Scholar] [CrossRef]
- Young, D.S.; Sachais, B.S.; Jefferies, L.C. The Rietveld Method; Springer: Berlin, Germany, 1993. [Google Scholar]
- Oliver, W.C.; Pharr, G.M. An improved technique for determining hardness and elastic modulus using load and displacement sensing indentation experiments. J. Mater. Res. 1992, 7, 1564–1583. [Google Scholar] [CrossRef]
- Choi, S.R.; Zhu, D.; Miller, R.A. Mechanical properties/database of plasma-sprayed ZrO2-8wt % Y2O3 thermal barrier coatings. Int. J. Appl. Ceram. Technol. 2004, 1, 330–342. [Google Scholar] [CrossRef]
- Niihara, K.; Morena, R.; Hasselman, D. Evaluation of k lc of brittle solids by the indentation method with low crack-to-indent ratios. J. Mater. Sci. Lett. 1982, 1, 13–16. [Google Scholar] [CrossRef]
- Sergejev, F.; Antonov, M. Comparative study on indentation fracture toughness measurements of cemented carbides. Proc. Estonian Acad. Sci. Eng. 2006, 12, 388–398. [Google Scholar]
- Traeger, F.; Vaßen, R.; Rauwald, K.H.; Stöver, D. Thermal cycling setup for testing thermal barrier coatings. Adv. Eng. Mater. 2003, 5, 429–432. [Google Scholar] [CrossRef]
- Karger, M.; Vaßen, R.; Stöver, D. Atmospheric plasma sprayed thermal barrier coatings with high segmentation crack densities: Spraying process, microstructure and thermal cycling behavior. Surf. Coat. Technol. 2011, 206, 16–23. [Google Scholar] [CrossRef]
- Guo, H.; Vaßen, R.; Stöver, D. Atmospheric plasma sprayed thick thermal barrier coatings with high segmentation crack density. Surf. Coat. Technol. 2004, 186, 353–363. [Google Scholar] [CrossRef]
- Fauchais, P.; Montavon, G. Thermal and Cold Spray: Recent Developments. In Key Engineering Materials; Trans Tech Publications: Zürich, Switzerland, 2008; pp. 1–59. [Google Scholar]
- Moign, A.; Vardelle, A.; Themelis, N.; Legoux, J. Life cycle assessment of using powder and liquid precursors in plasma spraying: The case of yttria-stabilized zirconia. Surf. Coat. Technol. 2010, 205, 668–673. [Google Scholar] [CrossRef]
- Vassen, R.; Cao, X.Q.; Tietz, F.; Basu, D.; Stover, D. Zirconates as new materials for thermal barrier coatings. J. Am. Ceram. Soc. 2000, 83, 2023–2028. [Google Scholar] [CrossRef]
- Viazzi, C.; Bonino, J.P.; Ansart, F.; Barnabé, A. Structural study of metastable tetragonal ysz powders produced via a sol–gel route. J. Alloy. Compd. 2008, 452, 377–383. [Google Scholar] [CrossRef] [Green Version]
- Beshish, G.; Florey, C.; Worzala, F.; Lenling, W. Fracture toughness of thermal spray ceramic coatings determined by the indentation technique. J. Therm. Spray Technol. 1993, 2, 35–38. [Google Scholar] [CrossRef]
- Schulze, G.W.; Erdogan, F. Periodic cracking of elastic coatings. Int. J. Solids Struct. 1998, 35, 3615–3634. [Google Scholar] [CrossRef]
- Vaßen, R.; Kerkhoff, G.; Stöver, D. Development of a micromechanical life prediction model for plasma sprayed thermal barrier coatings. Mater. Sci. Eng. A 2001, 303, 100–109. [Google Scholar] [CrossRef]
- Munz, D.; Fett, T. Ceramics: Mechanical Properties, Failure Behaviour, Materials Selection; Springer Science & Business Media: Berlin, Germany, 2013. [Google Scholar]
Figure 1.
Cross-section SEM image of as sprayed YSZ top coats (Samples A, B, C, and D) deposited at a standoff distance of 70 mm, on BC with different surface treatments: (a) mirror polishing; (b) grinding; (c) grit blasting; and (d) as-sprayed.
Figure 1.
Cross-section SEM image of as sprayed YSZ top coats (Samples A, B, C, and D) deposited at a standoff distance of 70 mm, on BC with different surface treatments: (a) mirror polishing; (b) grinding; (c) grit blasting; and (d) as-sprayed.

Figure 2.
Crack/column density (a), deposition efficiency (b), and porosity (c) for as-sprayed YSZ top coats (Samples A, B, C, and D) deposited on BC with different surface treatments.
Figure 2.
Crack/column density (a), deposition efficiency (b), and porosity (c) for as-sprayed YSZ top coats (Samples A, B, C, and D) deposited on BC with different surface treatments.

Figure 3.
Cross-section SEM images of as-sprayed YSZ top coats (Samples E–I) deposited at a standoff distance of 100 mm, on BC with different surface treatments: (a) mirror polishing; (b) grinding; (c) grit blasting; (d) as-sprayed; and (e) as-sprayed rough.
Figure 3.
Cross-section SEM images of as-sprayed YSZ top coats (Samples E–I) deposited at a standoff distance of 100 mm, on BC with different surface treatments: (a) mirror polishing; (b) grinding; (c) grit blasting; (d) as-sprayed; and (e) as-sprayed rough.

Figure 4.
Column density (a), deposition efficiency (b) porosity (c) for as sprayed YSZ top coats (Samples E–I) deposited with 100 mm standoff distance on BC with different surface treatments.
Figure 4.
Column density (a), deposition efficiency (b) porosity (c) for as sprayed YSZ top coats (Samples E–I) deposited with 100 mm standoff distance on BC with different surface treatments.

Figure 5.
Cross-section image of the as-sprayed YSZ top coat (Sample J) deposited at a 70 mm standoff distance with 84 KW input power on as-sprayed BC.
Figure 5.
Cross-section image of the as-sprayed YSZ top coat (Sample J) deposited at a 70 mm standoff distance with 84 KW input power on as-sprayed BC.

Figure 6.
Cross-section images of as-sprayed YSZ top coats (Samples K (a) and L (b)) sprayed with 5 wt % solid content suspension on as-sprayed BC.
Figure 6.
Cross-section images of as-sprayed YSZ top coats (Samples K (a) and L (b)) sprayed with 5 wt % solid content suspension on as-sprayed BC.

Figure 7.
Cross-section SEM images for as-sprayed YSZ top coats: (a) Sample M, (c) Sample N, (e) Sample O; and the detailed microstructure within columns: (b) Sample M, (d) Sample N, and (f) Sample O.
Figure 7.
Cross-section SEM images for as-sprayed YSZ top coats: (a) Sample M, (c) Sample N, (e) Sample O; and the detailed microstructure within columns: (b) Sample M, (d) Sample N, and (f) Sample O.

Figure 8.
Photographs of thermally-cycled samples: (a) Sample M, (c) Sample N, and (e) Sample O; and cross-section SEM images of thermally-cycled samples: (b) Sample M, (d) Sample N, and (f) Sample O.
Figure 8.
Photographs of thermally-cycled samples: (a) Sample M, (c) Sample N, and (e) Sample O; and cross-section SEM images of thermally-cycled samples: (b) Sample M, (d) Sample N, and (f) Sample O.

Figure 9.
X-ray diffractograms of the as-sprayed and thermally-cycled YSZ samples (M, N, and O).

Figure 10.
Plot of the lifetime tf divided by the initial crack length c as a function of the critical stress intensity factor divided by the apparent one (see Equation (7)) for the samples given in Table 3.
Figure 10.
Plot of the lifetime tf divided by the initial crack length c as a function of the critical stress intensity factor divided by the apparent one (see Equation (7)) for the samples given in Table 3.


Table 1.
Spray parameters used for YSZ top coats.
| No. | D (mm) | P (kW) | S (wt %) | I (A) | Surface Preparation |
|---|---|---|---|---|---|
| A | 70 | 105 | 10 | 750 | Mirror polishing |
| B | 70 | 105 | 10 | 750 | Grinding |
| C | 70 | 105 | 10 | 750 | Grit blasting |
| D | 70 | 105 | 10 | 750 | As sprayed |
| E | 100 | 105 | 10 | 750 | Mirror polishing |
| F | 100 | 105 | 10 | 750 | Grinding |
| G | 100 | 105 | 10 | 750 | Grit blasting |
| H | 100 | 105 | 10 | 750 | As sprayed |
| I | 100 | 105 | 10 | 750 | As sprayed (rough) |
| J | 70 | 84 | 10 | 600 | As sprayed |
| K | 70 | 105 | 5 | 750 | As sprayed |
| L | 100 | 105 | 5 | 750 | As sprayed |
| M | 70 | 105 | 5 | 750 | As sprayed |
| N | 100 | 105 | 5 | 750 | As sprayed |
| O | 70 | 105 | 5 | 750 | As sprayed * |
D: standoff distance (mm); P: input power (kW); S: solid content in suspension (wt %); I: current (A); *: deposited with 7.5 wt % YSZ powder.
Table 2.
Overview on thermally-cycled samples.
| Sample | No. | Thickness (μm) | Bond Coat/Top Coat Interface Temperature (°C) | Top Coat Surface Temperature (°C) | Top Coat Temperature Gradient (°C/μm) | Lifetime (Cycles) |
|---|---|---|---|---|---|---|
| M | 1 | ~255 | 1119 | 1346 | 1.10 | 193 |
| 2 | ~257 | 1098 | 1284 | 0.78 | 160 | |
| N | 1 | ~257 | 1118 | 1384 | 1.10 | 81 |
| 2 | ~245 | 1121 | 1362 | 1.14 | 71 | |
| O | 1 | ~289 | 1094 | 1277 | 0.63 | 218 |
| 2 | ~317 | 1089 | 1283 | 0.61 | 269 |
Table 3.
Mechanical properties of as-sprayed and thermally-cycled Samples K, L, and M.
| Sample | Condition | Hardness (GPa) | Elastic Modulus (GPa) | Fracture Toughness (MPa·m1/2) |
|---|---|---|---|---|
| M | As sprayed | 9.6 ± 1.1 | 113.7 ± 10.4 | 1.5 ± 0.3 |
| Thermal cycled | 10.2 ± 1.4 | 159.5 ± 16.8 | 2.3 ± 0.3 | |
| N | As sprayed | 6.2 ± 0.9 | 81.9 ± 8.5 | 1.0 ± 0.2 |
| Thermal cycled | 8.4 ± 1.4 | 127.9 ± 15.3 | 1.8 ± 0.2 | |
| O | As sprayed | 8.3 ± 0.6 | 100.7 ± 7.0 | 1.7 ± 0.4 |
| Thermal cycled | 10.5 ± 1.0 | 167.5 ± 13.2 | 2.5 ± 0.3 |
Table 4.
Input parameters and evaluation according to Equation (7) for the SPS coatings.
| Sample | Strain | Defect Size (μm) | Average Elastic Modulus (GPa) | Average Fracture Toughness (MPa·m1/2) | Lifetime (Cycles) | Lifetime/Pore Size (Cycles/μm) | |
|---|---|---|---|---|---|---|---|
| M | 0.0025 | 0.93 | 134 | 1.8 | 5.06 | 177 | 189.2 |
| N | 0.0025 | 1.38 | 105 | 1.4 | 4.05 | 76 | 55.1 |
| O | 0.0025 | 0.67 | 134 | 2.1 | 6.87 | 244 | 362.4 |
© 2017 by the authors. Licensee MDPI, Basel, Switzerland. This article is an open access article distributed under the terms and conditions of the Creative Commons Attribution (CC BY) license (http://creativecommons.org/licenses/by/4.0/).
Share and Cite
MDPI and ACS Style
Zhou, D.; Guillon, O.; Vaßen, R. Development of YSZ Thermal Barrier Coatings Using Axial Suspension Plasma Spraying. Coatings 2017, 7, 120. https://doi.org/10.3390/coatings7080120
AMA Style
Zhou D, Guillon O, Vaßen R. Development of YSZ Thermal Barrier Coatings Using Axial Suspension Plasma Spraying. Coatings. 2017; 7(8):120. https://doi.org/10.3390/coatings7080120
Chicago/Turabian StyleZhou, Dapeng, Olivier Guillon, and Robert Vaßen. 2017. "Development of YSZ Thermal Barrier Coatings Using Axial Suspension Plasma Spraying" Coatings 7, no. 8: 120. https://doi.org/10.3390/coatings7080120
Note that from the first issue of 2016, this journal uses article numbers instead of page numbers. See further details here.