Application of Logistic Regression Models for the Marketability of Cucumber Cultivars
by
 ,
,
Manuel Díaz-Pérez
*, 
Ángel Carreño-Ortega
,
José-Antonio Salinas-Andújar
and
Ángel-Jesús Callejón-Ferre
Department of Engineering, University of Almería, Agrifood Campus of International Excellence (CeiA3), La Cañada de San Urbano, 04120 Almería, Spain
*
Author to whom correspondence should be addressed.
Agronomy 2019, 9(1), 17; https://doi.org/10.3390/agronomy9010017
Submission received: 15 November 2018
/
Revised: 8 December 2018
/
Accepted: 27 December 2018
/
Published: 3 January 2019
Abstract
:The aim of this study is to establish a binary logistic regression method to evaluate and select cucumber cultivars (Cucumis sativus L.) with a longer postharvest shelf life. Each sample was evaluated for commercial quality (fruit aging, weight loss, wilting, yellowing, chilling injury, and rotting) every 7 days of storage. Simple and multiple binary logistic regression models were applied in which the dependent variable was the probability of marketability and the independent variables were the days of storage, cultivars, fruit weight loss, and months of evaluation. The results showed that cucumber cultivars with a longer shelf life can be selected by a simple and multiple binary logistic regression analysis. Storage time was the main determinant of fruit marketability. Fruit weight loss strongly influenced the probability of marketability. The logistic model allowed us to determine the cucumber weight loss percentage over which a fruit would be rejected in the market.
1. Introduction
The production and marketability of cucumber (Cucumis sativus L.) for fresh consumption is very important throughout the world [1,2]. However, the greatest losses of fruit and vegetable supply chains occur during postharvest and distribution. For example, the losses in fruits and vegetables in Europe from the beginning of postharvest until reaching the consumer are 36% [3].
Losses in horticultural products can occur throughout the process from harvesting through handling, storage, processing, and marketing to the consumer [4,5,6]. Losses will be greater as the time between harvest and consumption increases [7]. Cucumber fruit quality includes many variables, such as skin color, skin texture, fruit shape, and the presence or absence of defects. [8,9]. The main causes of postharvest losses and poor quality for cucumbers are overmaturity at harvest, rot, water loss (wilting), chilling injury, decay, loss of green color (i.e., chlorophyll), yellow and orange spots, bruises, and other mechanical injuries [10,11,12].
Biological variations in the postharvest quality of cucumber are influenced by several aspects, including the cultivar as a source of this variation [13]. Therefore, one of the main aims of genetic improvement in cucumber is to increase fruit shelf life [14]. Genetic improvements to cultivars to prolong shelf life represent one of the best alternatives for increasing fruit marketability.
Many other strategies to prolong the shelf life of cucumbers have been studied in recent years. For example, authors have related the shelf life of cucumbers with color [15,16,17]; however, predicting cucumber yellowing via image analysis at harvest and using a statistical multiple regression approach led to unsatisfactory results [17]. Shelf life has also been related with fruit weight loss caused by water loss [18]. Other authors have related incident light and shelf life in cucumbers [19]. Finally, several studies have shown that the use of modified atmospheres and the application of chitosan [20] and nitric oxide [21] improve shelf life.
Despite many postharvest studies in cucumbers, the effects of all aspects with the potential to cause fruit damage have not been comprehensively considered because of the scarcity of mathematical tools able to assess the loss of commercial value, which is based on categorical and continuous variables acting jointly on the fruit [22].
In certain situations, such as studying shelf life during selection for genetic improvement [22], the use of ANOVA, simple or multiple regressions, and linear or nonlinear models are not appropriate for characterizing the relationship between a response variable and a set of explanatory variables [23,24,25,26].
Recently, Díaz-Pérez [22] described a mathematical approach for the selection of tomato cultivars based on applying the binary logistic regression model, which included all aspects that cause fruit damage and commercial value losses. In this study, categorical explanatory variables (rotting, cracking, aging, etc.) and continuous variables (firmness, color, etc.) were integrated and combined to determine the probability of fruit marketability. Therefore, binary logistic regression has already been applied in comparative studies of tomato cultivars; however, it has not yet been used in the selection of cucumber cultivars (Figure 1).
The aim of this study is to establish a binary logistic regression method to evaluate and select cucumber cultivars (Cucumis sativus L.) with longer postharvest shelf life. Different analytical approaches based on simple and multiple logistic regression will be considered to deepen the results and obtain more solid conclusions to facilitate the selection of plant materials with a longer postharvest shelf life.
2. Materials and Methods
2.1. Production and Preparation of Cucumber Fruit Samples
The study was conducted on six LET (Long European Type) and five “mini”-type cucumber cultivars, which are included within the BAT (Beta Alpha Type) cultivars (Table 1) and represent commercial or precommercial cultivars. The LET cultivars are also known as “Dutch” or “Almería” type, and they have cylindrical and elongated fruits with smooth or slightly furrowed skin. The length can exceed 25 cm and reach up to 40 cm. The average diameter fluctuates at approximately 4 cm, and the average fruit weight is between 400 and 500 g. The mini-type (BAT) has small fruits with smooth and shiny skin. The length fluctuates at approximately 15–20 cm and fruit weight from 80 to 180 g.
Fruit samples were obtained from professional producers dedicated to the production and export of cucumbers. The crops were grown in greenhouses located in different areas of the province of Almería (southeastern Spain). All plants were cultivated in a typical growing cycle of southeastern Spain. Cultivation began in the second half of August. By the first week of April, the crops were already finished. All plants were cultivated under standard conditions in the cultivation area in terms of fertilization, irrigation, climate control, and so forth. The harvested fruits were in a state of optimum commercial maturity.
2.2. Experimental Design
Table 1 shows the vegetal materials, cultivation cycles, and months of evaluation. Three independent experiments were performed. One study was on the mini-type cucumber and two on the LET cucumber (one each for the Litoral and Levantino cultivars and another for the Galerno, Poniente, and Valle cultivars).
A sample was taken for each cultivar and month of evaluation, which consisted of 200 fruits for LET cucumbers and 150 fruits for mini-cultivars. Each sample was identified and labeled to maintain traceability throughout the study. The study of the fruits was carried out in a laboratory at the University of Almeria (located in Almeria, Spain). Each sample was subdivided into subsamples of 50 fruits to evaluate the commercial quality in time intervals of 7 days for the LET types and 5 days for the mini-types, as shown in Table 1.
The cucumber fruits were kept under preservation conditions throughout the storage period. Storage conditions were a temperature of 10 °C and 85–95% relative humidity [27,28]. At each sampling time described in Table 1, a subsample of 50 fruits was taken at random for quality analysis.
Market quality was evaluated for each fruit individually. The measured parameters included commercial quality and fruit weight loss. The commercial quality of each fruit was evaluated considering the main causes of a loss of commercial value during the postharvest period described by Kader [10,12] and Valero and Serrano [11]. The loss of commercial value parameters considered in the evaluated fruits were fruit aging, water loss (wilting), color loss (yellowing), chilling injury, and decay (see Figure 2). These parameters are usually the main causes of disputes associated with postharvest problems between distribution companies (wholesalers and retailers) and production companies.
Weight loss was evaluated individually for each sample fruit of each cultivar. During the evaluation, the weight of each fruit was controlled at different time intervals. With the LET cucumber, the time intervals were 7 days (0, 7, 14, 21, 28, and 35 days of storage). With the mini-type cucumber, the time intervals were 0, 5, 10, 15, 20, 25, 30, and 35 days of storage (Table 1). The cucumbers were weighed on a NAHITA 5061 balance with a maximum capacity of 500 g and an accuracy of 0.1 g. Weight loss was calculated as a percentage of weight compared to the initial weight [29,20].
2.3. Data Analysis
Binary logistic regression seeks to identify whether a relationship exists between a dependent variable (Y) associated with the occurrence or not of an event (dichotomous type) and one or more categorical or continuous independent variables (Xi) [24,25].
In the present research, simple and multiple binary logistic regression models were applied as described by Díaz-Pérez [22] in a study conducted on tomato to predict the probability of fruit marketability (commercial fruit: Y = yes/no) based on certain individual characteristics (Xi): storage time, cultivar type (cv. 1, cv. 2…), presence of pathogens (yes/no), aged fruit (yes/no), and so forth. In the present context, the “probability of marketability” in cucumber cultivars is a term chosen to define the capacity of the fruits to be marketed during storage time under experimental conditions [22].
The simplest situation in which the regression model was applied was to evaluate the influence of storage time on the probability of marketability based on simple independent logistic regressions for each cucumber cultivar, and its expression is shown in Equation (1) [22,26].
where X is the days of storage (DOS) and π (x) is the probability of marketability of cucumbers.
The multiple logistic regression model was also applied, and its expression is shown in Equation (2) [24,26].
where X1, X2, …, Xi are the independent variables and π (x) is the probability of marketability of cucumbers. In our study, the independent variables used in the different multiple analyses were DOS, cultivar, fruit weight loss percentage (FWL %) during storage, and month of evaluation.
In our study, a multiple binary logistic regression was applied with the following analytical approaches:
- Estimating the model parameters associated with cultivars and storage time as the main factors influencing the probability of marketability;
- Estimating the model parameters associated with cultivars and cucumber FWL % as the main factors influencing the probability of marketability; and
- Using multiple binary logistic regression to identify the factors capable of predicting with greater precision the probability of marketability.
To apply the multiple binary logistic regression in which categorical variables were included, these were treated as independent dummy variables [24]. The parameters α and βi of the simple and multiple regression models were estimated from data measured in the laboratory using the “maximum-likelihood method” [30]. To verify that coefficient βi differs from 0, we used the Wald test, which is based on the Wald contrast as shown in Equation (3) [26].
where is the estimate of parameter β by the maximum likelihood method and SE is the standard error of .
The study and analysis of odds ratios () allow us to provide a good interpretation of the logistic regression models. Equation (4) shows the mathematical expression of the odds ratio used in our study [26]:
where odds of an event represent the ratio between the probability that the event will occur and the probability that it will not occur and π (x) is the probability of marketability of cucumbers.
One reason for using the linear logistic model in the analysis of data from shelf-life studies in fruits and vegetables is that the coefficients associated with the explanatory variables of the model (α and βi) can be interpreted as logarithms of odds ratios, which means that estimates of the relative risk of a probability of marketability and the corresponding standard errors can be easily obtained from a fitted model [25].
Finally, to evaluate whether the measured data fit well with the calculated models, the goodness-of-fit test was applied based on the “Hosmer–Lemeshow goodness-of-fit” statistic [24].
All the simple and multiple binary logistic regression analyses were performed with the software packages Statgraphics Centurion XVII-X64 and IBM SPSS Statistics Version 23.
3. Results and Discussion
The study was proposed independently for the mini cucumber cultivars (176, 15999, 16000, 16054, and Katrina) and LET cultivars Levantino and Litoral (November–January) and Galerno, Poniente, and Valle (February–March). Simple binary logistic regression analyses were performed for each cultivar, and different multiple regression approaches were used.
3.1. Influence of Storage Time on the Commercialization of Cucumber Cultivars
Simple binary logistic regression analyses were conducted for each cucumber cultivar to determine the development of the probability of marketability during storage.
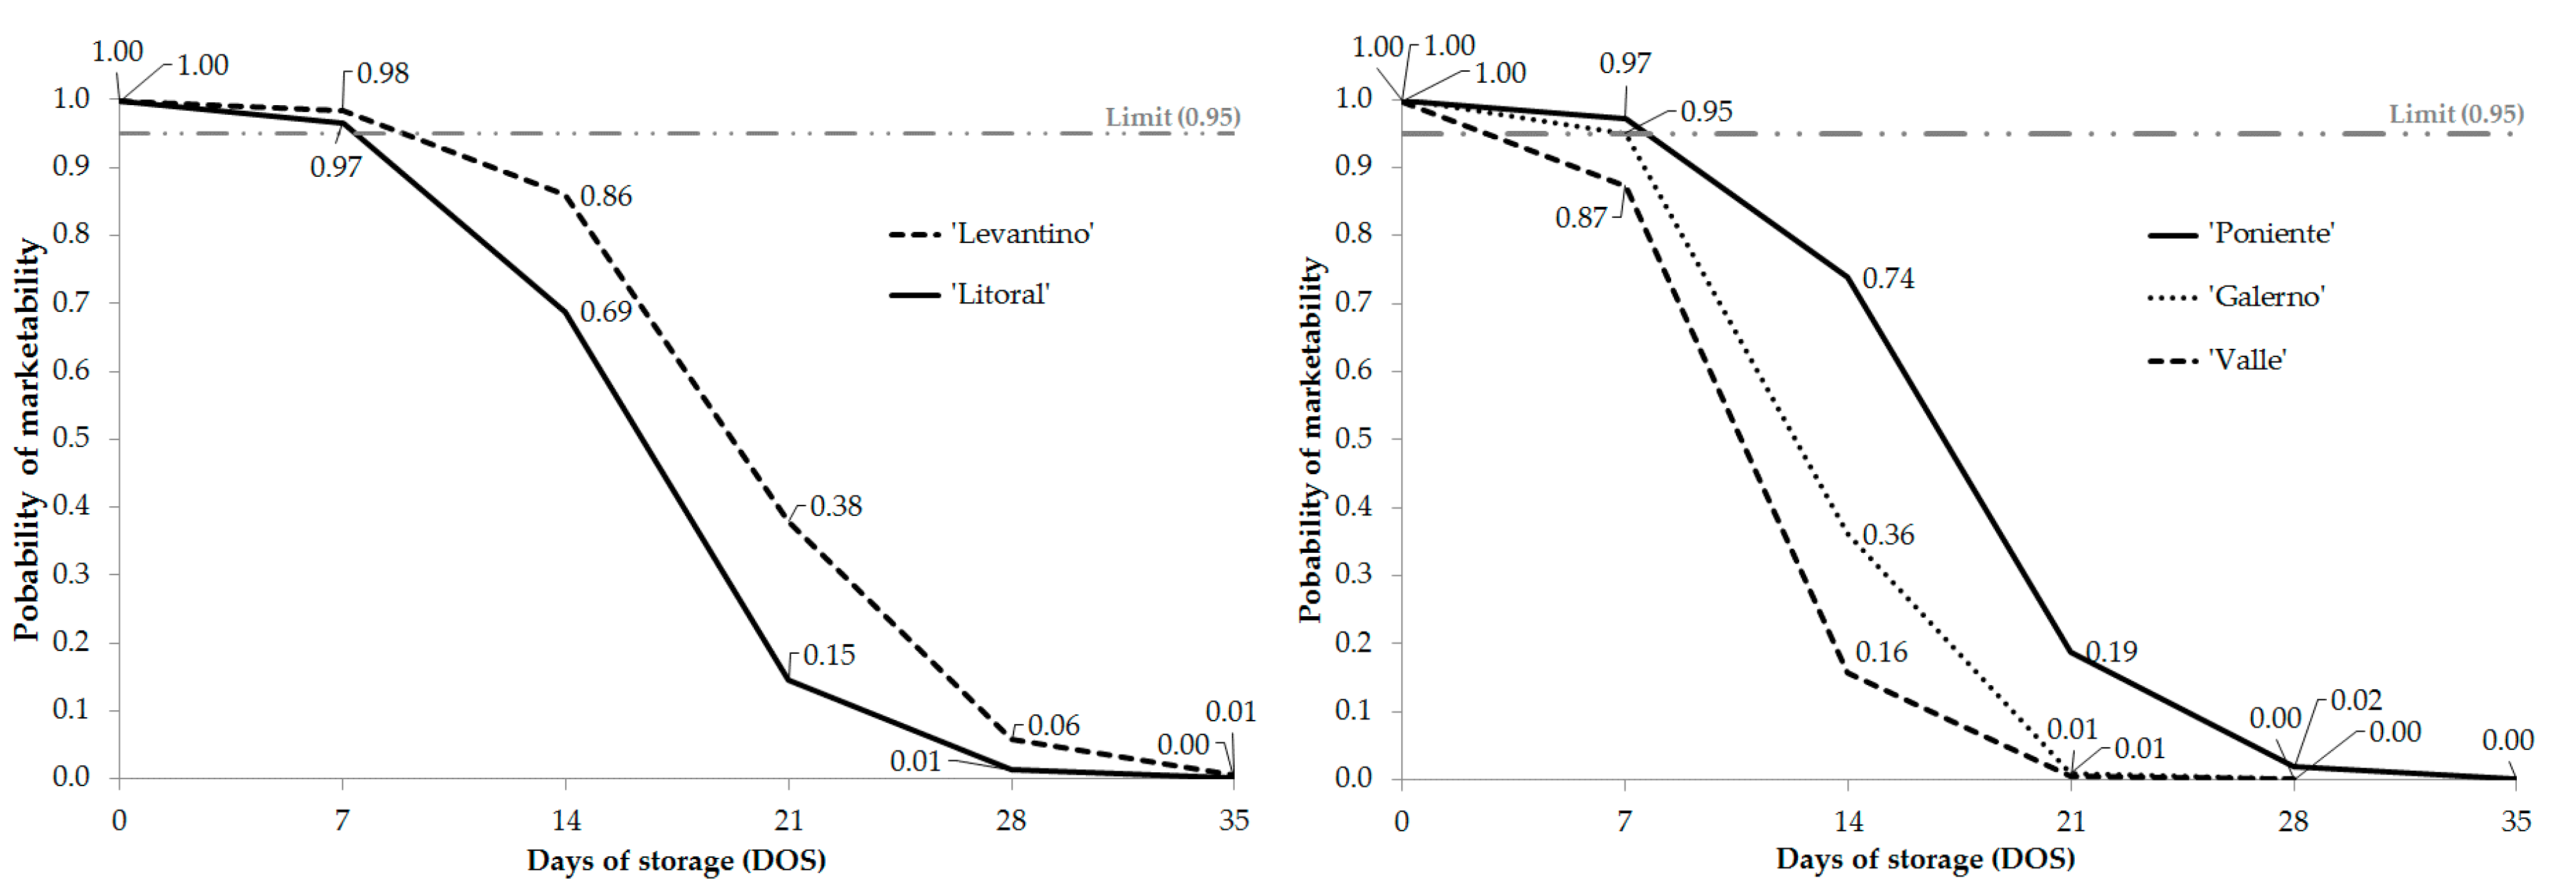
The results for the simple logistic regression models adjusted for all LET cucumber cultivars are shown in Table 2 and Figure 3. The results for the mini cucumber cultivars are shown in Table 3 and Figure 4. These fitted models consider DOS as a variable that significantly affects the probability of marketability for all cucumber cultivars (p < 0.001 in all cases), where the probability of marketability refers to the global changes in postharvest quality that occurred in fruits under the experimental storage conditions (wrinkling, rotting, etc.). In addition, in all cases, a negative relationship (β < 0) was observed between the commercial value of the fruit and storage time, meaning that the probability of marketability decreases as the storage time increases.
The odds ratios (Exp (β)) and their confidence intervals for all cucumber cultivars are shown in Table 2 and Table 3. The value of the confidence interval for Exp (β) is never 1, which shows that the DOS variable explains the behavior of the probability of marketability for each cucumber cultivar.
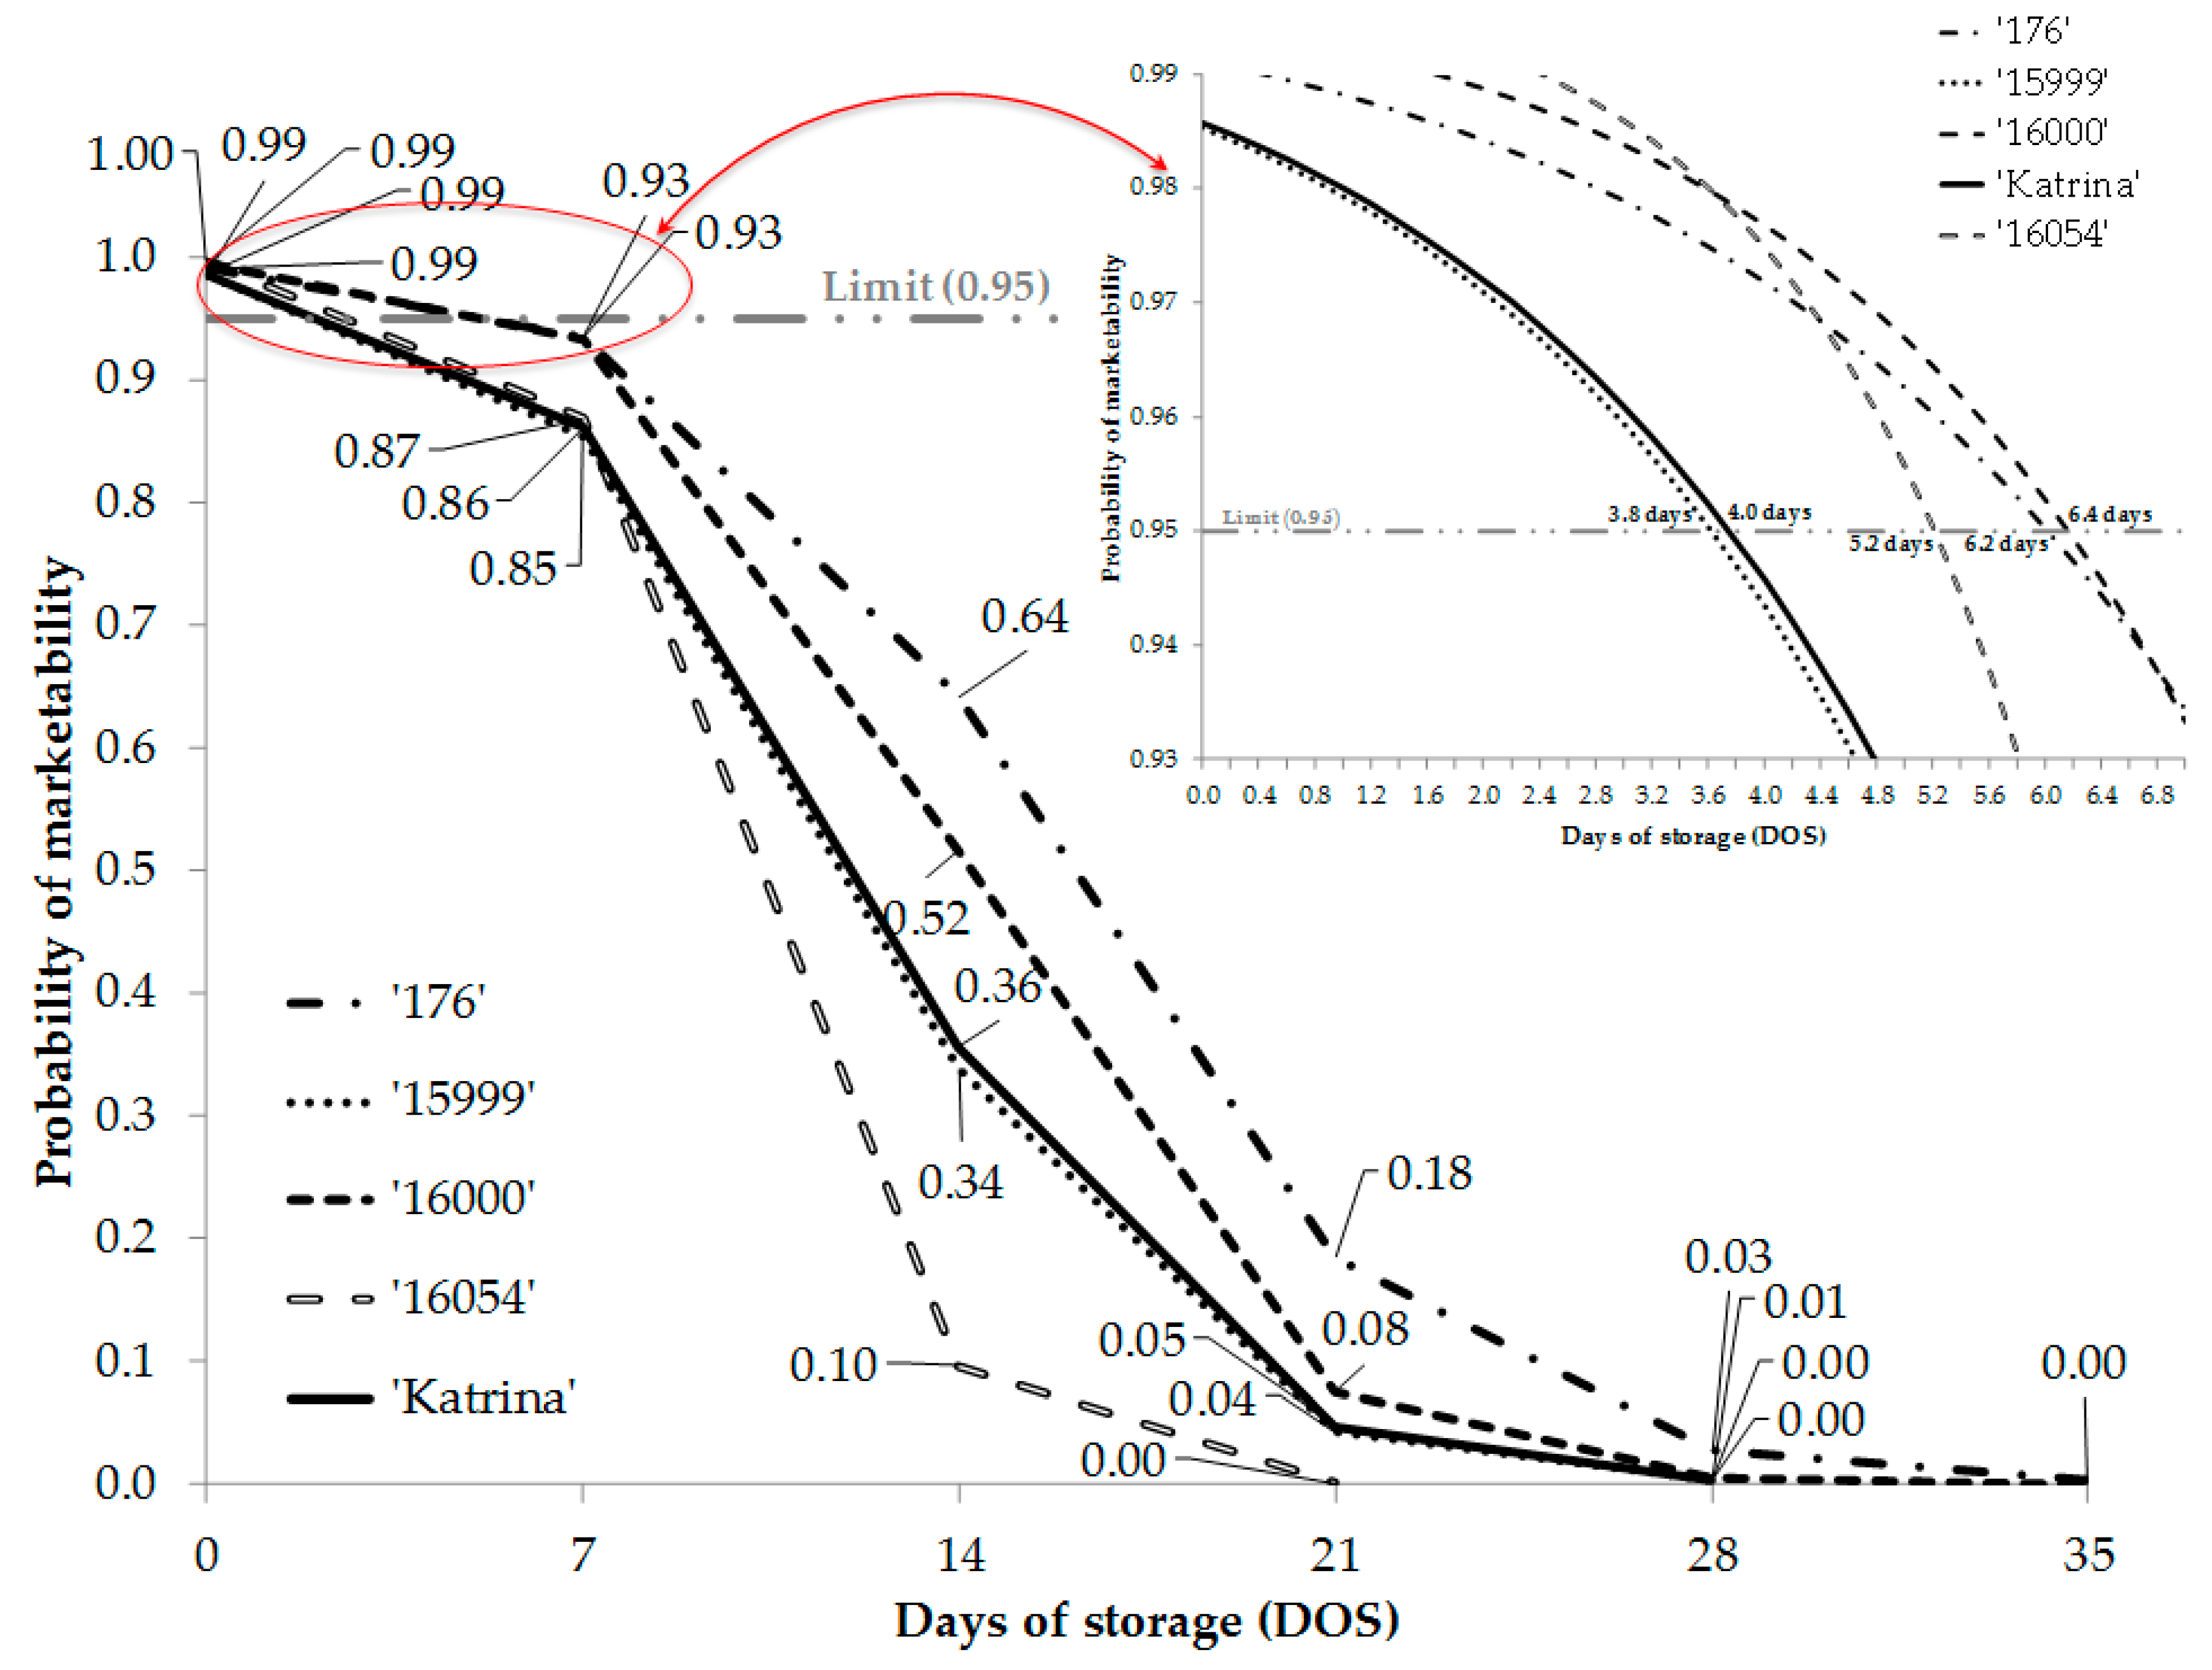
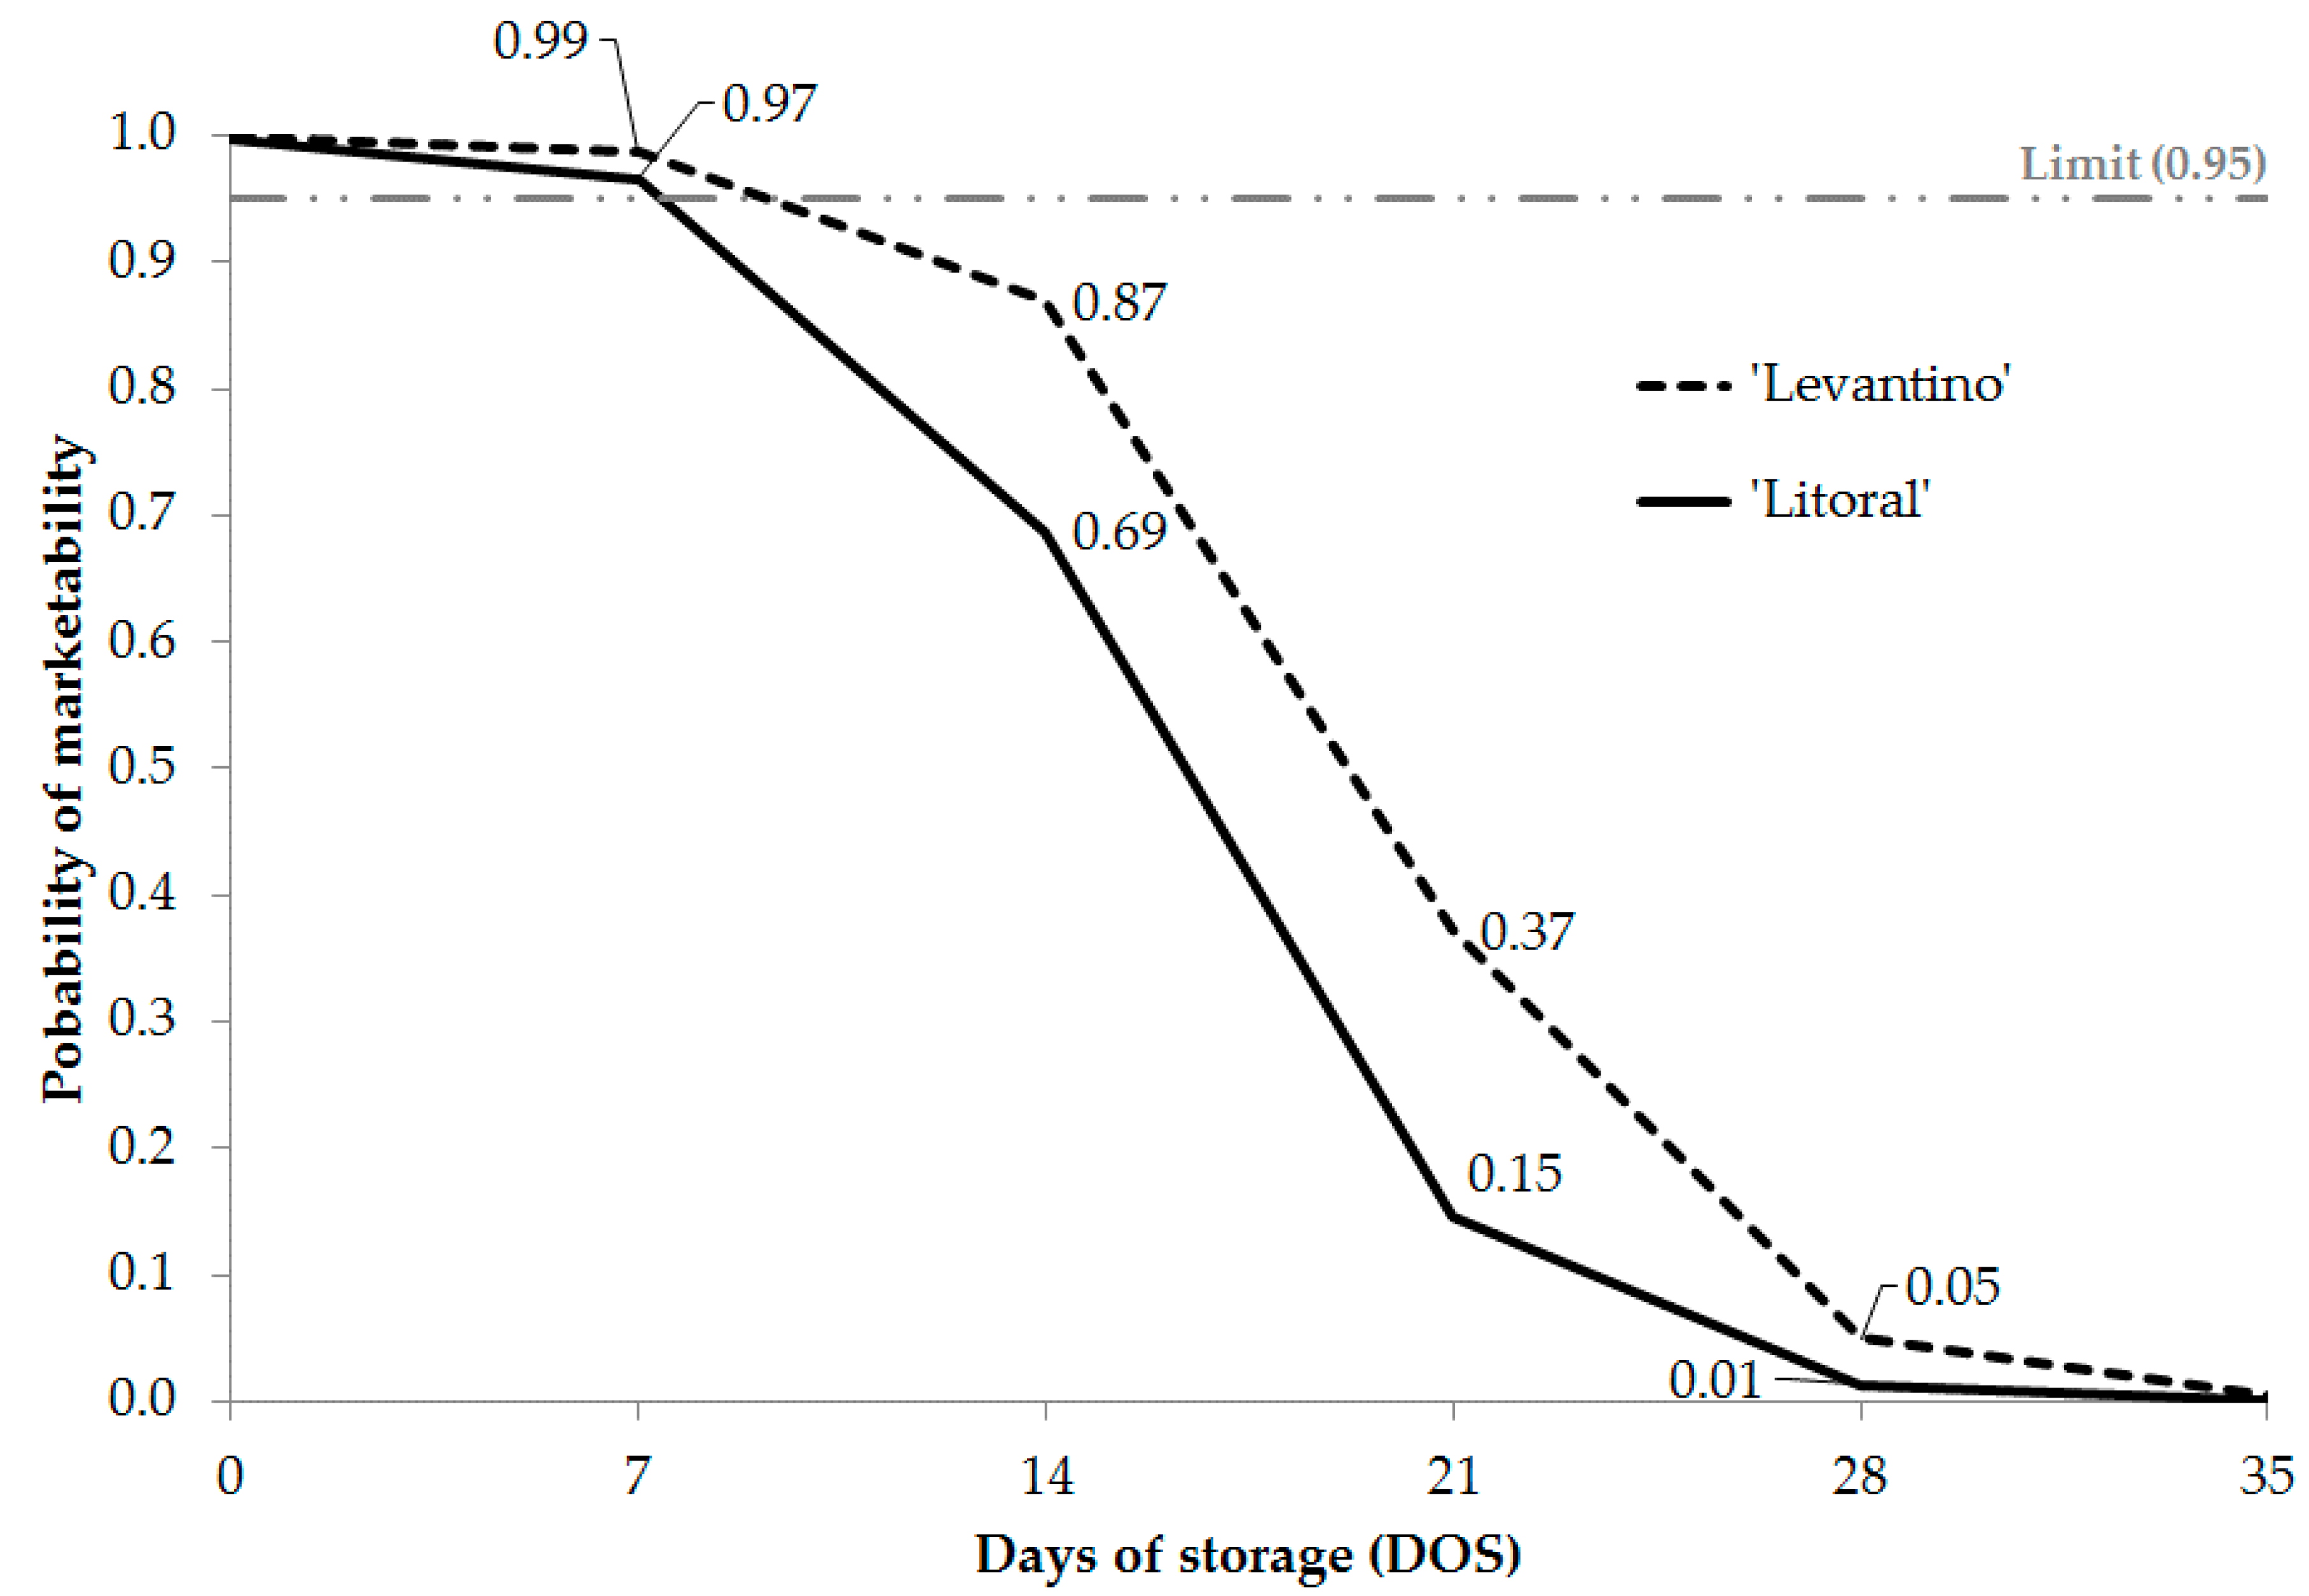
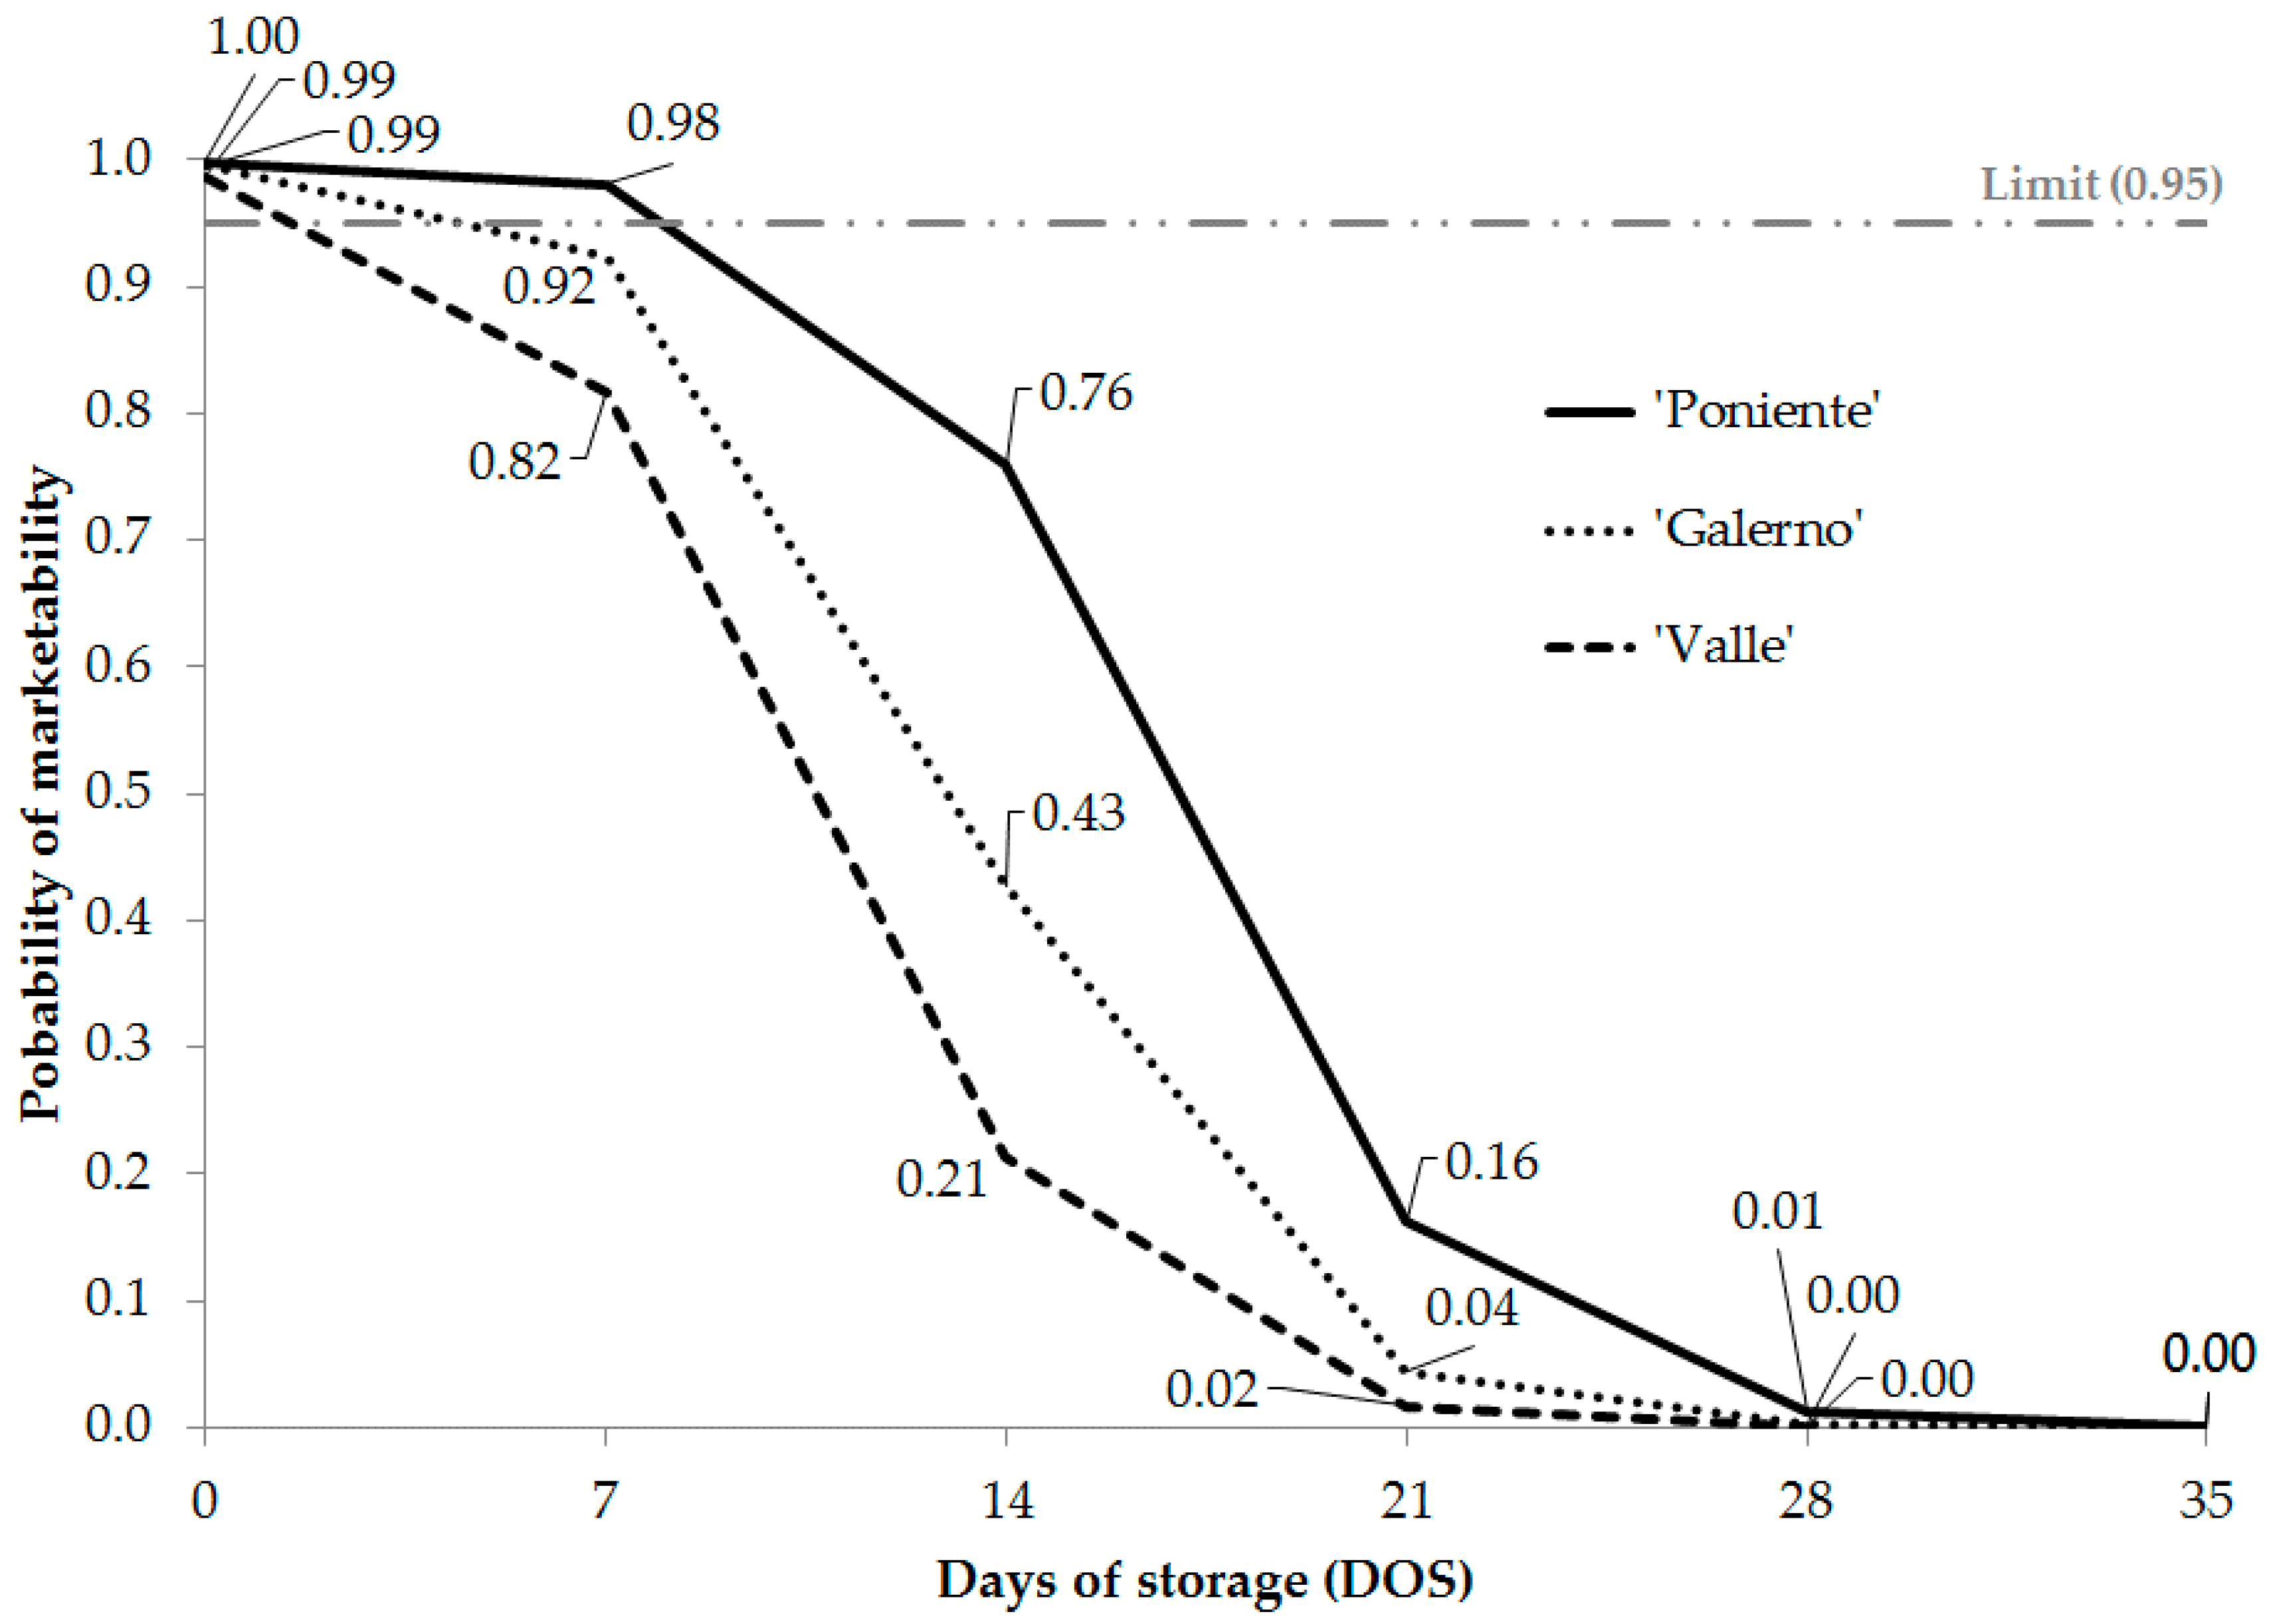
The odds ratios show the relationships between variables. In the case of cucumber cultivars, a decrease is observed in the probability of marketability during storage time (β < 0 → Exp (β) < 1). In the case of the LET cucumber cultivar, an increase of one day of storage decreased the probability of marketability of the fruit by 28.1% [(1−0.719) × 100] in Levantino and 30.6% [(1−0.694) × 100] in Litoral. In the case of the Galerno, Poniente, and Valle cultivars, the increase in one day of storage decreased the probability of marketability (odds of marketability decreased) by 44.3% in Galerno, 40.2% in Valle, and 30.0% in Poniente. In the case of the mini cucumber, these decreases were 44.6% in the 16054 phenotype, 30.7% in cv. 16000, 29.4% in 15999, 29.2% in Katrina, and 25.6% in 176, which means that Levantino, Poniente, and 176 had a longer shelf life as seen in Figure 3 and Figure 4.
In Figure 3 and Figure 4, the fitted models are represented, which predict for each phenotype the probability of marketability of a cucumber sample at a particular storage time (DOS). For example, in the Levantino cultivar (Figure 3), when the storage time is 0, the probability of marketability is 1, meaning that all the fruits are marketable. However, after 14 days of storage, the probability of marketability of the fruits is 0.86, which means that 14% of the fruits would not be marketable. The probability of marketability as a function of the DOS variable in Levantino is given by the following equation:
Authors have indicated that 5% of nonmarketable fruits is the tolerance limit allowed by the distribution chains for the marketability of fruits and vegetables in the European Union [22,31]. Figure 3 and Figure 4 show a line marking a tolerance level of 5% of nonmarketable fruits (95% of marketable fruits).
The total allowed tolerance of 5% nonmarketable fruits in the commercial types studied was reached after 10 days of storage for Levantino, 8 days for Litoral, 9 days for Poniente, 8 days for Galerno, 5 days for Valle (Figure 3), 6 days for the mini cucumber cultivars 176 and 16000, 5 days for cultivar 16054, and 4 days for cultivars 15999 and Katrina (Figure 4).
This approach allows us to determine the greater or lesser shelf-life potential of a cucumber cultivar independently. A comparison of the results between cultivars allows us to identify those phenotypes with a longer shelf life [22]. For example, Poniente has a longer shelf life than that of Valle (Figure 3).
3.2. Effect of Cultivar and Storage Time as Factors Influencing Marketability
To study the effect of storage time and cultivars, multiple binary logistic regressions were proposed whose explanatory variables were DOS (continuous variable) and cucumber cultivar (categorical variable). This analysis was proposed independently for the LET cultivars (Levantino, Litoral, Galerno, Poniente, and Valle) and mini-type cultivars (176, 15999, 16000, 16054, and Katrina). In the three studies, regression coefficients, odds ratios (and their confidence intervals), and the significance of each variable were calculated, and each cultivar was used as a reference in the regression model.
The parameters of the multiple logistic regressions for the DOS and cultivar variables used to model the probability of marketability of cucumbers are shown in Table 4 for the Levantino and Litoral cultivars, in Table 5 for the Galerno, Poniente, and Valle cultivars, and in Table 6 for the mini-type cucumber cultivars. In order to improve the discussion of the results when more than two cultivars are included in the study, different ways of seeing the same model are presented when each of the cultivars is considered as a reference (Table 5 and Table 6).
In the two analyses performed in the LET cucumber shown in Table 4 and Table 5, statistical significance is observed in the values of the Wald statistic, so its value differs from zero. Therefore, the DOS and cultivar variables included in the analysis are statistically relevant to explain the probability of marketability. In addition, all confidence intervals for Exp (β) exclude the value 1. In all cases, the DOS variable is negatively associated with the probability of marketability, whereas a positive or negative relationship may be observed for the cultivars because it is a nominal categorical variable and therefore depends on whether the cultivar in question has more (positive value) or less (negative value) probability of marketability than the cultivar considered as a reference.
For the study conducted on the mini-type cucumbers (Table 6), the DOS variable was significant in some cultivars but not in other phenotypes. Specifically, the Wald test did not show statistical significance in the 15999 and 16054 phenotypes when Katrina was considered as the reference cultivar, the 16054 and Katrina phenotypes when 15999 was considered as a reference, and 15999 and Katrina when 16054 was considered as a reference. This was confirmed with the analysis of the confidence intervals for Exp (β) in these cultivars, which include the value 1 within the interval. In the studies of the LET cucumber phenotypes, the coefficient β for DOS was negative; therefore, the probability of marketability decreased as the storage time increased. In the case of cultivars, this relationship can be positive or negative because the probability of marketability increases or decreases in relation to the reference cultivar.
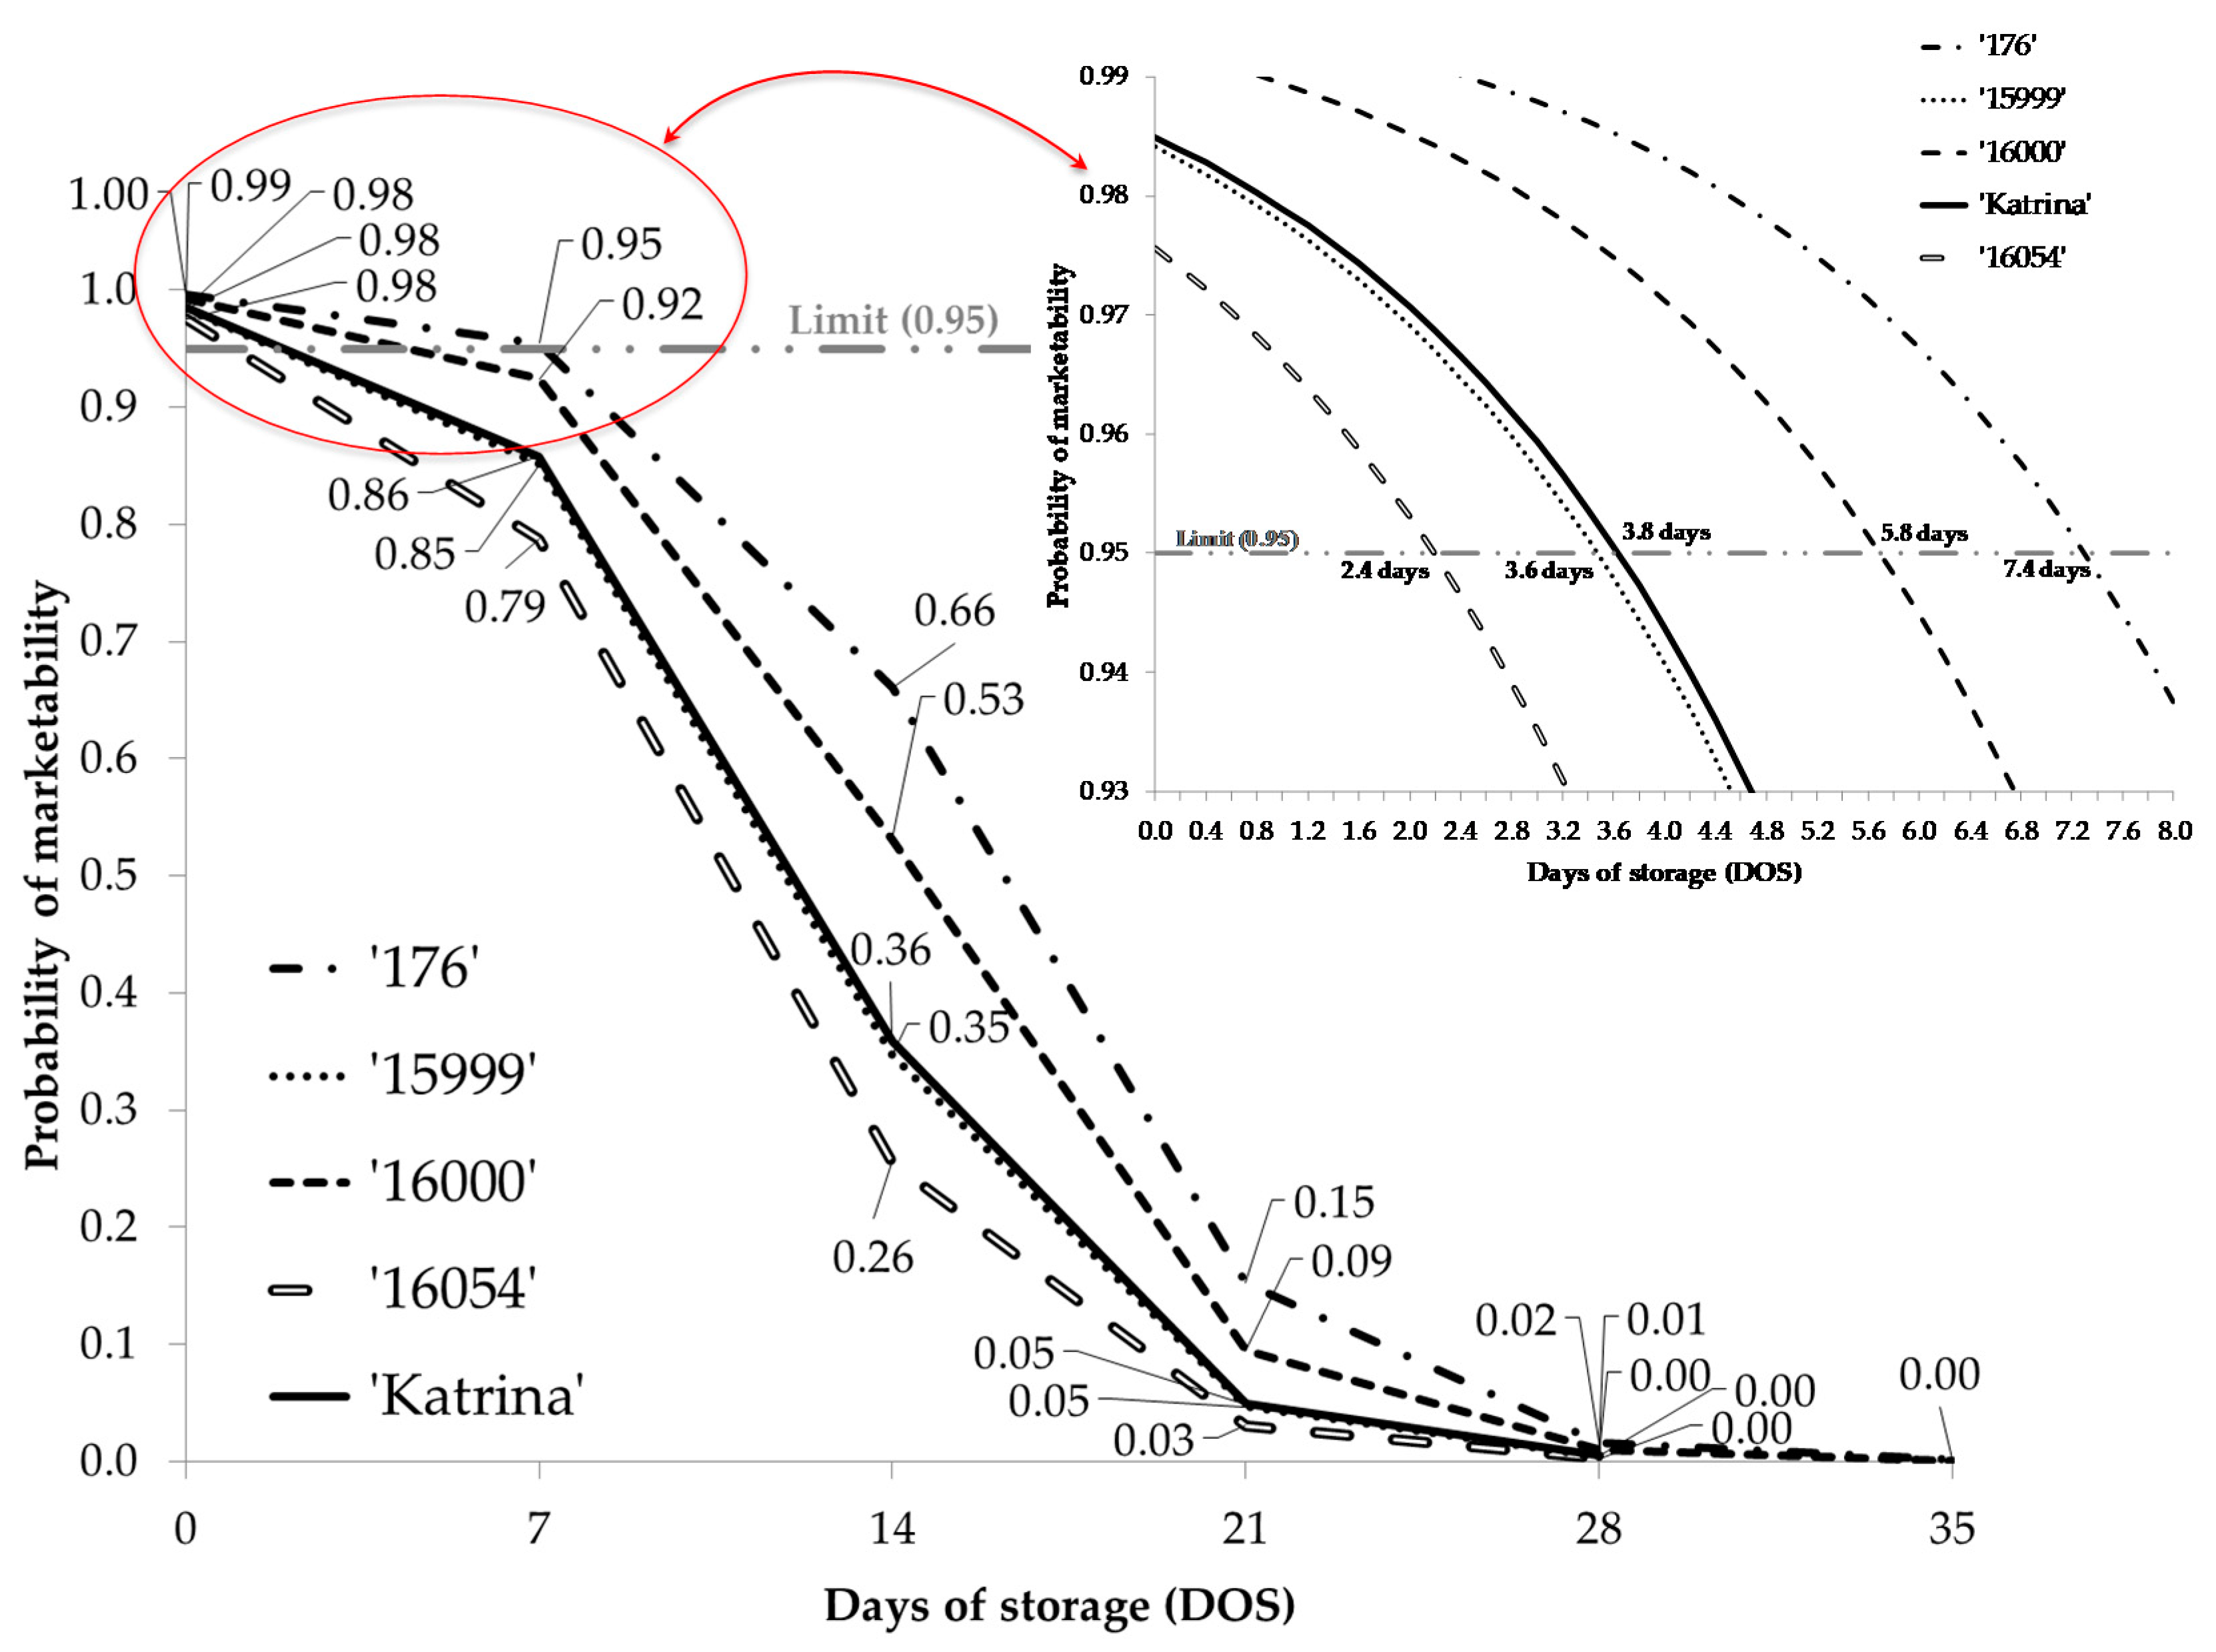
From the analysis of the odds ratio for the days of storage, its value was 0.712, which produced a decrease of 28.8% in the probability of marketability with one day of storage (if we consider the cultivars = 1). The odds ratio refers to the relationship between the probability of marketability of a cultivar compared to the reference; therefore, values greater than 1 indicate an increase in the probability of marketability of that phenotype compared to the reference, and vice versa [22]. In the odds ratios for the mini-type cucumber cultivars, for example, when we consider the DOS variable with a fixed value and Katrina as the reference cultivar, the probability of marketability is approximately 3.5- and 2-fold higher (in terms of probabilities) for 176 and 16000, respectively, and 5.3% and 38.8% lower for 15999 and 16054, respectively (Table 6). In general, for each study conducted on cucumber with the DOS variable with a fixed value, the highest odds ratios occurred in Levantino, Poniente, and 176 and the lowest values occurred in Litoral, Valle, and 16054 (Table 4, Table 5 and Table 6). This finding can be verified with the illustrations in Figure 5, Figure 6 and Figure 7.
When the DOS variable is plotted against the probability of marketability through a multiple regression analysis and compared with the 95% probability line [22,31], the probability of reaching the 5% level of nonmarketable fruits occurred at 11 days in the Levantino cultivar and 8 days in the Litoral (Figure 5). In the case of Poniente, Galerno, and Valle, the values were 10, 6, and 4 days, respectively (Figure 6). Finally, in the mini-type cultivars, the 5% probability was reached at 3 days of storage for 16054, at 4 days for Katrina and 15999, at 6 days for 16000, and at 8 days for 176 (Figure 7).
3.3. Effect of Cultivar and Fruit Weight Loss as Factors Influencing Marketability
Cucumber fruit weight loss increases during storage and is directly related to temperature and storage time [32] as well as fruit deterioration, such as browning, fungal growth, and so forth. [33,34].
In the LET cucumber cultivars, the combined effect of postharvest FWL % and cultivar type, that is, the probability of marketability of cultivars based on fruit weight loss, was analyzed (Table 7 and Table 8). In the case of the mini-type cultivars, the Hosmer–Lemeshow statistic showed a value of 36.803 and a p-value < 0.001, which means that the multiple logistic model is ill-fitted to the data considered. Consequently, to compare the percentage of weight loss of the mini-type cultivars, simple regression analyses were performed for each cultivar in which the explanatory variable was FWL % and the response variable was the probability of marketability (Table 9).
These results showed that the FWL % variable was significant in the three studies performed (two in LET and one in mini). In contrast, in the evaluated cultivars, the estimate of the coefficients was not always significant. Of the five LET cucumber cultivars, the estimates of the model coefficients were not statistically significant in Galerno when Valle was the reference and in Valle when Galerno was the reference. In the other cases, the model coefficients were statistically significant (Table 7 and Table 8). In these cases, the probability of marketability was not affected between the cultivar in question and the one considered as a reference (considering FWL % with a fixed value) [20].
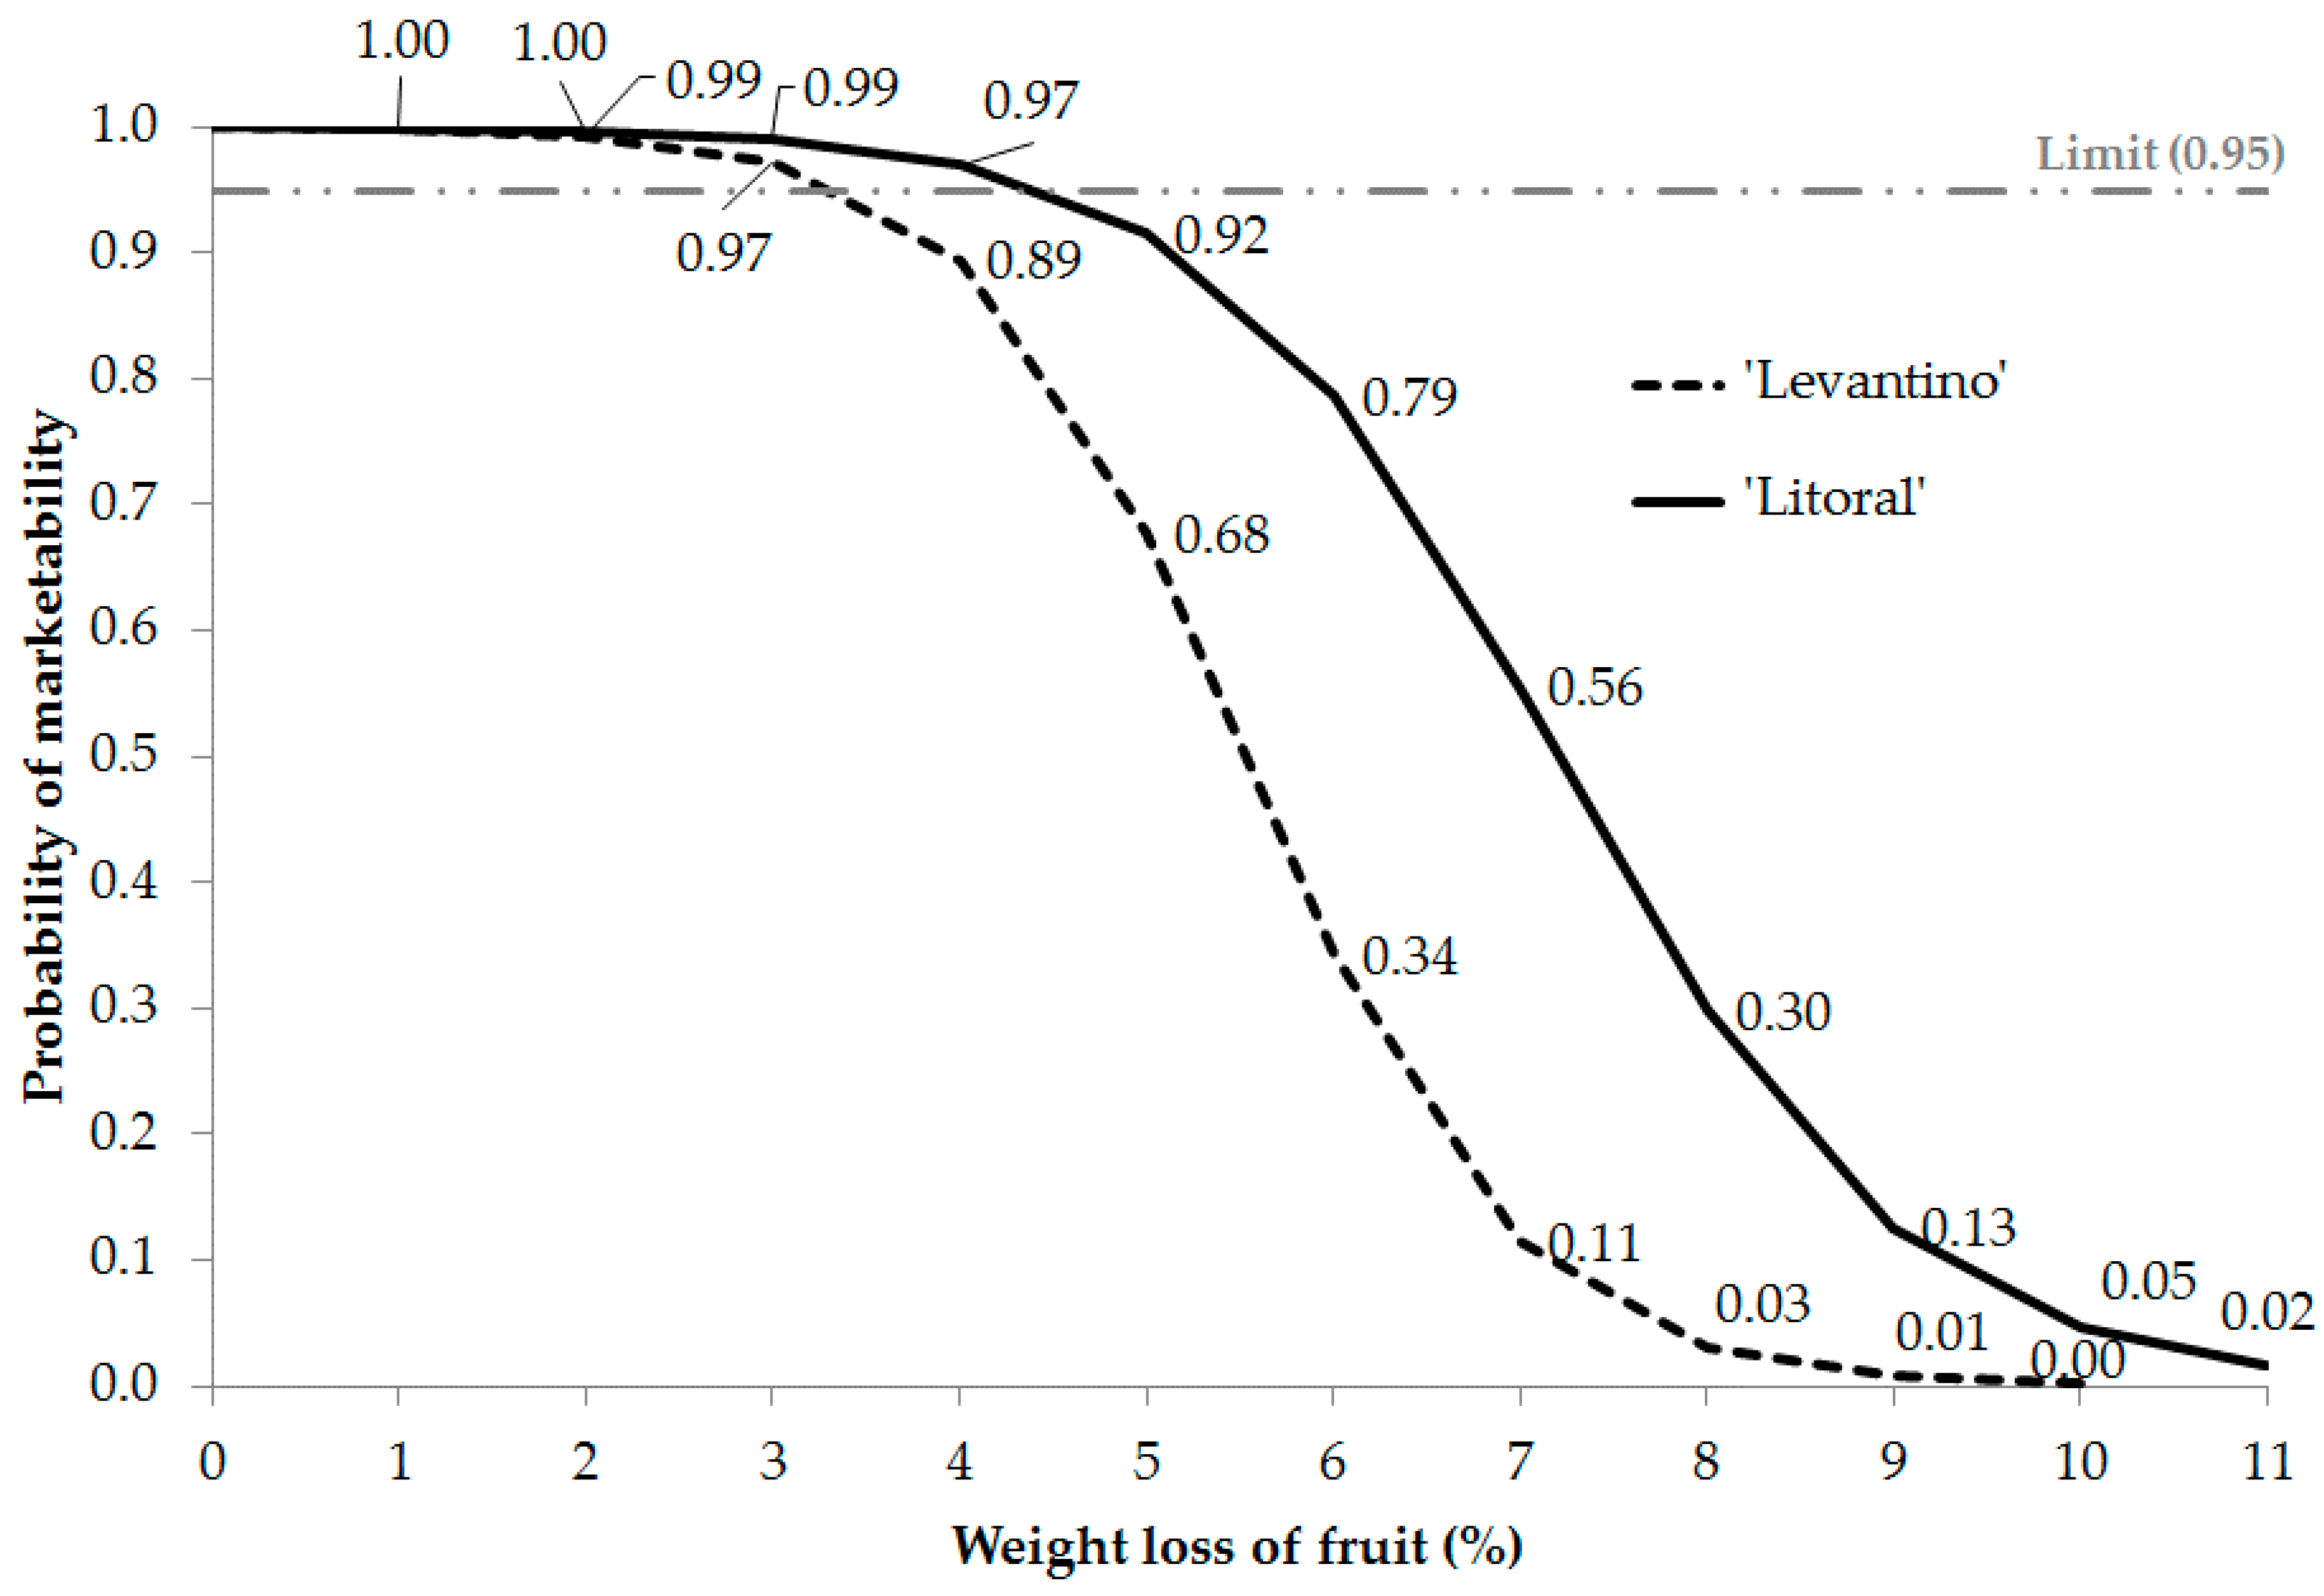
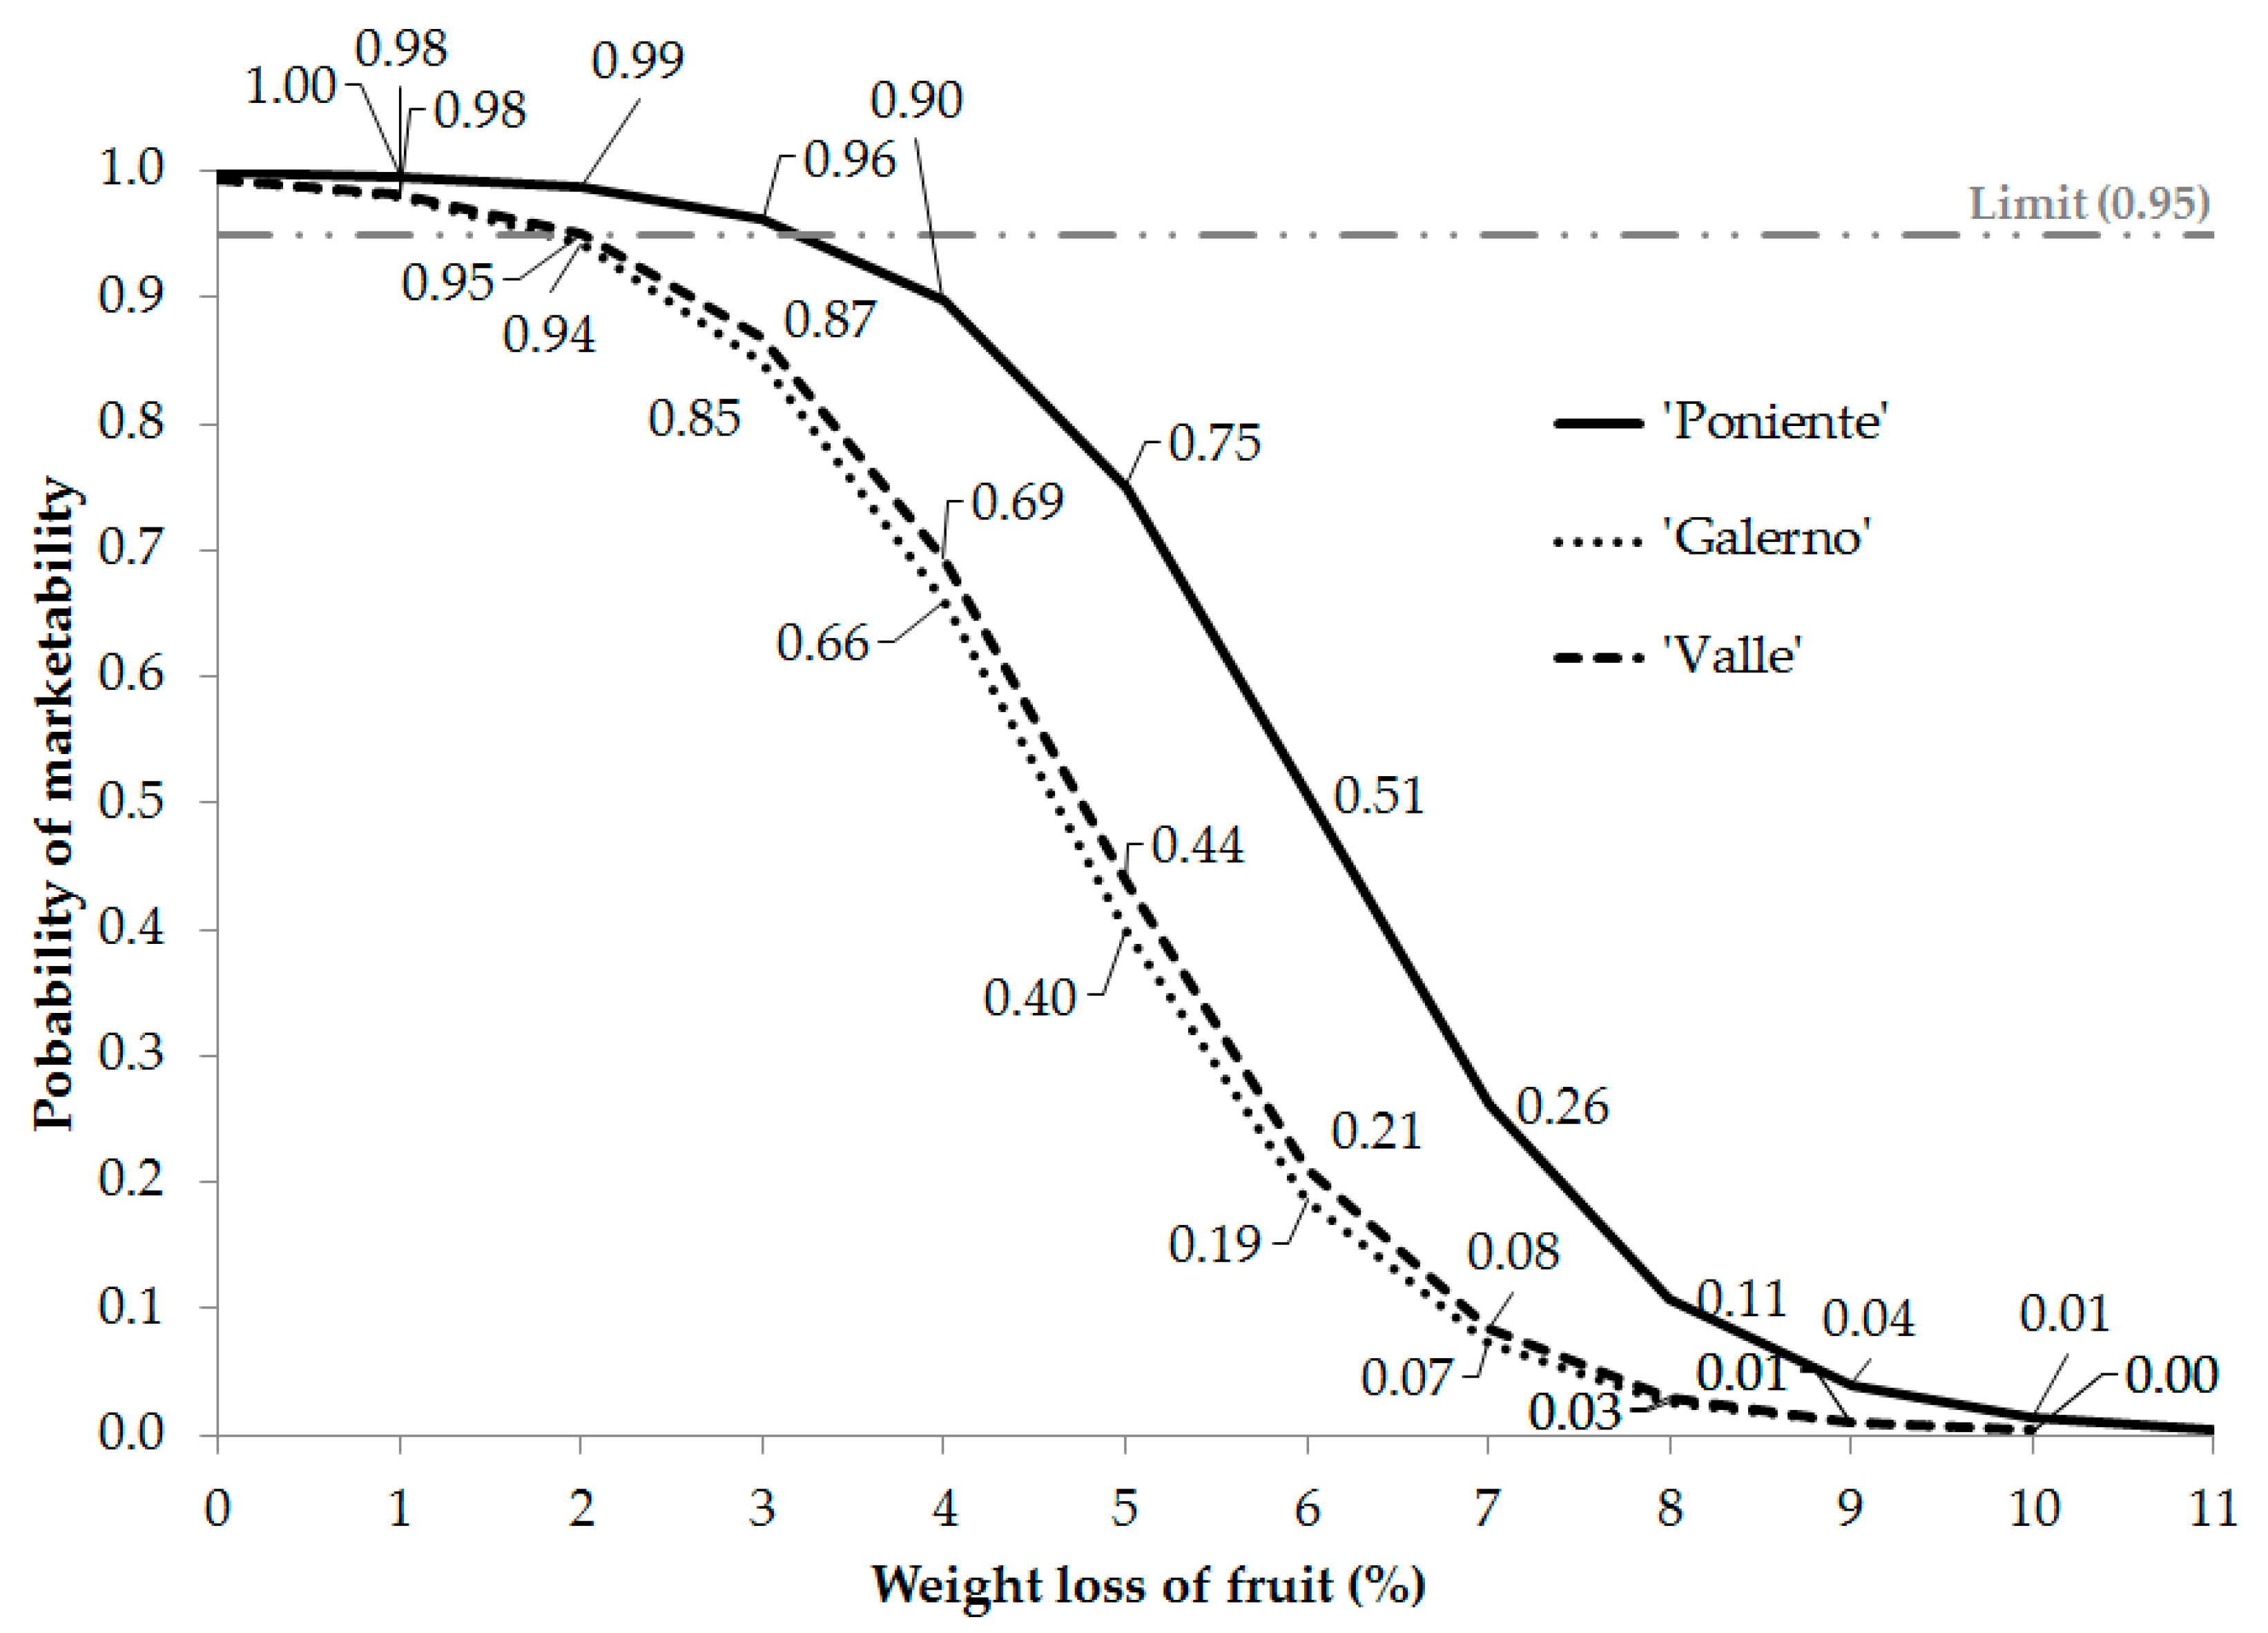
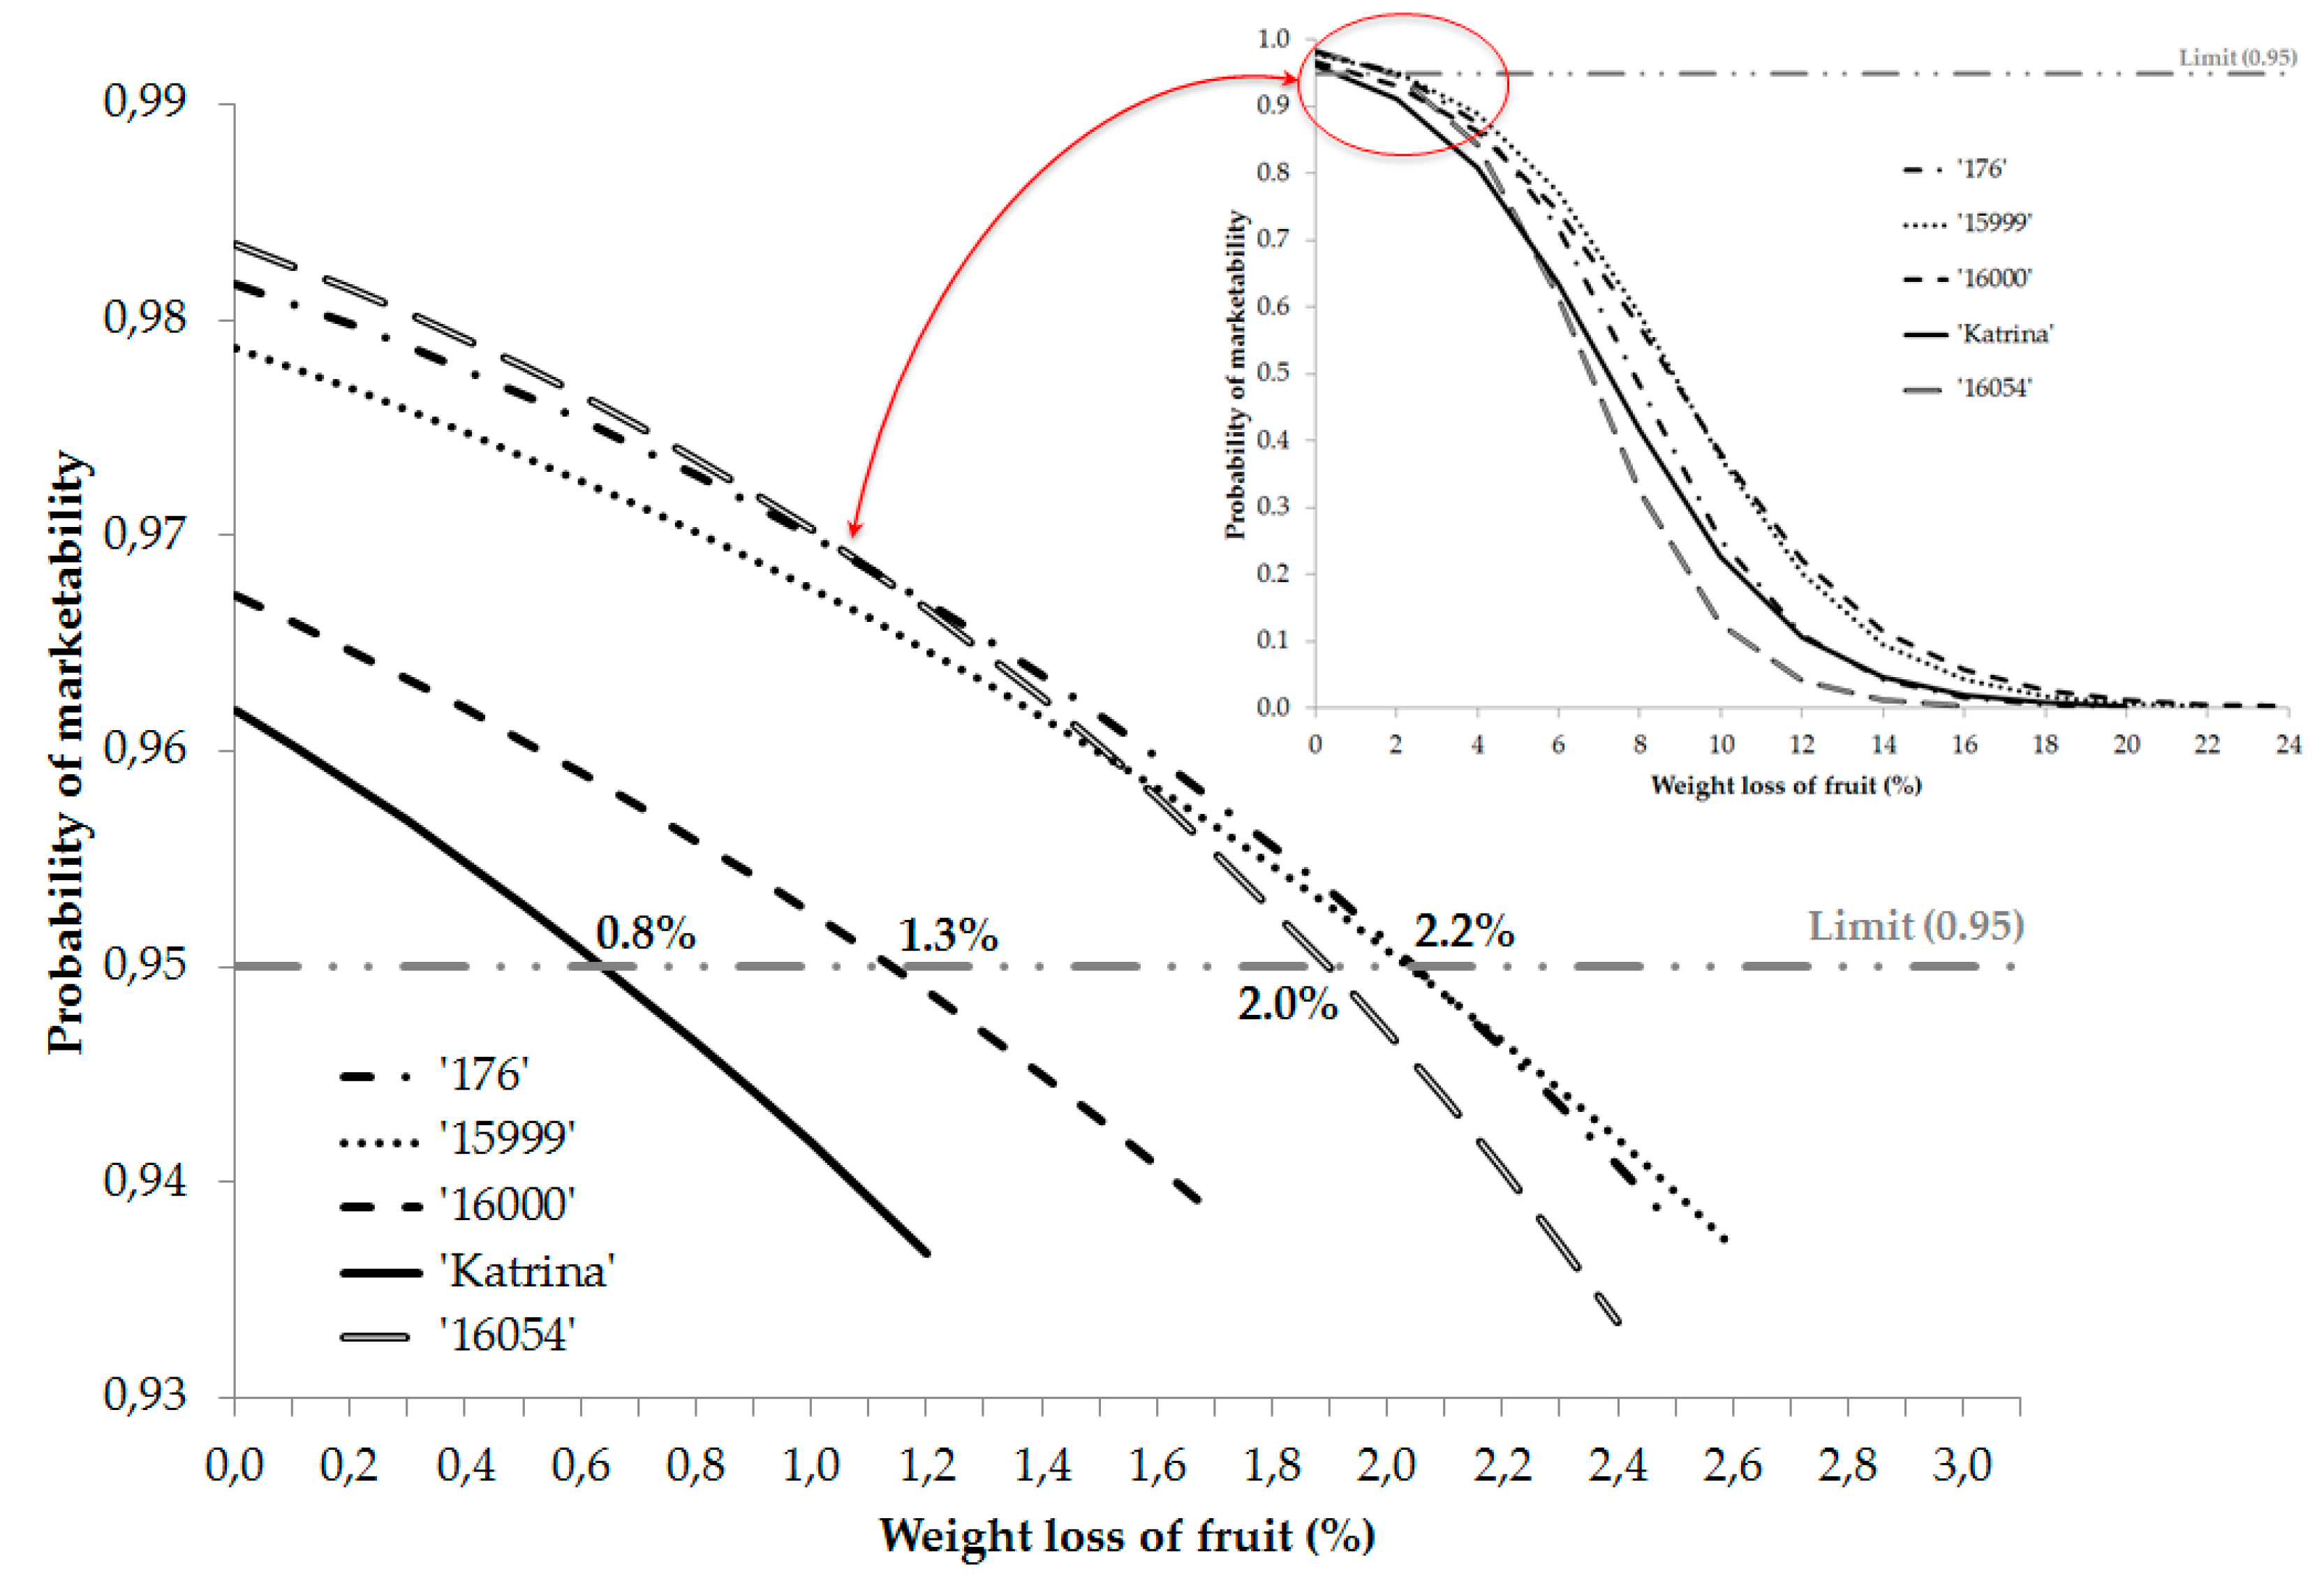
On the other hand, the values of FWL % show a negative relationship (β < 0) with the probability of marketability of cucumbers (Figure 8, Figure 9 and Figure 10). The greater the fruit weight loss during storage, the lower its market value, which is consistent with reports by other researchers [20,32,33,34]. The level of nonmarketable fruits reached 5% when the FWL % was 3.2% in Poniente, 1.8% in Galerno, 2.0% in Valle (Figure 9), and 4.4% and 3.4% in Levantino and Litoral, respectively (Figure 8). In the case of the mini-type cultivars, the FWL % for 5% of nonmarketable fruits was obtained from the simple logistic regressions for each cultivar. The FWL % associated with 5% of nonmarketable fruits was 0.8% in Katrin”, 1.3% in 16000, 2.0% in 16054, and 2.2% in 176 and 15999. These findings show Katrina presented a lower probability of marketability with less weight loss than the other phenotypes. In contrast, 176 and 15999 could present a higher percentage of weight loss before losing their commercial value (Figure 10).
3.4. Future Lines of Research
It would be interesting to study the application of the logistic regression model in other species in order to determine the qualitative and quantitative variables with the greatest influence on the probability of marketability of these species. In order to improve the predictive approach of the model, it would be interesting to include in future studies biochemical, physical, and microbiological parameters that may affect postharvest storage (e.g., Total Soluble Solids (TSS), colour, etc.).
Finally, it is also interesting to carry out research that includes logistic regression in studies to improve the fruits’ commercial life, both in the preharvest conditions (actions on crops) and in postharvest conditions (actions on the storage conditions, fruit treatment, etc.).
3.5. Selection of the Study Variables with the Greatest Influence on the Probability of Marketability
In the study of the mini-type cucumbers, all variables (DOS, FWL %, month, and cultivar) were statistically significant in the ability to predict the probability of marketability when subjected to the multiple logistic regression model. In contrast, in the two studies of the LET cucumber, not all variables were statistically significant because the high correlation effect of certain dependent variables in the multiple regression models produces nonsignificant effects in other dependent variables with less correlation effect [20,35,36].
In the case of Levantino and Litoral (Table 10), the cultivar categorical variable was not considered in the initial model after backward elimination, which may be related to the significantly lower cultivar correlation compared with that of the other variables (DOS, FWL %, month). Therefore, the general multiple logistic regression models were fitted except for DOS (Table 11), which does not affect the logistic regression model since FWL % and DOS were highly correlated as previously described by other authors [20], and one can be replaced by the other.
For the Valle, Galerno, and Poniente cultivars, when the months of evaluation, DOS, and FWL % were subjected to the multiple logistic regression analysis, almost all variables were found to be statistically significant in the ability to predict the probability of marketability. The independent variable month was the only nonsignificant variable; therefore, it was not included in Table 12. For the mini-type cultivars, all variables were statistically significant (Table 13).
The odds ratios were calculated in the three studies, and Table 11 shows that the probability of marketability of Levantino was 9.3-fold higher than that of Litoral and the month with the highest probability of marketability was January. Table 12 shows that the probability of marketability for Poniente was 8.3-fold higher than Valle and 4.8-fold higher than Galerno; thus, Poniente had the highest probability of marketability among the three. For the mini-type cultivars (Table 13), 176 had the highest probability of marketability and was 4.5-fold higher than 15999, 1.9-fold higher than 16000, 6.4-fold higher than 16054, and 3.8-fold higher than Katrina. The month with the highest probability of marketability (if we consider the other variables with a fixed value) was November.
4. Conclusions
The logistic regression model is presented as a novel approach to evaluate commercial life in cucumber cultivars (Cucumis sativus L.). The adjustment of the probability of fruit marketability was developed according to the main independent variables that influence the fruit deterioration during the postharvest. Cucumber cultivars with a longer shelf life can be selected by applying simple and multiple binary logistic regression models. Different analytical approaches based on simple and multiple logistic regression allow the obtaining of more solid results to evaluate and select cultivars with longer commercial life during postharvest. A simple logistic regression analysis allows us to determine the greater or lesser potential shelf life of a cultivar independently. A comparison of the results between cultivars can determine the phenotypes with a longer shelf life.
In the multiple logistic regression based on continuous and categorical explanatory variables, only variables with good correlations are included in the final model. An application of the logistic model to the species studied showed that the DOS and FWL % during storage were the main determinants of fruit marketability. The cultivars and the months of evaluation were not always included in the model because they showed a lower correlation than the other variables considered.
Cucumber fruit weight loss had a strong influence on fruit marketability based on the logistic regression models. The logistic model allowed us to determine the cucumber weight loss percentage over which a fruit would be rejected in the market.
Author Contributions
All authors contributed equally to the manuscript, and have approved the final manuscript.
Funding
This research received no external funding.
Acknowledgments
University Research Contract Numbers 401309, 401287, 401428, and 401431.
Conflicts of Interest
The authors declare no conflict of interest.
References
- Ramírez-Pérez, L.J.; Morales-Díaz, A.B.; de Alba-Romenus, K.; González-Morales, S.; Benavides-Mendoza, A.; Juárez-Maldonado, A. Determination of Micronutrient Accumulation in Greenhouse Cucumber Crop Using a Modeling Approach. Agronomy 2017, 7, 79. [Google Scholar] [CrossRef]
- Wan, S.; Kang, Y.; Wang, D.; Liu, S.P. Effect of saline water on cucumber (Cucumis sativus L.) yield and water use under drip irrigation in North China. Agric. Water Manag. 2010, 98, 105–113. [Google Scholar] [CrossRef]
- Gustavsson, J.; Cederberg, C.; Sonesson, U.; Van Otterdijk, R.; Meybeck, A. Pérdidas y Desperdicio de Alimentos en el Mundo. Alcances, Causas y Prevención. FAO: Roma, Italy, 2012. Available online: http://www.fao.org/3/a-i2697s.pdf (accessed on 15 November 2018).
- Parfitt, J.; Barthel, M.; Macnaughton, S. Food waste within food supply chains: Quantification and potential for change to 2050. Philos. Trans. R. Soc. B Biol. Sci. 2010, 365, 3065–3081. [Google Scholar] [CrossRef] [PubMed]
- Takeda, F.; Yang, W.; Li, C.; Freivalds, A.; Sung, K.; Xu, R.; Hu, B.; Williamson, J.; Sargent, S. Applying New Technologies to Transform Blueberry Harvesting. Agronomy 2017, 7, 33. [Google Scholar] [CrossRef]
- Prusky, D. Reduction of the incidence of postharvest quality losses, and future prospects. Food Secur. 2011, 4, 463–474. [Google Scholar] [CrossRef]
- Kader, A.A. Flavor quality of fruits and vegetables. J. Sci. Food Agric. 2008, 11, 1863–1868. [Google Scholar] [CrossRef]
- Breene, W.M.; Davis, D.W.; Chou, H. Texture profile analysis of cucumbers. J. Food Sci. 1972, 37, 113–117. [Google Scholar] [CrossRef]
- Kingston, B.D.; Pike, L.M. Internal fruit structure of warty and non-warty cucumbers and their progeny. Hortic. Sci. 1975, 10, 319. [Google Scholar]
- Kader, A.A. Postharvest quality maintenance of fruits and vegetables in developing countries. In Postharvest Physiology and Crop Preservation; Lieberman, M., Ed.; Plenum Press: New York, NY, USA, 1983; pp. 455–470. [Google Scholar] [CrossRef]
- Valero, D.; Serrano, M. Postharvest Biology and Technology for Preserving Fruit Quality; CRC Press, Taylor & Francis Group: New York, NY, USA, 2010; p. 217. ISBN 978-1-4398-0266-3. [Google Scholar]
- Kader, A.A. Tecnología Postcosecha de Cultivos Hortofrutícolas, 3rd ed.; University of California Publications: Oakland, CA, USA, 2011; ISBN 987-1-60107-744-8. [Google Scholar]
- Schouten, R.E.; Jongbloed, G.; Tijskens, L.M.M.; van Kooten, O. Batch variability and cultivar keeping quality of cucumber. Postharvest Biol. Technol. 2004, 32, 299–310. [Google Scholar] [CrossRef]
- Reche, J. Cultivo del Pepino en Invernadero; Ministerio de Medio Ambiente y Medio Rural y Marino: Madrid, Spain, 2011; p. 262. ISBN 978-84-491-1112-9. [Google Scholar]
- Lim, W.; Ehret, D. Nutrient Concentration and Fruit Thinning Affect Shelf Life of Long English Cucumber. HortScience 1991, 26, 1299–1300. [Google Scholar]
- Schouten, R.E.; Tijskens, L.M.M.; van Kooten, O. Predicting keeping quality of batches of cucumber fruit based on a physiological mechanism. Postharvest Biol. Technol. 2002, 26, 209–220. [Google Scholar] [CrossRef]
- Jolliffe, P.A.; Lin, W.C. Predictors of shelf life in long English cucumber. J. Am. Soc. Hort. Sci. 1997, 122, 686–690. [Google Scholar]
- Muy-Rangel, D.; Siller-Cepeda, J.; Díaz-Pérez, J.; Valdéz Torres, B. Efecto de las condiciones de almacenamiento y el encerado en el estatus hídrico y la calidad poscosecha de pepino de mesa. Rev. Fitotec. Mex. 2004, 27, 157–165. [Google Scholar]
- Klieber, A.; Lin, W.C.; Jolliffe, P.A.; Hall, J.W. Training methods affect canopy light exposure and shelf life of long English cucumber. J. Am. Soc. Hort. Sci. 1993, 118, 786–790. [Google Scholar]
- Mohammadi, A.; Hashemi, M.; Hosseini, S.M. Postharvest treatment of nanochitosan-based coating loaded with Zataria multiflora essential oil improves antioxidant activity and extends shelf-life of cucumber. Innov. Food Sci. Emerg. 2016, 33, 580–588. [Google Scholar] [CrossRef]
- Yang, H.; Wu, F.; Cheng, J. Reduced chilling injury in cucumber by nitric oxide and the antioxidant response. Food Chem. 2011, 127, 1237–1242. [Google Scholar] [CrossRef]
- Díaz-Pérez, M.; Carreño-Ortega, Á.; Gómez-Galán, M.; Callejón-Ferre, Á.-J. Marketability Probability Study of Cherry Tomato Cultivars Based on Logistic Regression Models. Agronomy 2018, 8, 176. [Google Scholar] [CrossRef]
- Silva, L.C.; Barroso, I.M. Regresión Logística; La Muralla: Madrid, Spain, 2004; p. 173. ISBN 847133738X. [Google Scholar]
- Hosmer, D.W.; Lemeshow, S.; Sturdivant, R.X. Applied Logistic Regression; John Wiley & Sons: Hoboken, NJ, USA, 2013; Volume 398, p. 500. ISBN 978-0-470-58247-3. [Google Scholar]
- Collett, D.R. Modelling Binary Data, 2nd ed.; Chapman and Hall: London, UK, 2002; p. 408. ISBN 9871420057386. [Google Scholar]
- Agresti, A. An Introduction to Categorical Data Analysis, 2nd ed.; John Wiley & Sons: Hoboken, NJ, USA, 1996; p. 372. ISBN 978-0-471-22618-5. [Google Scholar]
- Kasmire, R.F.; Cantwell, M. Postharvest handling systems: Fruit vegetables. In Postharvest Quality of Horticultural Crops, 3rd ed.; Kader, A.A., Ed.; University of California Publications: Oakland, CA, USA, 2011; pp. 457–474. ISBN 987-1-60107-744-8. [Google Scholar]
- Thompson, J.F. Storange systems. In Postharvest Quality of Horticultural Crops, 3rd ed.; Kader, A.A., Ed.; University of California Publications: Oakland, CA, USA, 2011; pp. 73–76. ISBN 987-1-60107-744-8. [Google Scholar]
- Meng, X.; Li, B.; Liu, J.; Tian, S. Physiological responses and quality attributes of table grape fruit to chitosan preharvest spray and postharvest coating during storage. Food Chem. 2008, 106, 501–508. [Google Scholar] [CrossRef]
- Kleinbaum, D.G.; Klein, M. Logistic Regression. A Self-Learning Text, 3rd ed.; Springer: New York, NY, USA, 2010; p. 701. ISBN 978-1-4419-1741-6. [Google Scholar]
- Commission Implementing Regulation (EU) No 543/2011 of 7 June 2011. Laying down Detailed Rules for the Application of Council Regulation (EC) No 1234/2007 in Respect of the Fruit and Vegetables and Processed Fruit and Vegetables Sectors; EU: Brussel, Belgium, 2011. [Google Scholar]
- Bahnasawy, A.H.; Khater, E. Effect of wax coating on the quality of cucumber fruits during storage. J. Food Process Technol. 2014, 5, 2. [Google Scholar] [CrossRef]
- Smith, N.J.S.; Tucker, G.A.; Jeger, J. Softening and cell wall changes in bananas and plantains. Asp. Appl. Biol. 1989, 20, 57–65. [Google Scholar]
- Valverde, J.M.; Guillén, F.; Martínez-Romero, D.; Castillo, S.; Serrano, M.; Valero, D. Improvement of table grapes quality and safety by the combination of modified atmosphere packaging (MAP) and eugenol, menthol, or thymol. J. Agric. Food Chem. 2005, 53, 7458–7464. [Google Scholar] [CrossRef] [PubMed]
- Tolesa, G.N.; Workneh, T.S.; Melesse, S.F. Logistic regression analysis of marketability of tomato fruit harvested at different maturity stages and subjected to disinfection, storage condition and storage period treatments. Biol. Agric. Hortic. 2017, 1, 40–52. [Google Scholar] [CrossRef]
- Melesse, S.; Sobratee, N.; Workneh, T.S. Application of logistic regression statistical technique to evaluate tomato quality subjected to different pre-and postharvest treatments. Biol. Agric. Hortic. 2016, 4, 277–287. [Google Scholar] [CrossRef]
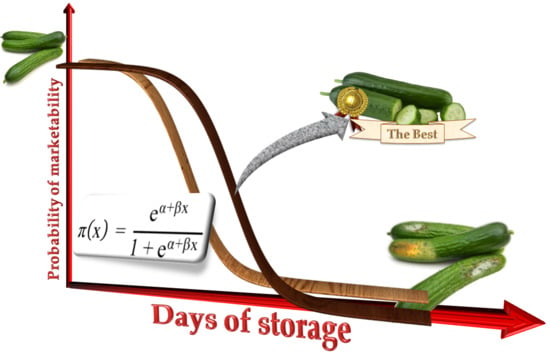
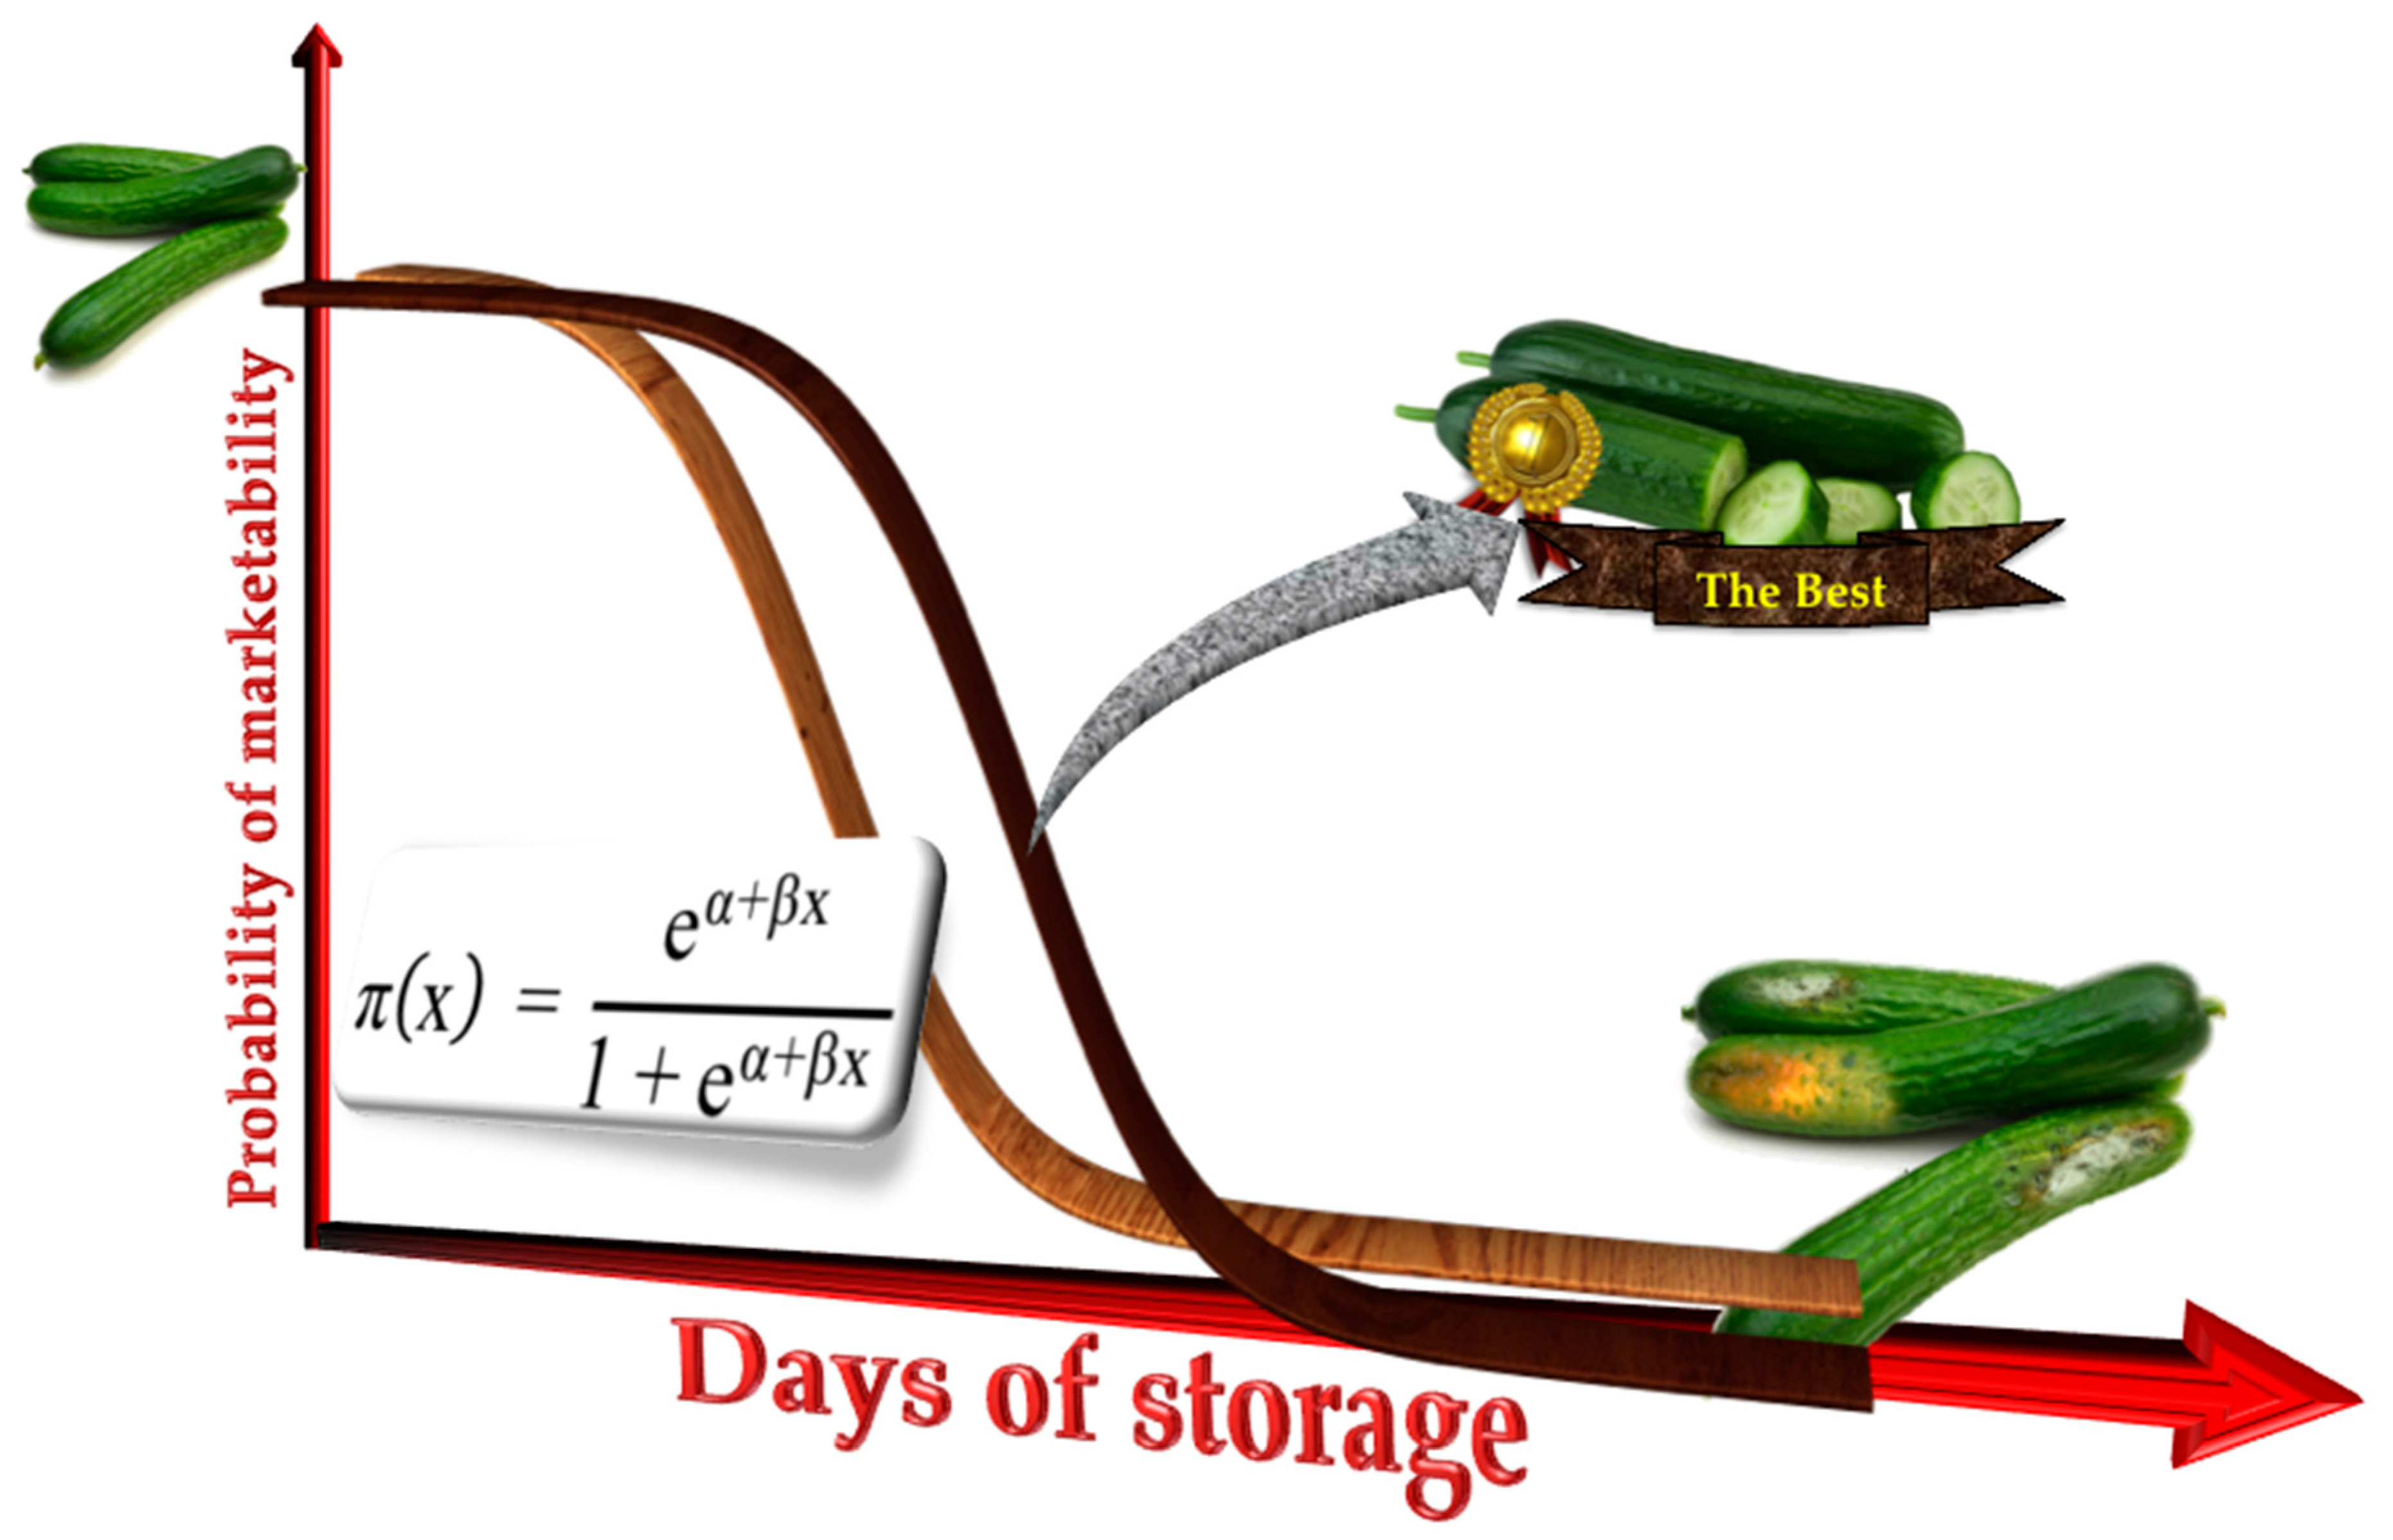
Figure 1.
Diagram of the interest in and practical application of the logistic regression model in comparative studies of cucumber cultivars to identify cultivars with the longest postharvest shelf life. In the figure, π (x) is the probability of marketability of a cucumber, “x” is the days of storage, “e” is Euler’s number, “α” is the intercept, and “β” is the slope. Source: Author’s elaboration based on Díaz-Pérez [22].

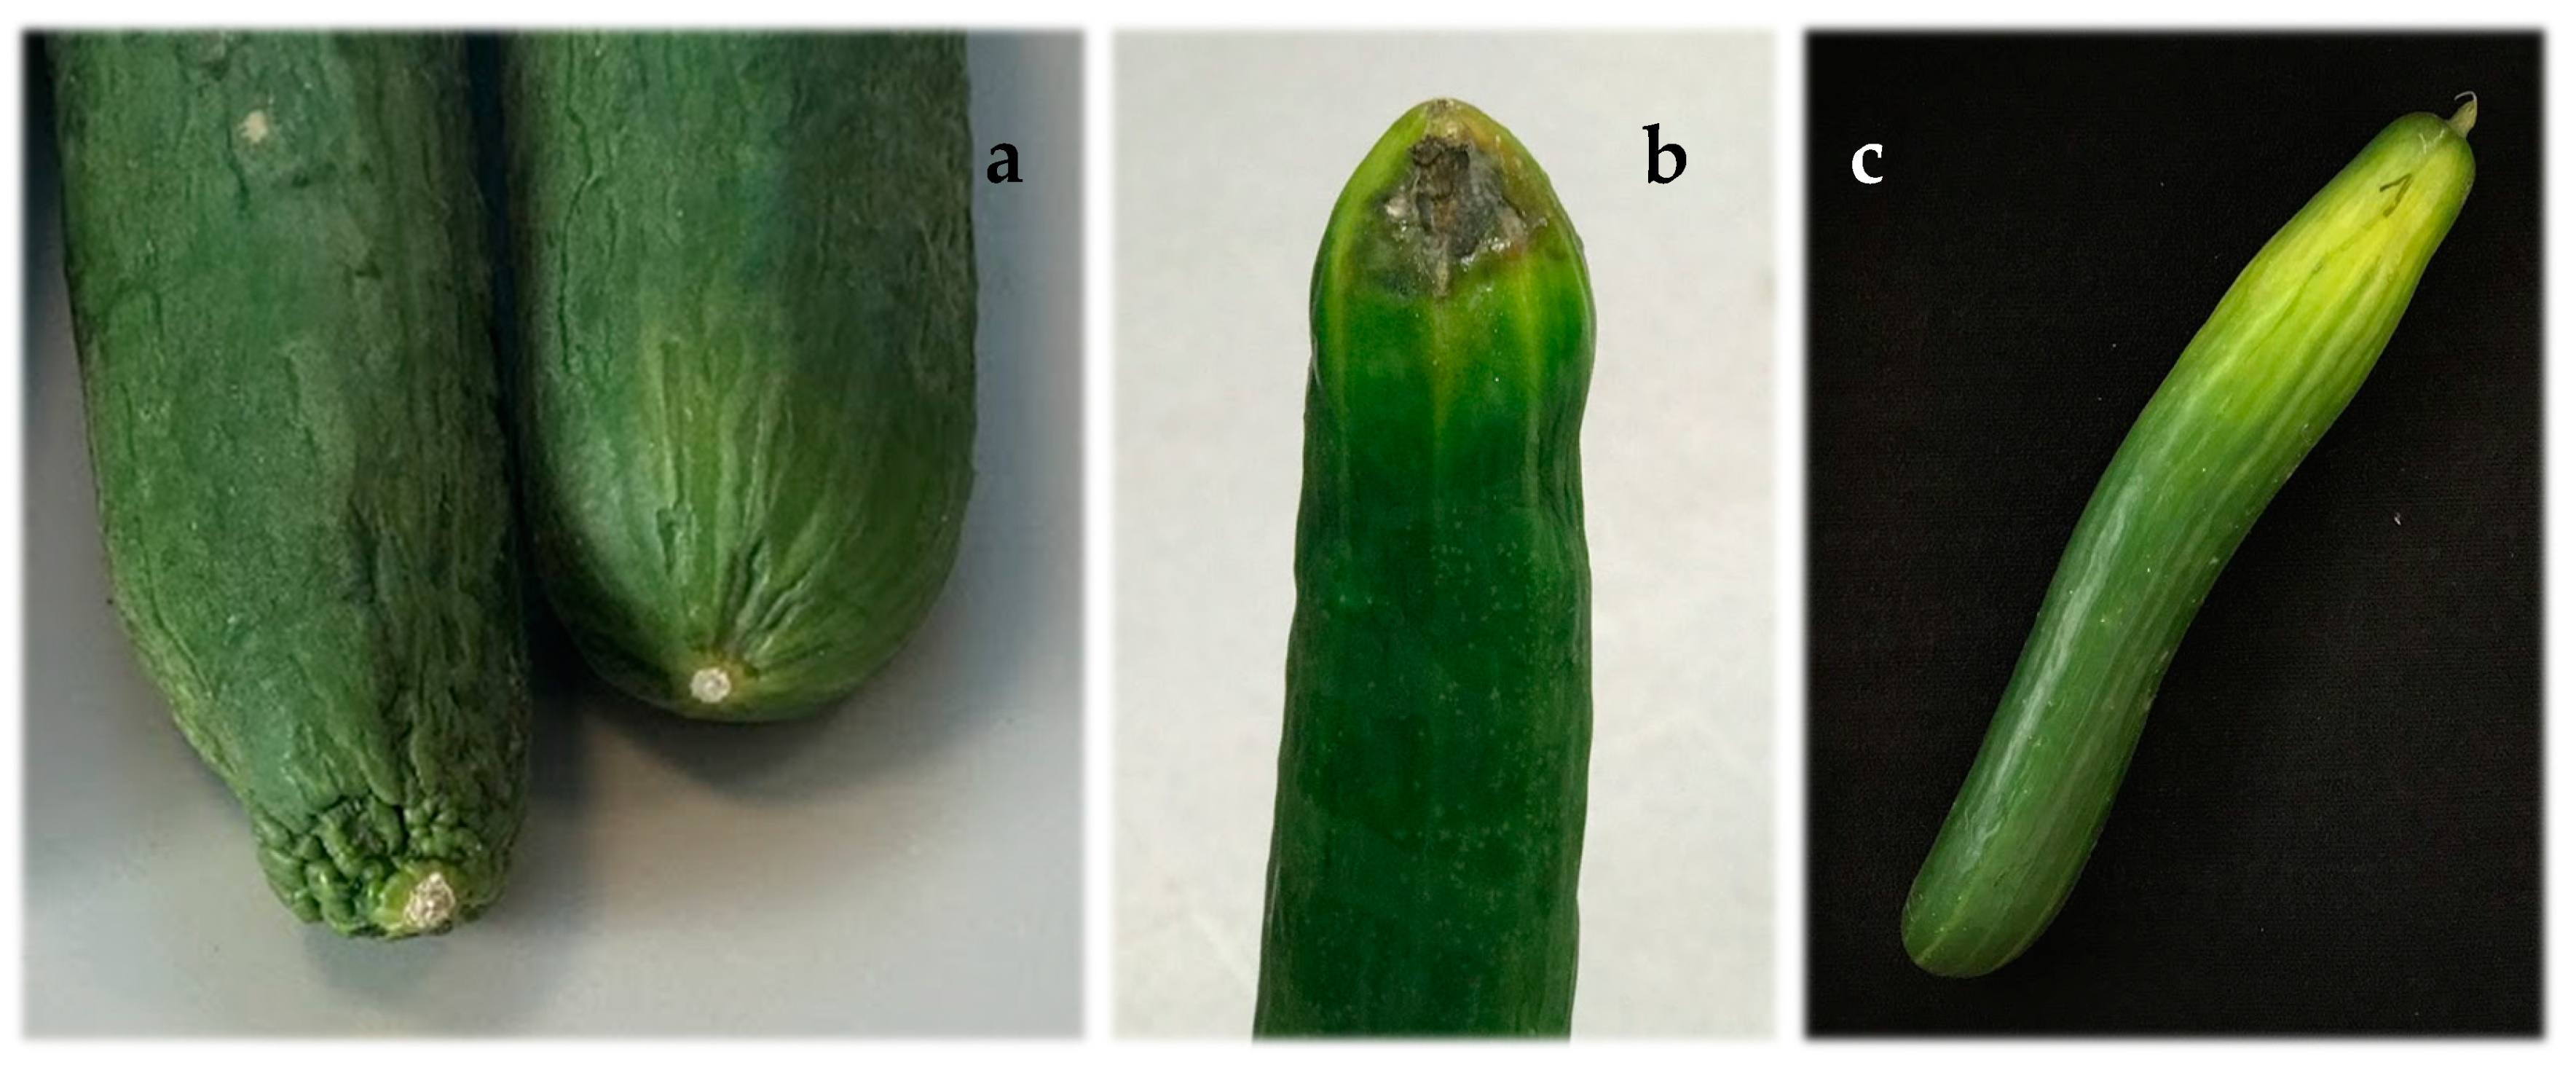
Figure 2.
Details of noncommercial cucumber fruits identified during the study. Apical wilt caused by fruit aging and water loss (a). Apical rot (b). Loss of green color (i.e., chlorophyll) with yellow development (c).
Figure 2.
Details of noncommercial cucumber fruits identified during the study. Apical wilt caused by fruit aging and water loss (a). Apical rot (b). Loss of green color (i.e., chlorophyll) with yellow development (c).

Figure 3.
Timeline of the probability of marketability of the LET cucumber cultivars. The results are obtained from the simple logistic model for each cultivar as a function of the days of storage.
Figure 3.
Timeline of the probability of marketability of the LET cucumber cultivars. The results are obtained from the simple logistic model for each cultivar as a function of the days of storage.

Figure 4.
Timeline of the probability of marketability in mini cucumber cultivars. The results are obtained from the simple logistic model for each cultivar, as a function of the days of storage.
Figure 4.
Timeline of the probability of marketability in mini cucumber cultivars. The results are obtained from the simple logistic model for each cultivar, as a function of the days of storage.

Figure 5.
Timeline of the probability of marketability as a function of the days of storage (DOS) for the Levantino and Litoral cucumber cultivars.
Figure 5.
Timeline of the probability of marketability as a function of the days of storage (DOS) for the Levantino and Litoral cucumber cultivars.

Figure 6.
Timeline of the probability of marketability as a function of the days of storage (DOS) for the Poniente, Galerno, and Valle cucumber cultivars.
Figure 6.
Timeline of the probability of marketability as a function of the days of storage (DOS) for the Poniente, Galerno, and Valle cucumber cultivars.

Figure 7.
Timeline of the probability of marketability as a function of the days of storage (DOS) for the mini-type cucumber cultivars.
Figure 7.
Timeline of the probability of marketability as a function of the days of storage (DOS) for the mini-type cucumber cultivars.

Figure 8.
Probability of marketability based on fruit loss percentage during storage for the Levantino and Litoral cultivars.
Figure 8.
Probability of marketability based on fruit loss percentage during storage for the Levantino and Litoral cultivars.

Figure 9.
Probability of marketability based on fruit loss percentage during storage for the Galerno, Poniente, and Valle cultivars.
Figure 9.
Probability of marketability based on fruit loss percentage during storage for the Galerno, Poniente, and Valle cultivars.

Figure 10.
Probability of marketability based on fruit weight loss of the mini-type cucumber cultivars studied. The results are obtained from the simple logistic model for each cultivar and based on fruit weight loss percentage (FWL %) during storage.
Figure 10.
Probability of marketability based on fruit weight loss of the mini-type cucumber cultivars studied. The results are obtained from the simple logistic model for each cultivar and based on fruit weight loss percentage (FWL %) during storage.


Table 1.
Sampling for each crop cycle and month of evaluation and days in which the samples of each cucumber cultivar were measured in the laboratory.
Table 1.
Sampling for each crop cycle and month of evaluation and days in which the samples of each cucumber cultivar were measured in the laboratory.
| Evaluated Cycle | Month of Evaluation/Cycle | DOS (a) | ||||||||||||||
|---|---|---|---|---|---|---|---|---|---|---|---|---|---|---|---|---|
| Cultivars | 14–15 | 16–17 | 17–18 | Nov. | Dec. | Jan. | Feb. | Mar. | 0 | 7 | 14 | 21 | 28 | 35 | ||
| LET | ||||||||||||||||
| Litoral | X | X | X | X | X | X | X | X | X | X | X | |||||
| Levantino | X | X | X | X | X | X | X | X | X | X | X | |||||
| Galerno | X | X | X | X | X | X | X | X | X | X | X | |||||
| Poniente | X | X | X | X | X | X | X | X | X | X | X | |||||
| Valle | X | X | X | X | X | X | X | X | X | X | X | |||||
| Mini-type | 0 | 5 | 10 | 15 | 20 | 25 | 30 | 35 | ||||||||
| Katrina | X | X | X | X | X | X | X | X | X | X | X | X | ||||
| 176 | X | X | X | X | X | X | X | X | X | X | X | X | ||||
| 15999 | X | X | X | X | X | X | X | X | X | X | X | X | ||||
| 16000 | X | X | X | X | X | X | X | X | X | X | X | X | ||||
| 16054 | X | X | X | X | X | X | X | X | X | X | X | X | ||||
(a) Days of storage over which the fruit samples were measured during postharvest in the laboratory. X: Sampling conducted.
Table 2.
Estimated independent simple logistic regression parameters for each LET cucumber cultivar as a function of the days of storage (DOS), which is a factor influencing the probability of marketability.
Table 2.
Estimated independent simple logistic regression parameters for each LET cucumber cultivar as a function of the days of storage (DOS), which is a factor influencing the probability of marketability.
| Cultivar | Coefficients | Odds Ratio | 95% CI for (Exp(β)) | ||||
|---|---|---|---|---|---|---|---|
| Variable | (α, β) | Wald χ2 | p | (Exp(β)) | Lower | Upper | |
| Period: November–January | |||||||
| Levantino * | DOS | −0.330 | 193.198 | <0.000 | 0.719 | 0.687 | 0.753 |
| Constant | 6.430 | 192.484 | <0.000 | 619.996 | |||
| Litoral * | DOS | −0.366 | 180.054 | <0.000 | 0.694 | 0.658 | 0.732 |
| Constant | 5.910 | 171.565 | <0.000 | 368.591 | |||
| Period: February–March | |||||||
| Galerno * | DOS | −0.585 | 15.730 | <0.000 | 0.557 | 0.417 | 0.744 |
| Constant | 7.620 | 15.470 | <0.000 | 2039.480 | |||
| Poniente * | DOS | −0.357 | 186.558 | <0.000 | 0.700 | 0.665 | 0.737 |
| Constant | 6.033 | 179.682 | <0.000 | 417.092 | |||
| Valle * | DOS | −0.514 | 66.923 | <0.000 | 0.598 | 0.529 | 0.676 |
| Constant | 5.521 | 57.952 | <0.000 | 249.885 | |||
* Likelihood ratio (omnibus; p < 0.001). Hosmer–Lemeshow test (p > 0.05). The results are obtained from the simple logistic model for each cultivar as a function of the days of storage.
Table 3.
Estimation of independent simple logistic regression parameters for each mini cucumber cultivar based on the days of storage (DOS), which is a factor influencing the probability of marketability.
Table 3.
Estimation of independent simple logistic regression parameters for each mini cucumber cultivar based on the days of storage (DOS), which is a factor influencing the probability of marketability.
| Cultivar | Coefficients | Odds ratio | 95% CI for (Exp(β)) | ||||
|---|---|---|---|---|---|---|---|
| Variable | (α, β) | Wald χ2 | p | (Exp(β)) | Lower | Upper | |
| 176 * | DOS | −0.296 | 125.198 | <0.000 | 0.744 | 0.706 | 0.784 |
| Constant | 4.724 | 114.867 | <0.000 | 112.664 | |||
| 15999 * | DOS | −0.348 | 30.631 | <0.000 | 0.706 | 0.624 | 0.799 |
| Constant | 4.207 | 40.793 | <0.000 | 67.155 | |||
| 16000 * | DOS | −0.367 | 34.819 | <0.000 | 0.693 | 0.613 | 0.783 |
| Constant | 5.209 | 43.385 | <0.000 | 182.856 | |||
| 16054 * | DOS | −0.590 | 27.759 | <0.000 | 0.554 | 0.445 | 0.690 |
| Constant | 6.019 | 29.840 | <0.000 | 411.181 | |||
| Katrina * | DOS | −0.345 | 214.049 | <0.000 | 0.708 | 0.676 | 0.742 |
| Constant | 4.237 | 197.549 | <0.000 | 69.201 | |||
* Likelihood ratio (omnibus; p < 0.000). Hosmer–Lemeshow test (p > 0.05). The results are obtained from the simple logistic model for each cultivar, as a function of the days of storage.
Table 4.
Estimation of the multiple logistic regression parameters for cultivars (Levantino and Litoral) and DOS as factors influencing the probability of marketability.
Table 4.
Estimation of the multiple logistic regression parameters for cultivars (Levantino and Litoral) and DOS as factors influencing the probability of marketability.
| Variables | Coefficients | Wald χ2 | p | Odds Ratio | 95% CI for (Exp(β)) | |
|---|---|---|---|---|---|---|
| (α, β) | (Exp(β)) | Lower | Upper | |||
| Constant | 5.602 | 325.113 | <0.000 | 271.048 | ||
| DOS | −0.346 | 373.355 | <0.000 | 0.707 | 0.683 | 0.733 |
| Levantino | 1.144 | 39.917 | <0.000 | 3.140 | 2.202 | 4.477 |
| Litoral | Reference | |||||
Likelihood ratio (omnibus, p < 0.000). Hosmer–Lemeshow test (p = 0.886). CI: Confidence interval.
Table 5.
Estimation of the multiple logistic regression parameters for cultivars (Galerno, Poniente, and Valle) and days of storage (DOS) as factors influencing the probability of marketability.
Table 5.
Estimation of the multiple logistic regression parameters for cultivars (Galerno, Poniente, and Valle) and days of storage (DOS) as factors influencing the probability of marketability.
| Variables | Coefficients | Wald χ2 | p | Odds Ratio | 95% CI for (Exp(β)) | |
|---|---|---|---|---|---|---|
| (α, β) | (Exp(β)) | Lower | Upper | |||
| Constant | 4.272 | 160.644 | <0.000 | 71.692 | ||
| DOS | −0.398 | 266.725 | <0.000 | 0.671 | 0.640 | -0.398 |
| Galerno | 1.007 | 5.654 | 0.017 | 2.736 | 1.193 | 1.007 |
| Poniente | 2.447 | 72.483 | <0.000 | 11.558 | 6.580 | 2.447 |
| Valle | Reference | |||||
| Constant | 6.720 | 249.830 | <0.000 | 828.620 | ||
| DOS | −0.398 | 266.725 | <0.000 | 0.671 | 0.640 | 0.704 |
| Valle | −2.447 | 72.483 | <0.000 | 0.087 | 0.049 | 0.152 |
| Galerno | −1.441 | 12.835 | <0.000 | 0.237 | 0.108 | 0.521 |
| Poniente | Reference | |||||
| Constant | 5.279 | 125.272 | <0.000 | 196.184 | ||
| DOS | −0.398 | 266.725 | <0.000 | 0.671 | 0.640 | 0.704 |
| Poniente | 1.441 | 12.835 | <0.000 | 4.224 | 1.920 | 9.290 |
| Valle | −1.007 | 5.654 | 0.017 | 0.365 | 0.159 | 0.838 |
| Galerno | Reference | |||||
Likelihood ratio (omnibus, p < 0.000). Hosmer–Lemeshow test (p = 0.079).
Table 6.
Estimation of the multiple logistic regression parameters for the mini-type cultivars and days of storage (DOS) as factors influencing the probability of marketability.
Table 6.
Estimation of the multiple logistic regression parameters for the mini-type cultivars and days of storage (DOS) as factors influencing the probability of marketability.
| Variables | Coefficients | Wald χ2 | p | Odds Ratio | 95% CI for (Exp(β)) | |
|---|---|---|---|---|---|---|
| (α, β) | (Exp(β)) | Lower | Upper | |||
| Constant | 4.180 | 343.022 | <0.000 | 65.337 | ||
| DOS | −0.340 | 426.987 | <0.000 | 0.712 | 0.689 | 0.735 |
| 176 | 1.247 | 39.387 | <0.000 | 3.480 | 2.357 | 5.136 |
| 15999 | −0.054 | 0.035 | 0.851 | 0.947 | 0.537 | 1.670 |
| 16000 | 0.701 | 6.905 | 0.009 | 2.016 | 1.195 | 3.401 |
| 16054 | −0.491 | 3.170 | 0.075 | 0.612 | 0.357 | 1.051 |
| Katrina | Reference | |||||
| Constant | 3.689 | 164.413 | <0.000 | 40.000 | ||
| DOS | −0.340 | 426.987 | <0.000 | 0.712 | 0.689 | 0.735 |
| Katrina | 0.491 | 3.170 | 0.075 | 1.633 | 0.952 | 2.803 |
| 176 | 1.738 | 31.765 | <0.000 | 5.684 | 3.106 | 10.400 |
| 15999 | 0.437 | 1.469 | 0.225 | 1.547 | 0.764 | 3.134 |
| 16000 | 1.192 | 11.771 | 0.001 | 3.293 | 1.667 | 6.506 |
| 16054 | Reference | |||||
| Constant | 4.881 | 248.244 | <0.000 | 131.723 | ||
| DOS | −0.340 | 426.987 | <0.000 | 0.712 | 0.689 | 0.735 |
| 16054 | −1.192 | 11.771 | 0.001 | 0.304 | 0.154 | 0.600 |
| Katrina | −0.701 | 6.905 | 0.009 | 0.496 | 0.294 | 0.837 |
| 176 | 0.546 | 3.547 | 0.049 | 1.726 | 1.012 | 3.046 |
| 15999 | −0.755 | 4.444 | 0.035 | 0.470 | 0.233 | 0.948 |
| 16000 | Reference | |||||
| Constant | 4.125 | 181.986 | <0.000 | 61.891 | ||
| DOS | −0.340 | 426.987 | <0.000 | 0.712 | 0.689 | 0.735 |
| 16000 | 0.755 | 4.444 | 0.035 | 2.128 | 1.054 | 4.296 |
| 16054 | −0.437 | 1.469 | 0.225 | 0.646 | 0.319 | 1.309 |
| Katrina | 0.054 | 0.035 | 0.851 | 1.056 | 0.599 | 1.861 |
| 176 | 1.301 | 16.643 | <0.000 | 3.673 | 1.966 | 6.863 |
| 15999 | Reference | |||||
| Constant | 5.426 | 325.873 | <0.000 | 227.345 | ||
| DOS | −0.340 | 426.987 | <0.000 | 0.712 | 0.689 | 0.735 |
| 15999 | −1.301 | 16.643 | <0.000 | 0.272 | 0.146 | 0.509 |
| 16000 | −0.546 | 3.547 | 0.060 | 0.579 | 0.328 | 1.022 |
| 16054 | −1.738 | 31.765 | <0.000 | 0.176 | 0.096 | 0.322 |
| Katrina | −1.247 | 39.387 | <0.000 | 0.287 | 0.195 | 0.424 |
| 176 | Reference | |||||
Likelihood ratio (omnibus, p < 0.000). Hosmer–Lemeshow test (p = 0.159).
Table 7.
Estimation of the multiple logistic regression parameters for cucumber cultivars (Levantino and Litoral) and FWL % during storage as factors influencing the probability of marketability.
Table 7.
Estimation of the multiple logistic regression parameters for cucumber cultivars (Levantino and Litoral) and FWL % during storage as factors influencing the probability of marketability.
| Variables | Coefficients | Wald χ2 | p | Odds Ratio | 95% CI for (Exp(β)) | |
|---|---|---|---|---|---|---|
| (α, β) | (Exp(β)) | Lower | Upper | |||
| Constant | 7.718 | 227.008 | <0.000 | 2248.731 | ||
| FWL % | −1.395 | 236.828 | <0.000 | 0.248 | 0.207 | 0.296 |
| Litoral | 1.941 | 79.759 | <0.000 | 6.965 | 4.549 | 10.663 |
| Levantino | Reference | |||||
Likelihood ratio (omnibus, p < 0.000). Hosmer–Lemeshow test (p = 0.140). FWL %: Fruit weight loss percentage during storage.
Table 8.
Estimation of multiple logistic regression parameters for cucumber cultivars (Galerno, Poniente, and Valle) and fruit weight loss percentage during storage as factors influencing the probability of marketability.
Table 8.
Estimation of multiple logistic regression parameters for cucumber cultivars (Galerno, Poniente, and Valle) and fruit weight loss percentage during storage as factors influencing the probability of marketability.
| Variables | Coefficients | Wald χ2 | p | Odds Ratio | 95% CI for (Exp(β)) | |
|---|---|---|---|---|---|---|
| (α, β) | (Exp(β)) | Lower | Upper | |||
| Constant | 5.091 | 198.615 | <0.000 | 162.540 | ||
| FWL % | −1.069 | 273.219 | <0.000 | 0.343 | 0.302 | 0.390 |
| Galerno | −0.155 | 0.147 | 0.702 | 0.857 | 0.388 | 1.891 |
| Poniente | 1.351 | 29.928 | <0.000 | 3.861 | 2.380 | 6.265 |
| Valle | Reference | |||||
| Constant | 6.442 | 251.470 | <0.000 | 627.610 | ||
| FWL % | −1.069 | 273.219 | <0.000 | 0.343 | 0.302 | 0.390 |
| Valle | −1.351 | 29.928 | <0.000 | 0.259 | 0.160 | 0.420 |
| Galerno | −1.506 | 14.408 | <0.000 | 0.222 | 0.102 | 0.483 |
| Poniente | Reference | |||||
| Constant | 4.936 | 125.463 | <0.000 | 139.224 | ||
| FWL % | −1.069 | 273.219 | <0.000 | 0.343 | 0.302 | 0.390 |
| Poniente | 1.506 | 14.408 | <0.000 | 4.508 | 2.072 | 9.810 |
| Valle | 0.155 | 0.147 | 0.702 | 1.167 | 0.529 | 2.577 |
| Galerno | Reference | |||||
Likelihood ratio (omnibus, p < 0.000). Hosmer–Lemeshow test (p = 0.235). FWL %: Fruit weight loss percentage during storage.
Table 9.
Estimation of the independent simple logistic regression parameters for each mini-type cucumber cultivar as a function of postharvest FWL % as a factor influencing the probability of marketability.
Table 9.
Estimation of the independent simple logistic regression parameters for each mini-type cucumber cultivar as a function of postharvest FWL % as a factor influencing the probability of marketability.
| cv. | Variable | Coefficients | Wald χ2 | p | Odds Ratio | 95% CI for (Exp(β)) | |
|---|---|---|---|---|---|---|---|
| (α, β) | (Exp(β)) | Lower | Upper | ||||
| 176 * | DOS | −0.507 | 116.197 | <0.000 | 0.603 | 0.550 | 0.661 |
| Constant | 3.983 | 116.870 | <0.000 | 53.696 | |||
| 15999 * | DOS | −0.434 | 30.836 | <0.000 | 0.648 | 0.556 | 0.755 |
| Constant | 3.829 | 44.146 | <0.000 | 46.005 | |||
| 16000 * | DOS | −0.387 | 35.562 | <0.000 | 0.679 | 0.598 | 0.771 |
| Constant | 3.385 | 63.741 | <0.000 | 29.505 | |||
| 16054 * | DOS | −0.603 | 27.788 | <0.000 | 0.547 | 0.437 | 0.685 |
| Constant | 4.089 | 33.558 | <0.000 | 59.709 | |||
| Katrina * | DOS | −0.446 | 207.820 | <0.000 | 0.640 | 0.603 | 0.680 |
| Constant | 3.230 | 197.323 | <0.000 | 25.277 | |||
* Likelihood ratio (omnibus; p < 0.000). Hosmer–Lemeshow test (p > 0.05). The results are obtained from the simple logistic model for each cultivar as a function of the days of storage.
Table 10.
Estimation of the multiple logistic regression parameters for the Levantino and Litoral cucumber cultivars.
Table 10.
Estimation of the multiple logistic regression parameters for the Levantino and Litoral cucumber cultivars.
| Variables | Coefficients | Wald χ2 | p | Odds Ratio | 95% CI for (Exp(β)) | |
|---|---|---|---|---|---|---|
| (α, β) | (Exp(β)) | Lower | Upper | |||
| Constant | 10.561 | 262.608 | <0.000 | 38,613.016 | ||
| DOS | −0.259 | 108.555 | <0.000 | 0.772 | 0.735 | 0.810 |
| FWL % | −0.627 | 58.702 | <0.000 | 0.534 | 0.455 | 0.627 |
| Month | ||||||
| November | −2.809 | 79.297 | <0.000 | 0.060 | 0.032 | 0.112 |
| December | −2.246 | 60.086 | <0.000 | 0.106 | 0.060 | 0.187 |
| January | Reference | |||||
Likelihood ratio (omnibus, p < 0.000). Hosmer–Lemeshow test (p = 0.072). DOS: Days of storage. CI: Confidence interval.
Table 11.
Estimation of the multiple logistic regression parameters for the Levantino and Litoral cucumber cultivars.
Table 11.
Estimation of the multiple logistic regression parameters for the Levantino and Litoral cucumber cultivars.
| Variables | Coefficients | Wald χ2 | p | Odds Ratio | 95% CI for (Exp(β)) | |
|---|---|---|---|---|---|---|
| (α, β) | (Exp(β)) | Lower | Upper | |||
| Constant | 12.585 | 223.694 | <0.000 | 29,2001.831 | ||
| FWL % | −1.572 | 230.198 | <0.000 | 0.208 | 0.169 | 0.254 |
| Phenotype | ||||||
| Litoral | −2.239 | 88.104 | <0.000 | 0.107 | 0.067 | 0.170 |
| Levantino | Reference | |||||
| Month | ||||||
| November | −2.227 | 58.624 | <0.000 | 0.108 | 0.061 | 0.191 |
| December | −1.927 | 50.642 | <0.000 | 0.146 | 0.086 | 0.248 |
| January | Reference | |||||
Likelihood ratio test (omnibus, p < 0.000). Hosmer–Lemeshow test (p = 0.128). DOS: Days of storage. CI: Confidence interval.
Table 12.
Estimation of the multiple logistic regression parameters for the Galerno, Poniente, and Valle cucumber cultivars.
Table 12.
Estimation of the multiple logistic regression parameters for the Galerno, Poniente, and Valle cucumber cultivars.
| Variables | Coefficients | Wald χ2 | p | Odds Ratio | 95% CI for (Exp(β)) | |
|---|---|---|---|---|---|---|
| (α, β) | (Exp(β)) | Lower | Upper | |||
| Constant | 6.964 | 251.516 | <0.000 | 1058.172 | ||
| Phenotype | ||||||
| Valle | −2.120 | 52.380 | <0.000 | 0.120 | 0.068 | 0.213 |
| Galerno | −1.581 | 15.203 | <0.000 | 0.206 | 0.093 | 0.456 |
| Poniente | Reference | |||||
| DOS | −0.248 | 38.792 | <0.000 | 0.781 | 0.722 | 0.844 |
| FWL % | −0.459 | 19.048 | <0.000 | 0.632 | 0.515 | 0.777 |
Likelihood ratio (omnibus, p < 0.000). Hosmer–Lemeshow test (p = 0.236). DOS: Days of storage. CI: Confidence interval.
Table 13.
Estimation of multiple logistic regression parameters for the 176, 15999, 16000, 16054, and Katrina cucumber cultivars.
Table 13.
Estimation of multiple logistic regression parameters for the 176, 15999, 16000, 16054, and Katrina cucumber cultivars.
| Variables | Coefficients | Wald χ2 | p | Odds ratio | 95% CI for (Exp(β)) | |
|---|---|---|---|---|---|---|
| (α, β) | (Exp(β)) | Lower | Upper | |||
| Constant | 5.563 | 259.041 | <0.000 | 260.574 | ||
| Phenotypes | ||||||
| 15999 | −1.515 | 20.334 | <0.000 | 0.220 | 0.114 | 0.425 |
| 16000 | −0.620 | 4.195 | 0.041 | 0.538 | 0.297 | 0.974 |
| 16054 | −1.852 | 31.323 | <0.000 | 0.157 | 0.082 | 0.300 |
| Katrina | −1.332 | 39.393 | <0.000 | 0.264 | 0.174 | 0.400 |
| 176 | Reference | |||||
| DOS | −0.303 | 179.599 | <0.000 | 0.738 | 0.706 | 0.772 |
| FWL % | −0.104 | 10.467 | 0.001 | 0.901 | 0.846 | 0.960 |
| Months | ||||||
| November | 1.162 | 30.793 | <0.000 | 3.197 | 2.121 | 4.819 |
| December | −0.389 | 3.939 | 0.047 | 0.678 | 0.462 | 0.995 |
| January | Reference | |||||
Likelihood ratio (omnibus, p < 0.000). Hosmer–Lemeshow test (p = 0.315). DOS: Days of storage. CI: Confidence interval.
© 2019 by the authors. Licensee MDPI, Basel, Switzerland. This article is an open access article distributed under the terms and conditions of the Creative Commons Attribution (CC BY) license (http://creativecommons.org/licenses/by/4.0/).
Share and Cite
MDPI and ACS Style
Díaz-Pérez, M.; Carreño-Ortega, Á.; Salinas-Andújar, J.-A.; Callejón-Ferre, Á.-J. Application of Logistic Regression Models for the Marketability of Cucumber Cultivars. Agronomy 2019, 9, 17. https://doi.org/10.3390/agronomy9010017
AMA Style
Díaz-Pérez M, Carreño-Ortega Á, Salinas-Andújar J-A, Callejón-Ferre Á-J. Application of Logistic Regression Models for the Marketability of Cucumber Cultivars. Agronomy. 2019; 9(1):17. https://doi.org/10.3390/agronomy9010017
Chicago/Turabian StyleDíaz-Pérez, Manuel, Ángel Carreño-Ortega, José-Antonio Salinas-Andújar, and Ángel-Jesús Callejón-Ferre. 2019. "Application of Logistic Regression Models for the Marketability of Cucumber Cultivars" Agronomy 9, no. 1: 17. https://doi.org/10.3390/agronomy9010017
Note that from the first issue of 2016, this journal uses article numbers instead of page numbers. See further details here.