Structure and Properties of Piezoelectric Strontium Fresnoite Glass-Ceramics Belonging to the Sr–Ti–Si–Al–K–O System


University of Mons, Materials Institute, Rue de l’Epargne 56, 7000 Mons, Belgium
*
Author to whom correspondence should be addressed.
Ceramics 2019, 2(1), 86-97; https://doi.org/10.3390/ceramics2010008
Submission received: 3 December 2018
/
Revised: 11 January 2019
/
Accepted: 23 January 2019
/
Published: 26 January 2019
(This article belongs to the Special Issue Novel Processing Routes of Ceramics for Functional Applications)
Abstract
:Crystallization of strontium fresnoite Sr2TiSi2O8 piezoelectric crystals in Sr–Ti–Si–K–Al–O parent glasses is investigated with the aim of showing the influence of composition and crystallization conditions on the microstructure and piezoelectric properties of the resulting glass-ceramic. All the investigated conditions lead to a surface crystallization mechanism that induces a preferential orientation of crystal growth in the glasses. Near the surface, all the glass-ceramics obtained exhibit (002) planes preferentially oriented parallel to their faces. Deeper in the specimens, this preferential orientation is either kept or tilted to (201) after a depth of about 300 µm. The measurement of the charge coefficient d33 of the glass-ceramic highlights that surface crystallization induces mirror symmetry in the polarization. It reaches 11 to 12 pC/N and is not significantly influenced by the preferential orientation (002) or (201). High temperature XRD shows the stability of the fresnoite phase in the glass-ceramics up to 1000 °C. Mechanical characterization of the glass-ceramics by impulse excitation technique (IET) highlights that the softening of the residual glass leads to a progressive decrease of Young’s modulus in the temperature range 600–800 °C. Damping associated to the viscoplastic transition become severe only over 800 °C.
1. Introduction
Most piezoelectric sensors and actuators used today are based on ferroelectric polycrystalline ceramics. Due to initially randomly distributed polar domains within the ceramic grains, polarization under a high-strength electric field is required to confer macroscopic piezoelectric properties. These ceramics exhibit high piezoelectric performances, but their main drawback is the depolarization occurring over time and with increasing temperature.
For high temperature applications, pyroelectric non-ferroelectric phases can be used. The non-ferroelectric behavior is the result of the single domain configuration of the crystals. Consequently, in the case of polycrystalline ceramics, a preferential orientation of the crystallite’s polar direction needs to be induced during the elaboration process to obtain a macroscopic piezoelectric material. Highly preferentially oriented microstructures are not easily achievable through conventional ceramic powder processing, so these phases are usually obtained in single crystals.
In the present paper, the glass-ceramic process is investigated as an alternative route to produce highly textured polycrystalline non-ferroelectric piezoelectric materials by controlling the crystallization of a piezoelectric phase within a suitable glass composition. The piezoelectric phase selected in this work is strontium fresnoite Sr2TiSi2O8. This phase is pyroelectric but non-ferroelectric [1,2,3], belongs to the space group P4bm, and its lattice parameters are a = 8.3218 Å and c = 5.0292 Å [4]. The dipole moment of the unit cell is oriented along the [00l] direction [5].
The scientific literature highlights that various processing routes have been experimented to induce a preferentially oriented crystallization of fresnoite crystals in a parent glass [6,7]: (i) application of a thermal gradient between the two opposite faces of the glass [8], (ii) electrochemical nucleation of the glass melt [5,9,10,11], (iii) and ultrasonic treatment [12]. However, these techniques are not easy to operate and limit the specimens’ geometries [13]. An extensive review by Wisniewski et al. covered different aspects of the crystallization of fresnoite in glasses [14]. In previous papers, we have shown that a (002)-oriented surface crystallization can be obtained through laser treatment [15] and conventional thermal treatment of parent glasses belonging to the Sr–Ti–Si–K–B–O system [16,17,18]. We also highlighted that the evolution of the preferential orientation in depth is strongly dependent on the residual glass characteristics, and specifically the amount of K and B. However, mastering the K and B quantities was difficult due to the formation of volatile KBO2 during the melting process.
To overcome this problem, fresnoite-based glass-ceramics have been prepared from parent glass compositions belonging to the Sr–Ti–Si–K–Al–O system. The goal of K is to increase the thermal expansion of the residual glass and then to reduce the dilatometric mismatch. The effect of the Al amount on the crystallization and on the microstructure is investigated with the aim of obtaining high preferential orientation of the crystallites polar direction. The piezoelectric properties of the selected samples are characterized. Eventually, high temperature stability of the fresnoite crystals and of the glass-ceramics mechanical properties is evaluated.
2. Materials and Methods
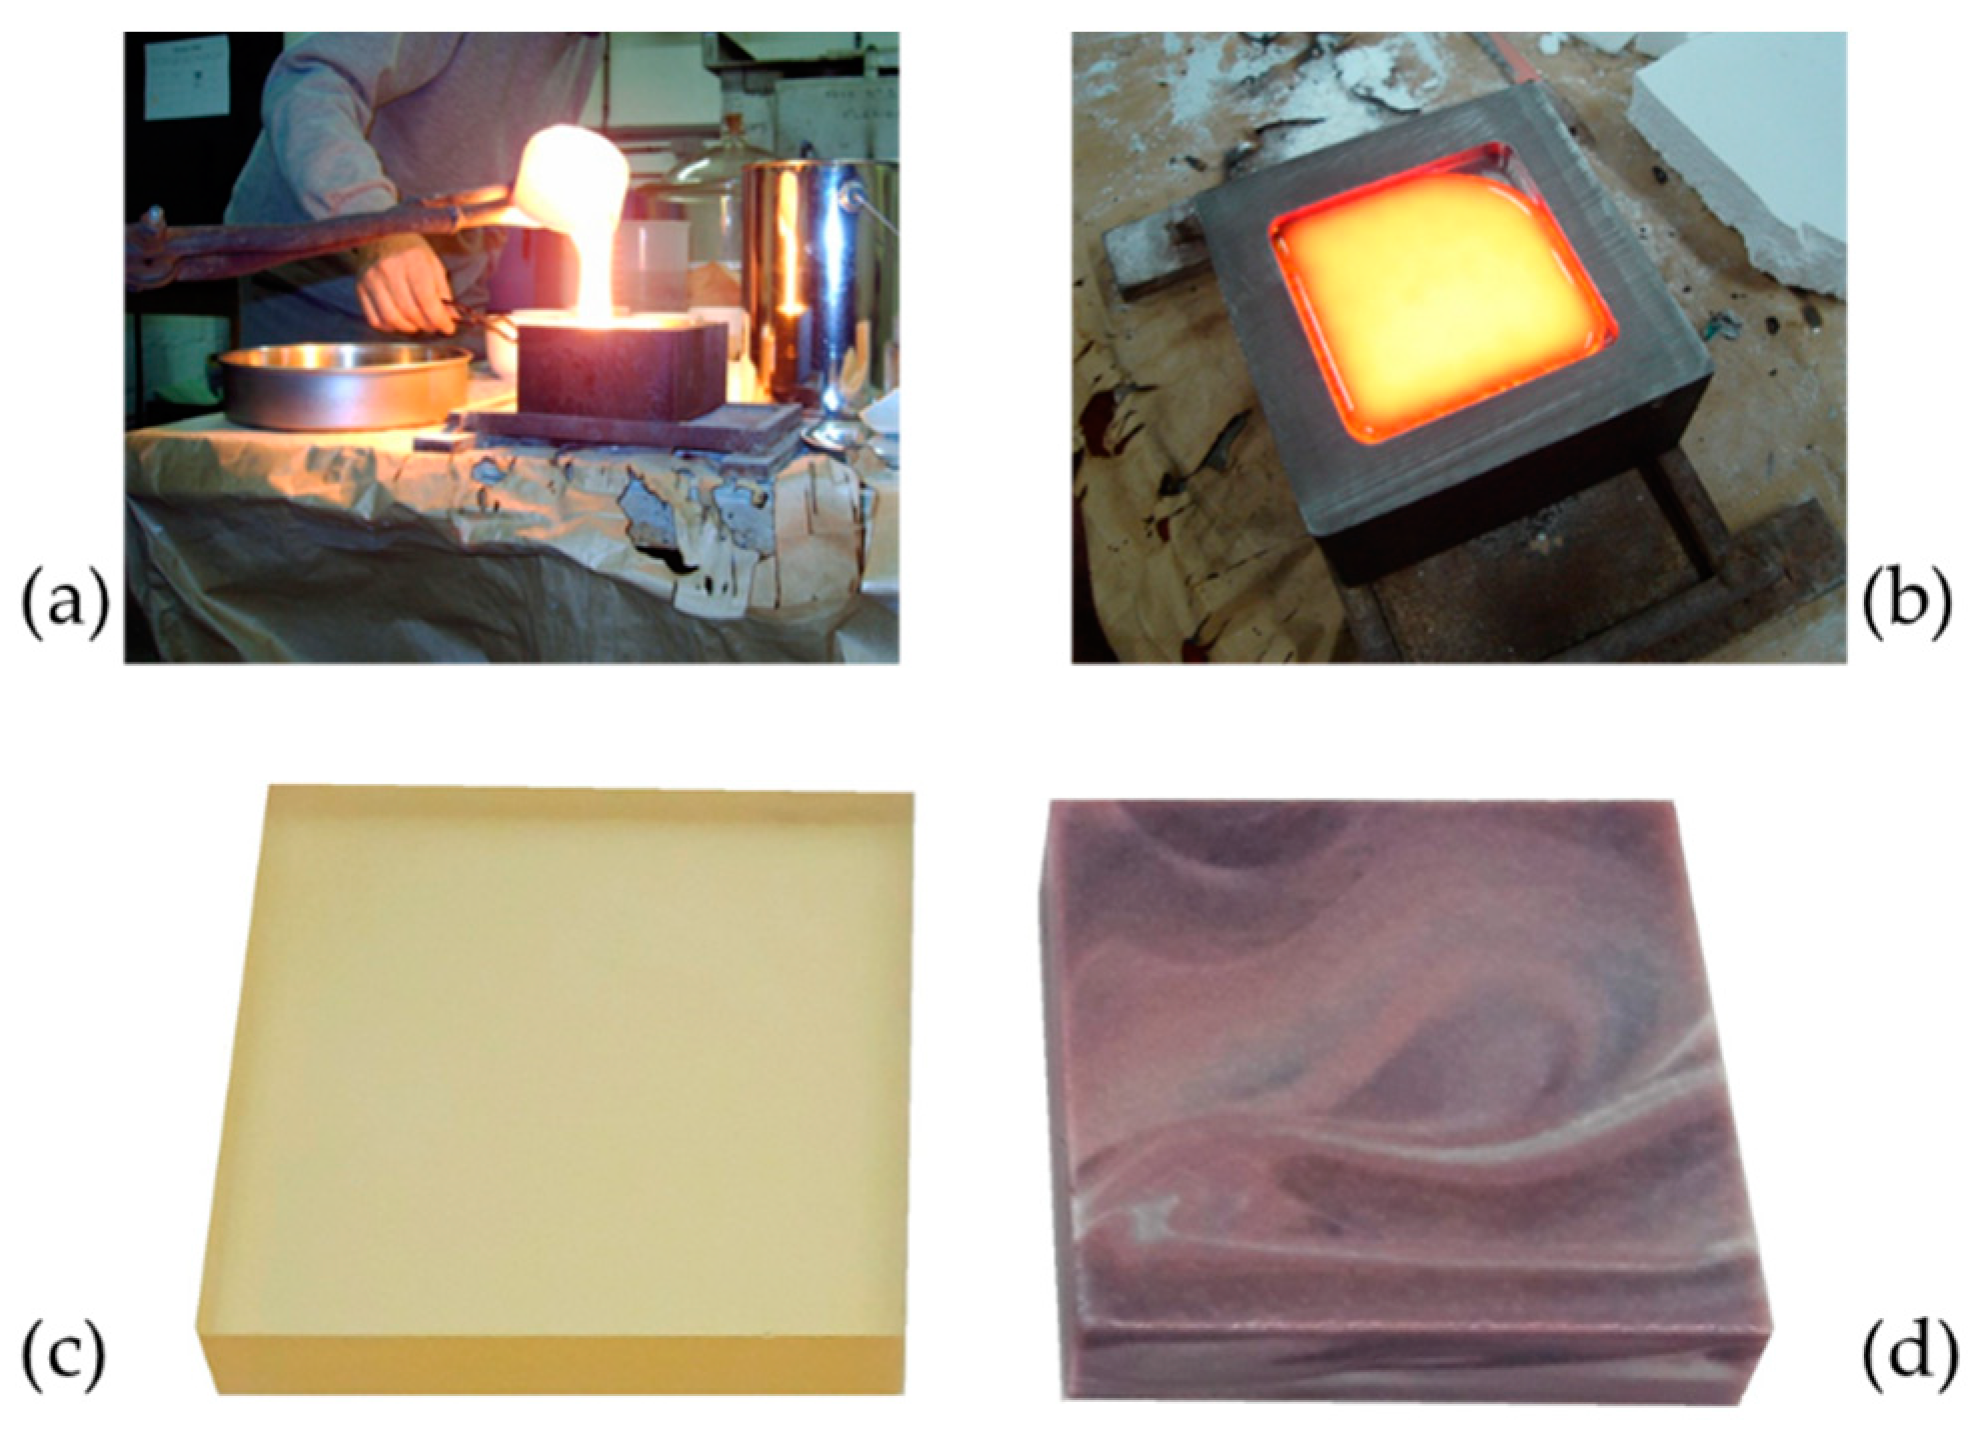
Parent glasses of compositions 2SrO 1TiO2 3.3SiO2 xK2O yAl2O3 (ST1.3S + xK2O + yAl2O3 with the new nomenclature [14]) are prepared from reagent grade SrCO3 (Alfa Aesar, 99.99%), TiO2 (VWR, 99.99%), SiO2 (Sigrano, 97–99.98%), Al2O3 (Almatis, +99%) and K2CO3 (VWR, +99%). Based on a previous work [16], x is fixed to 0.2 and y = 0; 0.02; 0.05; 0.10; and 0.15. Wet processing in isopropanol is used to mix the powders and obtain a good homogeneity. After complete evaporation of the isopropanol, the dried powder mixture is pressed in pellets. Melting is realized in a Pt/Au 95/5 crucible at 1500 °C for 2 hours. The melt is cast in 70 × 70 × 6 mm plates in a steel mold (Figure 1a,b). To release internal stresses and avoid cracks, these plates are annealed for 2 hours at 650 °C (close to the glass transition temperature Tg) before slow cooling inside the turned off furnace. Each glass plate is surface polished and cut in 30 × 30 × 6 mm parallelepipeds (Figure 1c).
The samples are placed on an alumina-silica substrate and crystallized (Figure 1d) through isothermal treatment at different temperatures, Tc, in the range of 850–950 °C according to the following schedule:
- 300 °C/h from RT to Tc
- Dwell time of tc hours at Tc
- Natural cooling in switched off furnace
After the crystallization treatment, qualitative crystalline phase analyses are carried out by XRD with a Siemens D5000 θ-2θ diffractometer using a CoKα radiation source. Preferential orientation of the c-polar axis of fresnoite crystals is characterized by calculating the ratio R(002):
R(002) = I(002)/[I(002) + I(211)]
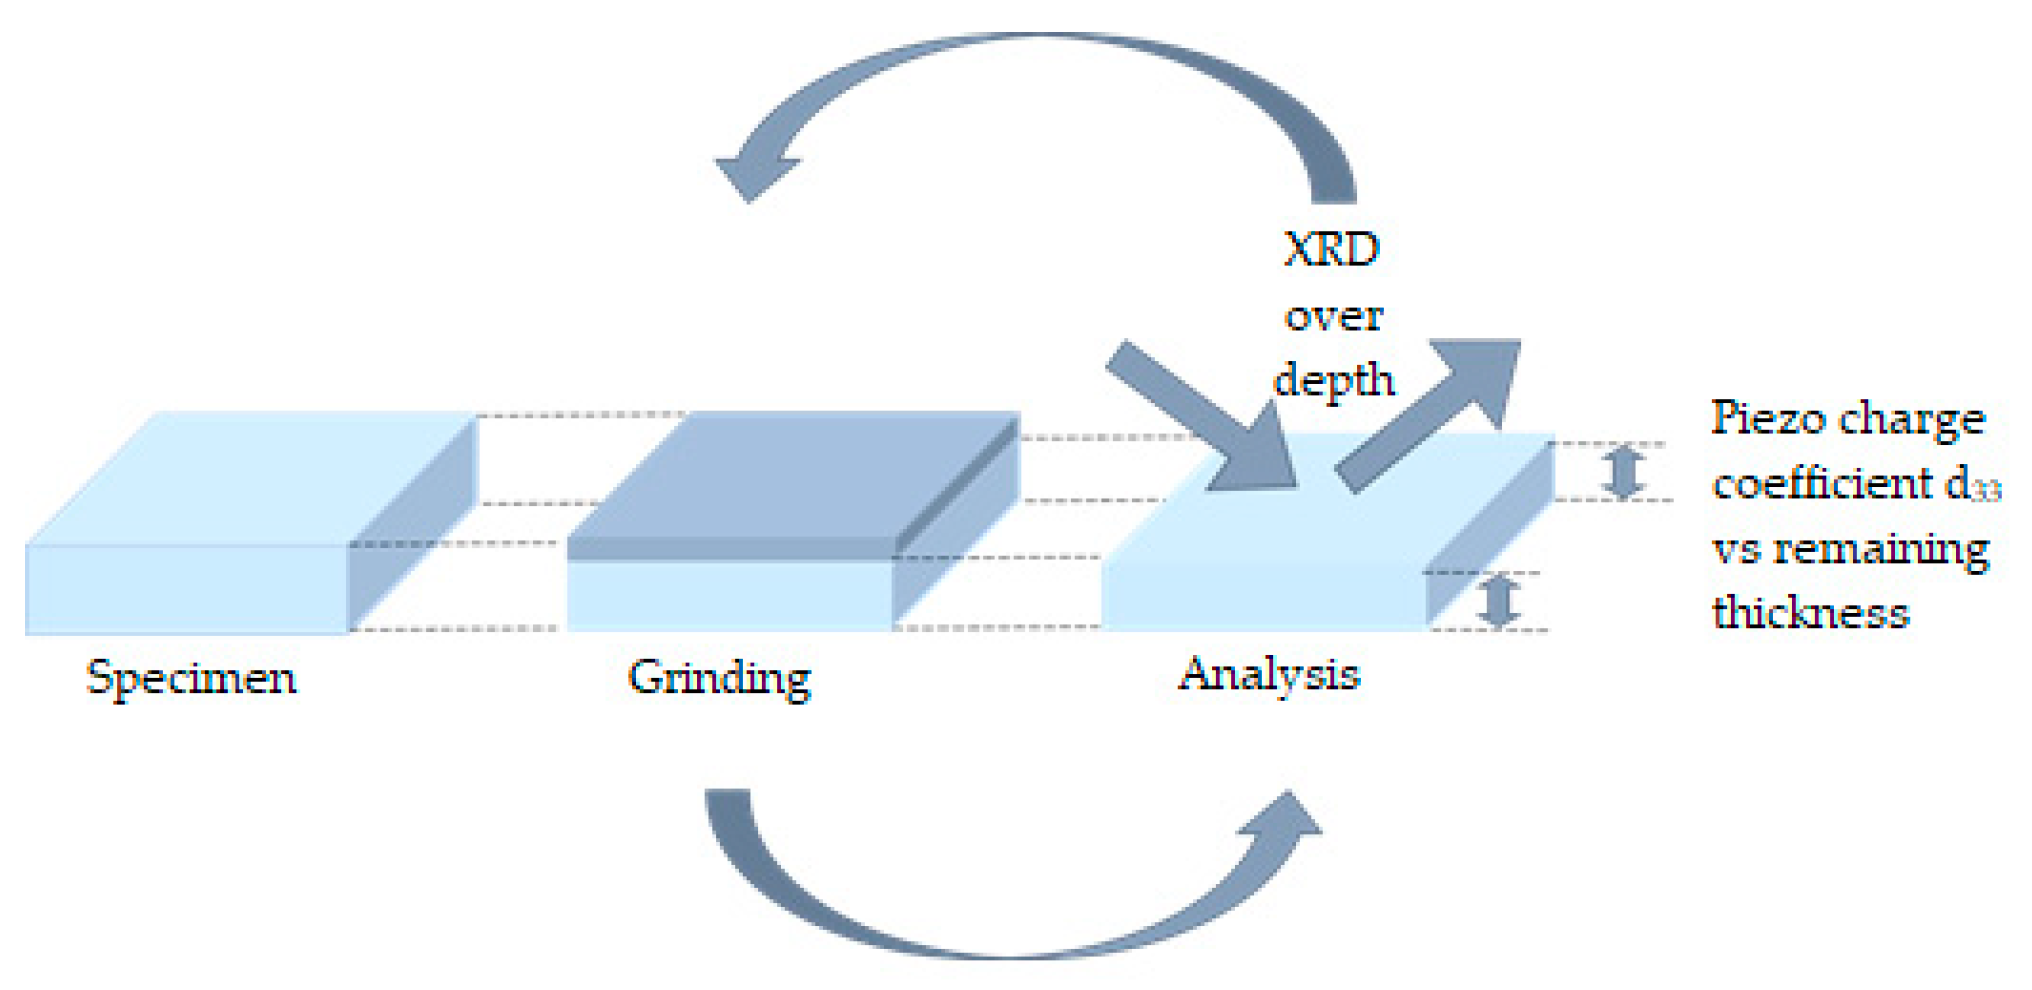
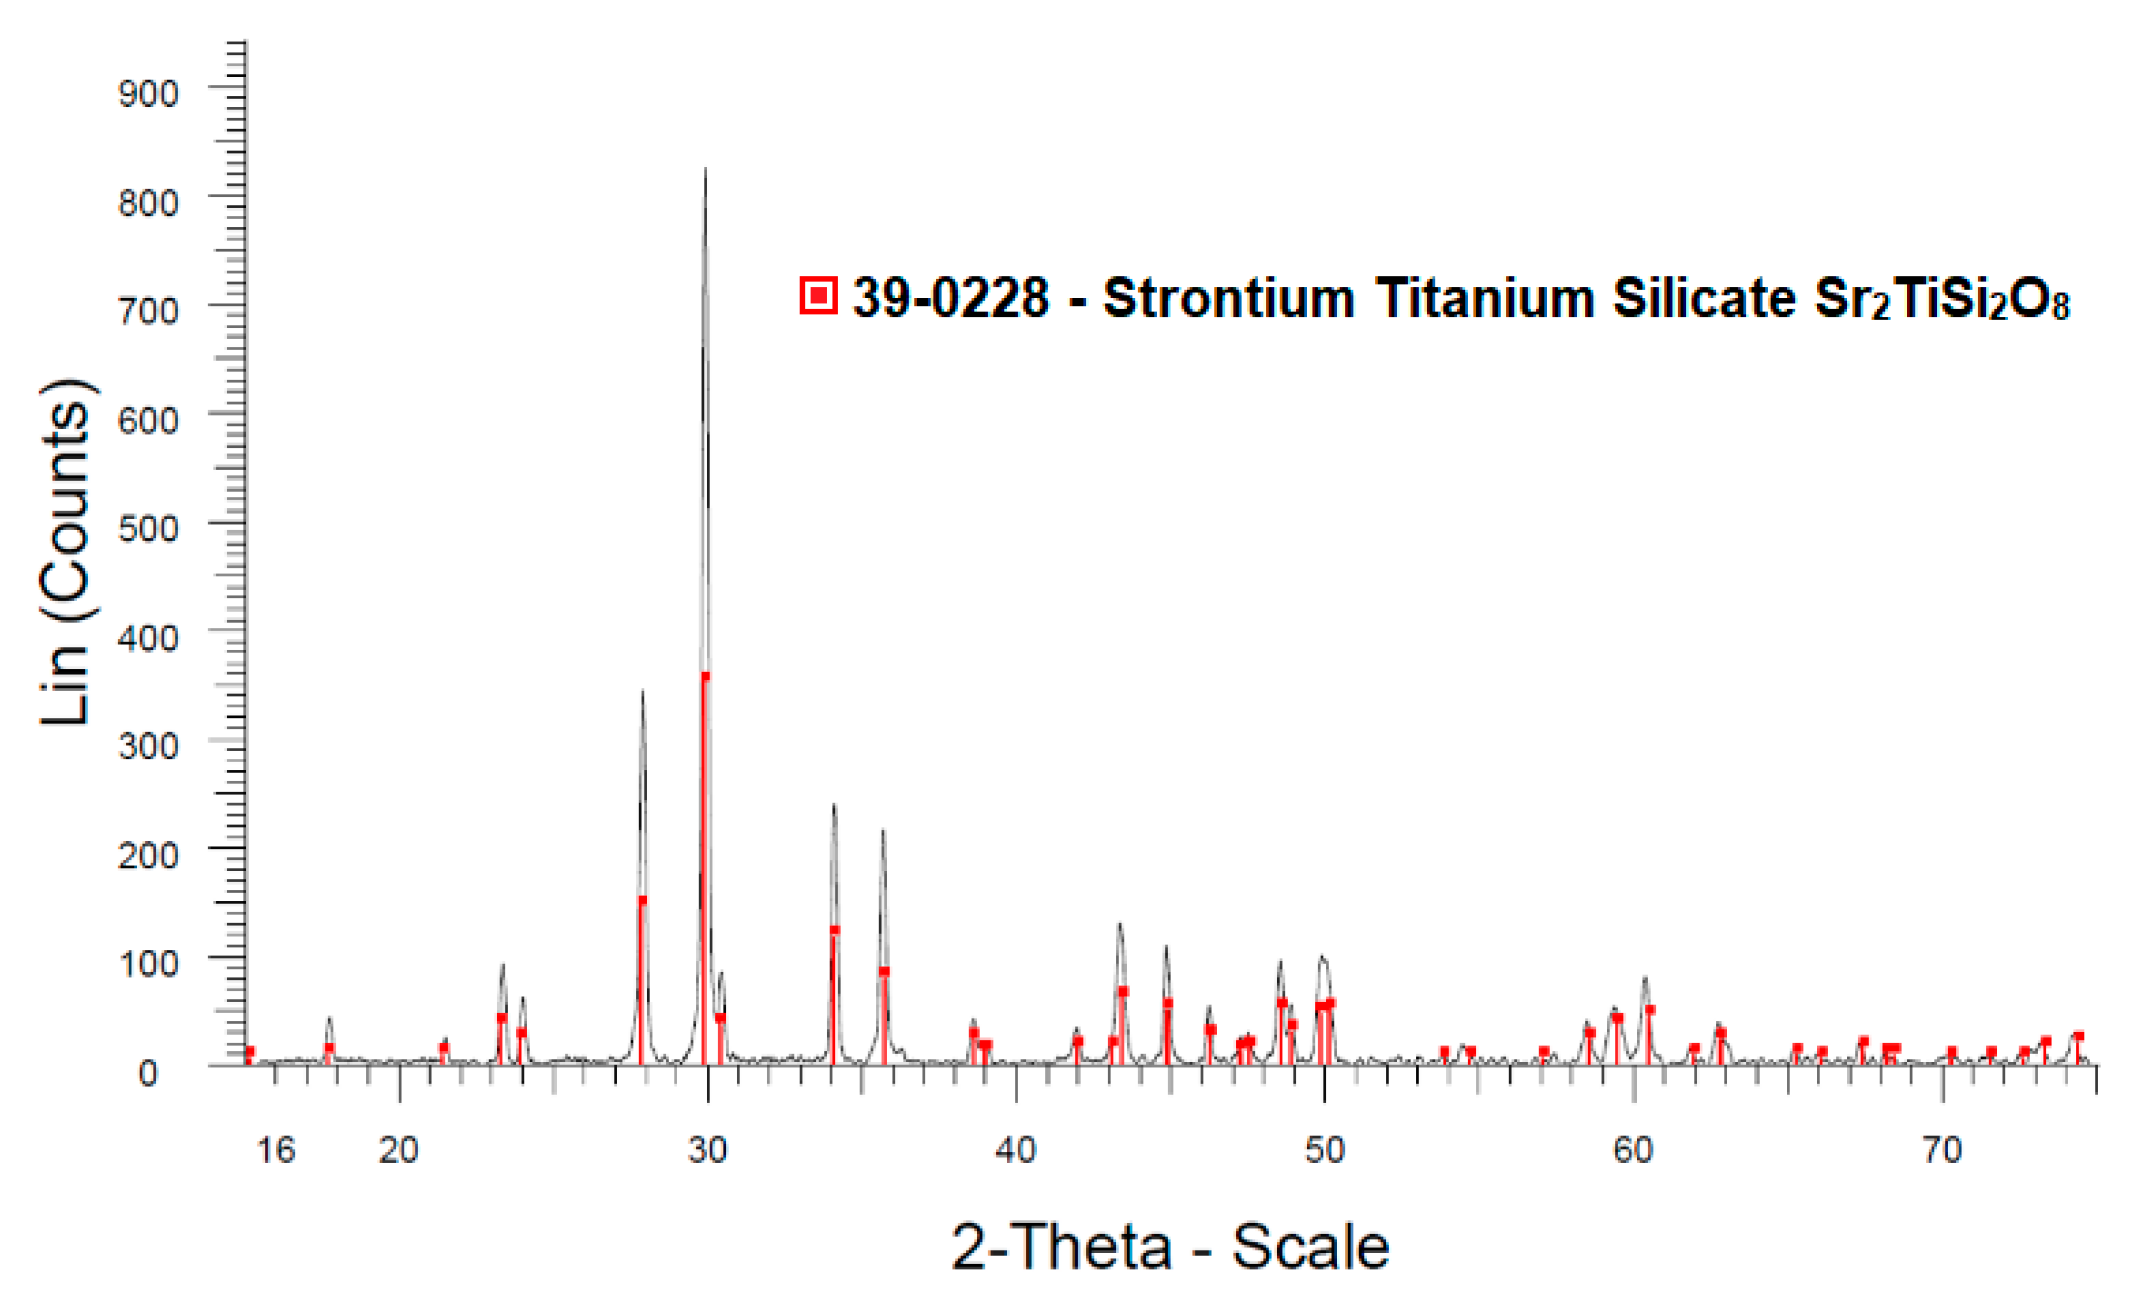
I(002) and I(211) are the diffraction peak intensities of the (002) and (211) planes respectively. According to the Sr2TiSi2O8 JCPDS card (no. 39-0228), (211) planes give the strongest peak for a non-textured fresnoite and (002) diffraction peak has a relative intensity of 22%. Consequently, preferential orientation of (002) plane parallel to the analyzed surface is evidenced if 0.18 < R(002) < 1. In order to follow changes in preferential orientation with depth, XRD analyses are performed at each 100 µm step of a step-by-step grinding (Figure 2). For some samples, pole figures are collected using the same XRD diffractometer. Note that the significant information depth of the X-rays in the glass-ceramic is about 10 µm, as calculated by the Absorb program from the Siemens–Bruker Diffrac AT software.
High temperature stability of the fresnoite crystals in the glass-ceramics is investigated by using a Bruker D8 DISCOVER θ-θ diffractometer equipped with a high-temperature chamber.
Microstructures are observed by means of a JEOL GSM 6100 SEM.
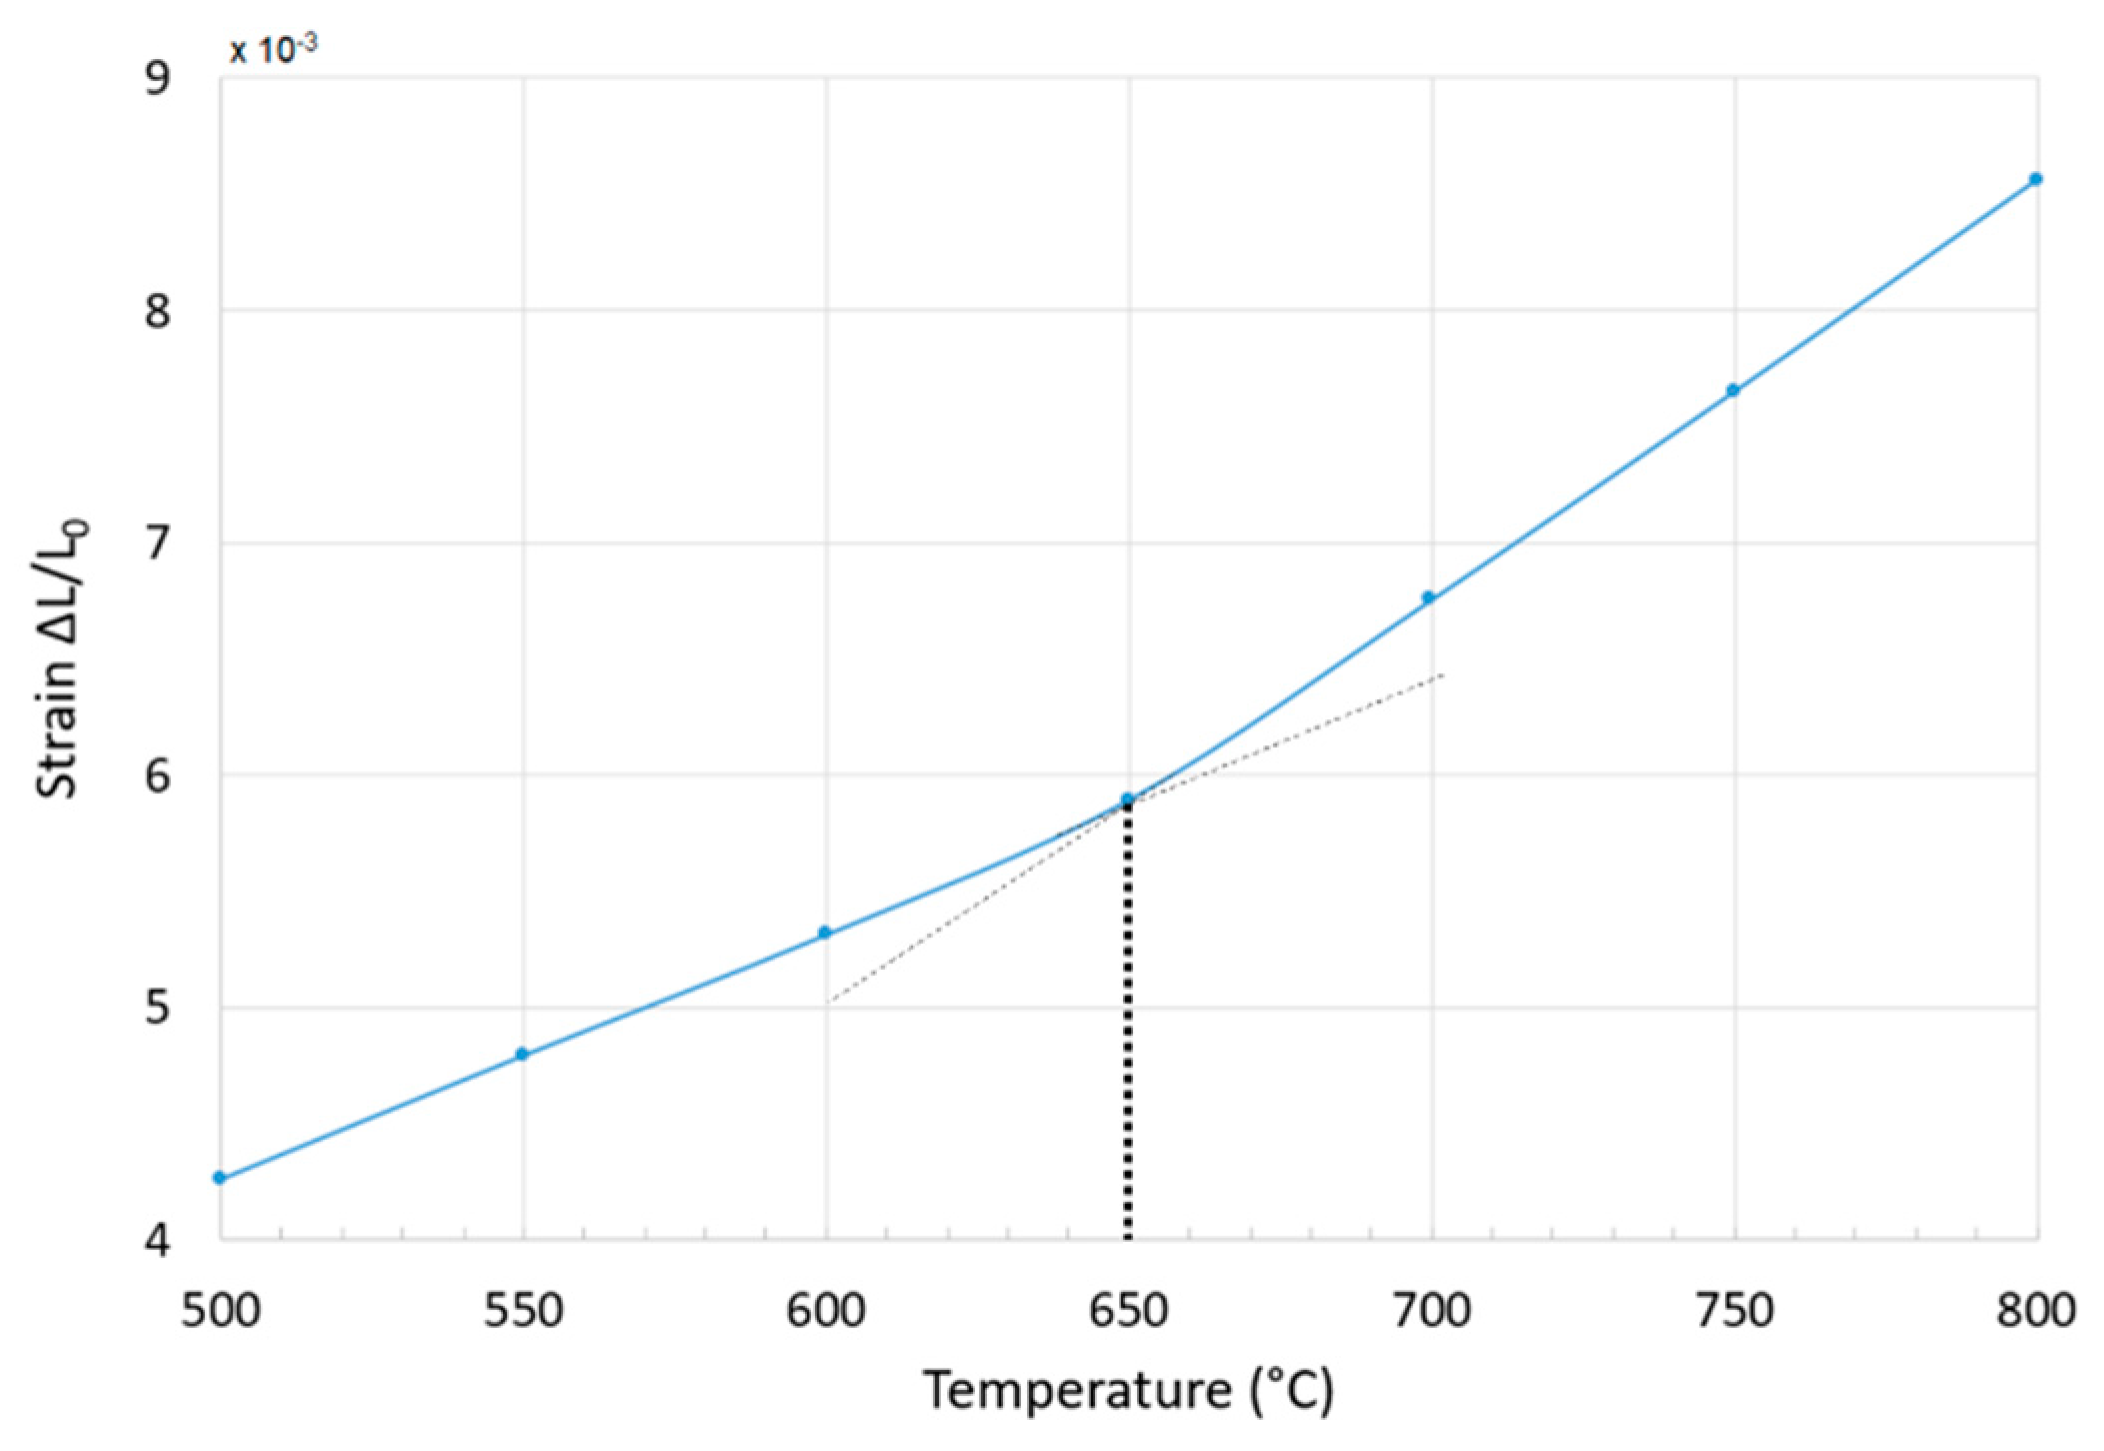
Glass transition temperatures (Tg) of parent glasses and residual glasses in the final glass-ceramics are obtained by dilatometry analyses performed with a horizontal dilatometer at a heating rate of 10 °C/min (Figure 3). The accuracy of the measurement is about ± 2 °C.
Parent glasses and glass-ceramics densities are calculated by Archimedes method in water, with specimens of about 10 g and using a 0.001g accurate scale. Each measurement is repeated three times on three specimens of the same type. The precision of the measurement is about ± 0.01 g/cm3.
The piezoelectric charge coefficient d33 is measured with PIEZOTEST PM 300 after each grinding step in order to draw the d33 curves versus the remaining thickness.
The evolution of elastic modulus E and internal friction (Q−1) of the glass-ceramic with temperature is followed by Impulse Excitation Technique (IET) using an IMCE equipment [19].
3. Results
3.1. Crystallization
Glass transition temperature and density of the parent glasses 2SrO 1TiO2 3.3SiO2 0.2K2O yAl2O3 are given in Table 1. There is a weak influence of the alumina content, probably due to the low Al/Si ratios (Table 1).
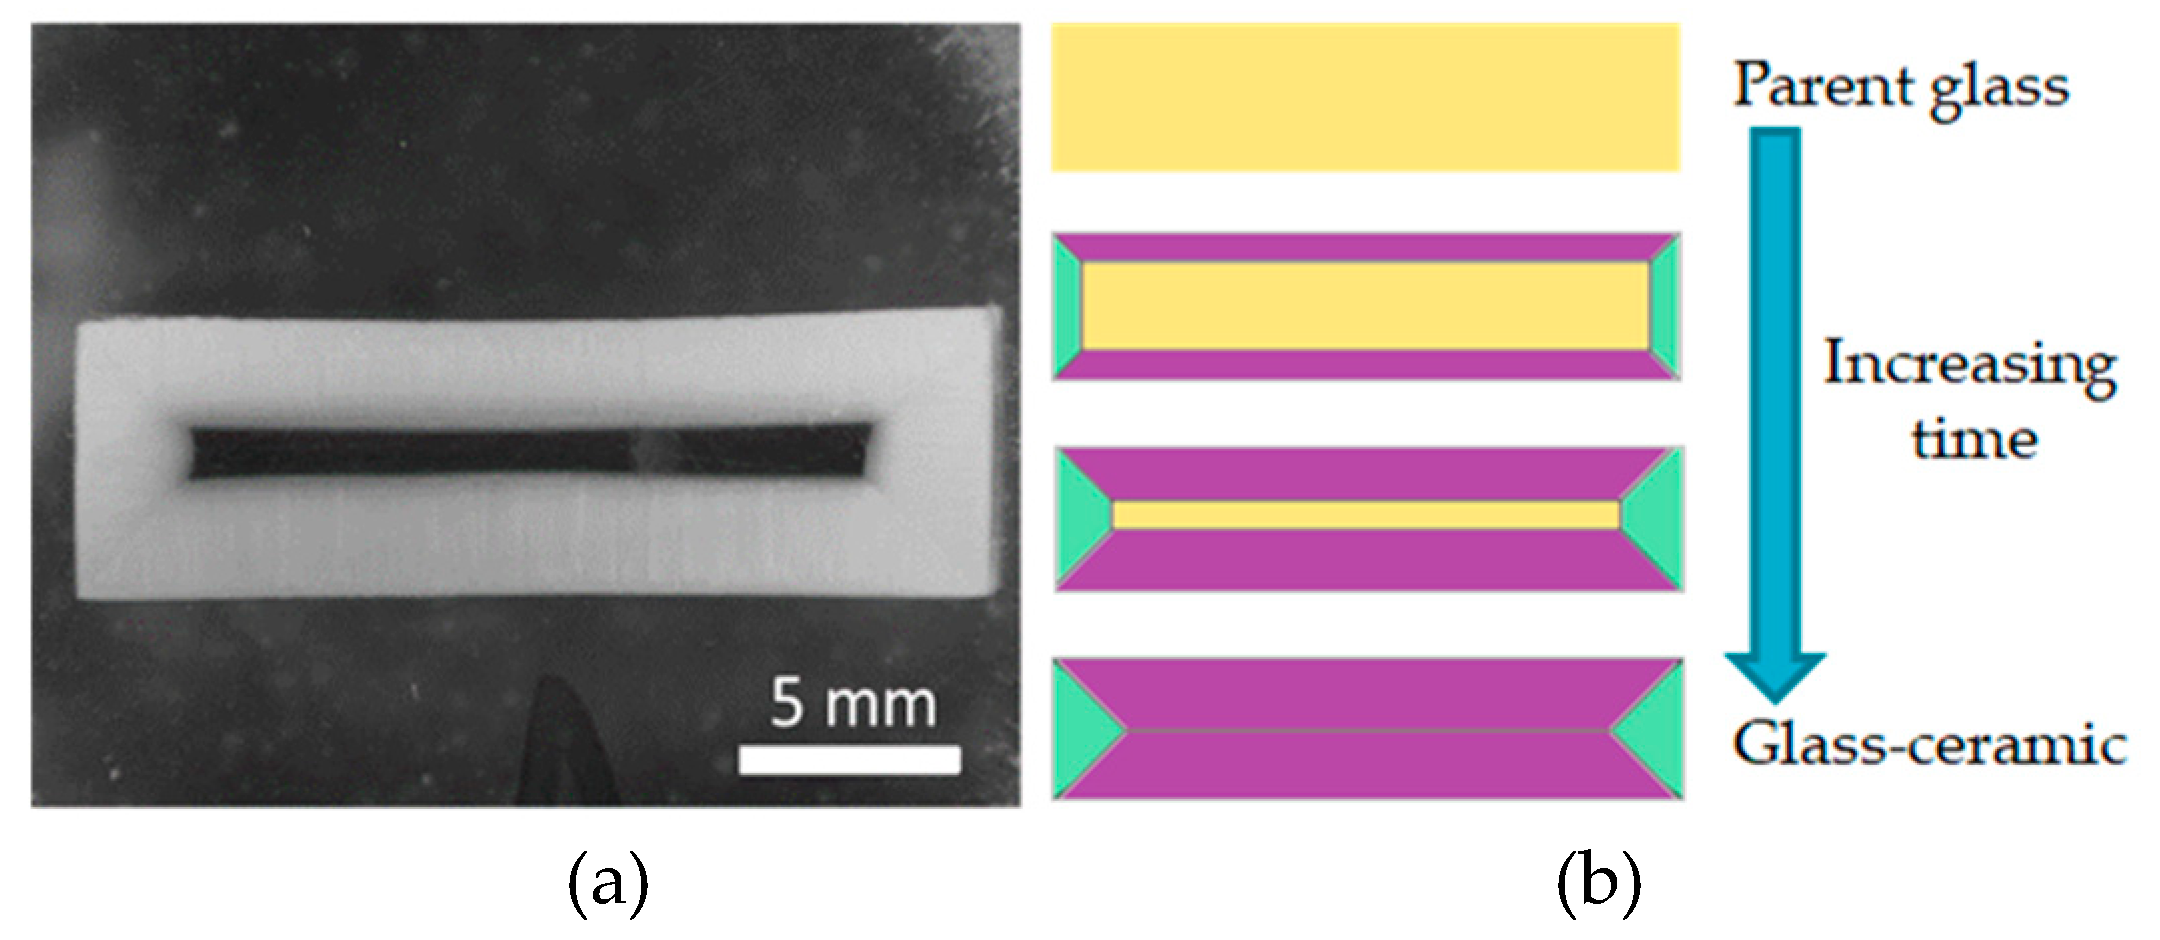
Crystallization treatments were performed for various dwell times at temperatures of 850 °C, 900 °C and 950 °C. For all temperatures and compositions, crystallization starts from the surfaces and propagates in depth over time (Figure 4). The speed of the crystallization front is mainly influenced by temperature (Table 2). However, an increase in alumina content tends to slow it down.
For all compositions, glass-ceramics fully crystallized from the surfaces to the center were prepared by applying dwell times of 50 h, 15 h and 3 h for temperatures of 850 °C, 900 °C and 950 °C respectively. XRD analyses performed on powder specimens of the obtained glass-ceramics evidence the presence of Sr-fresnoite as the only crystalline phase (Figure 5).
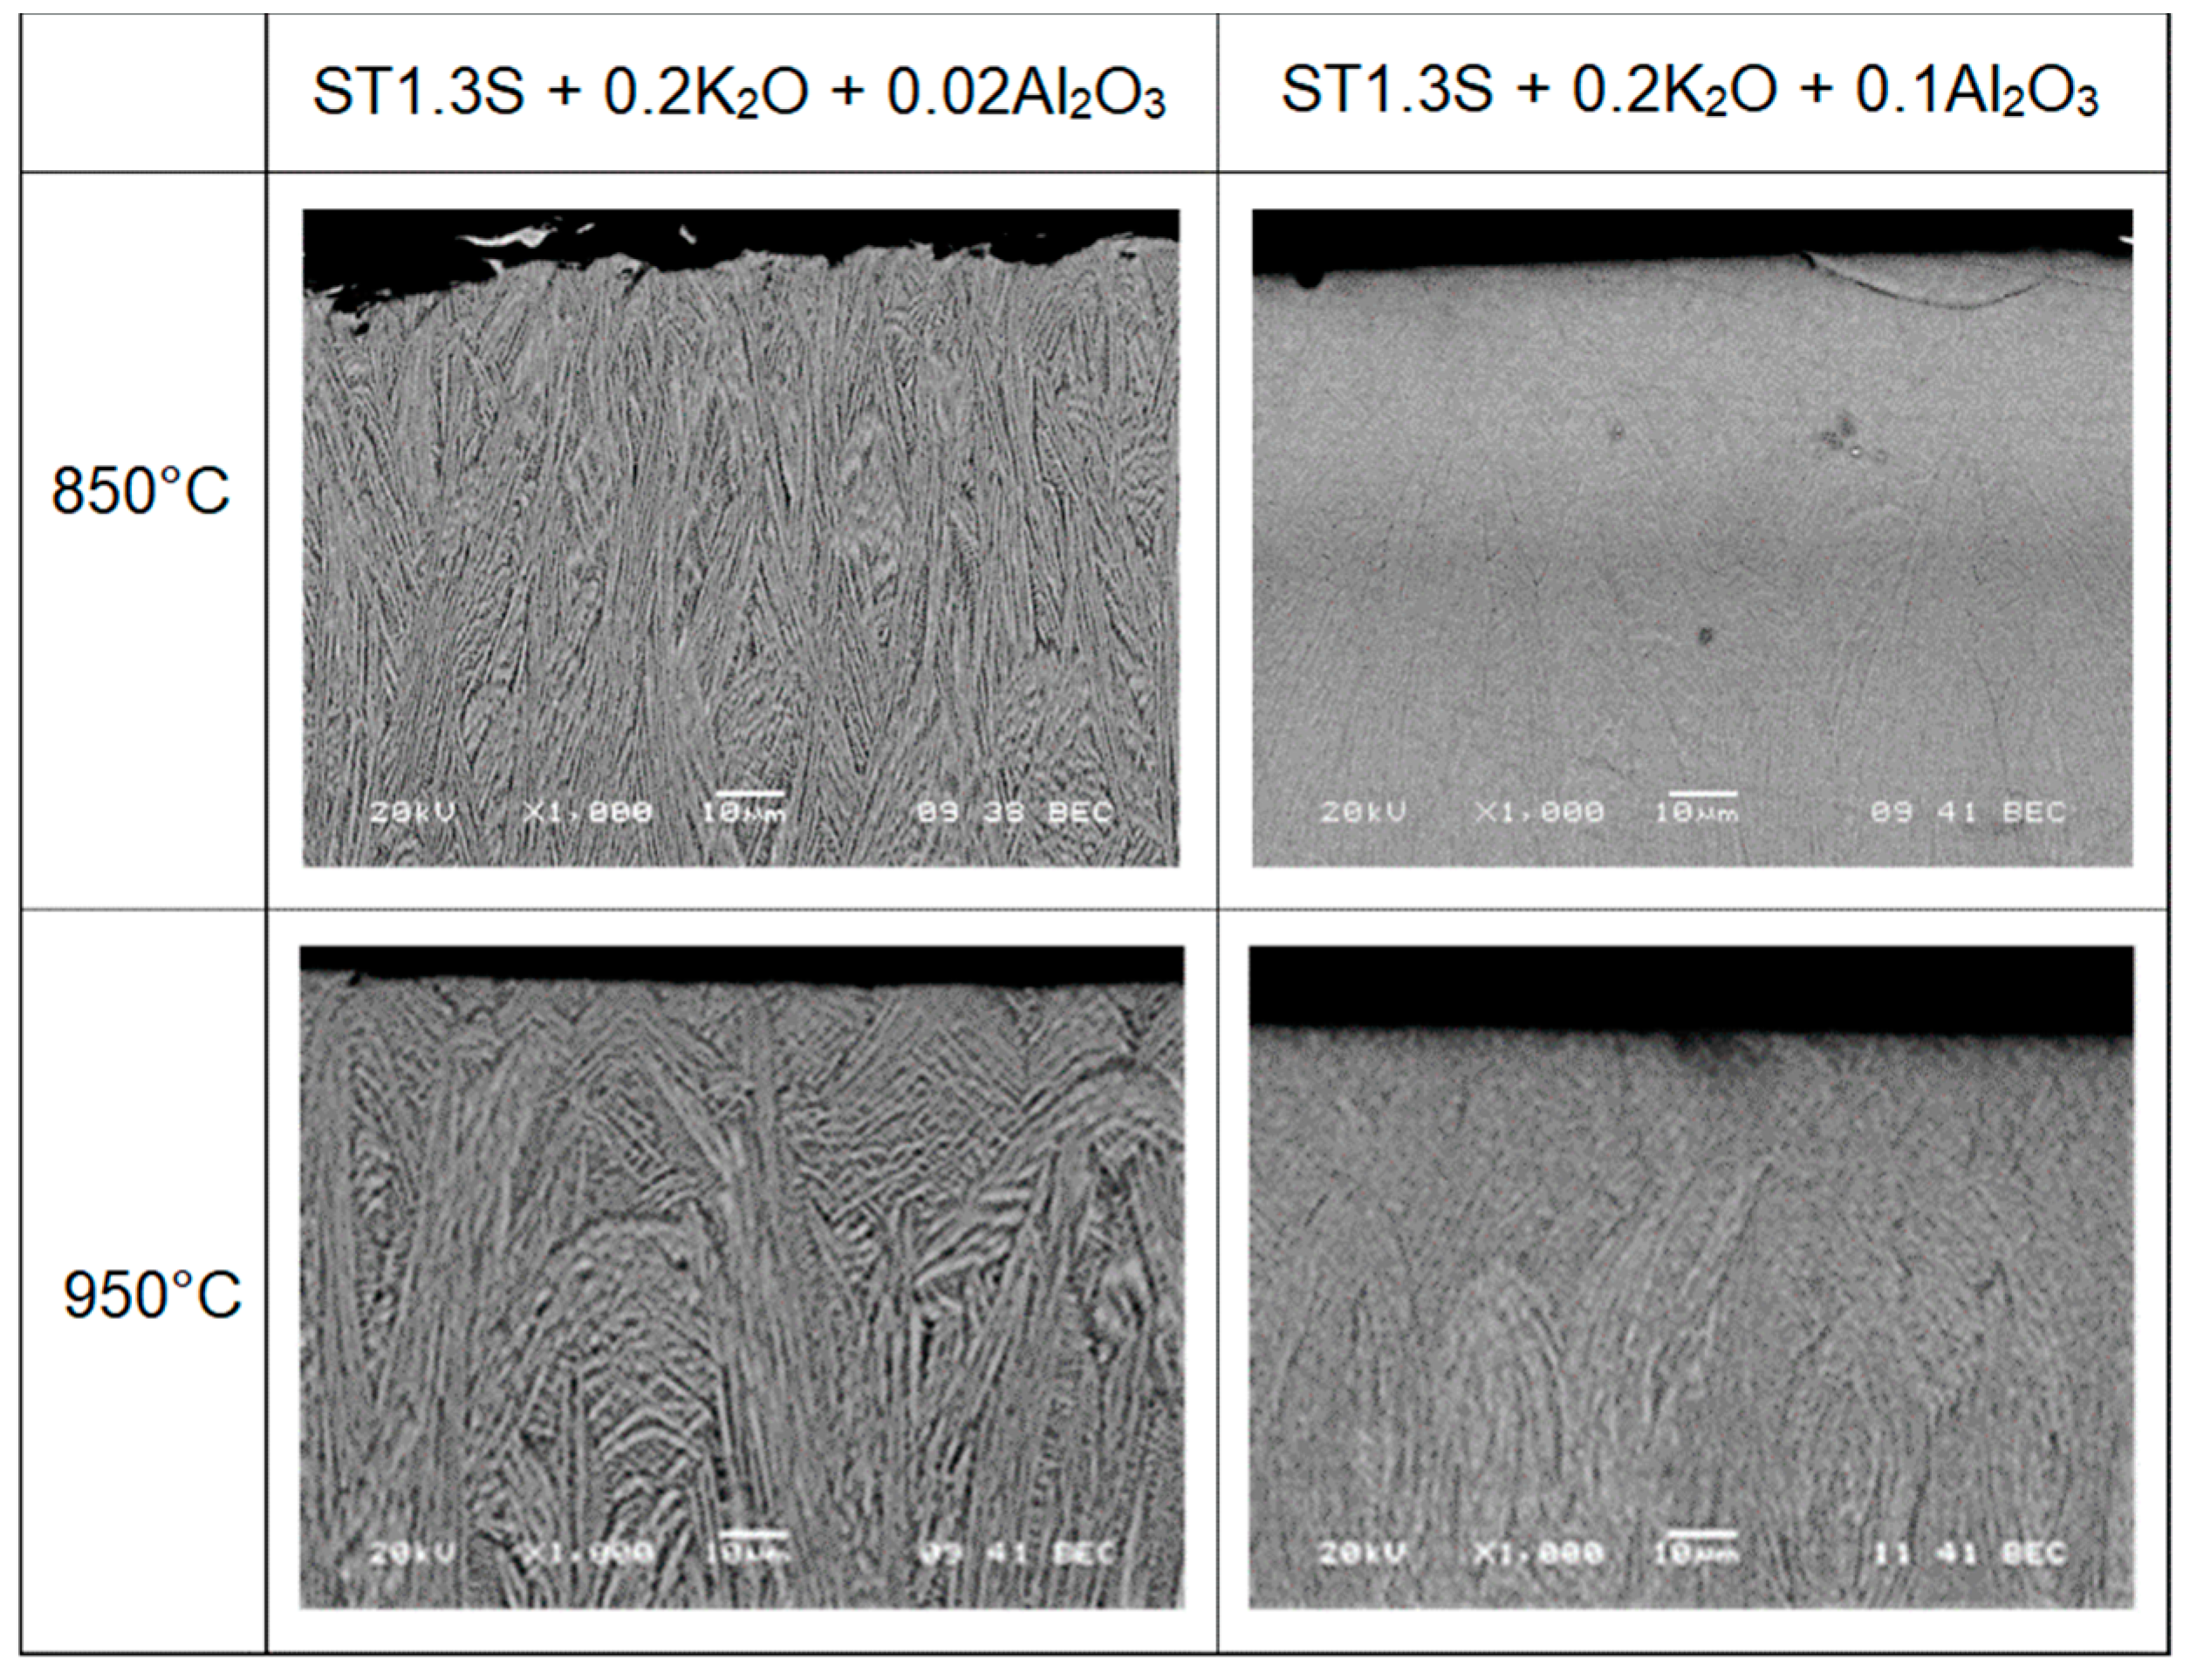
SEM cross sections of glass-ceramics ST1.3S + 0.2K2O + 0.02Al2O3 and ST1.3S + 0.2K2O + 0.1Al2O3 both crystallized at 850 °C and 950 °C are shown in Figure 6. Fresnoite crystals, which contain the heavier elements (Sr, Ti), can be associated to the bright phase whereas the residual glass appears dark. A rise in temperature leads to a coarser microstructure. On the contrary, an increasing alumina content refines the microstructure.
Mass and volume fraction of the residual glass have been evaluated. Assuming all the Sr and Ti atoms are in the fresnoite crystals, the residual glass composition is 1.3SiO2 0.2K2O yAl2O3. In that case, the weight fraction of this residual glass, mrg, increases from 19.2 wt% to 21.6 wt% with the increasing amount of Al2O3 (Table 3).
Calculation of the volume fractions requires the knowledge of the residual glasses densities. Theoretical values are calculated using A. Fluegel’s model, with a claimed precision of ±2 g/cm3 [20]. To validate theses theoretical values, a glass composed of 1.3SiO2 0.2K2O 0.1Al2O3, corresponding to the residual glass of glass-ceramics ST1.3S + 0.2K2O + 0.1Al2O3, has been synthesized. The density of this glass, experimentally measured by Archimedes’ method, is 2.34 ± 0.01 g/cm3, which is in agreement with the theoretical value (2.35 ± 0.02 g/cm3). Using the calculated data, volume fractions of all residual glasses vrg range between 28.4 ± 0.3 and 31.1 ± 0.3 vol% depending on the amount of alumina. Finally, glass-ceramics densities, ρgc, experimentally measured by Archimedes method, are compared to theoretical densities, ρth, calculated by the relation:
ρth = vrg·ρrg + (1 − vrg)·ρfresnoite
Theoretical and experimental densities are in very good agreement (Table 3).
Eventually, the glass transition temperature of the residual glasses was measured by dilatometry on the glass-ceramics (Table 3). Values of Tg are lower than those of the corresponding parent glasses due to the higher K2O/SiO2 ratio, and they clearly increase with the alumina content which acts as a glass former.
3.2. Preferential Orientation
XRD patterns have been collected on the surface after a 0.3-mm grinding for all glass-ceramics. From these patterns, preferential orientation of (00l) planes is highlighted by the calculation of the R(002) coefficient (Table 4). All parent glass compositions and crystallization temperatures lead to specimens showing a strong (00l) orientation at their surfaces (R(002) close to 1). Only a few specimens keep this orientation in depth. This is the case for compositions ST1.3S + 0.2K2O + 0.1Al2O3 and ST1.3S + 0.2K2O + 0.15Al2O3 crystallized either at 850 °C or 900 °C. This phenomenon is also observed in References [21] and [22].
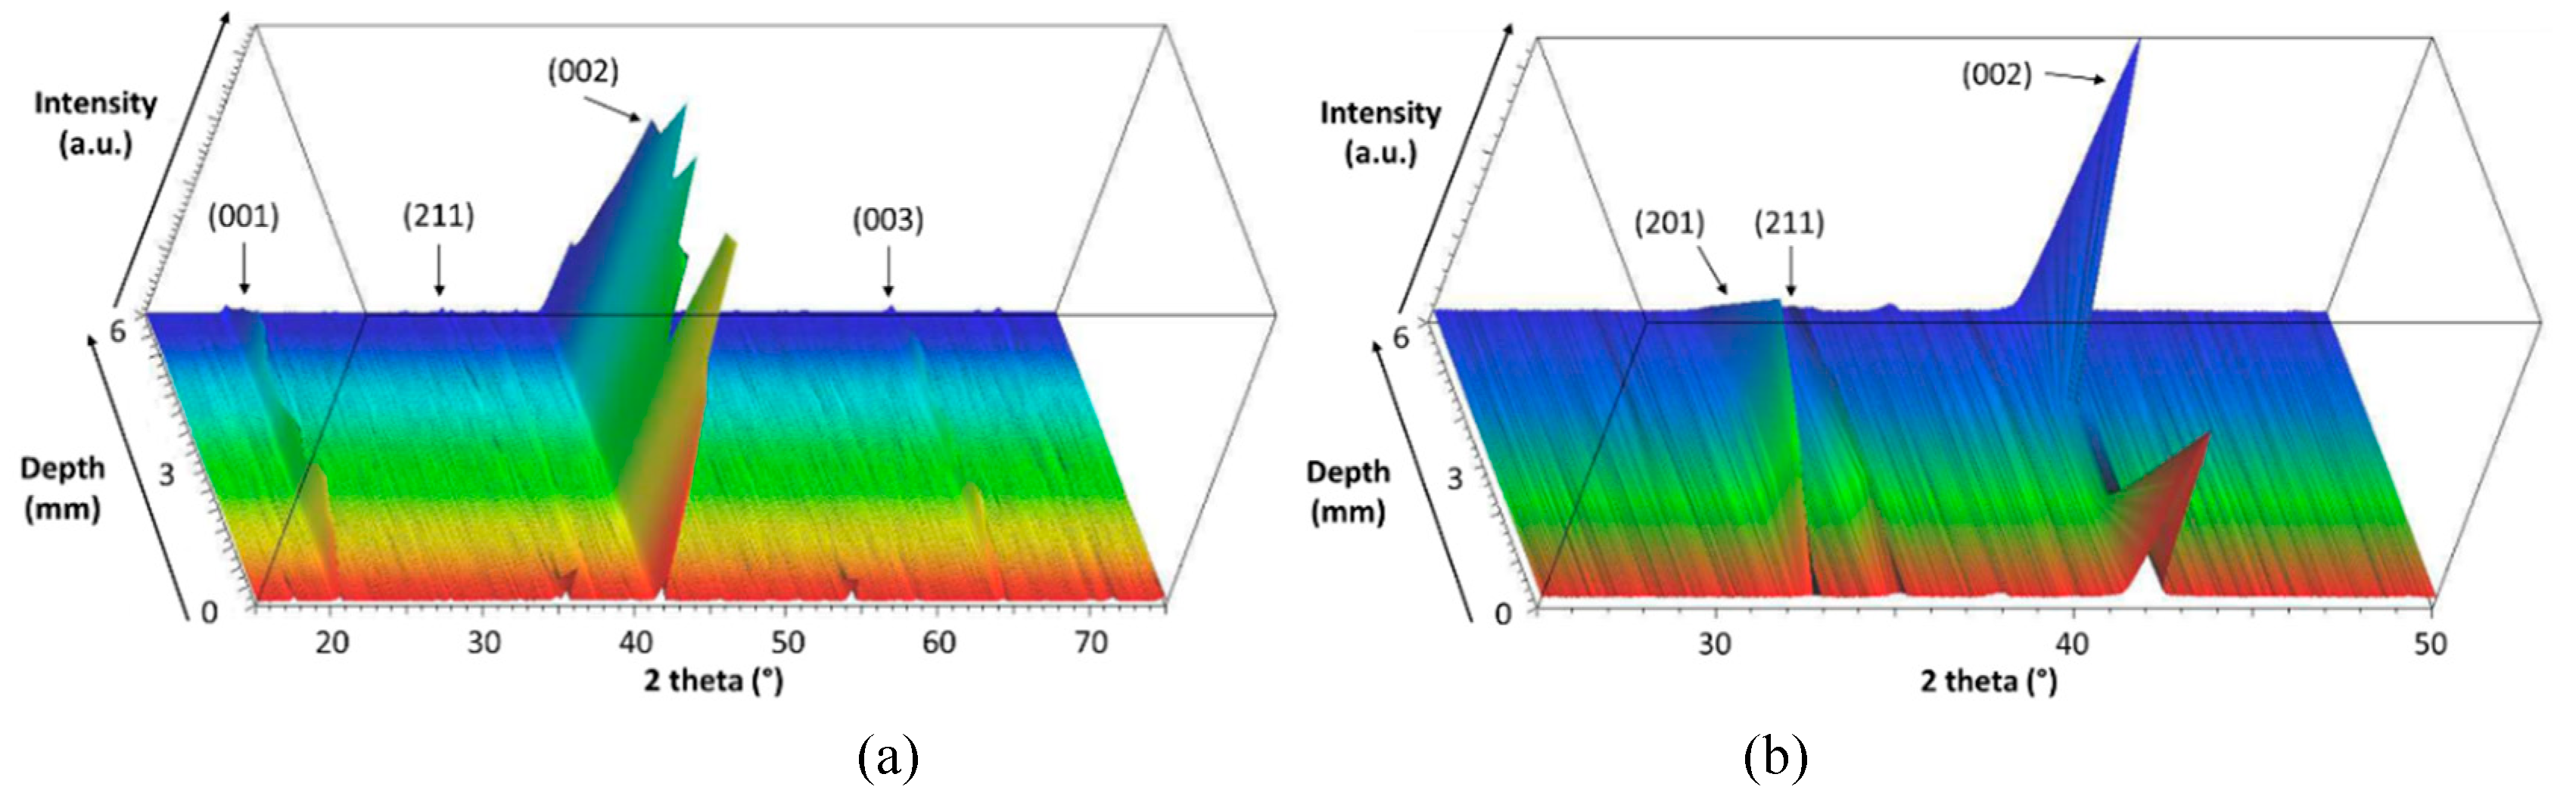
Next to these results, several specimens of ST1.3S + 0.2K2O + 0.1Al2O3 glass-ceramics, crystallized at 900 °C, were analyzed by XRD at each step of a step-by-step grinding from the surface to the center. This composition is chosen for further analyses because it shows the best orientation factor and a sufficient crystallization speed. These analyses highlight two different cases:
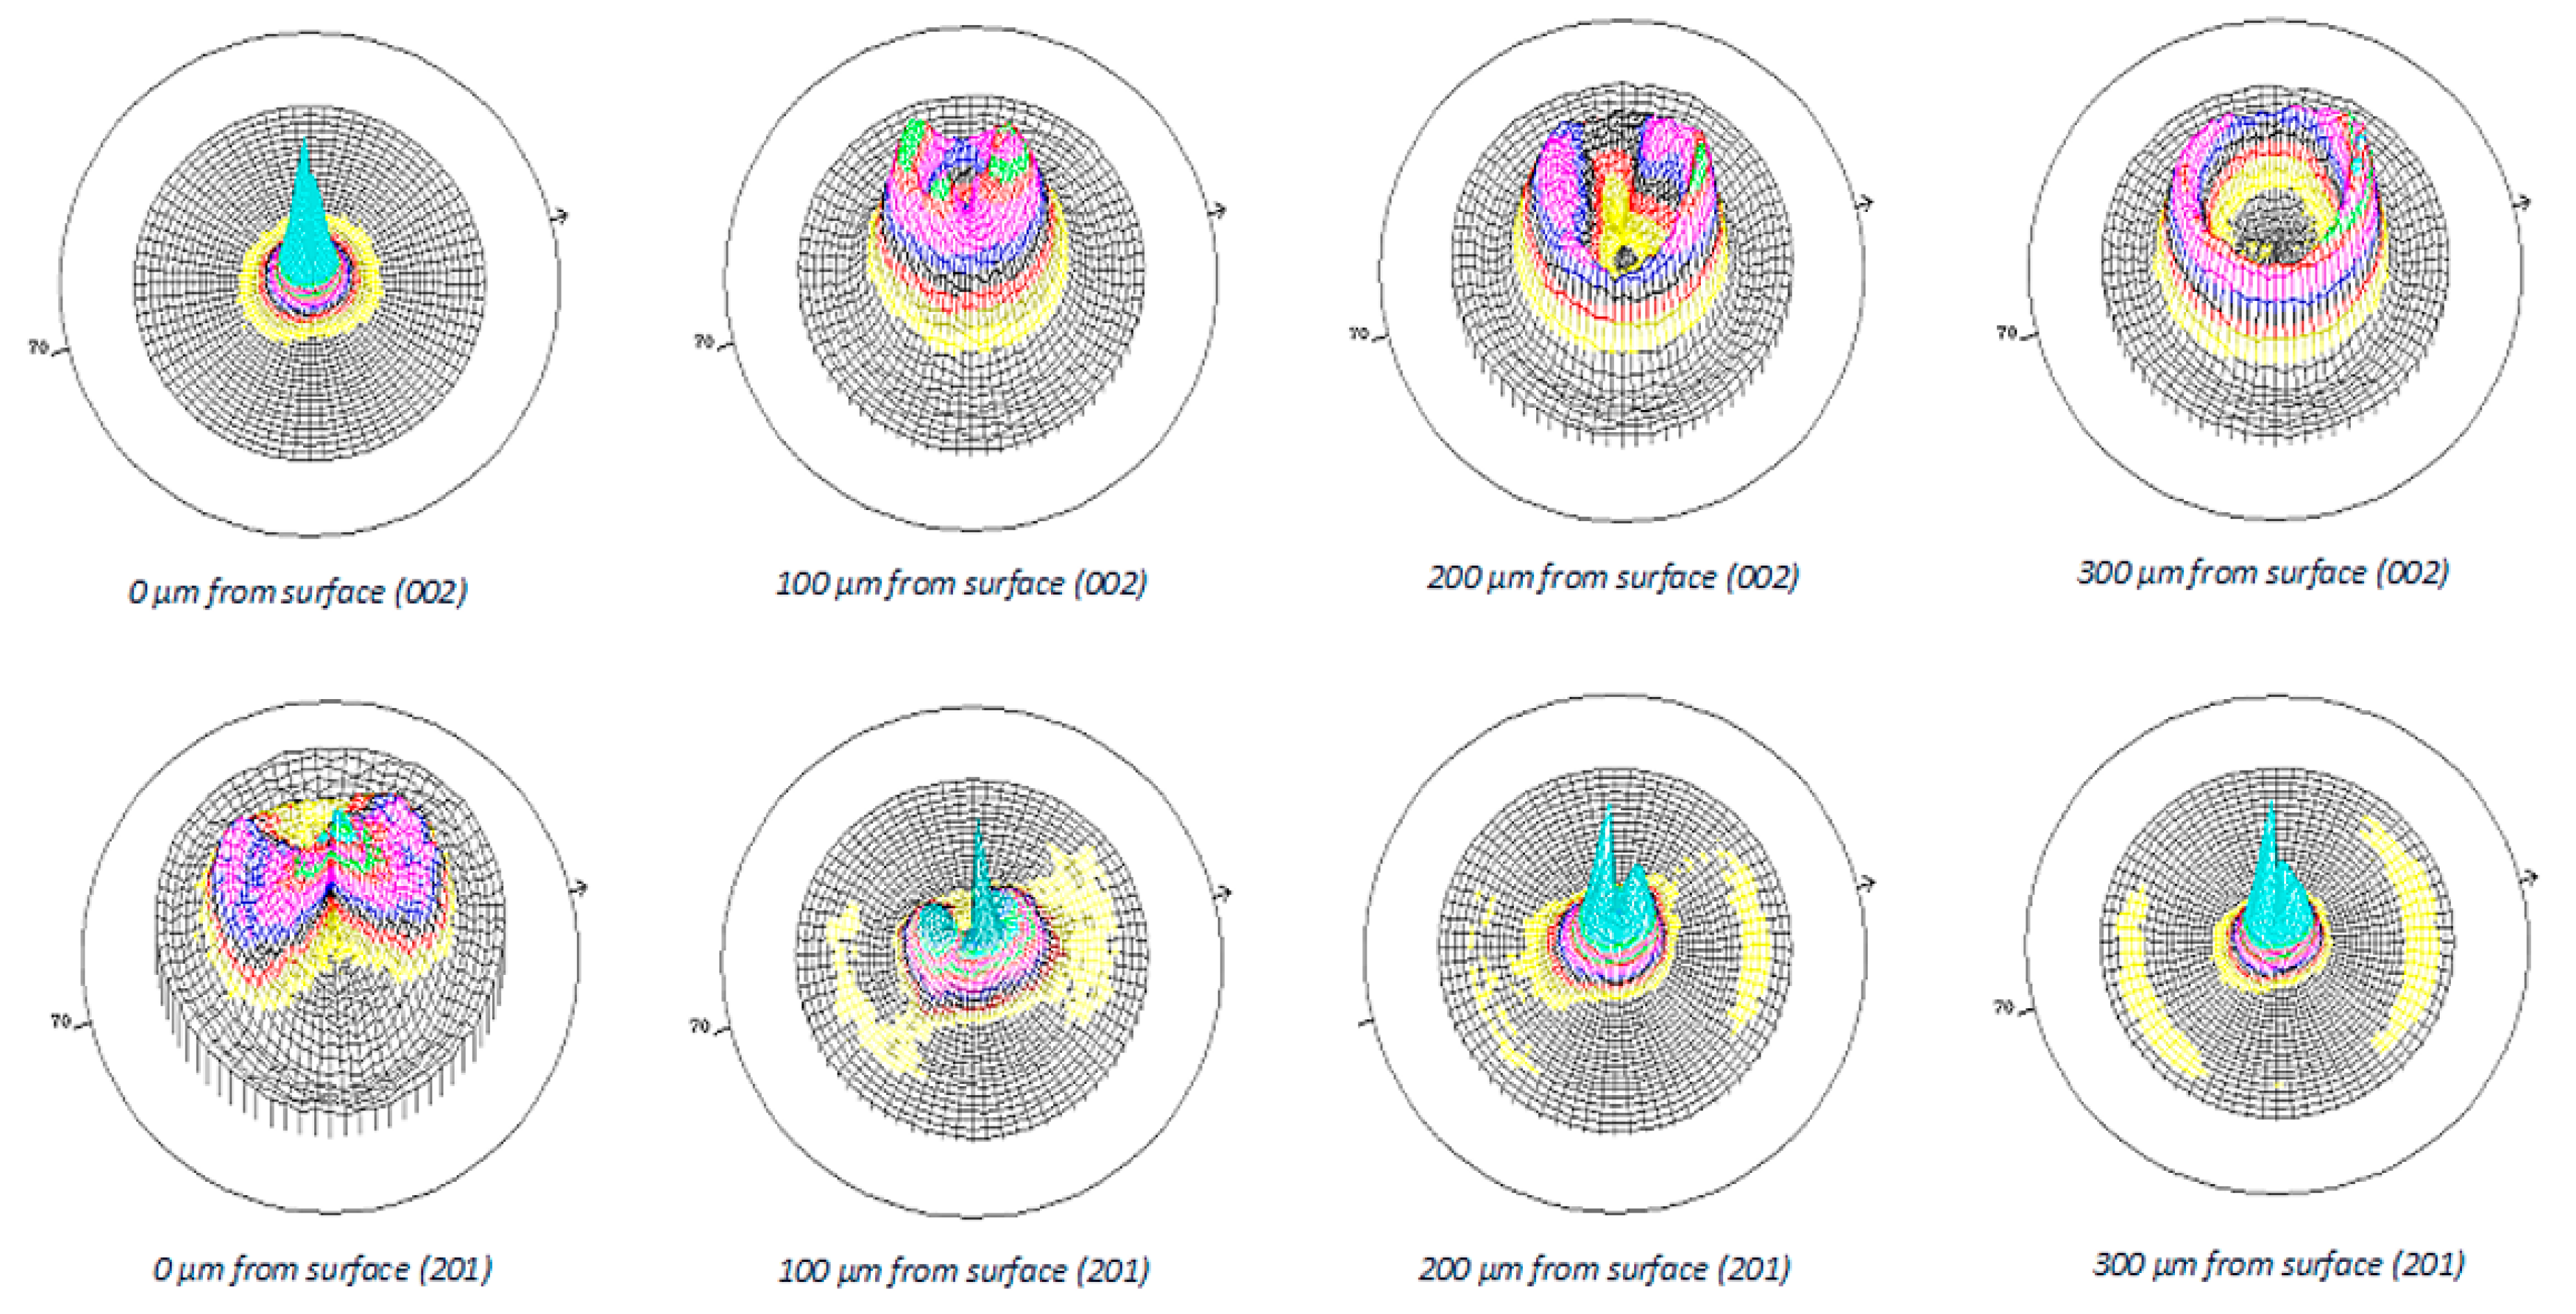
For case B, pole figures of (002) and (201) planes were collected after each grinding step. They show a progressive tilt of the (002) planes over the first 300 µm (Figure 8). After 300 µm, (201) planes seem to become parallel to the surfaces and no more changes are observed deeper in the samples. Patschger et al. also observed this tilt in glass-ceramics obtained from parent glass composition ST0.75S [23]. However, careful analysis of orientation changes must be further realized by EBSD.
3.3. Piezoelectric Properties
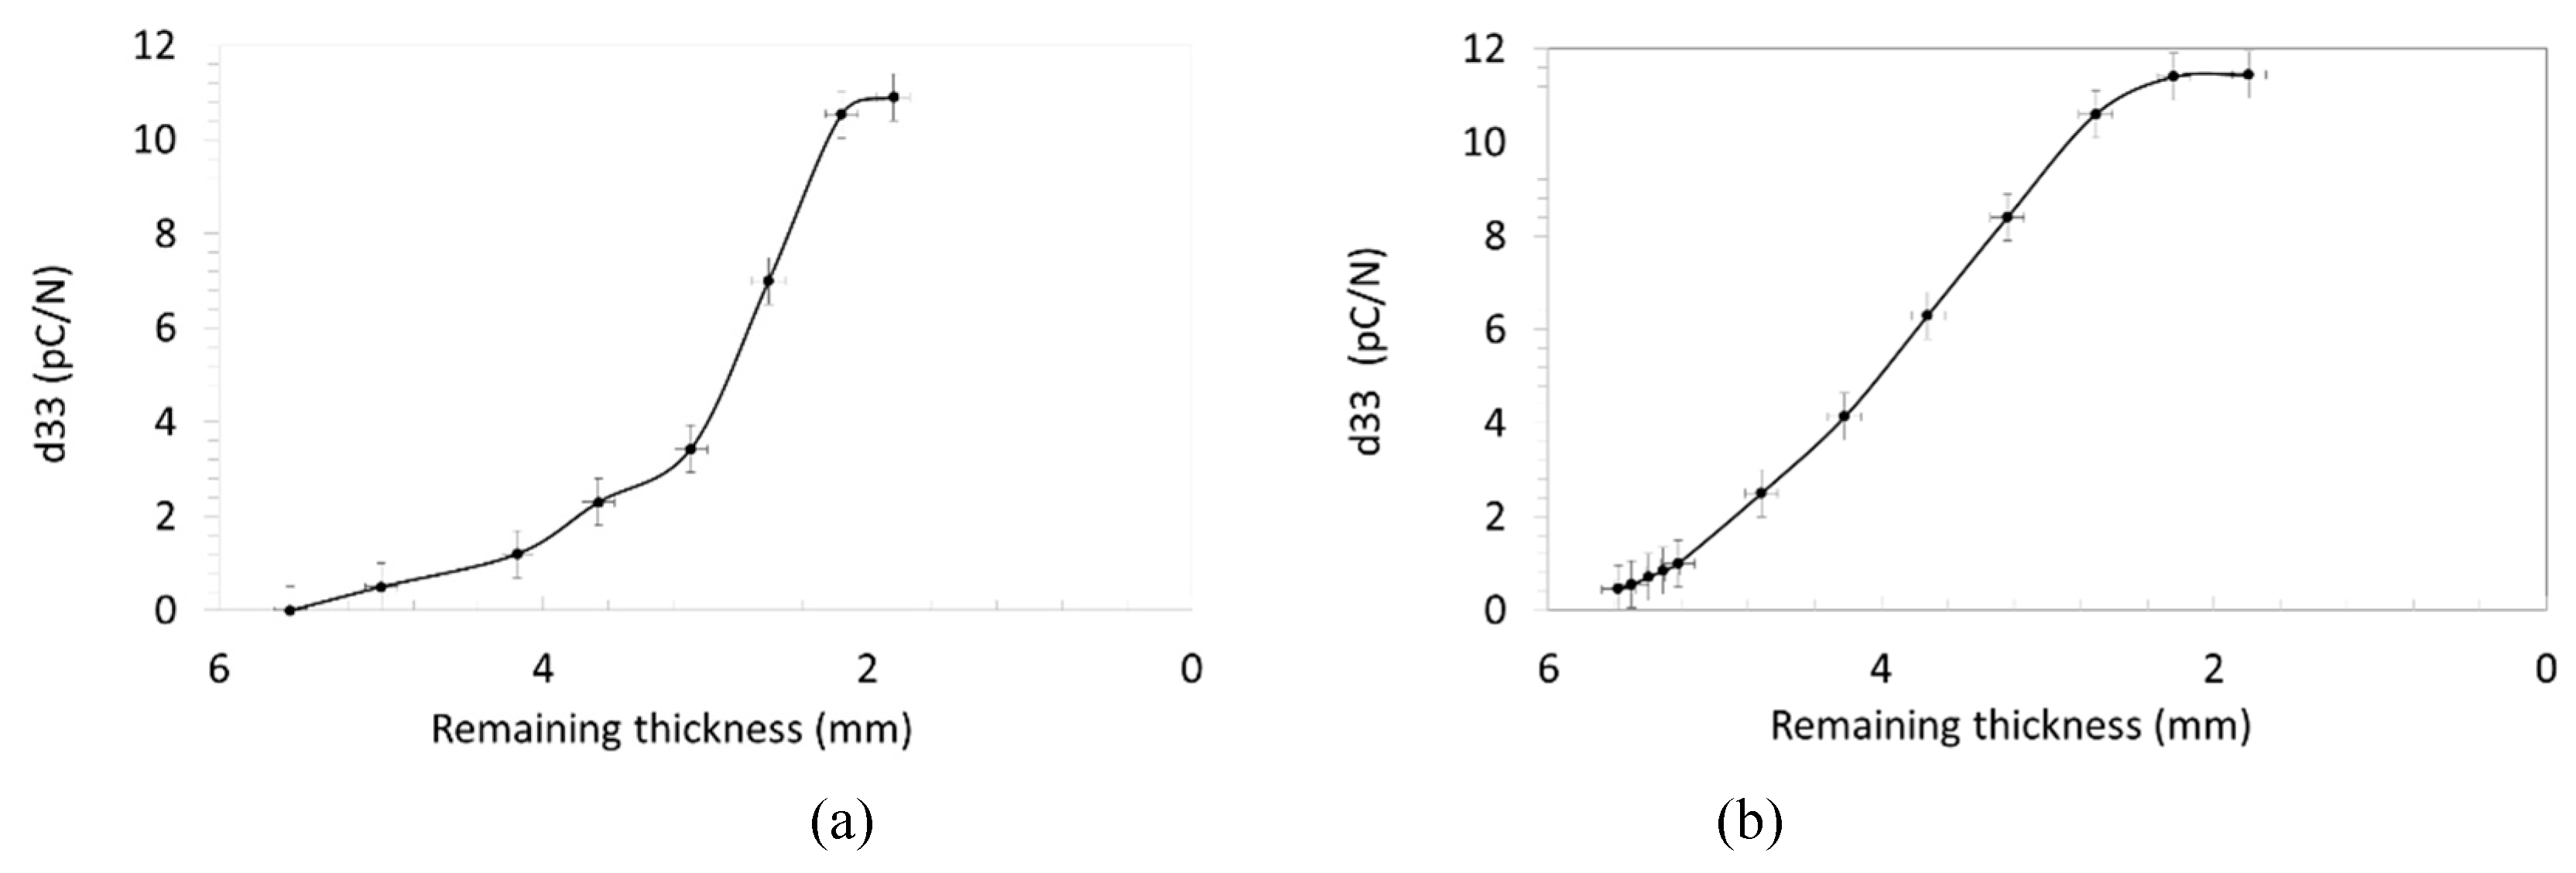
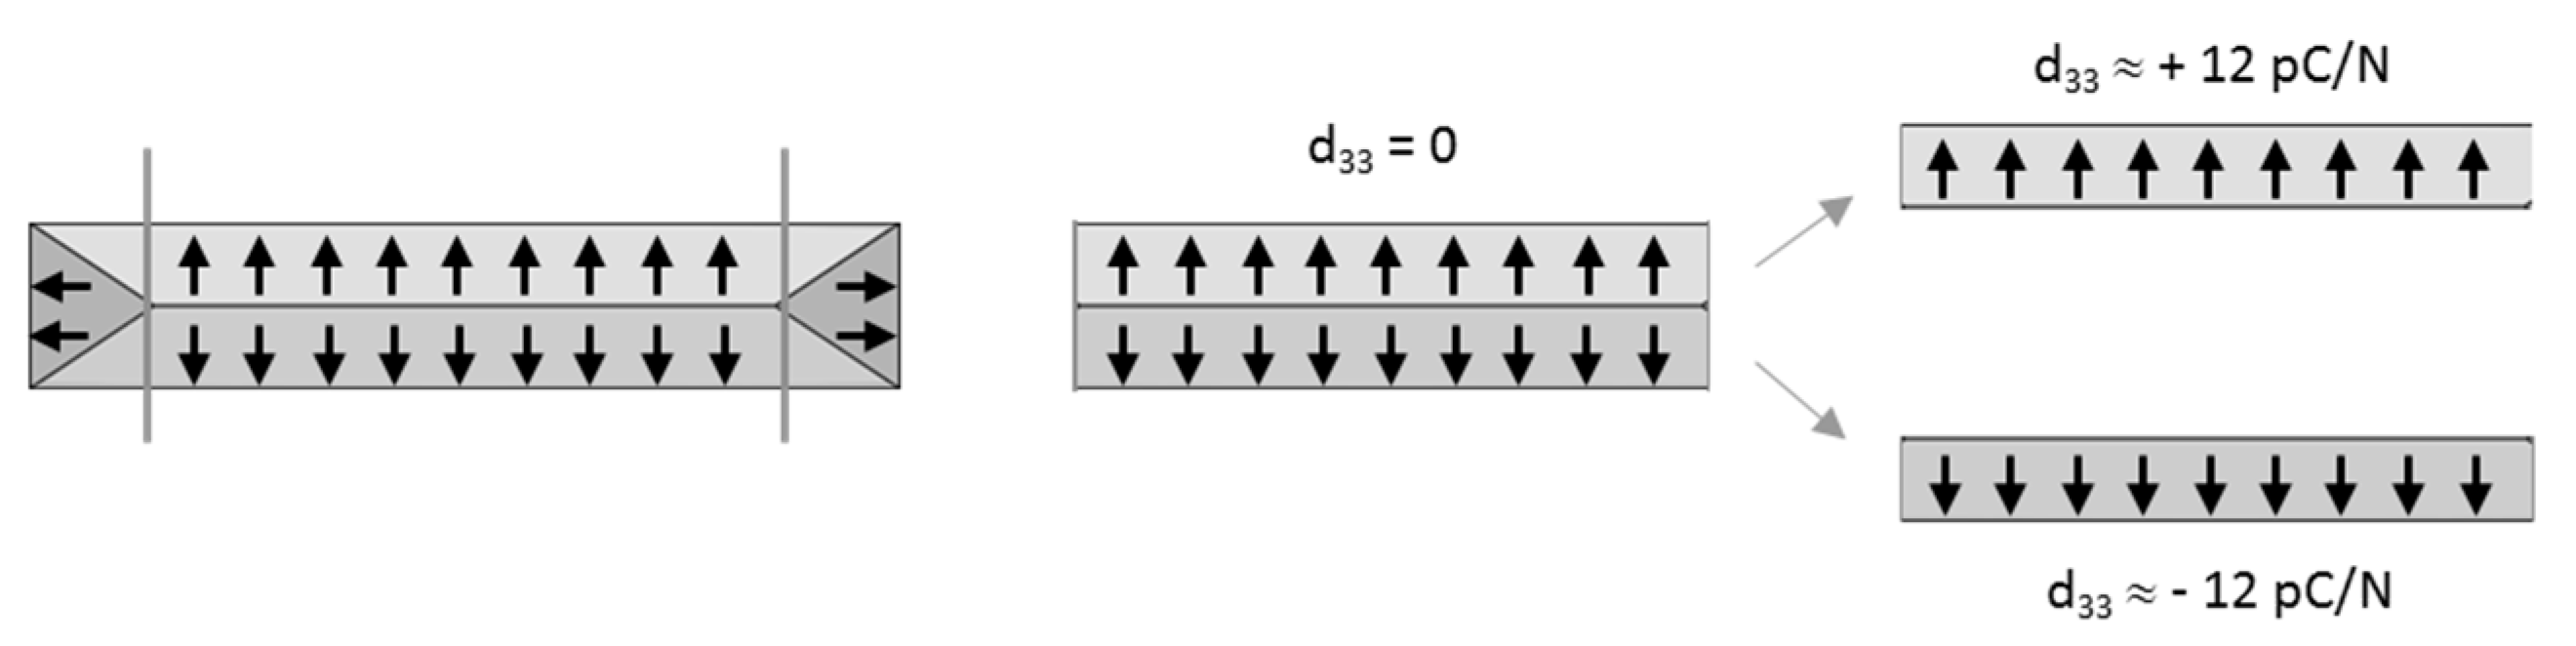
The piezoelectric coefficient d33 was measured on the previous ST1.3S + 0.2K2O + 0.1Al2O3 specimens after each step of grinding. Both cases of orientation lead to the same variation of d33 versus remaining thickness (Figure 9). Before grinding, samples exhibit a d33 close to zero. The value of d33 increases progressively during the grinding until it reaches a plateau at ±12 pC/N when half of the initial thickness is removed (more or less 3 mm). This result can be explained by assuming that the symmetry of the crystallization induces a mirror symmetry in the orientation of the dipolar moments (Figure 10) [24]. In order to confirm this, piezoelectric charge coefficient d33 has been measured for both halves of a sample cut following its middle plane. The two half-samples exhibit near the same d33 in absolute value but with the opposite sign.
3.4. Stability at High Temperatures of ST1.3S + 0.2K2O + 0.1Al2O3 Glass-Ceramic
As mentioned in the introduction, the interest of using non-ferroelectric piezoelectric materials is mainly due to their stability at high temperatures. In order to evaluate the potential of the ST1.3S + 0.2K2O + 0.1Al2O3 glass-ceramics for high temperature applications, their mechanical and structural stabilities have been investigated by HT-XRD and IET.
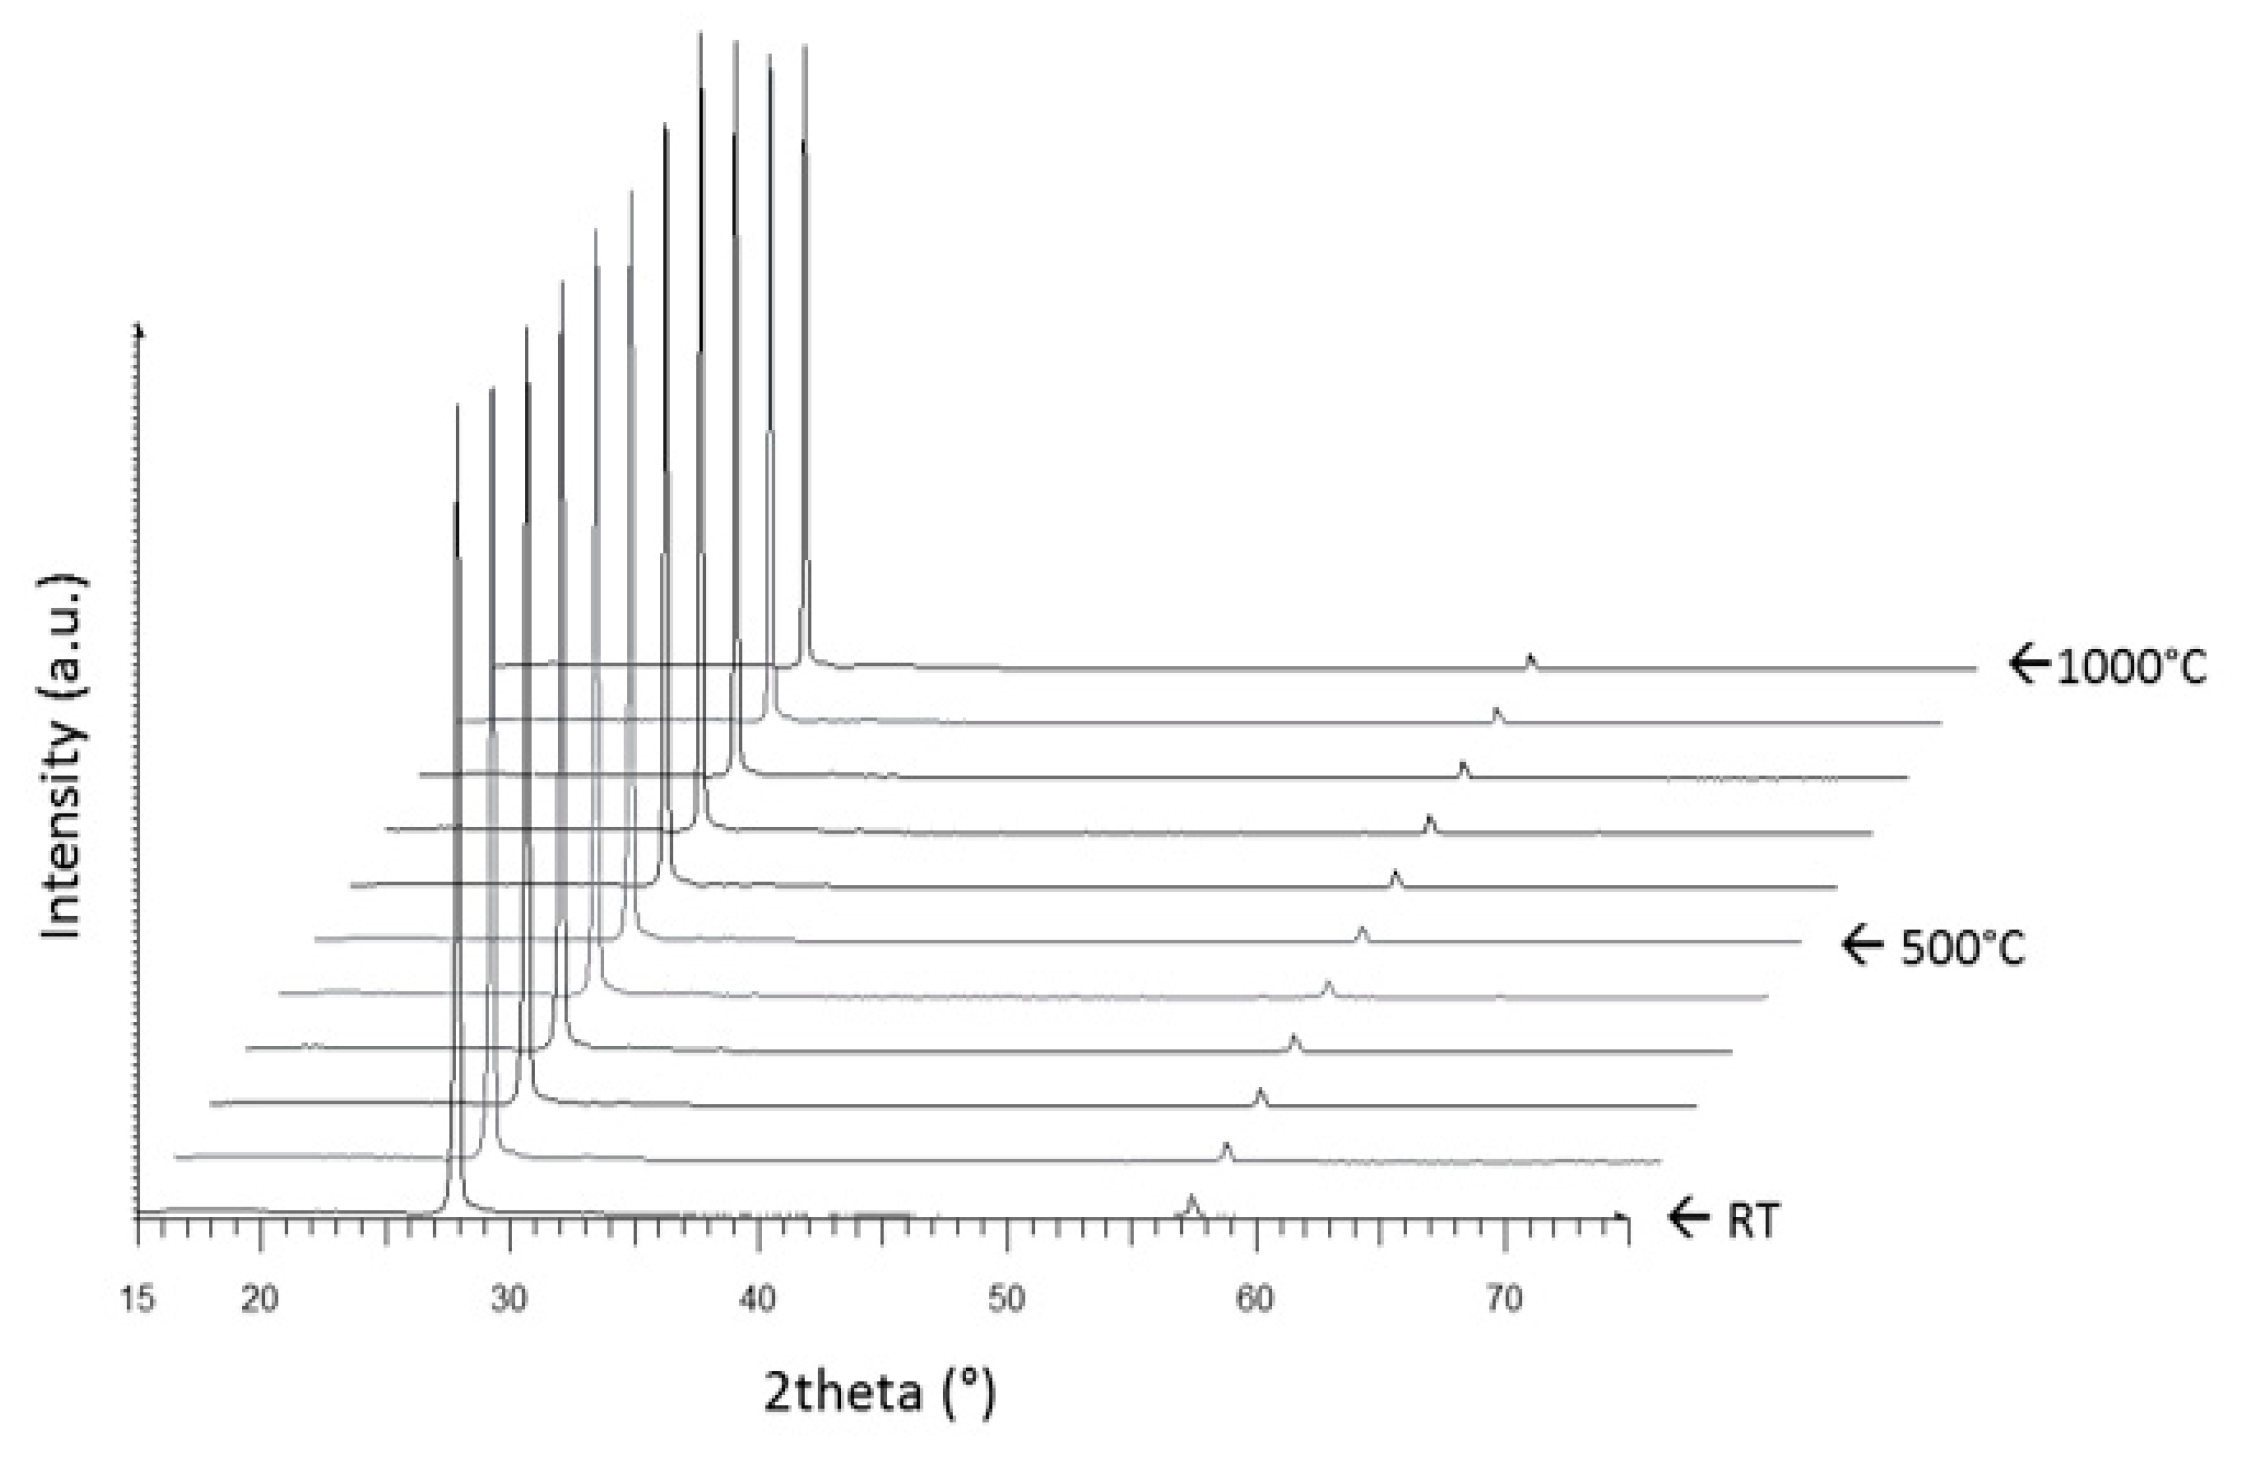
HT-XRD patterns have been collected every 100 °C from room temperature up to 1000 °C (Figure 11). They show the stability of fresnoite in the glass-ceramic over this temperature range. A heating treatment realized at 1200°C resulted in a partial thermal decomposition and then a flowing of the sample due to the increase of the silica amount.
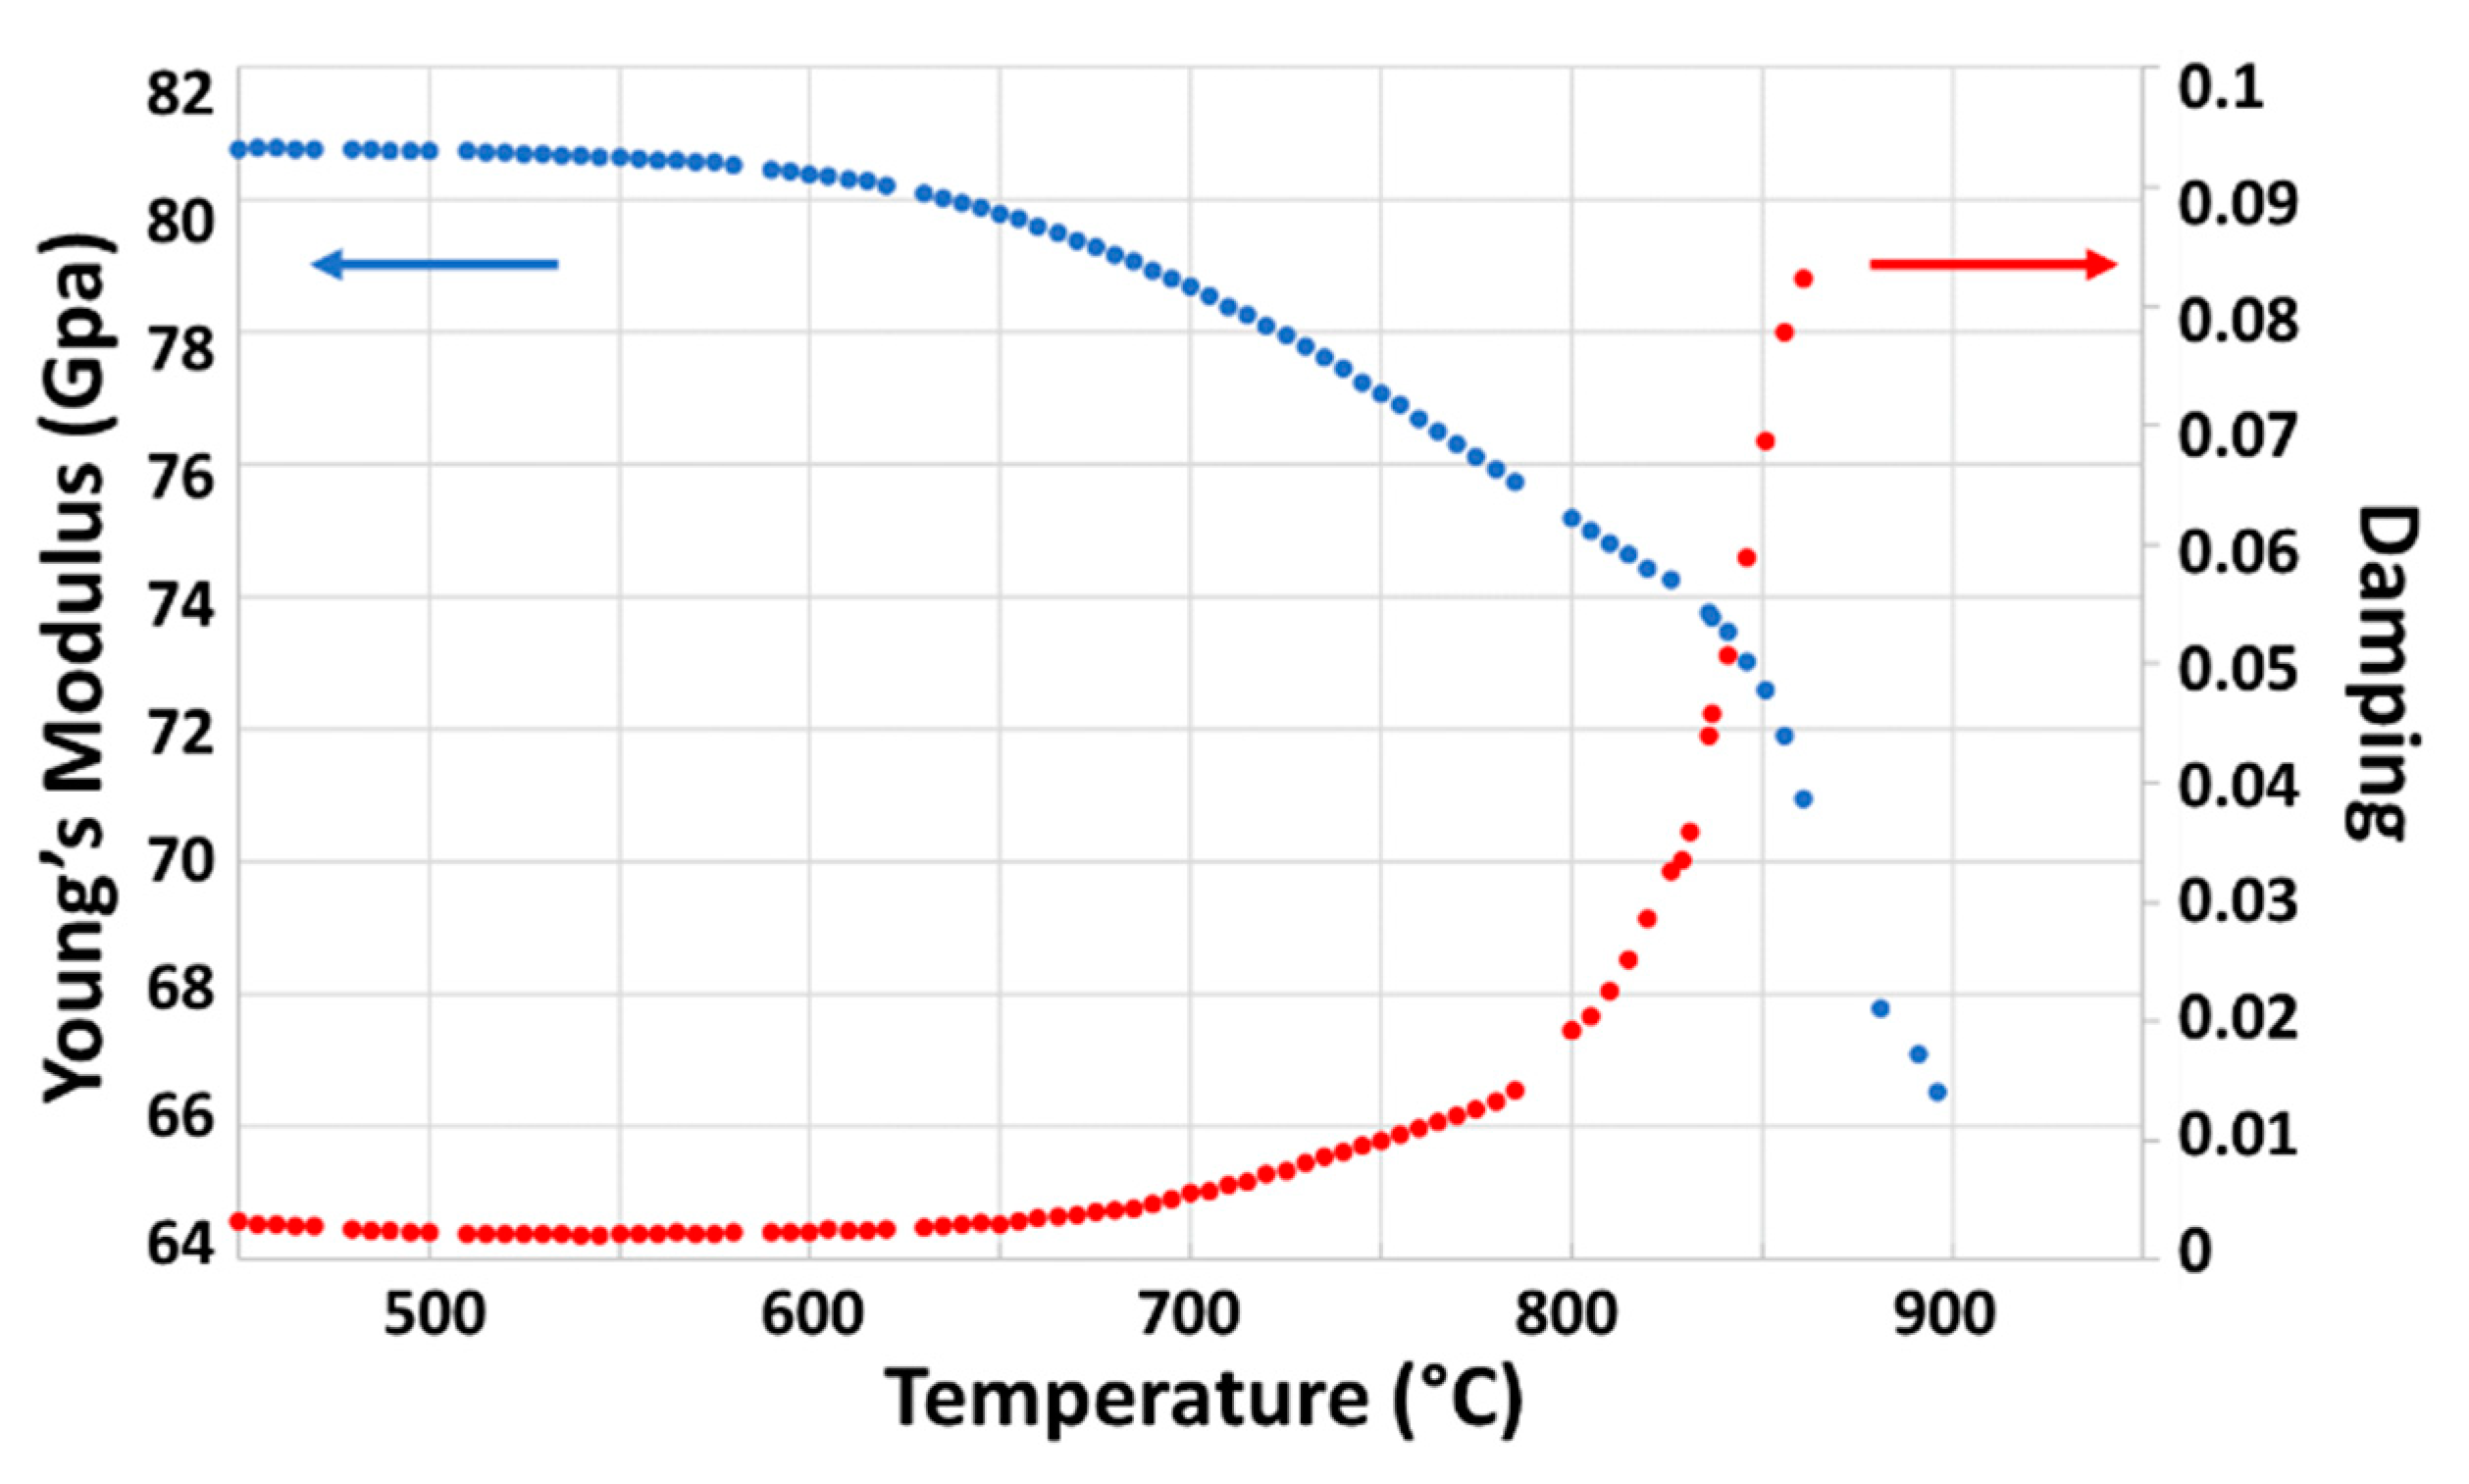
The softening of the 30 vol% of residual glass above its glass transition temperature Tg, may affect the use of the glass-ceramics at high temperature. IET measurements highlight the beginning of the decrease in Young’s modulus E around 600–650 °C (Figure 12). This agrees with the value of Tg obtained by dilatometry (Table 3). The decrease in Young’s modulus remains slow in the temperature range of 600–800 °C. Above 800 °C it declines severely and simultaneously the damping coefficient strongly increases, which is due to the strong softening of the residual glass.
4. Discussion
All the parent glass compositions investigated show a surface crystallization mechanism, starting from oriented nucleation [22] and leading to a crystallization front propagating in depth over time. No volume crystallization is observed. By comparison to the work of Wisniewski et al. [25] on ST0.75S parent glasses crystallized at 970 °C (Tg + 210 °C), the velocity of the crystallization front is of the same order (around 0.5 µm/h) when crystallization is performed at 950 °C (Tg + 240 °C), but significantly slower for lower temperatures.
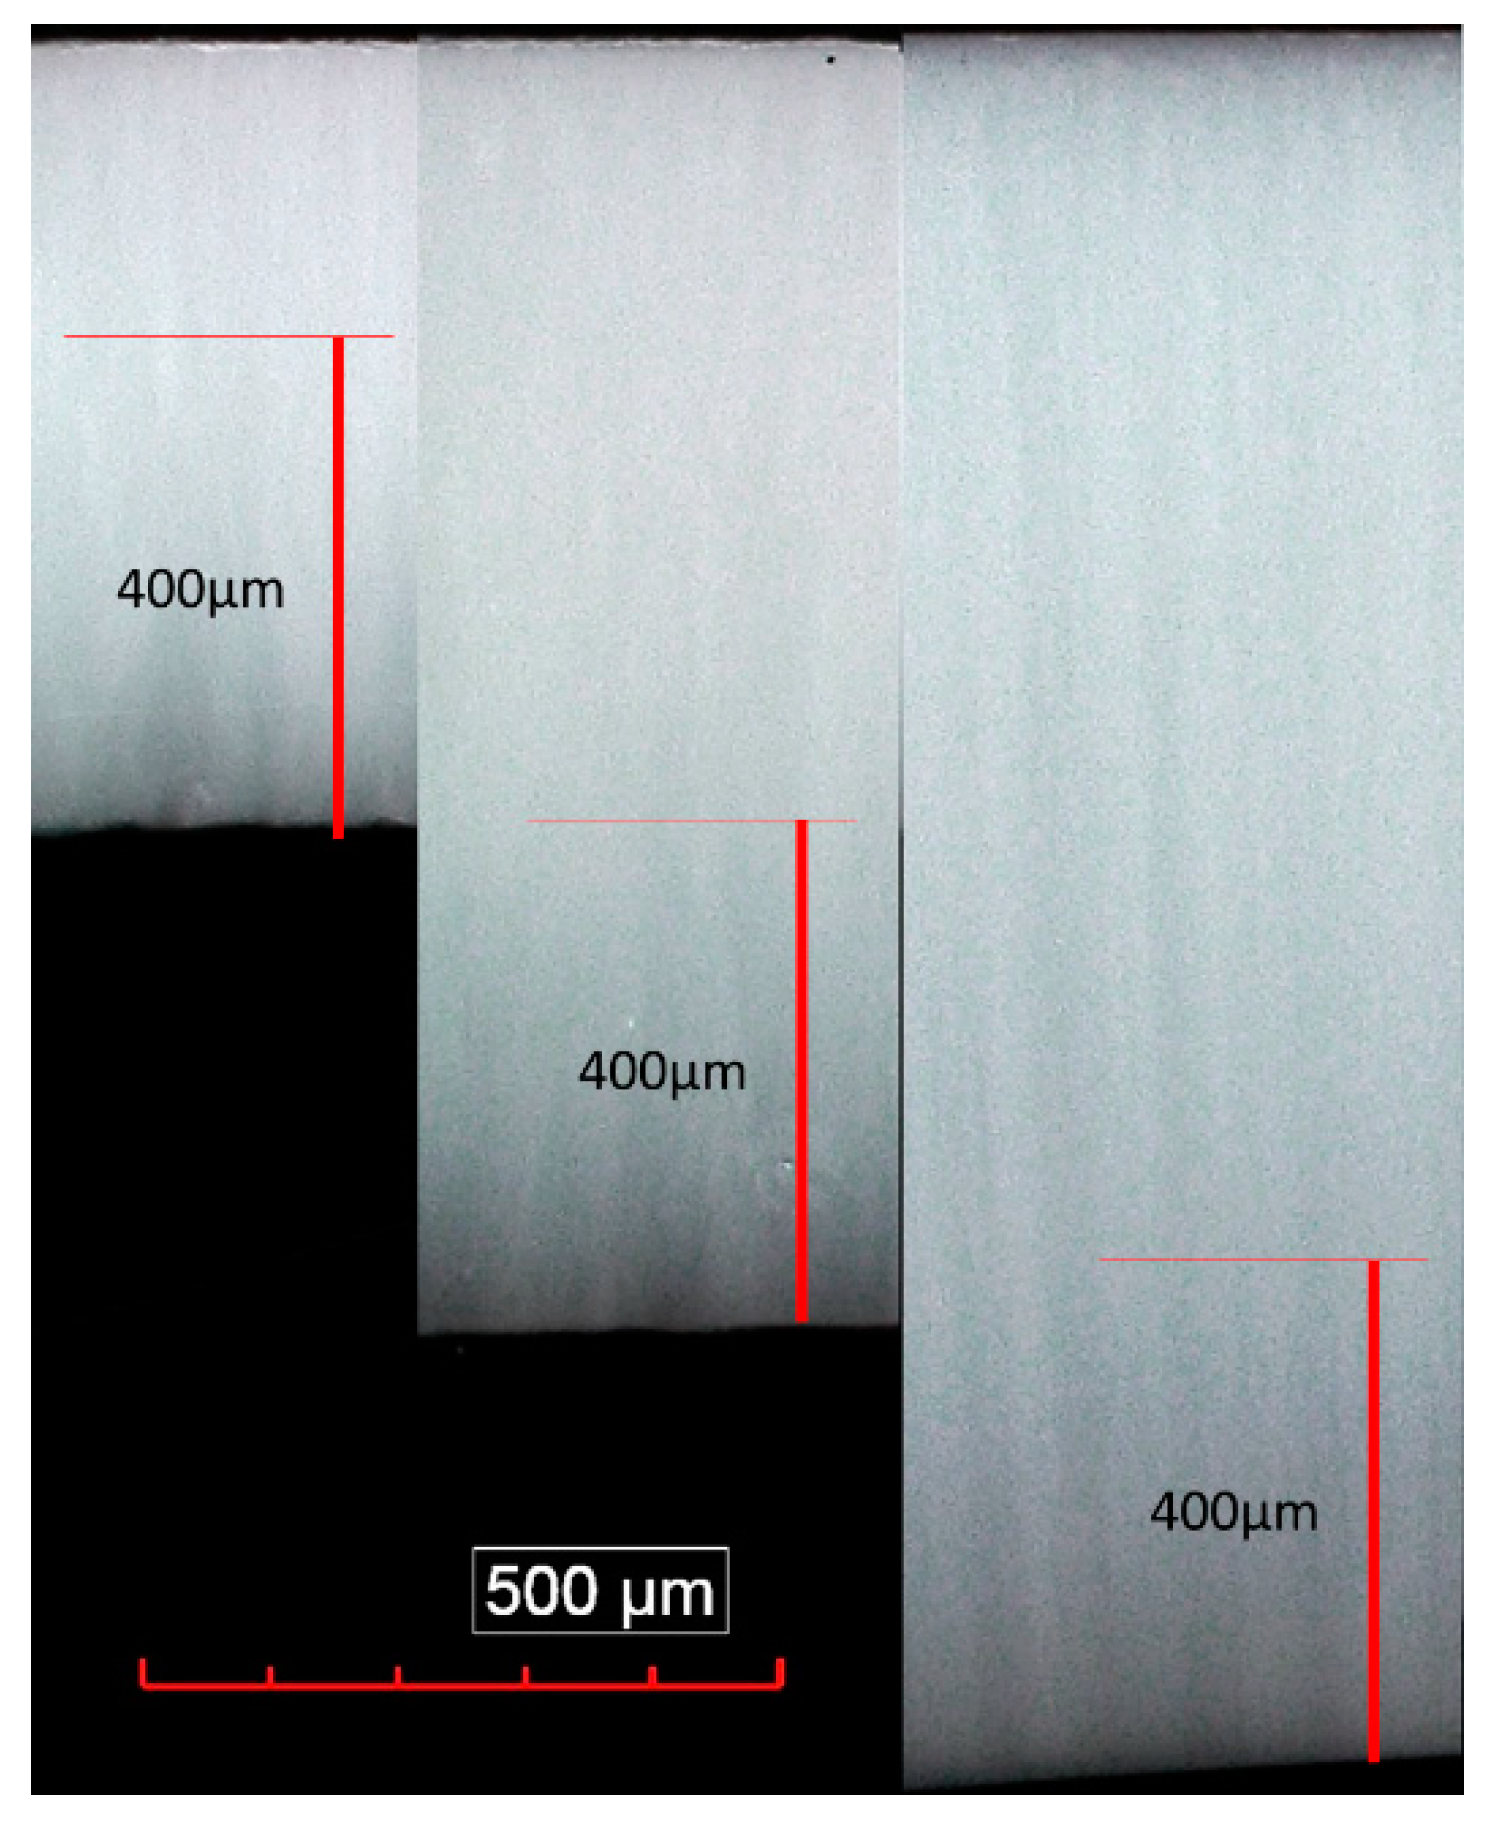
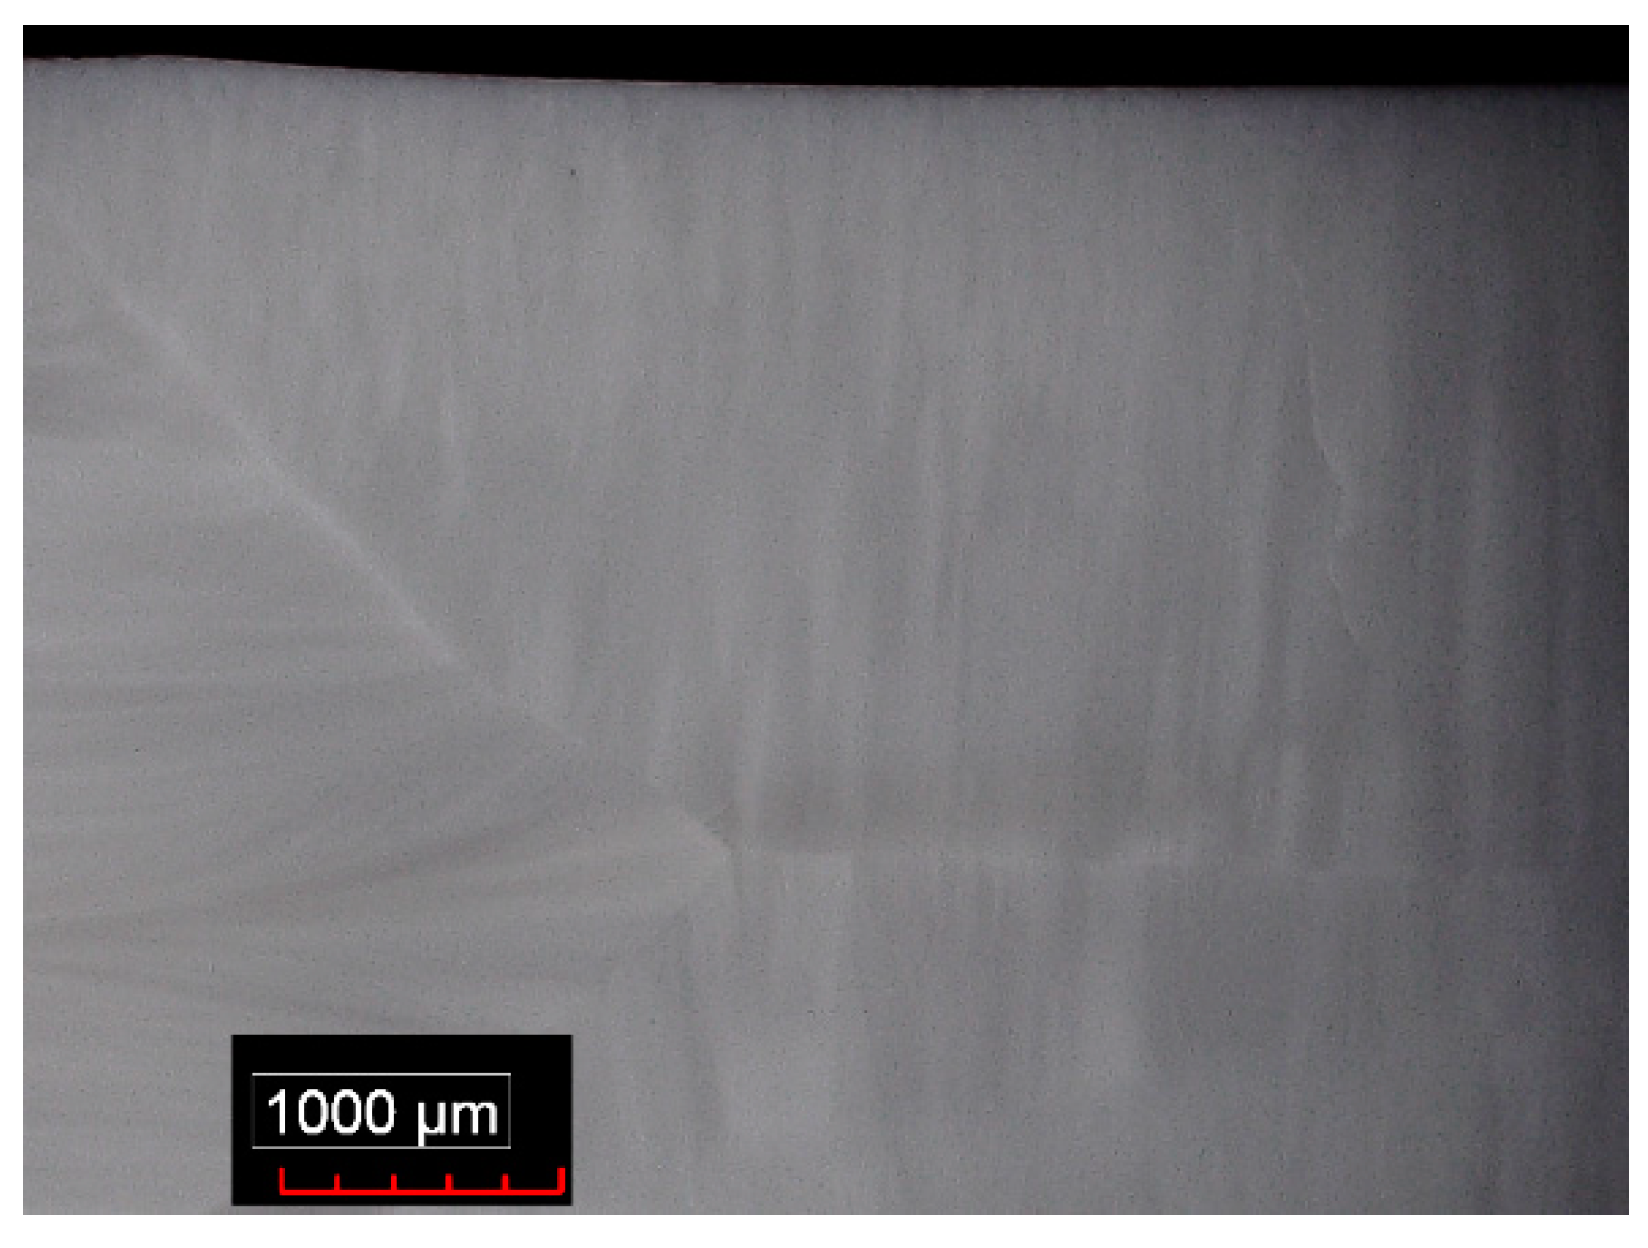
Wisniewski showed that the degree of crystallization of the microstructure evolves over time so that zones first crystallize near the surface appear opaque (longer crystallization time) and zones later crystallized are translucent. In the present work also, the images taken with an optical microscope on ST1.3S + 0.2K2O + 0.1Al2O3 samples crystallized for 2h, 4h and 6h hours at 900 °C show a more translucent zone roughly corresponding to the last 400 µm crystallized (Figure 13). Considering that for ST1.3S + 0.2K2O + 0.1Al2O3 composition crystallized at a temperature of 900 °C, the velocity of the crystallization front is 0.23 mm/h (Table 3), it can then be concluded that the stability of the crystallization is achieved after around 1.7 hours. Consequently, when applying a long crystallization time (e.g. 15h at 900 °C), the glass-ceramic is homogeneously crystallized from the surface to the center (Figure 14).
The microstructures obtained are quite different to those in the work of Wisniewski. SEM pictures of Figure 6 show that the residual glass is fully interconnected with itself in the three directions of space and embedded within the fresnoite crystals. This difference is probably due to the volume fraction of glass that is around 30 vol% in our case and only 6.8 vol% in the work of Wisniewski.
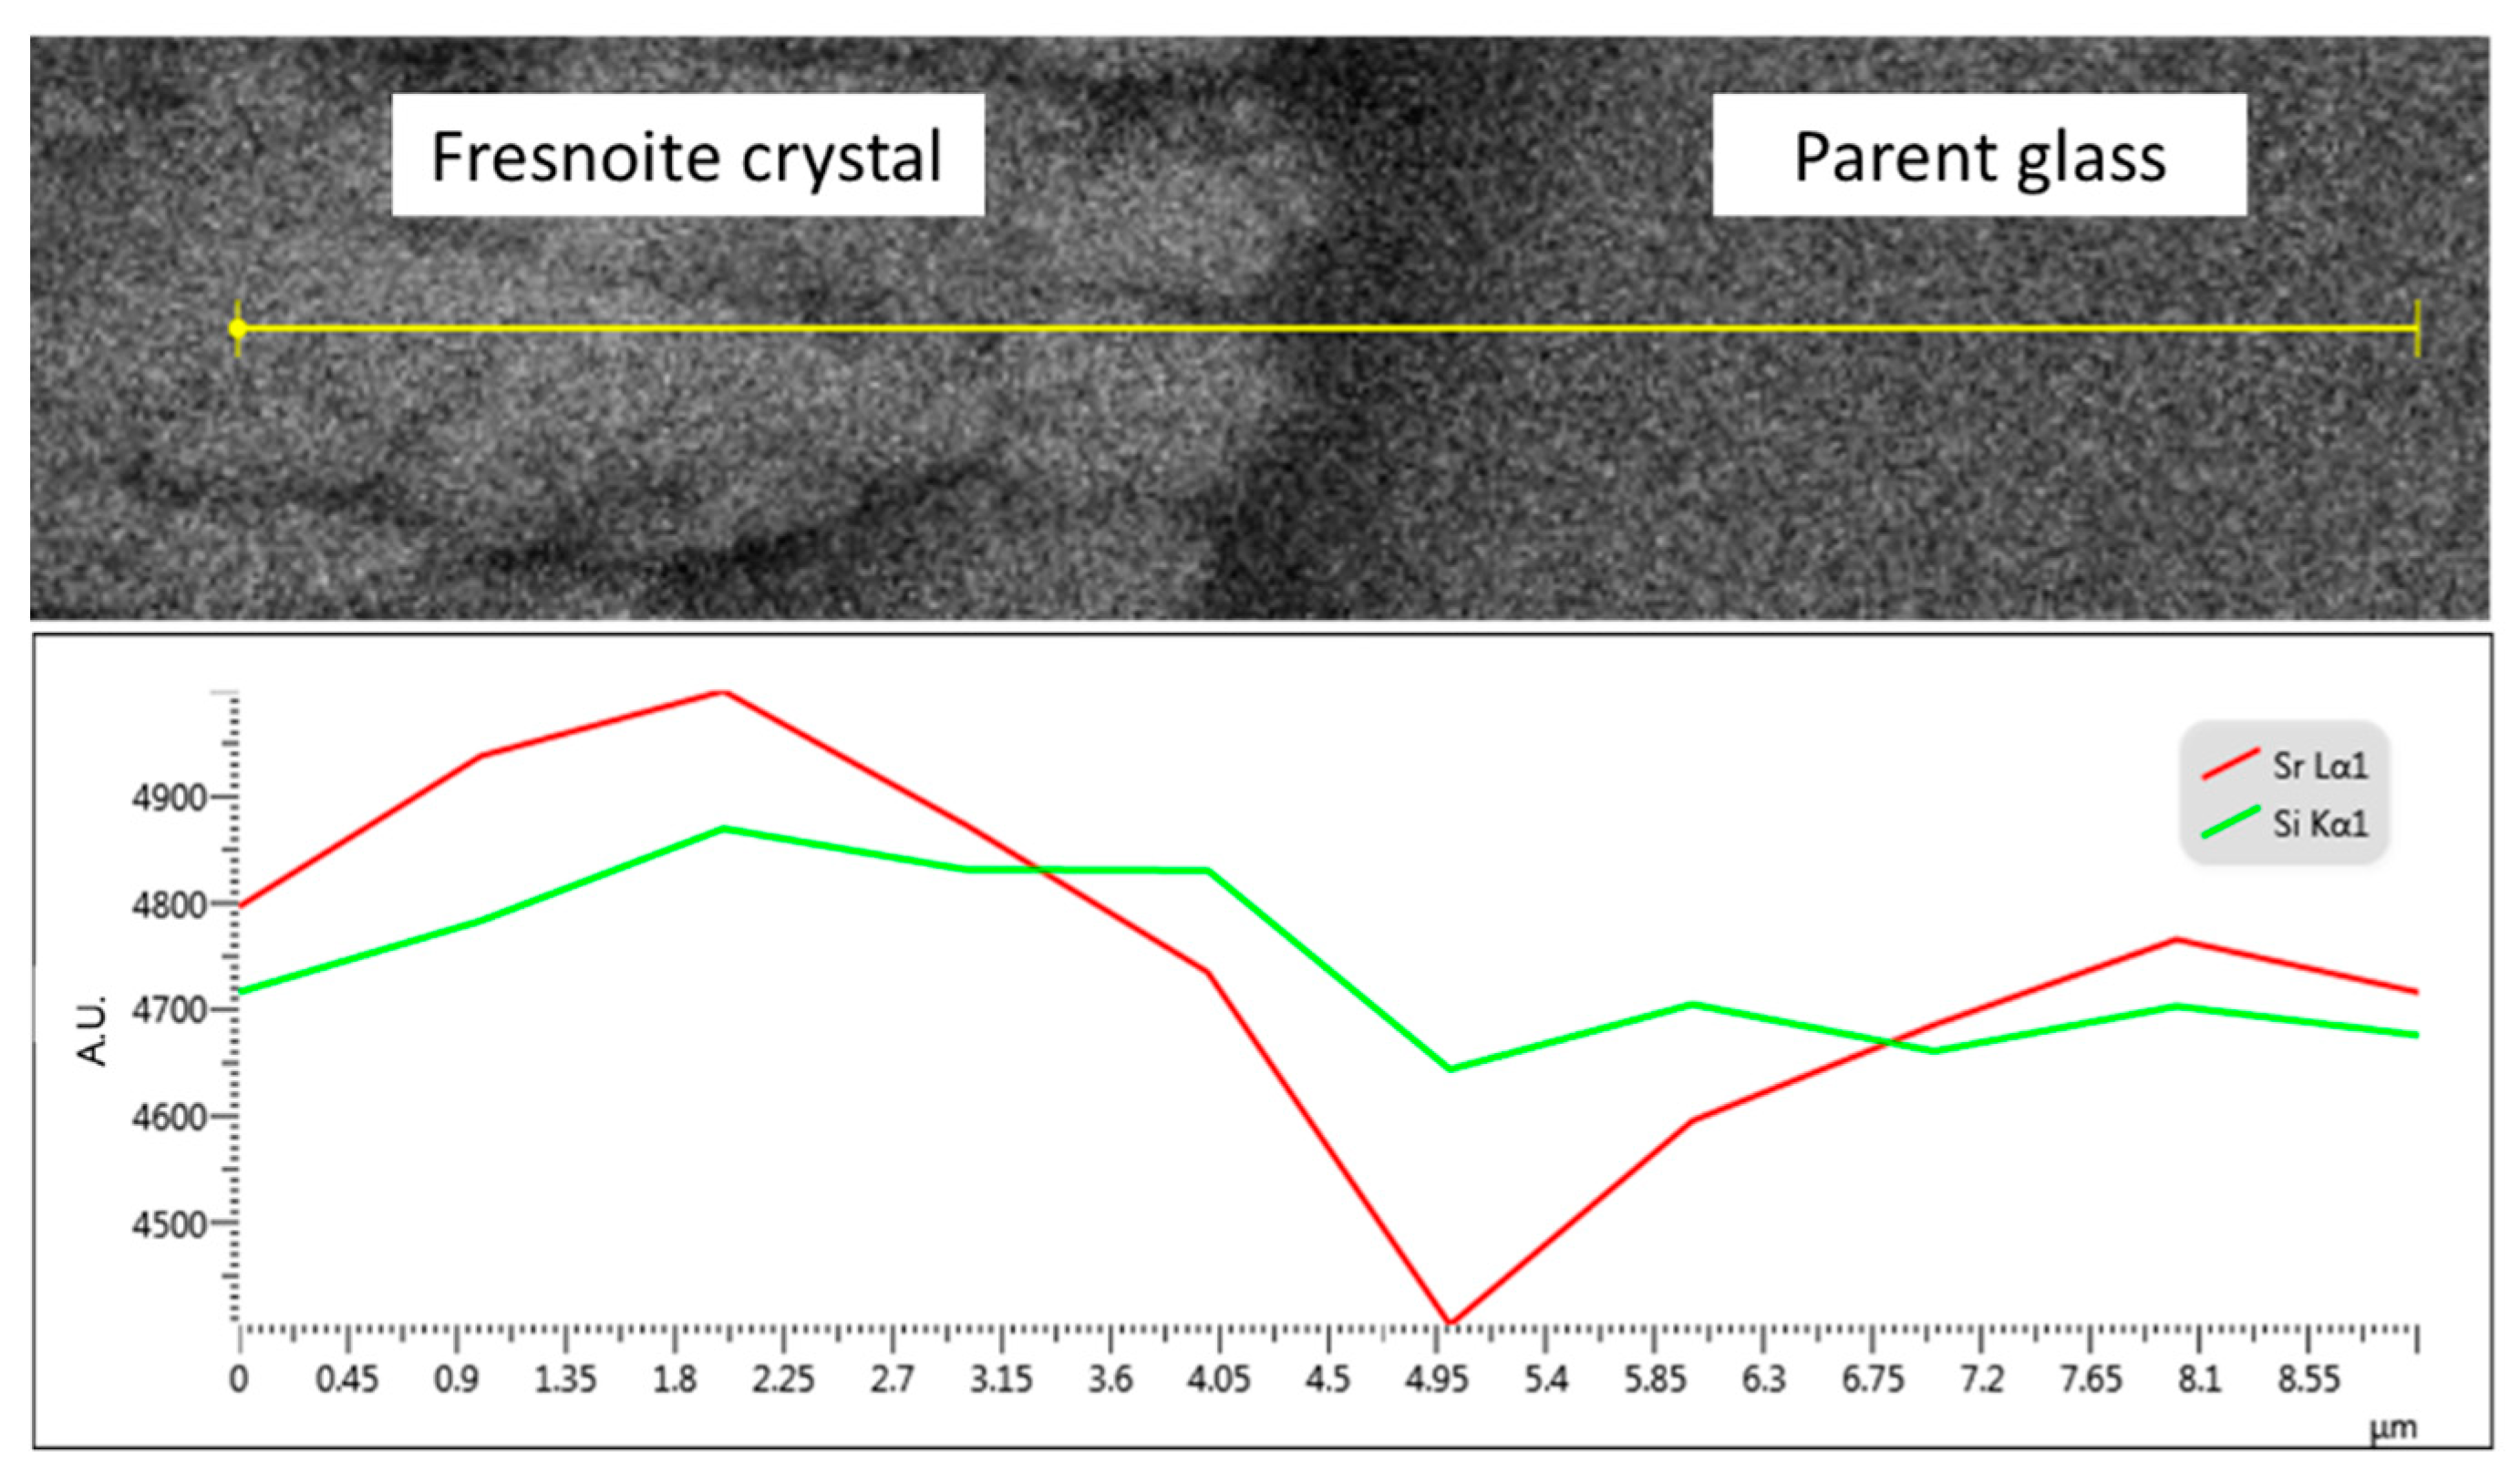
SEM-EDX analysis of Sr and Si through the crystallization front highlights a transition layer of residual glass between the crystals and the parent glass (Figure 15). Propagation of the crystallization front in depth requires diffusion of Sr and Ti atoms through the residual glass layer which acts as a barrier.
We have seen that for a given composition, a rise in temperature increases the speed of the crystallization front (Table 2). This can be explained by the more rapid diffusion of the elements through the residual glass. In the same way, alumina acts as a glass former in the residual glass by increasing its glass transition temperature (Table 1), and thus, its viscosity at a given temperature. Consequently, the crystallization front slows down as the alumina content increases (Table 2). Crystallization temperature also influences the microstructure. This can be discussed with respect to the difference ΔT between the crystallization temperature Tc and the glass transition temperature Tg. Nucleation is promoted at a lower ΔT: This increases the density of nucleation spots at the surface and limits the crystal growth.
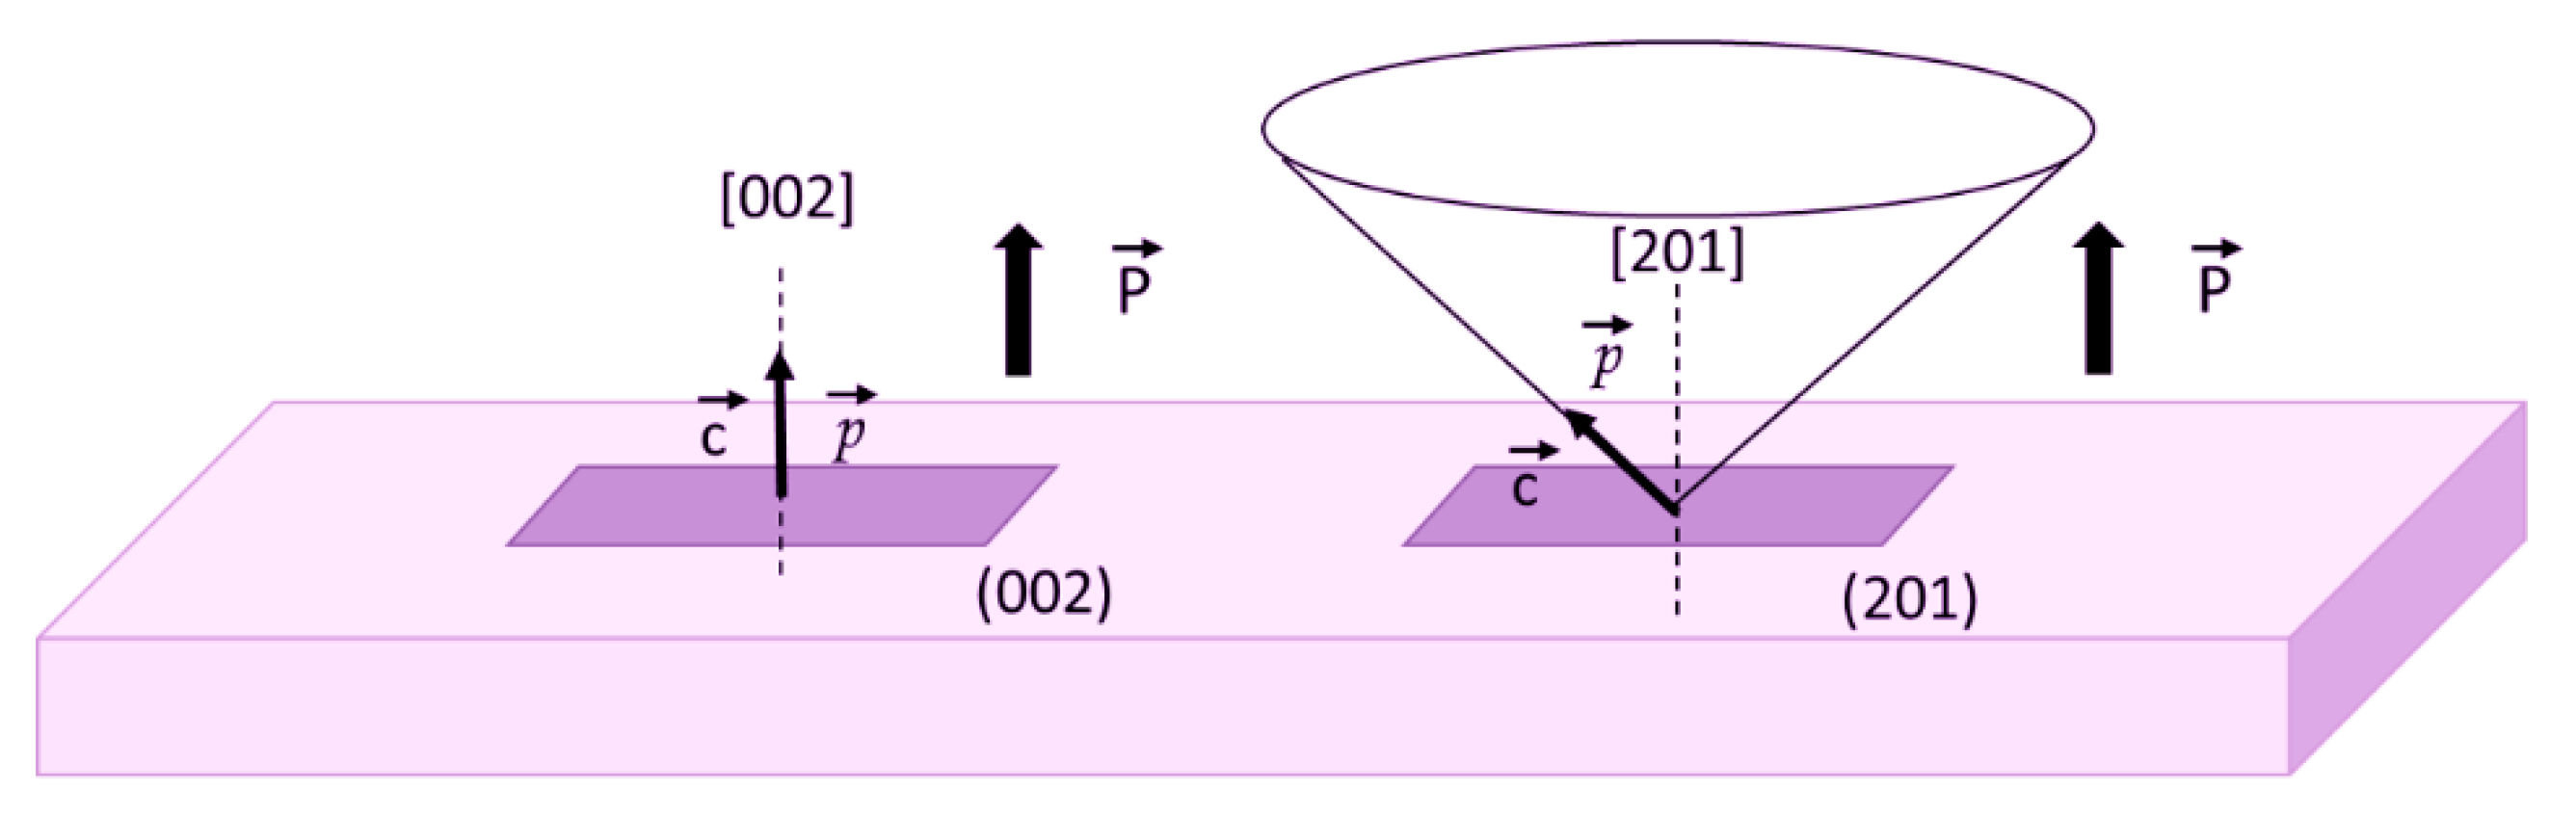
Numerous literature papers show that fresnoite-based glass-ceramics exhibit (002) planes preferential orientation at the surface and a systematic tilt to (201) planes in the bulk [23,25]. This is often explained by a natural selection due to the faster growing speed of (201) planes compared to (002) planes. Our experimental results show that (002) planes can remain preferentially oriented in the bulk of 6-mm-thick samples although tests of reproducibility have shown that preferential orientation may change for identical conditions. However, polarization direction resulting in (002) or (201) orientation is perpendicular to the specimen’s surface (Figure 16) and the charge coefficient d33 does not seem to be significantly influenced by the orientation. This result is opposed to the theoretical d33 values as a function of the tilt angle calculated by Davis et al. [26].
Finally, high temperature XRD analyses and mechanical characterization suggest that the piezoelectric glass-ceramic might remain functional up to 600–800 °C. The drastic fall of the mechanical properties above 800 °C may impair its use as a piezoelectric material. Future work will attempt to verify this through high-temperature measurements of piezoelectric performances.
Author Contributions
Investigation, M.-S.R., N.M. and F.D.; Methodology, M.-S.R., N.M. and F.D.; Supervision, M.G.; Writing—original draft, M.-S.R. and F.D.; Writing—review & editing, F.D.
Funding
This research was partially funded by the INTERREG V program (CUBISM project).
Acknowledgments
Authors would like to thank Professor Jan D’Haen from Hasselt University for the high temperature XRD analyses and Ir Jean-Pierre Erauw from the Belgian Ceramic Research Centre for the IET analyses.
Conflicts of Interest
The authors declare no conflict of interest. The funders had no role in the design of the study; in the collection, analyses, or interpretation of data; in the writing of the manuscript, or in the decision to publish the results.
References
- Cabral, A.A.; Fokin, V.M.; Zanotto, E.D.; Chinaglia, C.R. Nanocrystallization of fresnoite glass. I. Nucleation and growth kinetics. J. Non-Cryst. Solids 2003, 330, 174–186. [Google Scholar] [CrossRef]
- Höche, T.; Neumann, W.; Esmaeilzadeh, S.; Uecker, R.; Lentzen, M.; Rüssel, C. The Crystal Structure of Sr2TiSi2O8. J. Solid State Chem. 2002, 166, 15–23. [Google Scholar] [CrossRef]
- Ochi, Y. Fresnoite crystal structure in glass-ceramics. Mater. Res. Bull. 2006, 41, 740–750. [Google Scholar] [CrossRef]
- Halliyal, A.; Bhalla, A.S.; Cross, L.E.; Newnham, R.E. Dielectric, piezoelectric and pyroelectric properties of Sr2TiSi2O8 polar glass-ceramic: A new polar material. J. Mater. Sci. 1985, 20, 3745–3749. [Google Scholar] [CrossRef]
- Schneider, M.; Richter, W.; Keding, R.; Rüssel, C. XPS investigations on coordination and valency of Ti in fresnoite glasses and glass ceramics. J. Non-Cryst. Solids 1998, 226, 273–280. [Google Scholar] [CrossRef]
- Tsuzuku, K.; Taruta, S.; Takusagawa, N.; Kishi, H. Crystallization of 2(Ca,Sr,Ba)O–TiO2–2SiO2 composition glasses. J. Non-Cryst. Solids 2002, 306, 50–57. [Google Scholar] [CrossRef]
- Höche, T.; Keding, R.; Rüssel, C.; Hergt, R. Microstructural Characterization of Grain Oriented Glass Ceramics in the System Ba2TiSiO8SiO2. J. Mater. Sci. 1999, 34, 195–208. [Google Scholar] [CrossRef]
- Ochi, Y.; Meguro, T.; Kakegawa, K. Orientated crystallization of fresnoite glass-ceramics by using a thermal gradient. J. Eur. Ceram. Soc. 2006, 26, 627–630. [Google Scholar] [CrossRef]
- Keding, R.; Rüssel, C. Electrochemical nucleation for the preparation of oriented glass ceramics. J. Non-Cryst. Solids 1997, 219, 136–141. [Google Scholar] [CrossRef]
- Keding, R.; Rüssel, C. Oriented strontium fresnoite glass-ceramics prepared by electrochemically induced nucleation. J. Mater. Sci. 2004, 39, 1433–1435. [Google Scholar] [CrossRef]
- Keding, R.; Rüssel, C. The mechanism of electrochemically induced nucleation in glasses with the composition 2BaO · TiO2 · 2.75SiO2. J. Non-Cryst. Solids 2005, 351, 1441–1446. [Google Scholar] [CrossRef]
- Ding, Y.; Masuda, N.; Miura, Y.; Osaka, A. Preparation of polar oriented Sr2TiSi2O8 films by surface crystallization of glass and second harmonic generation. J. Non-Cryst. Solids 1996, 203, 88–95. [Google Scholar] [CrossRef]
- Rüssel, C. Oriented crystallization of glass. A review. J. Non-Cryst. Solids 1997, 219, 212–218. [Google Scholar] [CrossRef]
- Wisniewski, W.; Thieme, K.; Rüssel, C. Fresnoite glass-ceramics—A review. Progress Mater. Sci. 2018, 98, 68–107. [Google Scholar] [CrossRef]
- Basile, N.; Gonon, M.; Petit, F.; Cambier, F. Processing of a glass ceramic surface by selective focused beam laser treatment. Ceram. Int. 2016, 42, 1720–1727. [Google Scholar] [CrossRef]
- Maury, N.; Cambier, F.; Gonon, M. Bulk crystallisation of (00l) oriented fresnoite Sr2TiSi2O8 in glass-ceramics of the Sr–Ti–Si–K–B–O system. J. Non-Cryst. Solids 2011, 357, 1079–1084. [Google Scholar] [CrossRef]
- Maury, N.; Gonon, M.; Erauw, J.P.; Simons, J.; Cambier, F. Effect of K2O addition on the crystallization of Sr2TiSi2O8 in glass-ceramics of the Sr-Ti-Si-O system. In Proceedings of the 10th European Ceramic Society Conference, Berlin, Germany, 17–21 June 2007; pp. 621–625. [Google Scholar]
- Maury, N.; Cambier, F.; Gonon, M. Influence of the viscosity of the residual glass in glass ceramics containing fresnoite crystals. In Proceedings of the 13th European Inter-Regional Conference on Ceramics, Barcelona, Spain, 12–14 September 2012; pp. 21–24. [Google Scholar]
- Roebben, G.; Bollen, B.; Brebels, A.; van Humbeeck, J.; van der Biest, O. Impulse excitation apparatus to measure resonant frequencies, elastic moduli, and internal friction at room and high temperature. Rev. Sci. Instrum. 1997, 68, 4511–4515. [Google Scholar] [CrossRef]
- Fluegel, A. Global Model for Calculating Room-Temperature Glass Density from the Composition. J. Am. Ceram. Soc. 2008, 90, 2622–2625. [Google Scholar] [CrossRef]
- Wisniewski, W.; Takano, K.; Takahashi, Y.; Fujiwara, T.; Rüssel, C. Microstructure of Transparent Strontium Fresnoite Glass-Ceramics. Sci. Rep. 2015, 5, 9069. [Google Scholar] [CrossRef]
- Wisniewski, W.; Dimitrijevic, J.; Rüssel, C. Oriented Nucleation and Crystal Growth of Sr-Fresnoite (Sr2TiSi2O8) in 2SrO·TiO2·2SiO2 glasses with additional SiO2. CrystEngComm 2018, 20, 3234–3245. [Google Scholar] [CrossRef]
- Patschger, M.; Wisniewski, W.; Rüssel, C. Piezoelectric glass-ceramics produced via oriented growth of Sr2TiSi2O8 fresnoite: Thermal annealing of surface modified quenched glasses. CrystEngComm 2012, 14, 7368–7373. [Google Scholar] [CrossRef]
- Halliyal, A.; Bhalla, A.S.; Newnham, R.E. Polar glass ceramics—A new family of electroceramic materials: Tailoring the piezoelectric and pyroelectric properties. Mater. Res. Bull. 1983, 18, 1007–1019. [Google Scholar] [CrossRef]
- W Wisniewski, M.P.; Rüssel, C. Sr-fresnoite surface crystallization in a 2SrO·TiO2·2.75 SiO2 glass studied by EBSD. CrystEngComm 2012, 14, 5425–5433. [Google Scholar] [CrossRef]
- Davis, M.J.; Vullo, P.; Kocher, M.; Hovhannisyan, M.; Letz, M. Piezoelectric glass-ceramic for high-temperature applications. J. Non-Cryst. Solids 2018, 501, 159–166. [Google Scholar] [CrossRef]
Figure 1.
Casting of the parent glass (a,b); specimen before (c) and after (d) crystallization treatment.
Figure 1.
Casting of the parent glass (a,b); specimen before (c) and after (d) crystallization treatment.

Figure 2.
XRD and piezoelectric characterization of the specimens.

Figure 3.
Example of measurement of glass-transition temperature Tg of the residual glass in a glass-ceramic from the slope break in the dilatometry curve.
Figure 3.
Example of measurement of glass-transition temperature Tg of the residual glass in a glass-ceramic from the slope break in the dilatometry curve.

Figure 4.
(a) Image of a polished cross section of specimen ST1.3S + 0.2K2O + 0.1Al2O3 after crystallization treatment for 2h at 950 °C; (b) schematization of the motion of the crystallization front over time.
Figure 4.
(a) Image of a polished cross section of specimen ST1.3S + 0.2K2O + 0.1Al2O3 after crystallization treatment for 2h at 950 °C; (b) schematization of the motion of the crystallization front over time.

Figure 5.
Example of XRD pattern collected on a powder-milled glass-ceramic ST1.3S + 0.2K2O + 0.1Al2O3.
Figure 5.
Example of XRD pattern collected on a powder-milled glass-ceramic ST1.3S + 0.2K2O + 0.1Al2O3.

Figure 6.
SEM images in BSE mode of glass-ceramic cross section.

Figure 7.
XRD patterns vs. depth: (a) case A and (b) case B (0 and 6 mm corresponding to the opposite faces of the specimens)
Figure 7.
XRD patterns vs. depth: (a) case A and (b) case B (0 and 6 mm corresponding to the opposite faces of the specimens)

Figure 8.
Pole figures of (002) and (201) lattice planes over depth, case B.

Figure 9.
Evolution of piezoelectric charge coefficient d33 vs. depth for both case A (a) and case B (b).
Figure 9.
Evolution of piezoelectric charge coefficient d33 vs. depth for both case A (a) and case B (b).

Figure 10.
Schematization of permanent dipolar moment symmetry in fresnoite crystals across the sample.
Figure 10.
Schematization of permanent dipolar moment symmetry in fresnoite crystals across the sample.

Figure 11.
High temperature XRD patterns collected on glass-ceramic ST1.3S + 0.2K2O + 0.1Al2O3 oriented (201) from RT to 1000 °C by 100 °C steps. Observed peaks correspond to (201) and (402) planes.
Figure 11.
High temperature XRD patterns collected on glass-ceramic ST1.3S + 0.2K2O + 0.1Al2O3 oriented (201) from RT to 1000 °C by 100 °C steps. Observed peaks correspond to (201) and (402) planes.

Figure 12.
Evolution of Young’s modulus E and damping over temperature for glass-ceramic ST1.3S + 0.2K2O + 0.1Al2O3.
Figure 12.
Evolution of Young’s modulus E and damping over temperature for glass-ceramic ST1.3S + 0.2K2O + 0.1Al2O3.

Figure 13.
Optical microscope images of ST1.3S + 0.2K2O + 0.1Al2O3 glass-ceramic crystallized at 900 °C for 2h, 4h and 6h.
Figure 13.
Optical microscope images of ST1.3S + 0.2K2O + 0.1Al2O3 glass-ceramic crystallized at 900 °C for 2h, 4h and 6h.

Figure 14.
Optical microscope image of ST1.3S + 0.2K2O + 0.1Al2O3 glass-ceramic crystallized at 900 °C for 15 hours.
Figure 14.
Optical microscope image of ST1.3S + 0.2K2O + 0.1Al2O3 glass-ceramic crystallized at 900 °C for 15 hours.

Figure 15.
Content of Sr and Si at the interface between a fresnoite crystal and the parent glass.

Figure 16.
Dipolar moment p and polarization P direction for (002) and (201) preferential orientation.
Figure 16.
Dipolar moment p and polarization P direction for (002) and (201) preferential orientation.


Table 1.
Density and glass transition temperature of the parent glasses
| ST1.3S | Al/Si | ρpg (Archi.) ± 0.01 g/cm3 | Tg ± 2 °C |
|---|---|---|---|
| + 0.2K2O | 0.0000 | 3.41 | 712 |
| + 0.2K2O + 0.02Al2O3 | 0.0061 | 3.41 | 716 |
| + 0.2K2O + 0.05Al2O3 | 0.0152 | 3.41 | 713 |
| + 0.2K2O + 0.10Al2O3 | 0.0303 | 3.40 | 712 |
| + 0.2K2O + 0.15Al2O3 | 0.0455 | 3.40 | 720 |
Table 2.
Speed of the crystallization front.
| ST1.3S | Crystallization Speed (mm/h) | Crystallization Speed (µ/s) | ||||
|---|---|---|---|---|---|---|
| 850 °C | 900 °C | 950 °C | 850 °C | 900 °C | 950 °C | |
| + 0.2K2O | 0.06 | 0.36 | 2.6 | 0.017 | 0.010 | 0.72 |
| + 0.2K2O + 0.02Al2O3 | 0.05 | 0.33 | 2.1 | 0.014 | 0.092 | 0.58 |
| + 0.2K2O + 0.05Al2O3 | 0.06 | 0.30 | 1.4 | 0.017 | 0.083 | 0.39 |
| + 0.2K2O + 0.10Al2O3 | 0.04 | 0.23 | 1.3 | 0.011 | 0.064 | 0.36 |
| + 0.2K2O + 0.15Al2O3 | 0.04 | 0.19 | 1.2 | 0.011 | 0.053 | 0.33 |
Table 3.
Properties of residual glasses and glass-ceramics.
| Residual Glass 1.3SiO2-0.2K2O-yAl2O3 | Glass-Ceramic | |||||||
|---|---|---|---|---|---|---|---|---|
| ST1.3S | Al/Si | mrg wt% | ρrg (Fluegel) ±0.02 g/cm3 | ρrg (Archi.) ±0.01 g/cm3 | vrg ±0.3 vol% | Tg ±2 °C | ρth ±0.02 g/cm3 | ρgc (Archi.) ±0.01 g/cm3 |
| + 0.2K2O | 0 | 19.2 | 2.33 | - | 28.4 | 605 | 3.44 | 3.43 |
| + 0.2K2O + 0.02Al2O3 | 0.0154 | 19.6 | 2.33 | - | 28.8 | 610 | 3.43 | 3.43 |
| + 0.2K2O + 0.05Al2O3 | 0.0385 | 20.0 | 2.34 | - | 29.4 | 624 | 3.43 | 3.42 |
| + 0.2K2O + 0.10Al2O3 | 0.0769 | 20.8 | 2.35 | 2.34 | 30.3 | 640 | 3.42 | 3.40 |
| + 0.2K2O + 0.15Al2O3 | 0.1154 | 21.6 | 2.37 | - | 31.1 | 652 | 3.41 | 3.39 |
Table 4.
Orientation factor R(002) at specimens’ surface and after a 0.3-mm grinding.
| 850 °C | 900 °C | 950 °C | ||||
|---|---|---|---|---|---|---|
| ST1.3S | Surf | −0.3 mm | Surf | −0.3 mm | Surf | −0.3 mm |
| + 0.2K2O | 0.97 | 0.05 | 1 | 0.02 | 0.99 | 0 |
| + 0.2K2O + 0.02 Al2O3 | 0.98 | 0.1 | 1 | 0.01 | 0.98 | 0.01 |
| + 0.2K2O + 0.05 Al2O3 | 1 | 0.1 | 0.99 | 0.02 | 1 | 0.05 |
| + 0.2K2O + 0.10 Al2O3 | 1 | 1 | 0.99 | 0.96 | 0.99 | 0.3 |
| + 0.2K2O + 0.15 Al2O3 | 1 | 1 | 0.97 | 1 | 1 | 0.24 |
© 2019 by the authors. Licensee MDPI, Basel, Switzerland. This article is an open access article distributed under the terms and conditions of the Creative Commons Attribution (CC BY) license (http://creativecommons.org/licenses/by/4.0/).
Share and Cite
MDPI and ACS Style
Renoirt, M.-S.; Maury, N.; Dupla, F.; Gonon, M. Structure and Properties of Piezoelectric Strontium Fresnoite Glass-Ceramics Belonging to the Sr–Ti–Si–Al–K–O System. Ceramics 2019, 2, 86-97. https://doi.org/10.3390/ceramics2010008
AMA Style
Renoirt M-S, Maury N, Dupla F, Gonon M. Structure and Properties of Piezoelectric Strontium Fresnoite Glass-Ceramics Belonging to the Sr–Ti–Si–Al–K–O System. Ceramics. 2019; 2(1):86-97. https://doi.org/10.3390/ceramics2010008
Chicago/Turabian StyleRenoirt, Marie-Sophie, Nathalie Maury, Florian Dupla, and Maurice Gonon. 2019. "Structure and Properties of Piezoelectric Strontium Fresnoite Glass-Ceramics Belonging to the Sr–Ti–Si–Al–K–O System" Ceramics 2, no. 1: 86-97. https://doi.org/10.3390/ceramics2010008