Temporal Trends in Heat-Related Mortality: Implications for Future Projections

Department of Environmental Health, Boston University School of Public Health, 715 Albany Street, Talbot 4W, Boston, MA 02118, USA
Atmosphere 2018, 9(10), 409; https://doi.org/10.3390/atmos9100409
Submission received: 30 May 2018
/
Revised: 20 September 2018
/
Accepted: 21 September 2018
/
Published: 18 October 2018
(This article belongs to the Special Issue Impacts of Climate Change on Human Health)
Abstract
:High temperatures have large impacts on premature mortality risks across the world, and there is concern that warming temperatures associated with climate change, and in particular larger-than-expected increases in the proportion of days with extremely high temperatures, may lead to increasing mortality risks. Comparisons of heat-related mortality exposure-response functions across different cities show that the effects of heat on mortality risk vary by latitude, with more pronounced heat effects in more northerly climates. Evidence has also emerged in recent years of trends over time in heat-related mortality, suggesting that in many locations, the risk per unit increase in temperature has been declining. Here, I review the emerging literature on these trends, and draw conclusions for studies that seek to project future impacts of heat on mortality. I also make reference to the more general heat-mortality literature, including studies comparing effects across locations. I conclude that climate change projection studies will need to take into account trends over time (and possibly space) in the exposure response function for heat-related mortality. Several potential methods are discussed.
1. Introduction
This paper summarizes and discusses key findings on trends over time in the effects of temperature on human mortality. While not intended to be a comprehensive review of the temperature–mortality relationship literature, I start by briefly summarizing main findings from broad literature. I focus on mortality, although there is also some evidence emerging from the morbidity literature on trends in impacts [1].
The effect of temperature on mortality is the most extensively studied topic within the broad domain of climate and health research, with a reference that covers a broad range of methodologies [2]. A limited number of studies have quantified deaths listed as heat-related on death certificates, most often accumulating individual case reports from medical records [3]. However, heat-related deaths identified by medical records tend to capture only cases with clear heat involvement, which represent only a subset of all heat-related deaths [2]. A recent study found that less than 10% of excess heat-related deaths were labeled as such on death certificates from 1997 to 2013 in New York City [4]. Another type of epidemiology study quantifies excess mortality that occurs in a city or region during a clearly identified heat wave event, as compared to during non heat-wave periods in the same locale. This was for example the approach used by researchers to quantify the impacts of the 1995 Chicago heat wave [5] and the 2003 Paris heat wave [6]. However, heat-related deaths also occur during periods when not obvious heat waves happen, such as when occasional temperature spikes that occur in most of summers. To more comprehensively quantify the overall burden of heat on mortality, a third epidemiologic approach uses regression analysis of multi-year daily time series to quantify exposure–response relationships linking temperature and mortality [7,8]. These latter studies usually include deaths due to all causes, or all causes minus “external” causes such as homicide and suicide, and report substantial impacts in association with high temperatures. Studies that analyze the entire distribution of temperatures also report that cold temperatures are associated with increased mortality risk; however, the extent to which these deaths are caused by low temperature, as opposed to seasonal respiratory infections that co-vary with temperature, has been questioned [9,10]. The specific impact of winter temperature on mortality is a key area of uncertainty in projecting the health effects of climate change. However, the present study only focuses on heat-related deaths.
Multi-city and age-stratified analyses have examined vulnerability factors that can explain differences in heat-mortality effects between cities. Increased heat risk is associated with old or young age, living alone, preexisting chronic diseases, poverty, and low prevalence of air conditioning (A/C) [7,8,11]. Thus, to estimate the quantitative impact of future temperatures on mortality, we need to understand not only how climate may change, but also how these vulnerability factors may evolve in the future.
2. Spatial/Climatic Differences in Temperature Impacts
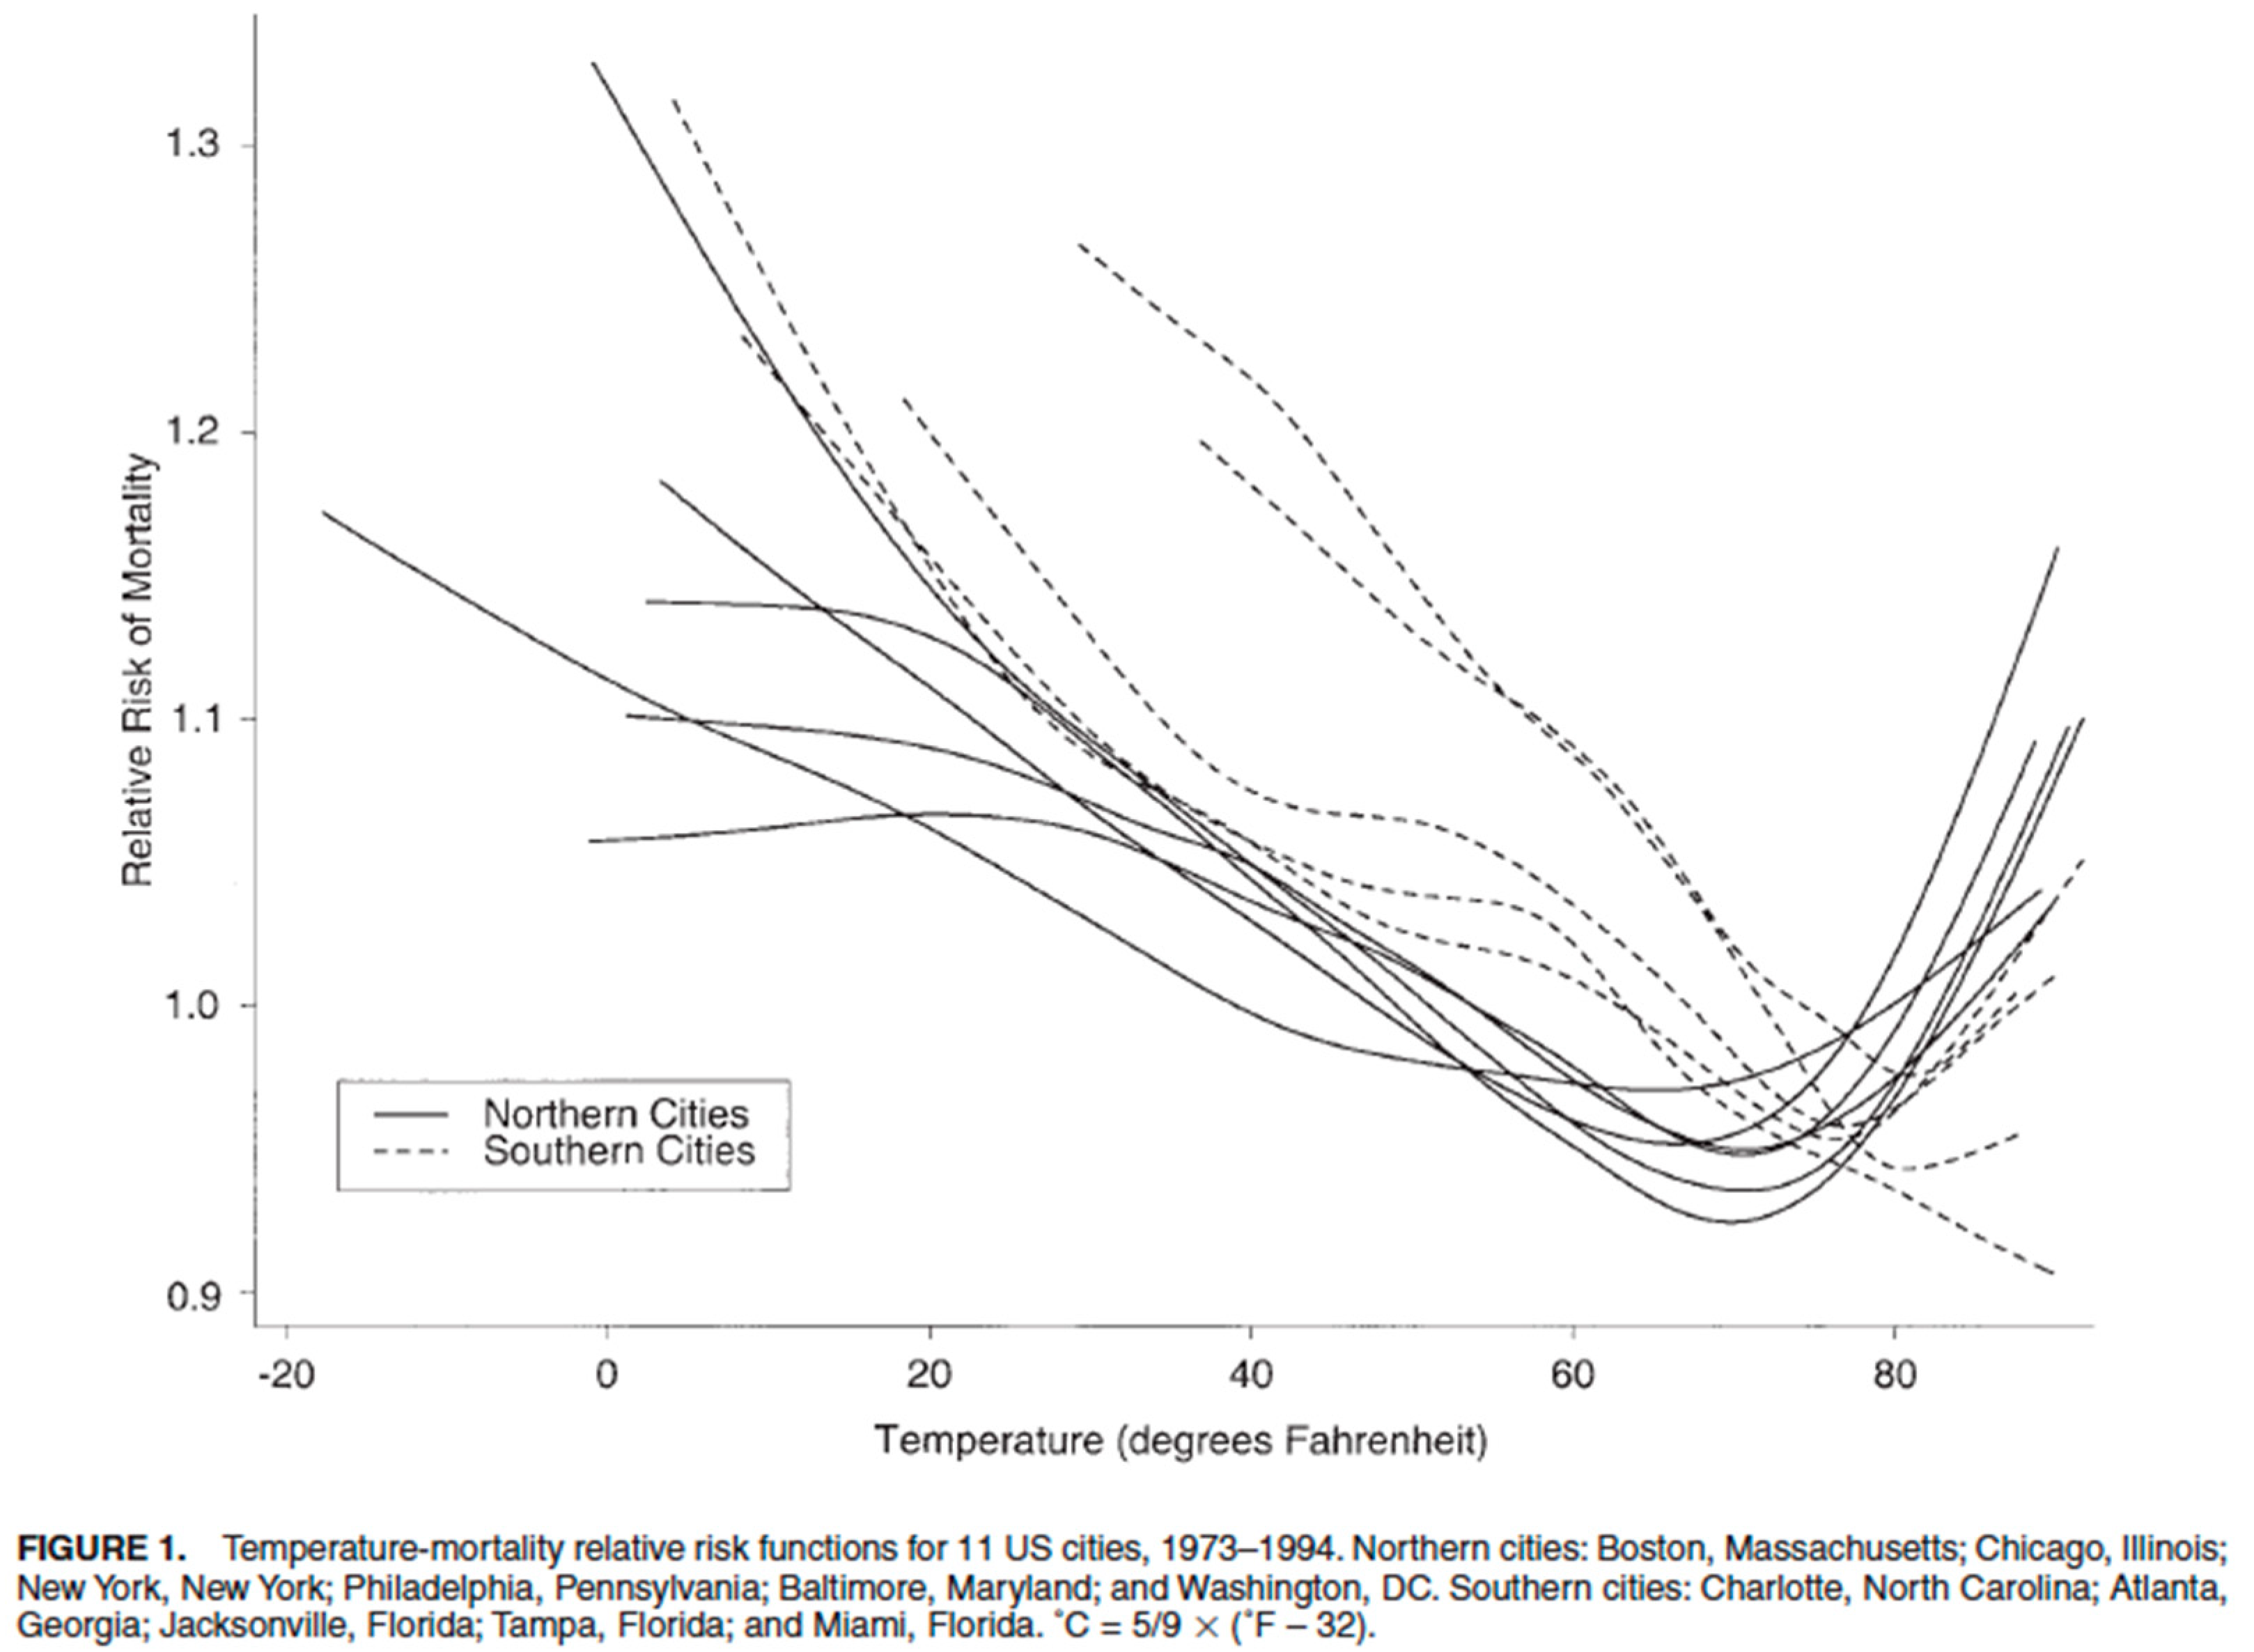
One very consistent finding from the time series literature is that the shape of the exposure–response function (ERF) differs by latitude (i.e., prevailing climate) [7,8,12,13,14]. A classic figure from an early study is reproduced in Figure 1, showing the ERFs from 11 U.S. cities [7]. Southern cities show small or non-existent heat effects, but substantial cold effects. Conversely, northern cities show less pronounced cold effects but larger heat effects. Additionally, the lowest point on the curve (termed “minimum mortality temperature” (MMT)) tends to shift to higher temperatures in southern, warmer cities. It is important to note that Figure 1 displays the raw relationship between temperature and mortality, not controlled for seasons. As a result, the “cold” effect is likely substantially overestimated.
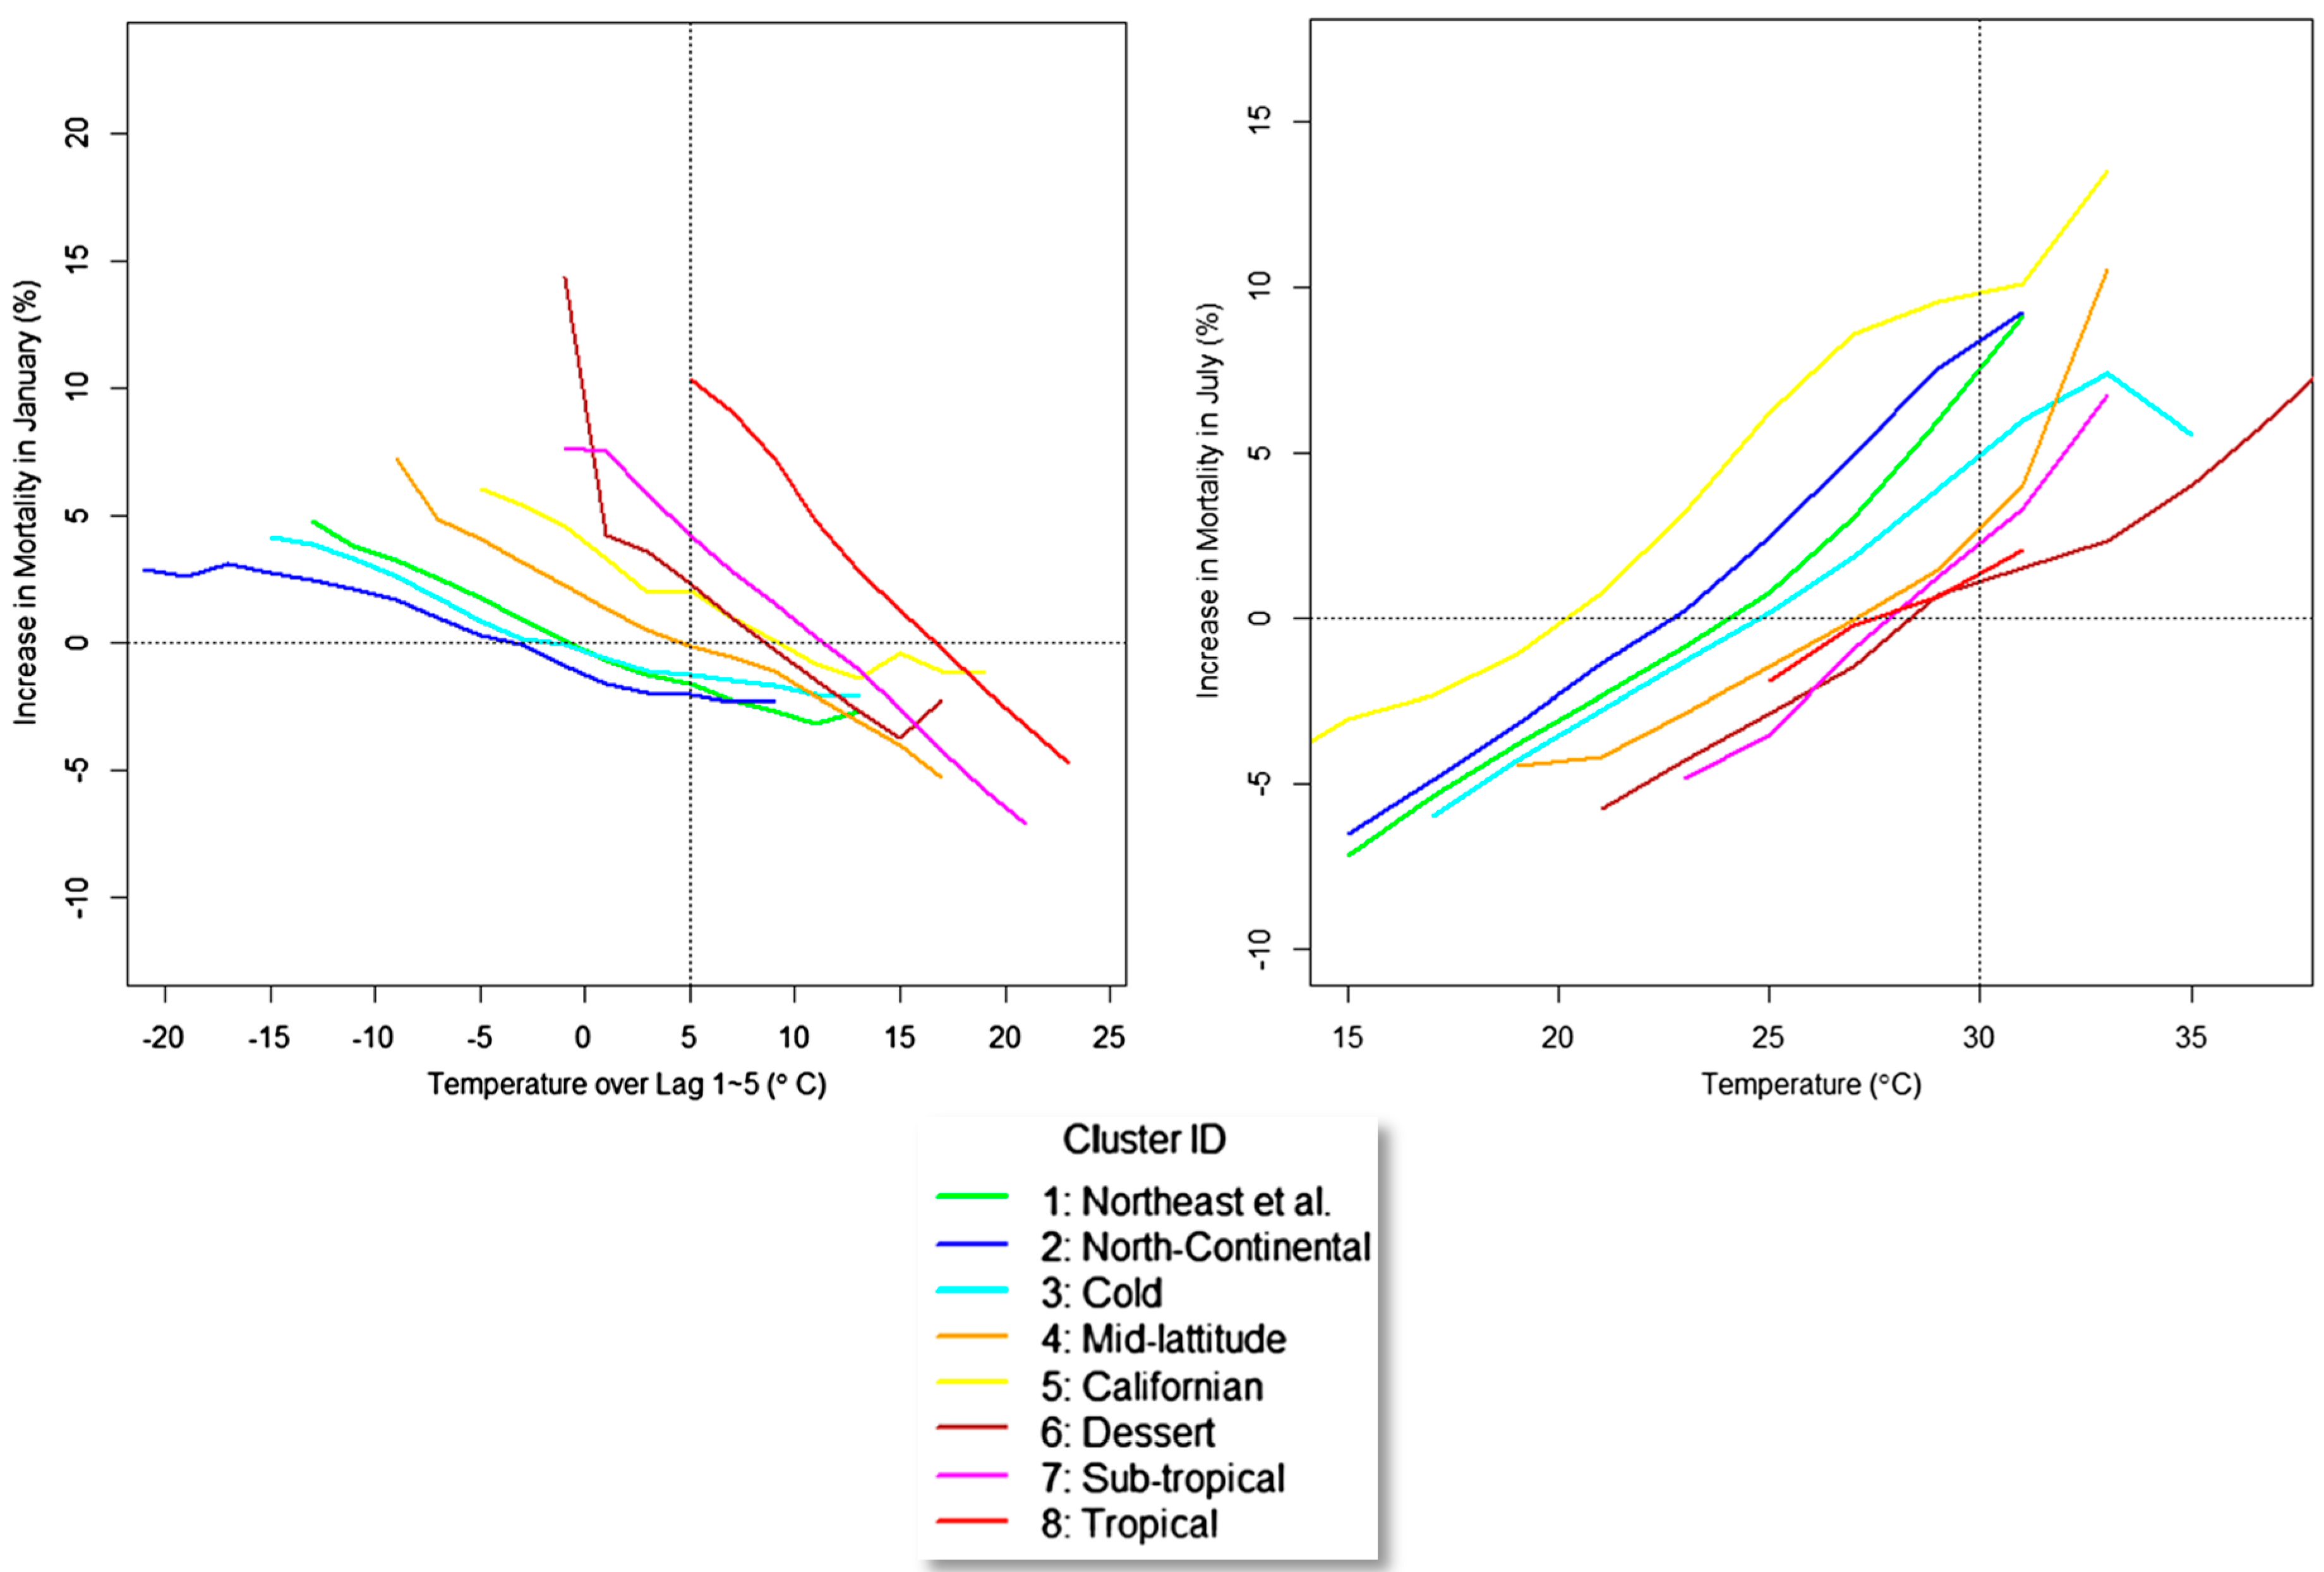
These findings support the concept that populations adapt to climate conditions typical in their cities. This means the populations exhibit health responses mainly at temperatures that are extreme within the local context. Hondula and colleagues defined four classes of climate adaptation from the following aspects: physiological (referred to as acclimatization), behavioral (e.g., avoidance; use of A/C), infrastructural (e.g., white roofs and green infrastructures), and technological (e.g., heat warning systems, and more efficient A/C) [15]. It seems likely that all of these factors play a role, with the relative importance of each varying with settings, populations, and health outcomes of interest. Among the studies that provide empirical evidence of differential temperature effects by location, Anderson and Bell’s analysis of 107 U.S. cities from 1987 to 2000 [8] is noteworthy in analyzing factors that modify temperature effects by location. Prevalence of A/C is one significant predictor of the differences across cities in heat effects. Barreca and colleagues [16] also reported higher heat–mortality effects in cooler climates, based on a nationwide, state-level analysis. Further insights into spatial differences in exposure response as a function of local climate were provided by Lee and colleagues who analyzed data from 148 U.S. cities from 1973 to 2006 [17]. Cities were grouped into 8 clusters based on weather patterns. As shown below in Figure 2, heat and cold effects differed across clusters as a function of temperature, with more pronounced cold effects—steeper slopes—in warmer clusters, and lower thresholds for heat effects, but similar slopes, in cooler clusters. It would be tempting to use these findings to develop empirical adaptation functions by relating parameters of the cluster-specific ERFs to cluster-specific climate variables such as seasonal mean temperature. Further evidence supporting the concept that populations adapt to local temperatures has been shown in an international study across over 300 cities [13,14]. Guo and colleagues found that MMTs vary with the mean temperature across countries in a surprisingly consistent way. Still, the authors noted that the exposure–response relationship between climate indicators and temperature-related mortality is not a simple one, and cautioned against using these relationships in a quantitative way to project future impacts.
At a finer spatial scale, one innovative study in France reported an analysis of heat-related mortality within 30 × 30 km grids across the entire country [18]. This is the only example in the literature to date where health and environmental data have been analyzed within a regular grid over a region, rather than within administrative areas. Within each grid, non-linear exposure-response functions were fit, and the MMTs computed. There was a strong correlation (0.90) between MMTs and mean summer temperatures (MSTs) across grid squares. This suggests that another way to project adaptation might be to model within-country associations between MMTs and MSTs in the current climate, and then adjust future MMTs based on changing future MSTs.
The literature on geographical differences in temperature–mortality ERFs shows that effects vary substantially depending on local climate, and imply that populations eventually adapt to local conditions. They say nothing about the time course over which adaptation occurs. Still, it is tempting to hypothesize based on these findings that future populations would also adapt to changing climatic conditions, at least once a new steady state climate is achieved [19]. A key question is “what does the pace of adaptation look like while climate is on a changing trajectory from historical conditions to a future steady state?”.
One way to address this question is by looking at trends over time in temperature–mortality ERFs in a given location as climate changes. However, detecting a climate change-induced adaptation signal from these trends is problematic for several reasons. First, climate has warmed by only about 1 °C over the past century, and health datasets often span only a fraction of this period; thus, the climate-driven trend in adaption would be expected to be small within the observed record. Secondly, there may be trends in other factors that, while not directly related to climate change, can have a profound impact on heat-health effects. These include trends in urbanization, income, housing, the built environment, indoor/outdoor activity patterns, access to healthcare, chronic disease prevalence, and others. One such trend has been the rapid increase in A/C prevalence in the past 3–4 decades in the U.S. In the following section, I examine the literature on temporal trends in temperature–mortality ERFs.
3. Studies of Trends over Time in Heat Impacts
In addition to the literature documenting geographical/climatological differences in temperature–mortality ERFs, recently, there has been growing literature on temporal changes in these effects. Recent review papers document a generally decreasing trend over time in heat-related mortality ERFs, particularly in North America, with less consistent findings in Europe, and Asia [20,21,22]. Evidence shows that the quantitative effect of heat on mortality has been decreasing in most, but not all, cities where studies have been carried out. The reasons for this decreasing risk have not been clearly identified, but may include: enhanced heat-health awareness and prevention measures, general improvements in population health, and technological changes such as increases in residential A/C prevalence. There are virtually no mortality trend studies for low-income countries, nor for persons who are exposed outdoors because of work, homelessness or recreational activities. Where examined, there has been little evidence that cold effects on mortality have decreased over time [21].
One of the first studies to examine trends over time in heat-related mortality was carried out by Davis and colleagues [23], which documented declining heat effects in 28 U.S. cities over the years 1964–1998. More recently, Bobb and colleagues [24] analyzed data from 105 U.S. cities over 1987–2005 and reported more than a 60% drop in the mortality effect per 5.5 °C (10 °F) rise in same-day temperature. The authors hypothesized that A/C may play a role in this trend, but they were unable to show that rates of decline in health effects by city were related to differences in rates of A/C adoption. Their inability to detect statistically significant A/C effects may have been due in part to the limitations of available A/C data over time, as well as the lack of A/C data that are specific to population groups most affected by high temperatures, such as the poor and elderly. The authors speculated that declines over time in cardiovascular mortality rates may contribute to reduced heat vulnerability.
In contrast to the findings in [24], Barreca et al. [25] reported that A/C prevalence largely explains temporal and spatial differences in heat effects on mortality in U.S. over the 20th century when analyzing at the levels of state and month. This study, and related econometric work by Deschenes and colleagues [26,27] stands apart in methodology by using monthly or annual data aggregated at the state level, rather than the daily time series, city-level approach used in the epidemiologic literature. One advantage of the econometric approach is that, by analyzing data in monthly or annual segments, it likely avoids biases in effect estimates due to short-term harvesting. It could also be argued that annual statistics are more relevant to future climate impact projections, which are usually aggregated to annual or decadal statistics. An interesting review of the advantages and limitations of the econometric approach is provided in [27].
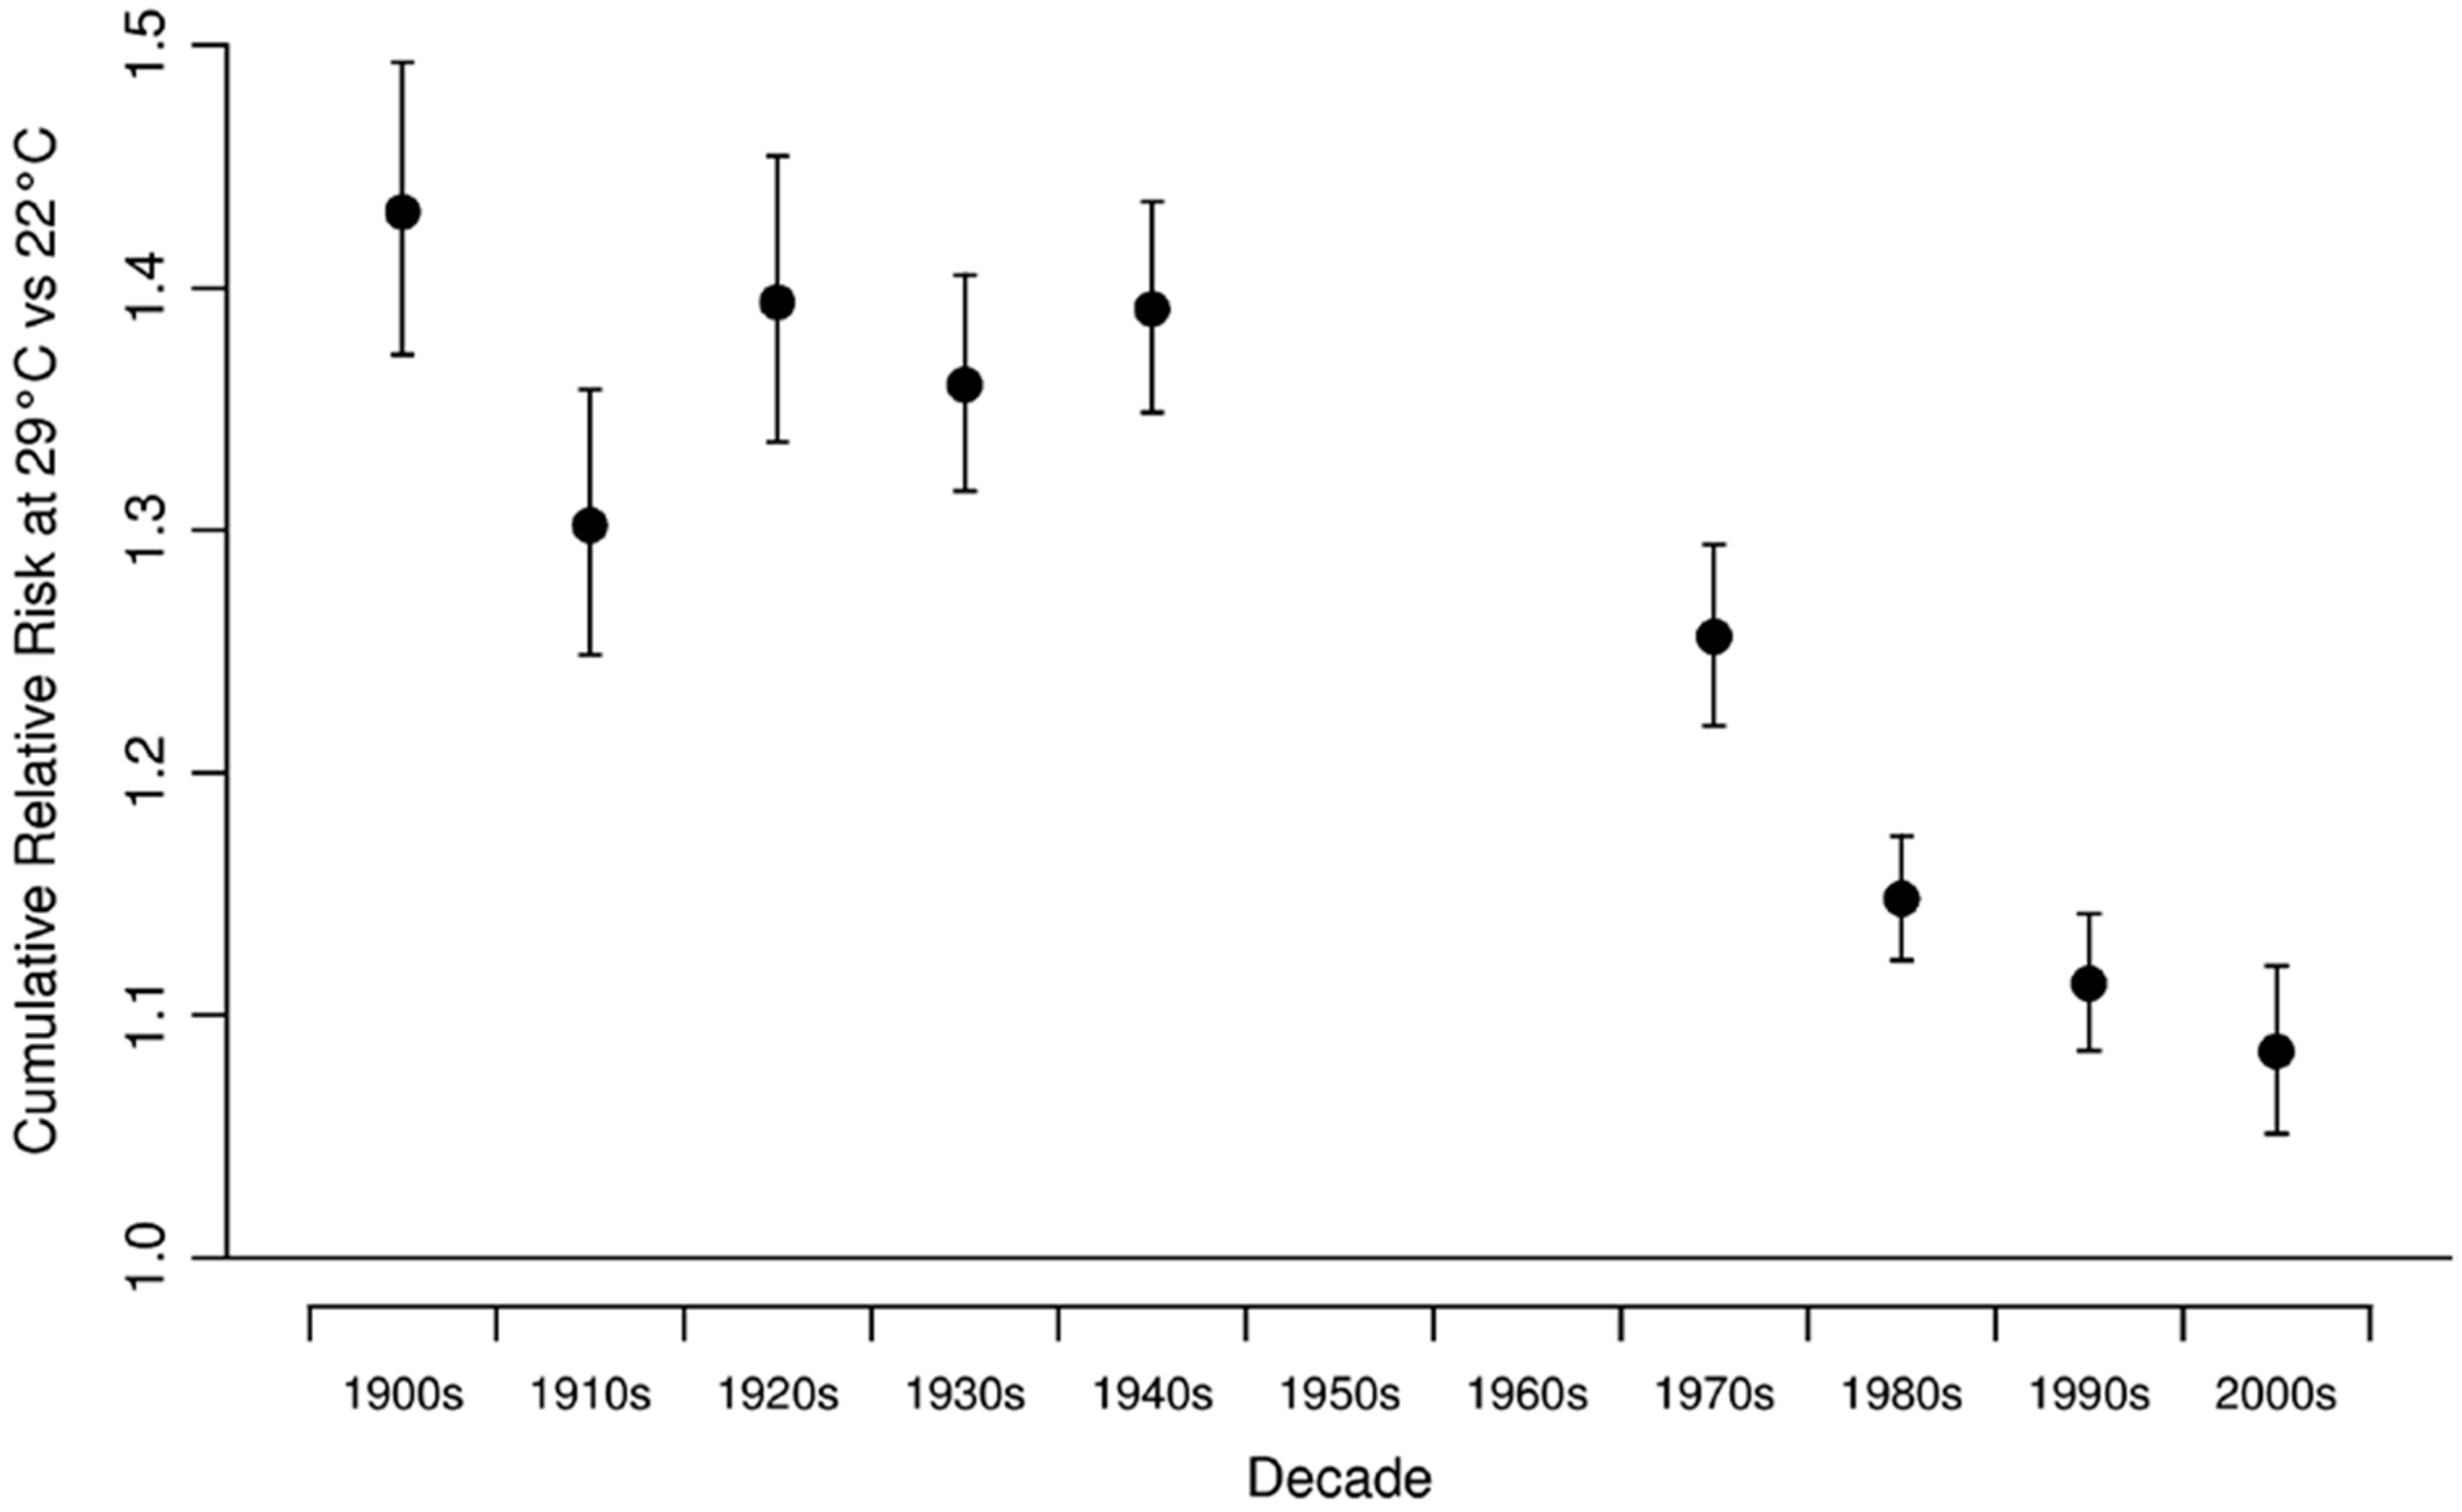
While focusing only on New York City, the work of Petkova and colleagues [28] is noteworthy because it reported heat effects over multiple decades of the 20th century, from 1900 to 2006. They reported a marked decrease in the ERF for heat-related mortality between the first five decades of the 20th century and the most recent four decades. In recent decades, the downward trend appeared to slow somewhat, suggesting a leveling off of the ERF (See Figure 3).
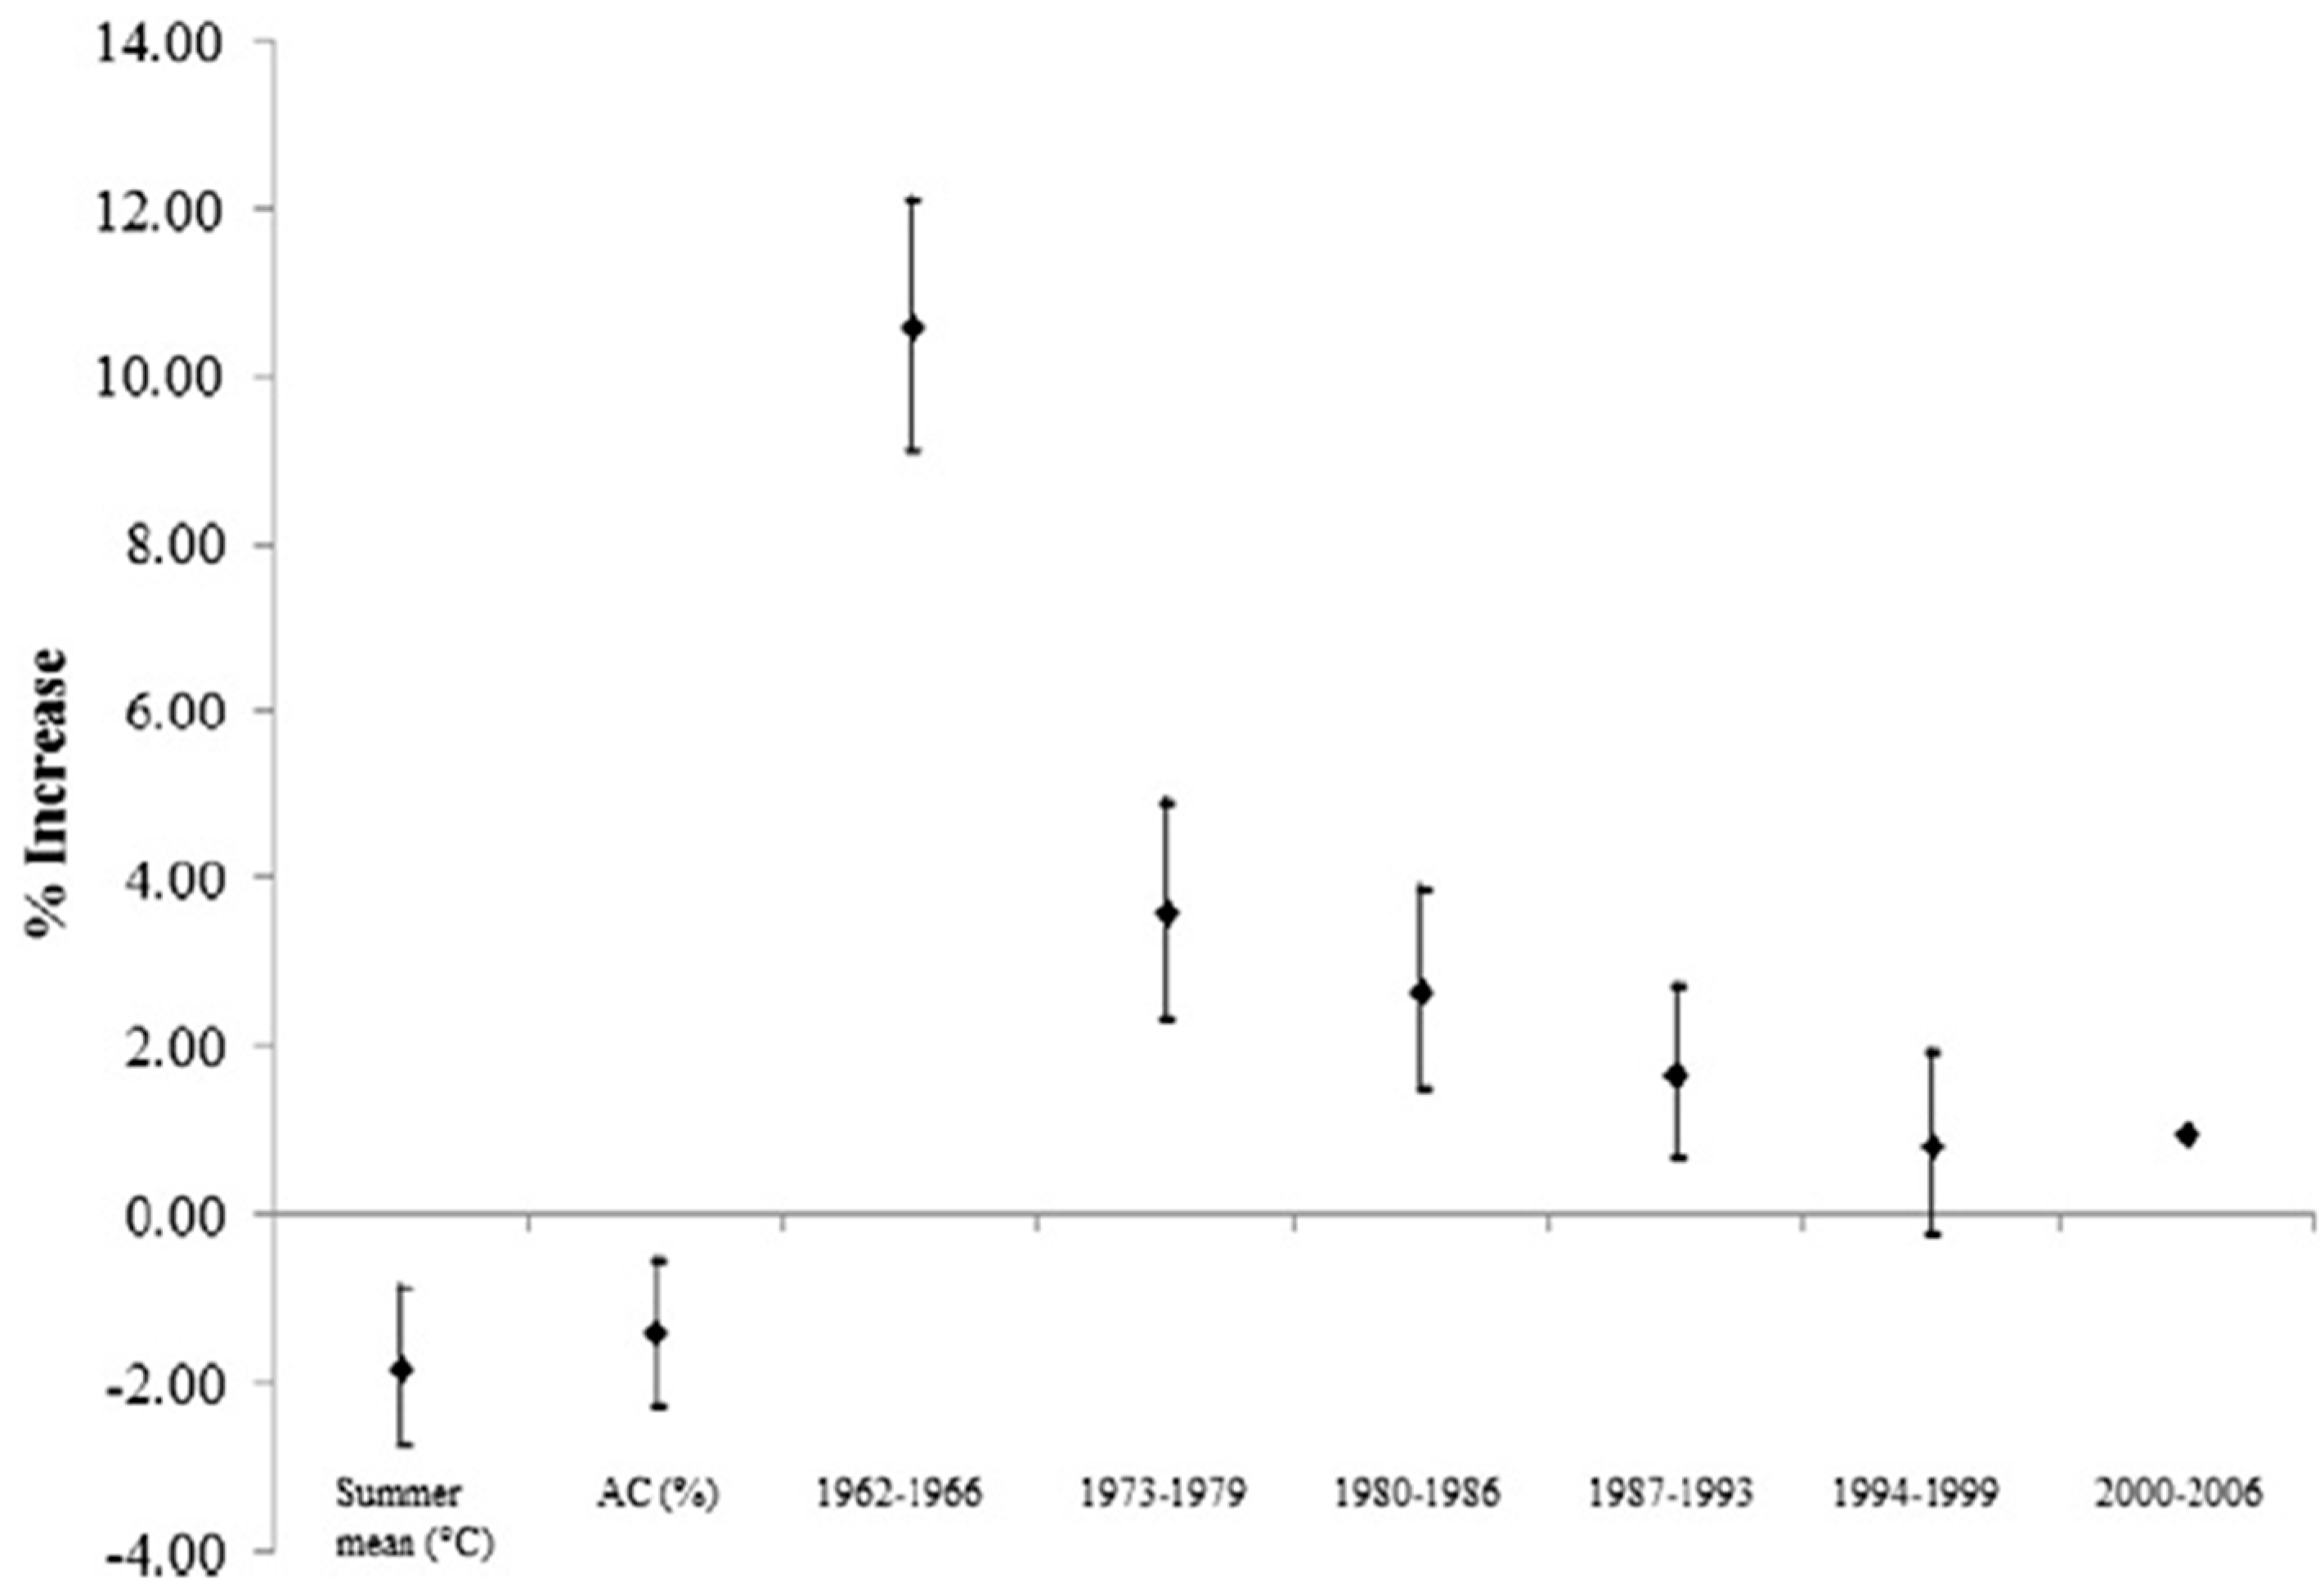
Nordio and colleagues [29] reported declines in heat-related mortality but no change in cold related mortality, from 1962 to 2006 in 211 U.S. cities. This is the largest U.S. daily time series study in both spatial and temporal coverages. Cities were divided into 8 climatological clusters, and analyzed in six 7-year segments. Key results are summarized in Figure 4.
Astrom and colleagues [30] reported a decrease in heat effects in Stockholm over the 20th century, and there was some evidence of a leveling off in recent decades. No change in cold effects was observed. In a follow-up study, the same team reported a steady rise in the MMT over the century [31]. As noted above, the MMT may prove to be a useful metric to model changes over time and space in temperature–mortality ERFs. In France, Todd and Valleron also reported a rise in MMTs over time (1968–2009) as well as a strong dependence of the MMT on the MST [18]. (MMT and MST were correlated at 0.9 in all periods cross sectional correlation analysis.) The rise in the MMT with time corresponded to 0.44 °C per degree temporal rise in the MST. The cross-sectional increase in MMT was 0.76 °C per degree rise in MST. The ratio of these quantities (0.58) may offer one measure of the time lag in adaptation due to warming temperatures, in a country where A/C is probably less of an issue in general.
Carson and colleagues analyzed weekly data from London over the 20th century, and found little evidence for heat-related mortality declines, but this may be an artifact of their analysis method, which analyzed data in weekly units, rather than daily data as usually used elsewhere [32]. In contrast, cold-related mortality declined substantially over the 20th century in four discrete time windows. An earlier study of trends in North Carolina, Southern Finland, and Southeastern England reported declines in heat-related mortality in all three locations, including the latter two where A/C was not prevalent [33]. This suggests economic and general health improvements may play a role in the observed declining heat effects. In an internationally combined analysis of data from 272 cities across seven countries from 1985 to 2009 [34], significant declines in heat-related mortality were seen in the U.S., Japan and Spain; however, there was little evidence for declines seen in the UK and the other countries, though the latter analyses were severely limited by statistical power. Declines in heat-related mortality have also been observed in South Korea, Japan, Taiwan and Vienna, Austria [35,36,37,38,39], with little or no change in cold-related mortality effects investigated. One outlier is a study in Shanghai, China that found no decline in heat-related mortality but saw some evidence for decline of cold-related mortality [40]. An examination of 20-year trends in heat-related mortality in nine European cities found some declines and some increases, though interpretation of these findings is limited by the short duration of study [41].
4. Interpretion of Temporal Trends in Temperature Effects
What factors are responsible for the declining ERF for heat-related mortality? While attribution to specific factors remains elusive, studies have speculated that increasing wealth, enhanced heat-health awareness and prevention measures, general improvements in population health, and housing improvements all could play a role [22,23,32,33,42,43]. One leading explanation, at least in the U.S., is the increasing prevalence of A/C usage in recent decades. There is some empirical support for a role of A/C as a modifier of effects, but a great deal of evidence is cross sectional. For example, A/C prevalence can explain some of the city-to-city differences in effect estimates [7,8]. Longitudinally, the evidence remains incomplete, with some studies reporting a strong role for A/C [25] and others not [24]. It seems likely that the power to test for effect modification over time by A/C has been limited by the coarse temporal scale of A/C survey data (e.g., decadal), and also by the problem of not having A/C usage data that are specific to the vulnerable population subset (the ill, elderly and poor). While potentially effective as an adaptive measure, A/C has several important limitations, including capital and energy cost, carbon- and pollution-generating energy demand, and potential for failure during power outages [19].
A related question is the extent, to which heat adaptation trends are being driven by climate warming itself. After analyzing this question, Christidis and colleagues [43] suggested that trends in heat- and cold-related mortality have more to do with economic and cultural trends than with adjustments to the changing climate. In addition, there has been considerable attention paid to reducing heat-health risks by a range of public actors in the U.S. and Europe in the past two decades. This view is supported by the fact that heat effects have declined quite rapidly over the past several decades during a time when climate has warmed only slightly. This is not to say that climate warming will not affect future adaptation trends, but rather that most of the trends observed to date are likely driven by non-climate factors such as those noted above.
Hondula and colleagues provided a thoughtful review of the role of climate in spatial and temporal trends in adaptation [15]. They reviewed ways in which adaptation has been modeled to date in climate and health projection studies. An important caveat to keep in mind is that the ERF, while declining, is only one component of future risk. Rising temperatures and ageing populations could lead to increasing risks in the future [39,44].
5. Projecting Future Temperature Effects
In a great deal of the past literature projecting future mortality impacts of temperature in a warming climate, no adaptation was assumed [45]. Given the mounting evidence for declines over time in heat effects, ignoring “adaptation” trends likely yields overestimates of future heat impacts on mortality. One simple and intuitive approach to incorporating adaptation is to apply ERFs derived from currently hot cities (e.g., Atlanta, GA, USA) to represent the future ERF in currently cool cities (e.g., New York City, NY, USA) that are projected to have hotter temperatures in the future [46]. This has been termed the “analogue city” method. Some have noted that this approach could yield biases if analogue cities differ from the index city in relevant social, economic, or demographic features that affect risk [47]; however, these factors could be theoretically taken into account in a meta regression context. Another limitation of the analogue city method is that it assumes that the ERF from the analogue city is fixed in time, and not itself changing due to trends in other factors. A related method uses ERFs derived from the hottest “analogue summers” in a given location to estimate future risk [48]. However, this method would only capture short-term acclimatization or inter-annual behavioral adaptations. A recent study modeled adaptation based on the mortality risk on “heat wave days” falling above the 99th percentile of temperature [49]. For future projections, a “no adaptation” scenario used the threshold temperatures observed in the historical baseline period to define heat wave days and associated mortality risk in the 2061–2080 period. An “on pace adaptation” scenario used the 99th percentile temperatures for the future time period to define risk. An intermediate, “lagged adaptation” scenario used 99th percentile temperatures for an intermediate time period (2023–2042) to define heat wave days and risks in the 2061–2080 period. This latter approach incorporates the reasonable assumption that it will take some time for adaptation to occur in a rapidly warming climate.
A few projection studies have made adjustments to the heat slope or MMT of the ERF to represent future conditions [50,51,52]. While in most cases, these adjustments have been made arbitrarily, a more empirical approach was recently reported by Petkova and colleagues, where the ERF in NYC was projected into future, unobserved decades by fitting and extrapolating a non-linear function to the historical trend in effects [53]. Mills and colleagues are the only authors who incorporated both heat and cold adaptation. This is important because even though time trend studies generally do not show measureable changes in cold-related mortality impacts, cross sectional studies show marked differences in the cold ERF depending on the local climate.
How do future mortality projections change when the adaptation assumptions are incorporated? Knowlton et al. provided a useful illustration in [46]. There, heat-related mortality impacts in the 2050s, as compared with those in the 1990s, were modeled with and without an analogue city adjustment to the ERF. Without adaptation, the observed ERF from a time series analysis in NYC was used in both the baseline and future impact assessment. To model adaptation, the ERFs from two analogue cities—Washington DC and Atlanta GA—were averaged. Both cities had current MST within 1 °F of that projected for NYC in the 2050s. Future impacts were reduced by between 28% and 34% depending on the scenario. Other studies using a range of methods have reported a reduction by between 20% and 80% in future impacts under various adaptation assumptions [50,52,53]. A recent comprehensive analysis in 14 European cities applied six different adaptation assumptions for future projections, and concluded that uncertainties related to adaptation were generally larger than those related to climate models and emission scenarios [54].
While available evidence from high-income countries shows that heat effects have been trending downward in recent decades, data gaps and demographic trends add considerable uncertainty to future projections. We have no trend studies in low-income countries, where the epidemiological transition towards increasing chronic disease prevalence, as well as rapid urbanization, may place more people at risk. Additionally, technology-based heat-adaptation measures, such as A/C, may be largely unavailable in low-income settings. We also lack studies of agricultural and construction workers, the homeless, youth athletes and others exposed while engaged in intense physical exertion outdoors [20]. Of particular note is the emerging worldwide epidemic of chronic kidney disease among agricultural workers, which is thought to be partly related to high temperature exposures [55]. In addition, ageing is likely to worsen heat-health risks in the future. Populations are ageing rapidly worldwide, particularly in wealthy countries, and this could lead to increased heat-related mortality risk in the future [56].
6. Summary and Implications
The above review allows us to draw several broad conclusions. Across space, temperature–mortality ERFs for both heat and cold effects differ substantially in ways that appear to depend strongly on prevailing temperatures. In relatively cool climates, the MMT is shifted to the left on the temperature axis, with a shallow cold slope and steep hot slope. In relatively warm climates, the MMT is shifted to the right (higher temperatures), with a steep cold slope and a shallow hot slope. Over time, there is strong evidence that MMTs are rising and that hot slopes are declining, with the particular finding being somewhat dependent on the analytical methods used in individual studies, which are not standardized. There is relatively little evidence for changes in cold slopes over time, in contrast to the cross sectional evidence noted above. Projections of future heat-related mortality that do not take adaptation into account very likely overestimate future heat impacts.
What information can we draw from the current literature to guide future mortality projection studies? There are several possible approaches. As a simple way to incorporate uncertainty regarding adaptation trends, future projections could incorporate sensitivity analyses that apply adjustments to the hot slope ranging from −20% to −80%, a range that is supported by the literature. However, such adjustments would remain somewhat arbitrary, and also would not explicitly take elapsed time into account, which ought to matter in projecting risks of the future.
Alternatively, one could apply a simple time-dependence adjustment by drawing quantitative information on trends in heat slopes based on longitudinal studies such as in [28,29]. The average decadal decline in the heat slope in Petkova’s analysis of the past four decades in NYC was about 31% [28]. Nordio’s analysis over five decades nationally suggested a decadal decline of about 45% on average per decade [29]. Thus, a range of between 30% and 45% decline in the heat ERF per decade could be applied to projections over the next several decades. This approach has the appeal that it is tied to empirical evidence for trends over time. Additional data to support this approach are available from the supplemental materials provided by Nordio et al., where ERFs by cluster and time period are given, along with corresponding climate data. A recent study applied this approach to project future mortality across the U.S. in a changing climate [57].
Another adaptation model that would be supported by the literature is to adjust the MMT upwards as a function of MST, either keeping the hot slope constant or allowing it to be reduced with rising temperatures. Todd and Valleron [18] provided quantitative backing for this approach in France, although A/C is not yet prevalent in this country. [Their study suggests that the temporal change in MMT vs. MST is about 60% of the magnitude of the spatial change in MMT vs. MST, which hints at the pace of adaptation in a changing climate; in other words, we observe about a 60% adjustment to new climate conditions compared to the observed cross sectional differences.] These findings warrant replication using other national datasets. Heat wave-based mortality models are also amenable to simple adaptation adjustments, as in [49].
More generally, international datasets that include mortality and temperature data observed over multiple decades and locations could be further analyzed to better quantify spatial and temporal patterns in heat-related ERF parameters [57], perhaps using simple parameterizations that include a hot slope and a threshold as in [17]. Cold effects could be similarly modeled. The parameters of city-specific fits could then be analyzed in second stage models that relate them to both time per se, and to spatial and temporal differences in mean temperatures.
Finally, it is important to emphasize that this review has focused on trends in heat-related mortality analyzed at the city scale using administrative data in high-income countries, because that is where the literature has focused until now. While these data are of high relevance to public health planning in the context of a changing climate, they miss important aspects of the problem, which should be a priority for research moving forward. In particular, there is an urgent need for studies focusing on low-income countries, and on vulnerable population subgroups such as agricultural and other outdoor workers [20], for whom adaptation options will be much more limited. New study designs and data sources could also help advance the science of heat adaptation, taking advantages of new health and exposure sensors, citizen science, GIS, and big data.
Funding
This work was partially supported by contract # EP-D-14-031 from the U.S. Environmental Protection Agency.
Conflicts of Interest
The authors declare no conflict of interest.
References
- Wang, Y.; Bobb, J.F.; Papi, B.; Wang, Y.; Kosheleva, A.; Di, Q.; Schwartz, J.D.; Dominici, F. Heat stroke admissions during heat waves in 1916 US counties for the period from 1999 to 2010 and their effect modifiers. Environ. Health 2016, 15, 83. [Google Scholar] [CrossRef] [PubMed]
- Madrigano, J.; McCormick, S.; Kinney, P.L. The Two Ways of Assessing Heat-Related Mortality and Vulnerability. Am. J. Public Health 2015, 105, 2212–2213. [Google Scholar] [CrossRef] [PubMed] [Green Version]
- Luber, G.E.; Sanchez, C.A. Heat-Related Deaths—United States, 1999–2003; US CDC: Atlanta, GA, USA, 2006; pp. 796–798. [Google Scholar]
- Matte, T.D.; Lane, K.; Ito, K. Excess mortality attributable to extreme heat in new york city, 1997–2013. Health Secur. 2016, 14, 64–70. [Google Scholar] [CrossRef] [PubMed]
- Semenza, J.C.; Rubin, C.H.; Falter, K.H.; Selanikio, J.D.; Flanders, W.D.; Howe, H.L.; Wilhelm, J.L. Heat-Related Deaths during the July 1995 Heat Wave in Chicago. N. Eng. J. Med. 1996, 335, 84–90. [Google Scholar] [CrossRef] [PubMed] [Green Version]
- Vandentorren, S.; Suzan, F.; Medina, S.; Pascal, M.; Maulpoix, A.; Cohen, J.-C.; Ledrans, M. Mortality in 13 French cities during the August 2003 heat wave. Am. J. Public Health 2004, 94, 1518–1520. [Google Scholar] [CrossRef] [PubMed]
- Curriero, F.C.; Heiner, K.S.; Samet, J.M.; Zeger, S.L.; Strug, L.; Patz, J.A. Temperature and mortality in 11 cities of the eastern United States. Am. J. Epidemiol. 2002, 155, 80–87. [Google Scholar] [CrossRef] [PubMed]
- Anderson, B.G.; Bell, M.L. Weather-related mortality: How heat, cold, and heat waves affect mortality in the United States. Epidemiology 2009, 20, 205–213. [Google Scholar] [CrossRef] [PubMed]
- Kinney, P.L.; Schwartz, J.; Pascal, M.; Petkova, E.; Le Tertre, A.; Medina, S.; Vautard, R. Winter season mortality: Will climate warming bring benefits? Environ. Res. Lett. 2015, 10, 064016. [Google Scholar] [CrossRef] [PubMed]
- Ebi, K.L.; Mills, D. Winter mortality in a warming climate: A reassessment. WIREs Clim. Chang. 2013, 4, 203–212. [Google Scholar] [CrossRef]
- Medina-Ramón, M.; Schwartz, J. Temperature, temperature extremes, and mortality: A study of acclimatization and effect modification in 50 United States cities. Occup. Environ. Med. 2007, 64, 827–833. [Google Scholar] [CrossRef] [PubMed]
- McMichael, A.J.; Wilkinson, P.; Kovats, R.S.; Pattenden, S.; Hajat, S.; Armstrong, B.; Vajanapoom, N.; Niciu, E.M.; Mahomed, H.; Kingkeow, C.; et al. International study of temperature, heat and urban mortality: The ‘ISOTHURM’ project. Int. J. Epidemiol. 2008, 37, 1121–1131. [Google Scholar] [CrossRef] [PubMed]
- Gasparrini, A.; Guo, Y.; Hashizume, M.; Lavigne, E.; Zanobetti, A.; Schwartz, J.; Tobias, A.; Tong, S.; Rocklöv, J.; Forsberg, B.; et al. Mortality risk attributable to high and low ambient temperature: A multicountry study observational study. Lancet 2015. [Google Scholar] [CrossRef]
- Guo, Y.M.; Gasparrini, A.; Armstrong, B.; Li, S.S.; Tawatsupa, B.; Tobias, A.; Lavigne, E.; Coelho, M.; Leone, M.; Pan, X.C.; et al. Global Variation in the Effects of Ambient Temperature on Mortality A Systematic Evaluation. Epidemiology 2014, 25, 781–789. [Google Scholar] [CrossRef] [PubMed]
- Hondula, D.M.; Balling, R.C.J.; Vanos, J.K.; Georgescu, M. Rising temperatures, human health, and the role of adaptation. Curr. Clim. Chang. Rep. 2015, 1, 144–154. [Google Scholar] [CrossRef]
- Barreca, A.; Clay, K.; Deschenes, O.; Greenstone, M.; Shapiro, J.S. Convergence in Adaptation to Climate Change: Evidence from High Temperatures and Mortality, 1900–2004. Am. Econ. Rev. 2015, 105, 247–251. [Google Scholar] [CrossRef]
- Lee, M.; Nordio, F.; Zanobetti, A.; Kinney, P.; Vautard, R.; Schwartz, J. Acclimatization across space and time in the effects of temperature on mortality: A time-series analysis. Environ. Health 2014, 13, 89. [Google Scholar] [CrossRef] [PubMed] [Green Version]
- Todd, N.; Valleron, A.J. Space-Time Covariation of Mortality with Temperature: A Systematic Study of Deaths in France, 1968–2009. Environ. Health Perspect. 2015, 123, 659–664. [Google Scholar] [CrossRef] [PubMed]
- Kinney, P.L.; O'Neill, M.S.; Bell, M.L.; Schwartz, J. Approaches for estimating effects of climate change on heat-related deaths: Challenges and opportunities. Environ. Sci. Policy 2008, 11, 87–96. [Google Scholar] [CrossRef]
- Sheridan, S.C.; Allen, M.J. Temporal trends in human vulnerability to excessive heat. Environ. Res. Lett. 2018, 13, 043001. [Google Scholar] [CrossRef] [Green Version]
- Arbuthnott, K.; Hajat, S.; Heaviside, C.; Vardoulakis, S. Changes in population susceptibility to heat and cold over time: Assessing adaptation to climate change. Environ. Health 2016, 15, S33. [Google Scholar] [CrossRef] [PubMed]
- Boeckmann, M.; Rohn, I. Is planned adaptation to heat reducing heat-related mortality and illness? A systematic review. BMC Public Health 2014, 14, 1112. [Google Scholar] [CrossRef] [PubMed]
- Davis, R.E.; Knappenberger, P.C.; Michaels, P.J.; Novicoff, W.M. Changing heat-related mortality in the United States. Environ. Health Perspect. 2003, 111, 1712–1718. [Google Scholar] [CrossRef] [PubMed]
- Bobb, J.F.; Peng, R.D.; Bell, M.L.; Dominici, F. Heat-Related Mortality and Adaptation to Heat in the United States. Environ. Health Perspect. 2014, 122, 811–816. [Google Scholar] [CrossRef] [PubMed] [Green Version]
- Barreca, A.; Clay, K.; Deschenes, O.; Greenstone, M.; Shapiro, J.S. Adapting to Climate Change: The Remarkable Decline in the U.S. Temperature-Mortality Relationship over the 20th Century; Working Paper 18692; National Bureau of Economic Research: Cambridge, MA, USA, 2013. [Google Scholar]
- Deschenes, O.; Greenstone, M. Climate Change, Mortality, and Adaptation: Evidence from Annual Fluctuations in Weather in the US. Am. Econ. J.-Appl. Econ. 2011, 3, 152–185. [Google Scholar] [CrossRef] [Green Version]
- Deschenes, O. Temperature, human health, and adaptation: A review of the empirical literature. Energy Econ. 2014, 46, 606–619. [Google Scholar] [CrossRef]
- Petkova, E.P.; Gasparrini, A.; Kinney, P.L. Heat and Mortality in New York City Since the Beginning of the 20th Century. Epidemiology 2014, 25, 554–560. [Google Scholar] [CrossRef] [PubMed]
- Nordio, F.; Zanobetti, A.; Colicino, E.; Kloog, I.; Schwartz, J. Changing patterns of the temperature-mortality association by time and location in the US, and implications for climate change. Environ. Int. 2015, 81, 80–86. [Google Scholar] [CrossRef] [PubMed]
- Astrom, D.O.; Forsberg, B.; Edvinsson, S.; Rocklov, J. Acute Fatal Effects of Short-Lasting Extreme Temperatures in Stockholm, Sweden Evidence Across a Century of Change. Epidemiology 2013, 24, 820–829. [Google Scholar] [CrossRef] [PubMed]
- Astrom, D.O.; Tornevi, A.; Ebi, K.L.; Rocklov, J.; Forsberg, B. Evolution of Minimum Mortality Temperature in Stockholm, Sweden, 1901-2009. Environ. Health Perspect. 2016, 124, 740–744. [Google Scholar] [CrossRef] [PubMed]
- Carson, C.; Hajat, S.; Armstrong, B.; Wilkinson, P. Declining vulnerability to temperature-related mortality in London over the 20th century. Am. J. Epidemiol. 2006, 164, 77–84. [Google Scholar] [CrossRef] [PubMed]
- Donaldson, G.C.; Keatinge, W.R.; Nayha, S. Changes in summer temperature and heat-related mortality since 1971 in North Carolina, South Finland, and Southeast England. Environ. Res. 2003, 91, 1–7. [Google Scholar] [CrossRef]
- Gasparrini, A.; Guo, Y.; Hashizume, M.; Kinney, P.L.; Petkova, E.P.; Lavigne, E.; Zanobetti, A.; Schwartz, J.D.; Tobias, A.; Leone, M.; et al. Temporal Variation in Heat-Mortality Associations: A Multicountry Study. Environ. Health Perspect. 2015, 123, 1200–1207. [Google Scholar] [CrossRef] [PubMed] [Green Version]
- Ha, J.; Kim, H. Changes in the association between summer temperature and mortality in Seoul, South Korea. Int. J. Biometeorol. 2013, 57, 535–544. [Google Scholar] [CrossRef] [PubMed]
- Onozuka, D.; Hagihara, A. Variation in vulnerability to extreme-temperature-related mortality in Japan: A 40-year time-series analysis. Environ. Res. 2015, 140, 177–184. [Google Scholar] [CrossRef] [PubMed]
- Matzarakis, A.; Muthers, S.; Koch, E. Human biometeorological evaluation of heat-related mortality in Vienna. Theor. Appl. Climatol. 2011, 105, 1–10. [Google Scholar] [CrossRef]
- Chung, Y.; Noh, H.; Honda, Y.; Hashizume, M.; Bell, M.L.; Guo, Y.L.L.; Kim, H. Temporal Changes in Mortality Related to Extreme Temperatures for 15 Cities in Northeast Asia: Adaptation to Heat and Maladaptation to Cold. Am. J. Epidemiol. 2017, 185, 907–913. [Google Scholar] [CrossRef] [PubMed] [Green Version]
- Lee, W.; Choi, H.M.; Kim, D.; Honda, Y.; Guo, Y.L.L.; Kim, H. Temporal changes in mortality attributed to heat extremes for 57 cities in Northeast Asia. Sci. Total Environ. 2018, 616, 703–709. [Google Scholar] [CrossRef] [PubMed]
- Yang, C.Y.; Meng, X.; Chen, R.J.; Cai, J.; Zhao, Z.H.; Wan, Y.; Kan, H.D. Long-term variations in the association between ambient temperature and daily cardiovascular mortality in Shanghai, China. Sci. Total Environ. 2015, 538, 524–530. [Google Scholar] [CrossRef] [PubMed]
- de' Donato, F.K.; Leone, M.; Scortichini, M.; De Sario, M.; Katsouyanni, K.; Lanki, T.; Basagana, X.; Ballester, F.; Astrom, C.; Paldy, A.; et al. Changes in the Effect of Heat on Mortality in the Last 20 Years in Nine European Cities. Results from the PHASE Project. Int. J. Environ. Res. Public Health 2015, 12, 15567–15583. [Google Scholar] [CrossRef] [PubMed] [Green Version]
- Ng, C.F.S.; Boeckmann, M.; Ueda, K.; Zeeb, H.; Nitta, H.; Watanabe, C.; Honda, Y. Heat-related mortality: Effect modification and adaptation in Japan from 1972 to 2010. Glob. Environ. Chang.-Hum. Policy Dimens. 2016, 39, 234–243. [Google Scholar] [CrossRef]
- Christidis, N.; Donaldson, G.C.; Stott, P.A. Causes for the recent changes in cold- and heat-related mortality in England and Wales. Clim. Chang. 2010, 102, 539–553. [Google Scholar] [CrossRef]
- Sheridan, S.C.; Dixon, P.G. Spatiotemporal trends in human vulnerability and adaptation to heat across the United States. Anthropocene 2017, 20, 61–73. [Google Scholar] [CrossRef]
- Sanderson, M.; Arbuthnott, K.; Kovats, S.; Hajat, S.; Falloon, P. The use of climate information to estimate future mortality from high ambient temperature: A systematic literature review. PLoS ONE 2017, 12, e0180369. [Google Scholar] [CrossRef] [PubMed]
- Knowlton, K.; Lynn, B.; Goldberg, R.A.; Rosenzweig, C.; Hogrefe, C.; Rosenthal, J.K.; Kinney, P.L. Projecting heat-related mortality impacts under a changing climate in the New York City region. Am. J. Public Health 2007, 97, 2028–2034. [Google Scholar] [CrossRef] [PubMed]
- Huang, C.R.; Barnett, A.G.; Wang, X.M.; Vaneckova, P.; FitzGerald, G.; Tong, S.L. Projecting Future Heat-Related Mortality under Climate Change Scenarios: A Systematic Review. Environ. Health Perspect. 2011, 119, 1681–1690. [Google Scholar] [CrossRef] [PubMed] [Green Version]
- Hayhoe, K.; Cayan, D.; Field, C.B.; Frumhoff, P.C.; Maurer, E.P.; Miller, N.L.; Moser, S.C.; Schneider, S.H.; Cahill, K.N.; Cleland, E.E.; et al. Emissions pathways, climate change, and impacts on California. Proc. Natl. Acad. Sci. USA 2004, 101, 12422–12427. [Google Scholar] [CrossRef] [PubMed] [Green Version]
- Anderson, G.B.; Oleson, K.W.; Jones, B.; Peng, R.D. Projected trends in high-mortality heatwaves under different scenarios of climate, population, and adaptation in 82 US communities. Clim. Chang. 2018, 146, 455–470. [Google Scholar] [CrossRef] [PubMed]
- Gosling, S.; McGregor, G.; Lowe, J. Climate change and heat-related mortality in six cities Part 2: Climate model evaluation and projected impacts from changes in the mean and variability of temperature with climate change. Int. J. Biometeorol. 2009, 53, 31–51. [Google Scholar] [CrossRef] [PubMed]
- Honda, Y.; Kondo, M.; McGregor, G.; Kim, H.; Guo, Y.-L.; Hijioka, Y.; Yoshikawa, M.; Oka, K.; Takano, S.; Hales, S.; et al. Heat-related mortality risk model for climate change impact projection. Environ. Health Prev. Med. 2014, 19, 56–63. [Google Scholar] [CrossRef] [PubMed]
- Mills, D.; Schwartz, J.; Lee, M.; Sarofim, M.; Jones, R.; Lawson, M.; Duckworth, M.; Deck, L. Climate change impacts on extreme temperature mortality in select metropolitan areas in the United States. Clim. Chang. 2015, 131, 83–95. [Google Scholar] [CrossRef]
- Petkova, E.P.; Vink, J.K.; Horton, R.M.; Gasparrini, A.; Bader, D.A.; Francis, J.D.; Kinney, P.L. Towards More Comprehensive Projections of Urban Heat-Related Mortality: Estimates for New York City under Multiple Population, Adaptation, and Climate Scenarios. Environ. Health Perspect. 2017, 125, 47–55. [Google Scholar] [CrossRef] [PubMed] [Green Version]
- Gosling, S.N.; Hondula, D.M.; Bunker, A.; Ibarreta, D.; Liu, J.G.; Zhang, X.X.; Sauerborn, R. Adaptation to Climate Change: A Comparative Analysis of Modeling Methods for Heat-Related Mortality. Environ. Health Perspect. 2017, 125, 087008. [Google Scholar] [CrossRef] [PubMed] [Green Version]
- Barraclough, K.A.; Blashki, G.A.; Holt, S.G.; Agar, J.W.M. Climate change and kidney disease-threats and opportunities. Kidney Int. 2017, 92, 526–530. [Google Scholar] [CrossRef] [PubMed]
- Li, T.T.; Horton, R.M.; Bader, D.A.; Zhou, M.G.; Liang, X.D.; Ban, J.; Sun, Q.H.; Kinney, P.L. Aging Will Amplify the Heat-related Mortality Risk under a Changing Climate: Projection for the Elderly in Beijing, China. Sci. Rep. 2016, 6, 28161. [Google Scholar] [CrossRef] [PubMed] [Green Version]
- Wang, Y.; Nordio, F.; Nairn, J.; Zanobetti, A.; Schwartz, J.D. Accounting for adaptation and intensity in projecting heat wave-related mortality. Environ. Res. 2018, 161, 464–471. [Google Scholar] [CrossRef] [PubMed]
Figure 1.
From Curriero et al., 2002 [7] showing temperature-mortality risk functions for 11 US cities.
Figure 1.
From Curriero et al., 2002 [7] showing temperature-mortality risk functions for 11 US cities.

Figure 2.
From Lee et al., 2014 [17]. Temperature-mortality risk functions by US region. At (left) is effect of temperature on mortality in January. At (right) is effect of temperature on mortality in July. Between 8–36 cities are included in each region, with effects summarized using meta regression.

Figure 3.
Decadal heat relative risks and 95% confidence intervals in NYC. Note that there is a data gap in mid-century. From Petkova et al., 2014 [28].
Figure 3.
Decadal heat relative risks and 95% confidence intervals in NYC. Note that there is a data gap in mid-century. From Petkova et al., 2014 [28].

Figure 4.
Heat-related mortality effect at 80° vs. 60° F, as a function of summer mean temperature, AC% and time period. From Nordio et al., 2015 [29].
Figure 4.
Heat-related mortality effect at 80° vs. 60° F, as a function of summer mean temperature, AC% and time period. From Nordio et al., 2015 [29].

© 2018 by the author. Licensee MDPI, Basel, Switzerland. This article is an open access article distributed under the terms and conditions of the Creative Commons Attribution (CC BY) license (http://creativecommons.org/licenses/by/4.0/).
Share and Cite
MDPI and ACS Style
Kinney, P.L. Temporal Trends in Heat-Related Mortality: Implications for Future Projections. Atmosphere 2018, 9, 409. https://doi.org/10.3390/atmos9100409
AMA Style
Kinney PL. Temporal Trends in Heat-Related Mortality: Implications for Future Projections. Atmosphere. 2018; 9(10):409. https://doi.org/10.3390/atmos9100409
Chicago/Turabian StyleKinney, Patrick L. 2018. "Temporal Trends in Heat-Related Mortality: Implications for Future Projections" Atmosphere 9, no. 10: 409. https://doi.org/10.3390/atmos9100409
Note that from the first issue of 2016, this journal uses article numbers instead of page numbers. See further details here.