1. Introduction
Since the reform and opening up of policy introduction in 1978, China’s economy has engaged in the third scientific and technological revolution, which has grown rapidly to become the world’s second largest economy [
1]. China’s success has occurred partially due to the establishment of a complete industrial system with a high degree of integration among the major industries [
2]. Internet +, industry and city integration, and a sharing economy describe the epitomes of industrial integration. According to iResearch statistics, the scale of transactions in 10 industries, such as online entertainment and online education in China, reached 1146 billion CNY in 2017, a year-on-year growth rate of 49.6%; the transaction scale of the internet consumer finance market exceeded 1000 billion CNY; and mobile payment transaction volume has exceeded 200,000 billion CNY, ranking first in the world [
3]. From 2016 to 2017, the number of shared bicycles increased from 2 to 23 million and expanded to more than 200 cities in China; the number of registered users has increased from 18.87 to 221.23 million, and the cumulative distance traveled increased from 2.51 billion to 29.95 billion kilometers [
4]. Therefore, the great role of industry integration in economic development has been highly valuable to Chinese enterprises and the government.
China’s electronic information industry has developed rapidly with huge demographic dividends. In 2017, the total revenue from the electronic information industry was 18,500 billion CNY, a year-on-year increase of 8.5%; the fixed assets investment was 1300 billion CNY, which was a year-on-year increase of 25.3%; the number of employees was 24.69 million, a year-on-year increase of 9.88% [
5]; and the added value of the above-scale electronic information manufacturing industry increased by 13.8%, and the total profit exceeded 700 billion CNY [
6]. However, the development of the industry still faces many problems, such as low-end industries, lack of core competitiveness, and gradual loss of cheap labor [
7]. The outbreak of incidents of the two Chinese technology giants (ZTE and Huawei) revealed the hidden struggles of China’s electronic information industry [
8]. When determining how to improve international competitiveness and attract high-quality capital to industrial development, the financial industry may play an important role [
9,
10]. As a green industry, the financial industry refers to special industries that operate financial products, including banking, insurance, trust, securities, and leasing [
11]. The financial industry can provide financial services for the real economy, while making transaction methods more convenient and effectively controlling risks, thus improving the reform of corporate governance mechanisms. In 2017, the added value of China’s financial industry exceeded 6,500 billion CNY, a year-on-year increase of 7.8%; the number of employees was 6.89 million, a year-on-year increase of 3.55%; and the total profit of the financial industry was 2860 billion CNY, a year-on-year increase of 9.01% [
12]. Among them, commercial banks realized a net profit of 1750 billion CNY, a year-on-year increase of 6% [
13].
Industrial integration is the trend in industrial development and would promote the optimization and upgrade of industrial structure [
14]. The result of industrial integration is creating a new industrial form, to provide consumers with more humanized and more valuable products, and a more comfortable shopping experience through resource integration, technological innovation, and structural optimization functions, thereby enhancing the competitiveness of industries [
15]. As a representative industry of industrial integration, the big data industry has experienced rapid development in recent years. The global big data market was 315 billion CNY in 2018. The market size will reach 560 billion CNY by 2022, with an average annual compound growth rate of 15.37% [
16]. It is estimated that the size of China’s big data market will reach 28 billion CNY in 2018, and the compound annual growth rate in the next five years is about 27.29% [
16].
We believe that (1) sustainable development must be implemented in a specific economic operation mode, which must be based on industrial development. (2) The mode of industrial development is related to the effect of sustainable development. (3) The improvement of industrial competitiveness is an inherent requirement of sustainable development. The electronic information industry is the pillar industry in China, and the financial industry is an important lever to regulate the modern economy. Whether the integration of these two industries can promote the competitiveness of the electronic information industry was the focus of this study. The remainder of this article is structured as follows:
Section 2 provides a literature review,
Section 3 outlines the model construction and analysis,
Section 4 discusses the influence of industrial integration on the competitiveness of the electronic information industry, and
Section 5 includes our conclusions and recommendations.
2. Literature Review
The study of industrial integration originated from the observation of the phenomenon whereby the application of general technology spreads to different industries. Rosenberg [
17] studied the industrial evolution of the American mechanical equipment industry from 1840 to 1910 and found that the widespread application of general machine manufacturing skills, such as drilling and grinding, in many industries enabled the independence of these general-purpose machines. The equipment industry and this process of independence is called technological convergence. With the wide application of digital technology in the field of information communication, the phenomenon of digital fusion convergence has attracted considerable attention. Yoffie [
18] defined industrial integration as the integration of independent products after the adoption of digital technology. The European Commission reported that industrial integration is a fusion of three aspects: a technology network platform, market and industry alliance, and mergers [
19]. Industrial integration was first formally proposed by Uekusa [
20]. Legewie [
21] thought that industrial integration stemmed from technological progress and the relaxation of regulations, which reduce the barriers between industries through technological innovation and strengthen the competition and cooperation between enterprises. Steiner [
22] stated that industrial integration was a new type of industry, due to the development of information technology, which has changed the characteristics of the original industrial products and market demand, resulting in a change in the competition and cooperation between enterprises in the industry. Uson et al. [
23] thought that industrial integration was a phenomenon in which the established economic activity of an industry crossed that of another industry when an industrial boundary was established in the real economy. The expressions of industrial integration are diverse, but basically refer to the economic phenomenon where the industrial boundaries of different industries have blurred due to mutual integration, mutual intersection and mutual penetration.
To measure industrial integration, James and Jun [
24] used the change data of the network structure to analyze the convergence of the information industry. Empirical studies showed that changes in industrial structure can identify the existence and degree of integration of enterprise integration. Alfonso and Salvatore [
25] used the Herfindahl–Hirschman Index (HHI) to study the technical integration of the electronic information industry. Helleno et al. [
26] also used the HHI to measure the integration degree of the electronic information industry and manufacturing technology. Jiang et al. [
27] used a hierarchical model of informatization and industrialization to analyze the status of Wenzhou’s industrial low-voltage electric clusters, and proposed policy recommendations for promoting the integration of informatization and industrialization in Wenzhou. Throsby [
28] used the Computable General Equilibrium (CGE) model and input–output method to study the way industry integration works and its impact on the economy and society. Cao [
29] constructed an informatization and industrialization integration index evaluation model to evaluate integration from the aspects of integration environment, integration breadth, and integration benefit. Many scholars applied coupling theory to industrial integration. Weick [
30] used coupling theory to study social and economic problems. Chen [
31] analyzed the dynamic coupling evolution mechanism, dynamic coupling process, and evolution trend of strategic emerging industries and traditional industries. Su et al. [
32] analyzed the working condition of the coupling mechanism in the Chinese shipbuilding industry cluster, thus providing analysis of the then-current development of the shipbuilding industry. They found that the coupling degree of China’s strategic emerging industries and traditional industries changed little, which were moderately coupled. Kim et al. [
33] used a large amount of unstructured data to analyze the trend in and model the industrial integration in the United States, and found that the integration model tended to be stable when industrial clusters slowly integrated.
In terms of the impact of industrial integration on industrial development, Dosi [
34] analyzed the role of finance in innovation and industrial integration, and studied the one-way relationship between the two. Rajiv et al. [
35] proposed that enterprises’ application of electronic technology was conducive to reducing costs, and that industrial integration had a positive correlation with industrial performance. Colombo and Grilli [
36] empirically researched the relationship between financial institution loans and high-tech enterprises using 386 high-tech enterprises in Italy. The results showed that financial institution loans had a key role in promoting the development of high-tech enterprises. Englmaier and Reisinger [
37] proposed strengthening the use of information industry resources in the process of manufacturing development, which is conducive to improving the production efficiency and industrial performance of the manufacturing industry. Saviotti and Pyka [
38] developed Nelson’s [
39] theory of co-evolution of technology and institutions, and incorporated technology and financial systems into the framework of collaborative evolution analysis, and described the co-evolutionary conditions and processes of technology and financial systems through the economic development model created by the new industry sector. Colombo et al. [
40] found that information technology has not improved the performance of the manufacturing industry because the level of informatization is low, and a certain lag exists in the effect of industrial integration on the improvement of industrial performance. Forero [
41] stated that information technology could significantly improve technical efficiency and help companies gain a competitive advantage. Brock et al. [
42] found that when spatial externalities were not internalized by enterprises, industrial integration may occur endogenously in a competitive equilibrium, and that the externalities of information technology had a positive impact on total factor productivity (TFP). Anderson and Toffolo [
43] studied the integration of sawmills with pellet plants and combined heat and power (CHP) plants, and found that the two plants could save up to 18% of the sawmill biomass by-products through technology integration, which had a positive impact on improving plant performance. Industrial integration provides considerable development impetus in industries. Oltean et al. [
44] thought that information technology could improve corporate performance. Lozada [
45] suggested that the integration and development of traditional industries and the Internet of Things industry could accelerate the differentiation and reorganization of traditional industries, and that the vertical integration of industries could stimulate the vitality of traditional industries. Nathan [
46] proposed that the coupling degree and coupling coordination degree between China’s information industry and manufacturing industry have a positive correlation with the optimization and upgrading of industrial structure.
Through the literature review, we learned that the phenomenon of industrial integration begins with the diffusion of general technology among industries. With the development of digital and information technology, the industrial integration caused by technology is so obvious that technological innovation is considered by the early industrial integration research to be the core factor that causes the integration between industries. The first to integrate with the electronic information industry was the traditional manufacturing industry. At present, most of the research results have mainly concentrated on the analysis of the integration of the industry and the electronic information industry. However, the integration of the electronic information industry and other non-manufacturing industries is increasingly being studied and the integration of the electronic information industry and emerging industries has begun to enter the field of research. For example, in the integration of the electronic information industry and financial industry, the translation of breakthrough of economic research to action should be a research direction of industrial integration. In terms of research methods, the HHI, correlation coefficient method, and input–output method were used to measure the degree of coupling coordination between industries. For the impact of the industrial integration on industrial development, some researchers reported that industrial integration has a positive impact on industrial competitiveness, whereas others thought there is no significant impact. In this paper, we analyzed the integration of the two major industries by first measuring the coupling degree of the electronic information industry and the financial industry. Then used the entropy method and vector auto-regression model (VAR) to analyze the impact of industry integration on the competitiveness of the Chinese electronic information industry. Finally, on this basis, we provide systematic policy recommendations for improving the competitiveness of China’s electronic information industry. In short, we expanded the boundaries of industrial integration research. Empirical research on industrial integration mostly focused on the integration of manufacturing and manufacturing in the past, while the integration of manufacturing and service industries was more biased towards qualitative research. But now, we use empirical methods to study the integration of the electronic information industry and financial industry. In addition, we broke through the evaluation system of single competitiveness. Previous studies have been compared in similar industries to derive relevant indices of industrial competitiveness. We study industrial competitiveness from the perspective of industrial integration, and no longer judge the competitiveness from individual or multiple industry indicators. This will help to improve the competitiveness of the industry from the perspective of industrial synergy development.
3. Model Constructions and Analysis
Three main methods are available to estimate industrial integration: index measurement algorithm, correlation coefficient between industries, and the input–output method. Felicia and Nicholas [
47] selected 32 companies between 1930 and 1990, and used the correlation coefficient of inter-industry patents to measure the degree of integration between industries. Pichler et al. [
48] used the input–output method to measure the degree of European financial integration, then studied the impact of the financial integration process on the European economy. Yuan [
49] used the industrial coupling coordination degree index to study the level of integration between China’s environmental protection industry and the rubber manufacturing industry. Hagedoorn and Schakenraad [
50] chose Europe as the research object and empirically found that the electronic information and textile industries had a good state of coordination. The patent data for the index method and the patent coefficient method, which both show the technical integration between enterprises, can be difficult to obtain, and the input–output method has limitations in the assumption, preparation, and optimization of the model. Therefore, we used the degree of coupling coordination to estimate and evaluate the level of industrial integration.
3.1. Coupling Model
3.1.1. Coupling Concept
The concept of coupling originated from the field of physics, appearing in communication engineering and software engineering as coupling capacitors and system coupling. In physics, coupling refers to the interaction and mutual influence between two or more systems [
51]. From the perspective of synergy, the order and structure of the system, when reaching the critical region, depend on the coupling between multiple subsystems in the system and their coordination degree [
52]. The concept of “coupling” has been extended to many fields of social science. Many scholars refer to the objective things that combine two or more social phenomena to function as coupling and use the coupling model in physics to quantitatively analyze the degree of coupling coordination. In this paper, the two subsystems that connect and promote each other in the electronic information industry and financial industry were defined as the “electronic information industry–financial industry” coupling system. The coupling degree model and coupling coordination degree model were used to measure the level of integration between the two industries.
3.1.2. Power Function
The variable
Ui (
i = 1,2) represents the comprehensive order parameter of the coupling system of the electronic information industry and financial industry development, and
Xij represents the index value of the
jth index
Uij of the
ith order parameter. When the system tends to stabilize the critical point, the upper and lower limits of each order parameter are represented by
αij, and
βij [
53]. Then the power function is expressed as Equations (1) and (2):
where
X’ij is the magnitude of the function of the variable to the
Xij system, and the value is between 0 and 1. When the value is closer to 1, the contribution to the system is larger.
3.1.3. Calculation of Coupling Coordination
We established a coupled system model including the development of the electronic information industry and financial industry using linear weighting method to calculate the contribution of each subsystem to the order of the total system [
54]:
where
is weight of each indicator. Using the concept of information entropy to determine the weight, the
jth indicator of the
ith order parameter is:
The total contribution of each program to attribute
Xj is:
Then, the weight of each attribute is
and
= 1 −
= 1, as per
where
C is set as the degree of coupling between the electronic information industry and the financial industry. The coupling system of the electronic information industry and financial industry is composed of
k subsystems, and its specific coupling degree is:
Then, the model of the coupling degree between the electronic information industry and financial industry can be defined as:
The coupling value
C is between 0 and 1. The larger the
C, the higher the degree of coordination between the electronic information industry and financial industry, and vice versa. Equation (4) shows that when
C = 0, the correlation between the electronic information industry and the financial industry system is extremely low and in a completely uncoupled phase; when 0 <
C ≤ 0.3, the two systems are in a low level coupling stage, the electronic information industry is still very weak, and the financial industry is also lagging; when 0.3 <
C ≤ 0.5, the two systems are in a Stationary stage, and the electronic information industry has already reached a certain scale. The impact on the financial industry begins to appear, and the development of the electronic information industry has improved; When 0.5 <
C ≤ 0.8, the two systems are in the running-in phase, the electronic information industry and financial industry have all rapidly improved, and the system enters a period of rapid development; when 0.8 <
C < 1, the two systems are in a high-level coupling phase; and when
C = 1, a benign resonant coupling between the two systems leads to a new ordered structure as shown in
Table 1 [
55].
Since coupling is composed of two aspects, coordination and development, although the scores of the two subsystems’ comprehensive order parameters
U1 and
U2 are relatively low, the degree of coupling between them is higher when the scores of the two are inconsistent. It is possible to be misled by relying solely on the degree of coupling, so the degree of coupling must be measured from these two aspects. Therefore, we further constructed a model that could reflect the degree of mutual coupling, and simultaneously effectively measure the coupling degree of the electronic information industry and financial industry and the degree of contribution to the system. To fulfill the above requirements, the calculation method of the system coupling degree was revised, and the coupling degree model of the electronic information industry–financial industry system was constructed. The algorithm can be expressed as:
where
C is the degree of coupling,
D is the degree of coupling coordination, and
T is the comprehensive evaluation index of the development of the electronic information industry and the financial industry, which reflects the overall level of synergy between the two.
T =
a ×
U1 +
b ×
U2,
a +
b = 1, where
a and
b represent the contribution coefficient of the development of the electronic information industry and financial industry, respectively. The values of
a and
b are to be determined.
To distinguish the degree of coupling and coordination between the electronic information industry and financial industry, it is necessary to classify the degree of coupling coordination. The representative of the coupling coordination degree evaluation standard is the classification standard created by Tanaka [
56], as shown in
Table 2.
3.2. Indicator Selection and Weight
According to the coupling and interaction between the electronic information industry and the financial industry, to fully determine the degree of coupling coordination, we constructed a first-level indicator system of two subsystems from three aspects: scale, growth, and efficiency, and each level was set up under the first level indicator [
57]. Scale refers to the size of the output or size of the operation of industry, growth is the ability to expand the operations of an industry, and efficiency reflects the productivity level of an industry [
58]. The scale indicator includes the industry added value, increase in value as a percentage of gross domestic product (GDP), and total industrial assets. The growth indicator includes the industrial total asset growth rate, industrial employment growth rate, and industrial fixed assets investment growth rate. The efficiency indicator includes the industrial return on equity, industry net profit growth rate, and industrial employment contribution rate. Three secondary indicators and the specific evaluation index systems are shown in
Table 3.
In the financial industry subsystem, the scale indicator has a weight of 0.3537, of which industry added value, increase in value as a percentage of GDP, and total industrial assets have weights of 0.1231, 0.1032, and 0.1274, respectively; the growth indicator has a weight of 0.3508, of which industrial total asset growth rate, industrial employment growth rate, and industrial fixed assets investment growth rate have weights of 0.0597, 0.1951, and 0.0960, respectively; and the efficiency index has a weight of 0.2955, of which industrial return on equity, industrial net profit growth rate, and industrial employment contribution rate have weights of 0.0631, 0.1273, and 0.1051, respectively. In the electronic information industry subsystem, the scale indicator has a weight of 0.2495, of which industry added value, increase in value as a percentage of GDP, and total industrial assets have weights of 0.0988, 0.0875, and 0.0632, respectively; the growth indicator has a weight of 0.4547, of which industrial total asset growth rate, industrial employment growth rate, and industrial fixed assets investment growth rate have weights of 0.1789, 0.1711, and 0.1047, respectively; the efficiency index has a weight of 0.2958, of which industrial return on equity, industrial net profit growth rate, and industrial employment contribution rate have weights of 0.0559, 0.1879, and 0.0720, respectively.
The data in this study were obtained from the China Statistical Yearbook [
59], China Electronic Information Industry Statistical Yearbook [
5], China Financial Yearbook [
12], and China’s economic and social big data platform [
60].
3.3. Estimation of Industrial Integration Level
According to the evaluation model of the industrial integration level constructed above, the weight of each specific index in the index system was first calculated using the entropy method, as shown in
Table 3. Then, the annual electronic information was estimated based on the estimation method of the coupling degree and coupling coordination degree. The industrial comprehensive contribution value is U, financial industry comprehensive contribution value is G, coupling correlation degree is C, and the coupling coordination degree is D. Finally, according to the coupling coordination degree classification standard in
Table 2, we determined the annual coordination degree of the electronic information industry and the financial industry, as shown in
Table 4. From 2008 to 2017, the average added value of the financial industry in GDP was 7.01%, and the average added value of the electronic information industry was 3.50%. The added value of the financial industry was about twice that of the electronic information industry. Assuming that only the financial industry and the electronic information industry exist in the economic system, the contribution ratio of the financial industry is 2/3, and the contribution ratio of the electronic information industry is 1/3 [
61]. So, the contribution coefficient
a of the electronic information industry is 1/3, and the contribution coefficient
b of the financial industry is 2/3.
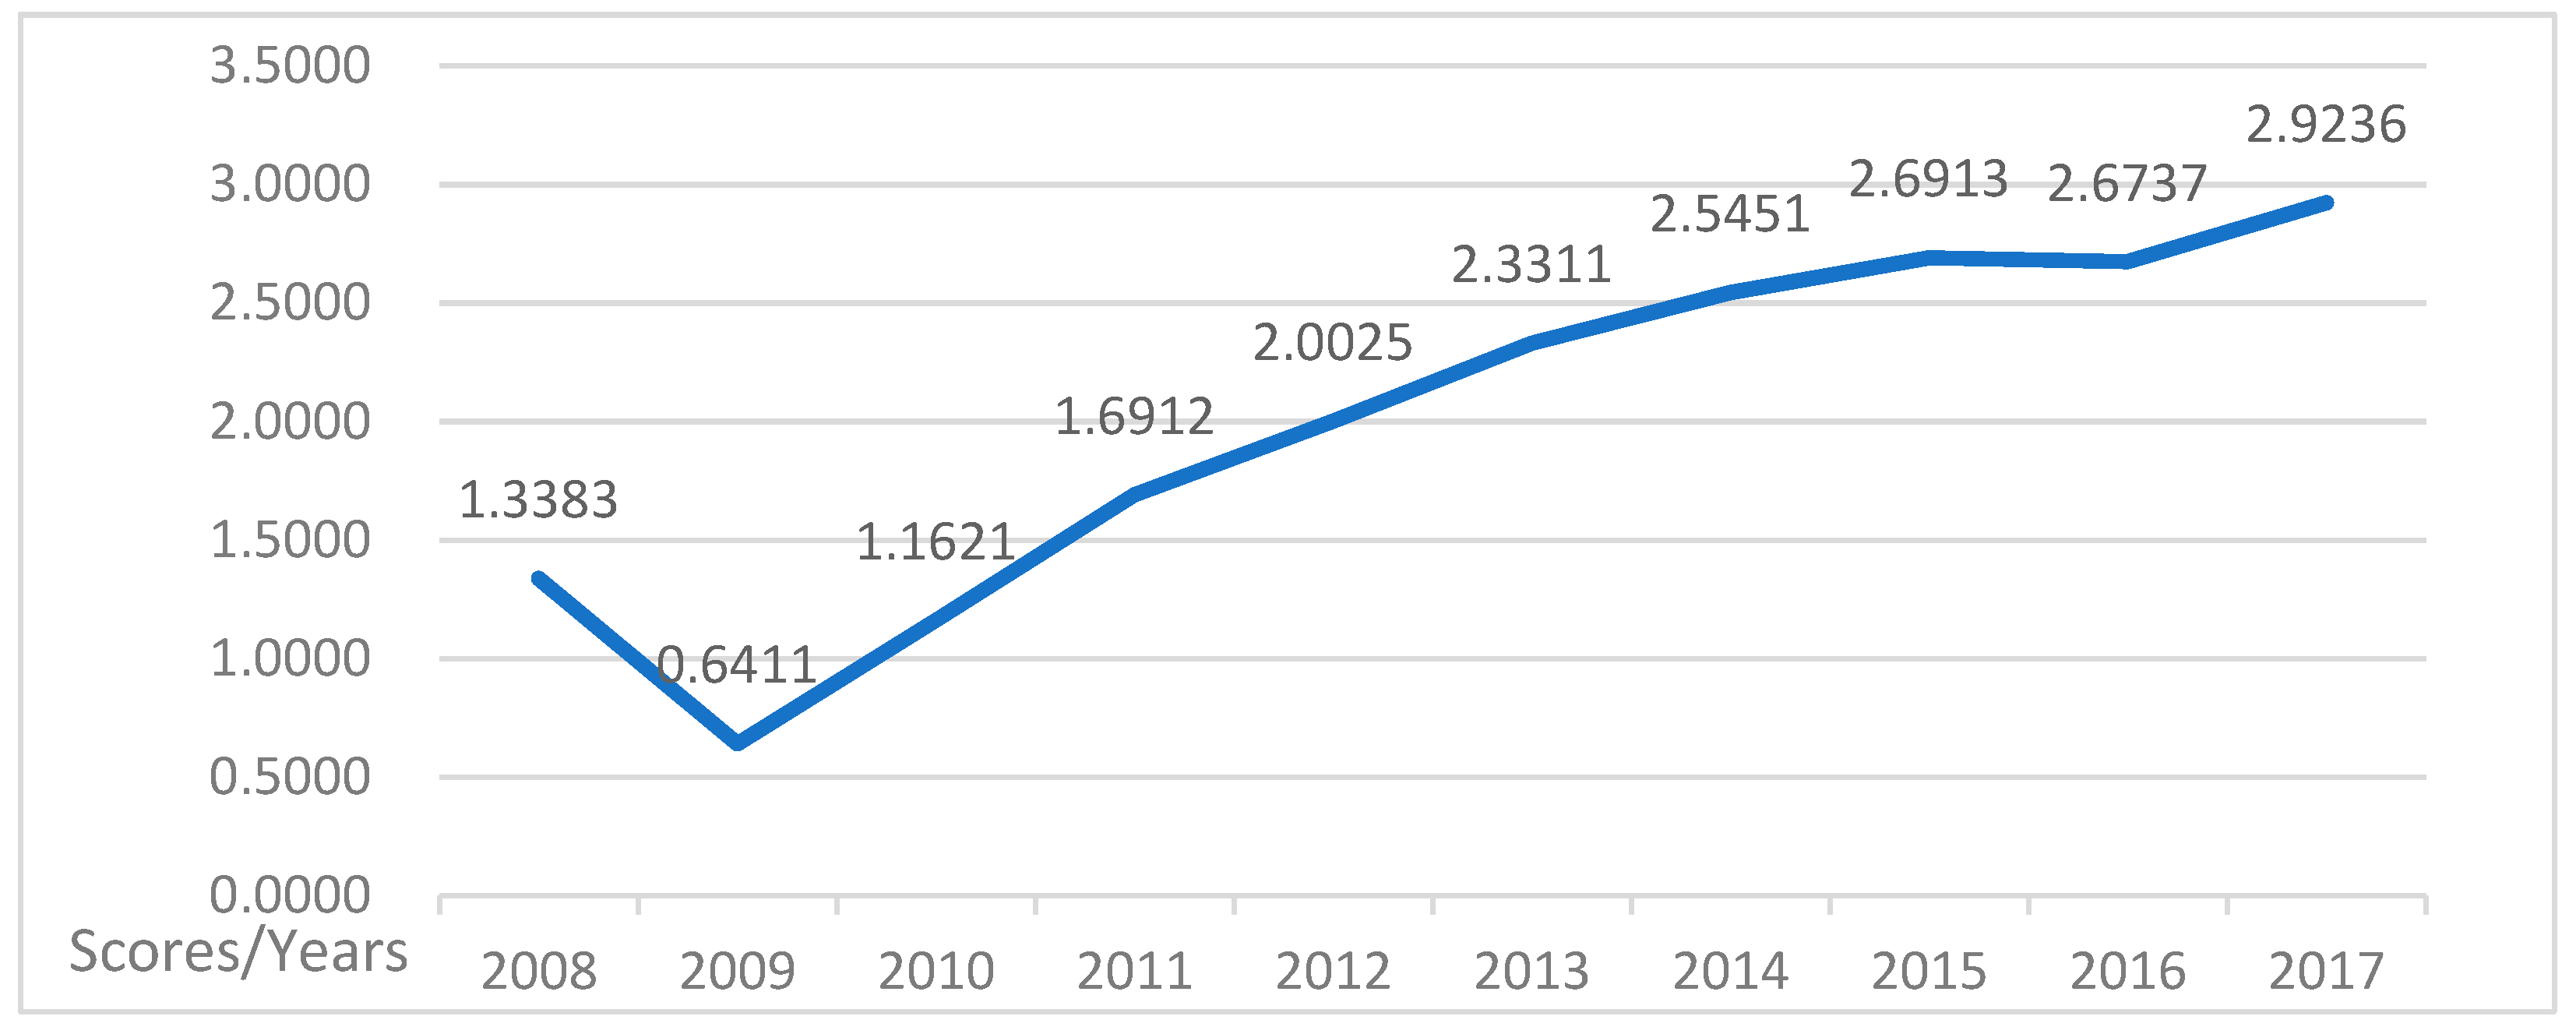
From the perspective of the coupling degree, the coupling degree between China’s electronic information industry and financial industry ranged from 0.9 and 1 with a minimal change. This shows that there was a strong coupling relationship between the two industries. There was a strong correlation between the subsystems of these two industries, which promotes benign interactive development. From the perspective of coupling coordination degree, the electronic information industry and the financial industry were basically in a state of volatility, with coordination ranging from primary coordination to the intermediate level, and the coupling relationship between the two was strong. The main reason for the decline in coordination level in 2009 was the impact of the 2008 financial crisis. The coordination degree after 2011 exceeded the level before the financial crisis, and reached a good coordination state in 2015, and has remained stable since then.
5. Conclusions and Recommendations
Sustainable development is a concept with a sustainable approach and development. It refers to the development model that meets the needs of the present generation under the conditions of protecting the environment and is forward-looking without damaging the needs of future generations. Sustainable development must be implemented in a specific economic operation model, which is based on industrial development. Therefore, the mode of industrial development is related to the effect of sustainable development. There are three questions that must be answered to achieve sustainable development. What are the inherent requirements for sustainable development? What industries are important for sustainable development? In what ways is sustainable development achieved?
To answer the three questions, based first on the coupling model, and then on the stability test of industrial integration and the industrial competitiveness index, and finally results of VAR and the Granger causality relation test, we found (1) the coupling degree ranged from 0.9 to 1 with minimal changes and that a strong coupling relationship existed between the electronic information industry and financial industry. The coupling coordination degree ranged between 0.59 and 0.80, with a coordination level ranging from primary to intermediate coordination. The coordination degree after 2011 exceeded the level before the financial crisis, and reached a good coordination state in 2015, and has remained stable since then. (2) Since VAR is sensitive to the response of the lag period, the lag period can be selected according to the minimum criterion of the AIC and SC values. The lag period selected in this paper was two. (3) The premise of VAR and the Granger causality relation test is that the indicator data are stationary. The unit root test results for IC with a lag period of two showed that the IC was stable at the 1%, 5%, and 10% significance levels; the unit root test results for IID with a lag period of two showed that the IID was stable at the 1%, 5%, and 10% significance levels. (4) The integration of China’s electronic information and financial industries have a positive impact on the competitiveness of the electronic information industry. When other conditions remained unchanged, if the IID increases by 1 unit, the IC increases by 0.125433 in lag phase 1 and 0.369962 in lag phase 2. (5) A unilateral causal relationship exists between industrial integration and industrial competitiveness; that is, industrial integration is the Granger cause of industrial competitiveness, but industrial competitiveness is not the Granger cause of industrial integration.
With the continuous advancement of Industry 4.0 [
65] and Made in China 2025 [
66], industrial integration has become an important process to promote industrial competitiveness. Industrial competitiveness, especially the competitiveness of the electronic information industry, plays an important role in enhancing China’s overall national strength. First, as part of the economic power, industrial competitiveness will affect the strength between countries. In the information age, the electronic information industry and its products have entered various fields of international competition. Secondly, China has been in a turning point in social development, and its international influence has been continuously improved, but international friction and controversy have also increased. The reason is that the old order is loosening, and the new order has not yet formed. It is a good way to break through key areas and be far ahead of competitors, such as the development of 5G communication technology and artificial intelligence. Third, the industrial integration model of smart cities, big data, and cloud computing will help promote the network sharing, intensive integration, collaborative development, and efficient utilization of social production factors, which will significantly improve the economic operation level and efficiency. China’s electronic information industry has established a relatively complete industrial system after undergoing a development process. However, when compared with foreign developed countries, there are still shortcomings such as a low level of integration, lack of core technology, and weak independent innovation. So, to promote the integration of the electronic information industry and further enhance the level of industrial competitiveness, we propose the following policy recommendations:
(1) In terms of government services, the Notice of the State Council on Printing and Distributing Certain Policies for Encouraging the Development of the Software Industry and the Integrated Circuit Industry was issued. The national science and technology major projects have created a good policy environment for the development of China’s integrated circuit industry. We need to further improve government services in the future. First, we should further relax government regulations and various restrictions imposed on enterprises, promote the reform of mixed ownership of state-owned enterprises and further enhance the independent decision-making power of enterprises. If the government imposes various complicated and strict restrictions on enterprises, it will undoubtedly negatively affect the enthusiasm of entrepreneurs and the process of integration between industries. Second, it is necessary to encourage enterprises to improve the level of technological innovation, and accelerate the speed of industrial integration through the development of science and technology, so as to promote new industrial forms and improve industrial competitiveness. Finally, the government should pay attention to the system construction of intellectual property protection and fully protect the intellectual resources of the electronic information industry, so that enterprises have no worries in the process of investing in research and development.
(2) In terms of technology upgrades, technological innovation is the driving force for industrial integration. Technological innovation leads to technological integration, and the emergence of technological integration leads to changes in production technology. Then, technical barriers gradually disappear, blurring the boundaries of the industry, and the result is industrial integration. Therefore, industrial integration is based on technology integration, and technological innovation plays a catalytic role in the occurrence of industrial integration. China’s electronic information industry has a low starting point and a weak technical foundation; the industry is far behind those of developed countries in terms of operating systems, chips, and integrated circuits. More recently, China has rapidly improved the development level of its information industry by introducing this foreign technology. However, while introducing technology, it did not pay attention to the digestion and innovation of technology, which has led to a serious shortage of core technologies in these industries, which has affected the sustainable development of the industry. Therefore, if China’s electronic information industry tries to integrate with other industries, such as integration with the financial industry, it should consciously promote innovation of its own technology and promote the technology within industry integration, thereby gradually eliminating the technical barriers between industries.
(3) In terms of industry integration, first, we must pay attention to business integration and market integration. Business integration and market integration are essential prerequisites for the realization of industrial integration. Enterprises must constantly develop new products and open new markets to adapt to the development trend of industrial integration. Second, we must actively cultivate new formats that emerge during the process of industrial integration. Industrial penetration, industrial crossover, and industrial restructuring are three methods of industrial integration. The formation of these three methods will have new industrial forms, which are often the fastest-growing and most profitable sectors. Actively cultivating these new formats will play an important role in improving the efficiency of the electronic information industry and promoting the optimization and upgrading of the industrial structure. Finally, we must pay attention to the role of leading enterprises. Large-scale enterprises can promote the collaborative innovation of small and medium-sized enterprises, and strengthen the connection with small- and medium-sized enterprises, through the division of labor in the production chain to gain the comprehensive advantages of professional aggregation and diverse aggregation.
(4) In terms of effective capital access, a financial support system must be established to provide an investment and financing platform for the electronic information industry. First, bank loans can be used as the main financial channel to support the shortage of funds in the day-to-day operations of the electronic information industry. Second, insurance companies need to be encouraged to develop technology insurance for electronic information companies in the industries that need to take on huge investment risks and to ensure the supply of technology risk funds. Third, the government and other relevant departments can establish a securities investment insurance system. Through joint ventures of securities, insurance, and information technology companies, we can establish joint venture finance to provide strong support for the technical and financial needs of the electronic information industry. Finally, large- and medium-sized information technology enterprises must take effective measures in the development process, use all favorable conditions to attract venture capital, or establish joint venture investment funds to create a more diverse and scientific investment pattern.
Finally, we answer the three questions. To answer the first question, improving industrial competitiveness is an inherent requirement for sustainable development. The low competitiveness of the industry indicates that the industry is not performing well in controlling costs, reducing resource consumption, and improving production efficiency. The improvement of industrial competitiveness shows that the industry performs better in these aspects. Only competitive enterprises or industries can gain an active position in the fierce market competition, thus creating conditions for sustainable development. To answer the second question, financial industry and electronic information industry are important for sustainable development. The financial industry is an industry with few environmental pollutions and is one of the representative industries of the modern high-end service industry. The development of the electronic information industry may have adverse effects on the environmental industry, such as water pollution and land pollution caused by heavy metal pollution, and may also have few adverse effects on the environment through industrial upgrading. Therefore, the development of these two industries is of great significance for sustainable development. To answer the third question, industrial integration is an important way to enhance industrial competitiveness and achieve sustainable development. Industrial integration can promote the efficient use of resources, break the inherent development model to solve the problem of insufficient coordination of industrial development, and achieve the optimization and upgrading of industrial structure.


