Performance Evaluation of Major Asian Airline Companies Using DEA Window Model and Grey Theory


1
Department of Industrial Engineering and Management, National Kaohsiung University of Science and Technology, Kaohsiung 80778, Taiwan
2
Department of Supply Chain Management, National Kaohsiung University of Science and Technology, Kaohsiung 81157, Taiwan
*
Authors to whom correspondence should be addressed.
Sustainability 2019, 11(9), 2701; https://doi.org/10.3390/su11092701
Submission received: 16 March 2019
/
Revised: 28 April 2019
/
Accepted: 4 May 2019
/
Published: 13 May 2019
Abstract
:Being an essential part of the global transport system, airline transportation is capable of delivering fast service for passengers and commodities. In the past decade, the Asia aviation industry has experienced a high growth rate of transport due to higher economic development in this area, and this trend is expected to continue in the next two decades. However, competition in the Asia aviation industry will increase dramatically. To survive in the Asia aviation industry, the Asia airline companies should understand their current and future performance. A methodology for this purpose is required. This paper proposes a hybrid approach, combining Grey model GM(1,1) and Data Envelopment Analysis (DEA) Window model, to satisfy this need. The hybrid approach proposed in this research has been used to evaluate the current and future performance of 16 major Asia airline companies. The DEA Window analysis showed that airline companies Emirates, Cebu Pacific, and Sri Lankan were leading companies in the time period of 2012 to 2016, while Singapore Airlines, Japan Airlines, and All Nippon Airways followed behind. We found that Chinese airline corporations are rising in the Asia aviation industry. All 16 Asia airline companies studied in the research were found to improve their productivity in the time period of 2017 to 2021 as their Malmquist productivity indexes (MPIs) are greater than 1.
1. Introduction
The aviation business has a prosperous future due to increasing transports of travelers and commodities. The aviation industry has generated numerous jobs and contributed substantial economic growth for many countries. Pointed out by the CEO of IATA (the International Air Transport Association), 58 million jobs and 2400 billion US dollars of revenue have been generated for the aviation industry [1].
In addition, air transport also helps cross-country exchanges, including cultural exchanges. Combinations with other transport means, such as water and land, can lead to greater benefit and convenience for customers. The development of airline transport is unstoppable.
The Asia airline industry has experienced incredible growth in the last decade. In 2015, the Asian airline industry had achieved a positive cash flow since 2010, and there are 230 Asian airline companies that together own 27% of all planes worldwide [2]. In 2016, Asian aviation generated a $7.3 billion net profit and demand growth was expected to be 9.2%, a figure much higher than supply growth of 8.1%. In 2016, the load factor hit a record high, standing at 80%, while the operational expenses were reduced due to lower fuel price and increased productivity. Asia was expected to have the highest traveling traffic, with an annual growth rate of ~5.7%. In 2036, passenger traffic was expected to be 40% of global passenger traffic [3].
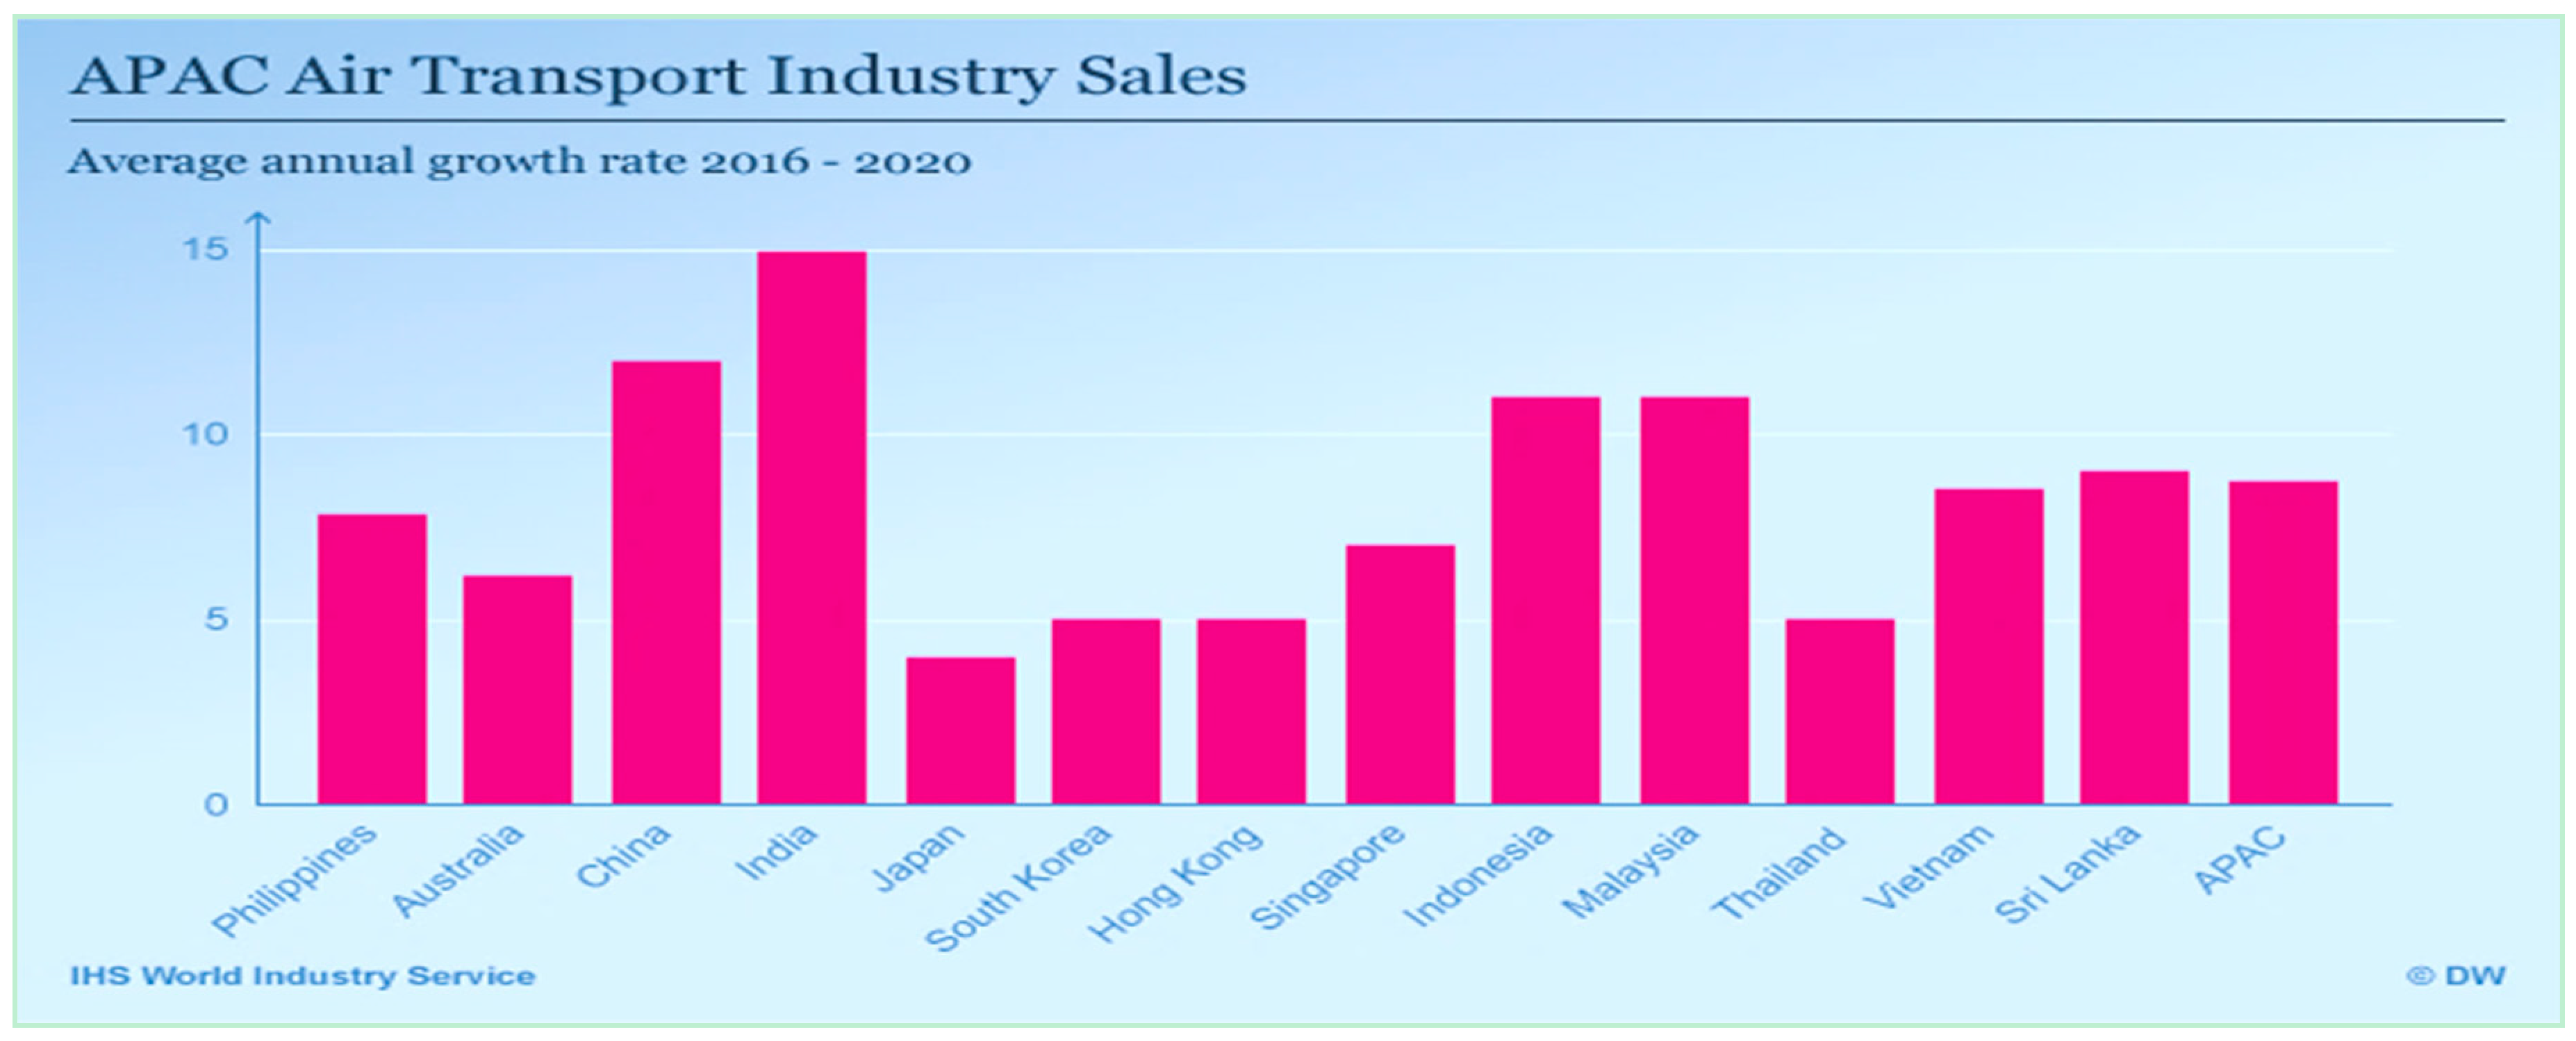
Figure 1 shows the potential average growth rate for the Asia aviation industry from 2016 to 2020. Rapid population growth, high economic development, and low-cost travel are considered to be the three factors driving the growth for the Asia aviation industry. Compared with other continents, Asia is expected to have a higher population growth rate and 65% of its population is 2035 will be middle class [4]. In the next two decades, the expected average annual GDP growth rate in Asia is ~3.9%, which contributes ~33–40% to the world GDP until 2036 [3]. Low-priced tourism is another factor driving the growth of Asia airline aviation, which can become a long-term development focus for the Asia aviation industry [5].
With a prosperous future, competition between airline companies in Asia is expected to increase. To better survive in the Asia airline industry, airline companies have to understand their past, current, and future performance compared with other competitors. For this purpose, a methodology for assessing their performance is required. In this research, a hybrid approach, combining the GM(1,1) model with the Data Envelop Analysis (DEA) Window model, is thus proposed for assessing the performance of Asia airline companies that are termed as decision making units (DMUs) in the DEA approach. From our literature review we found that there are more than 1000 DEA studies in the database of Web of Sciences. However, few of them have focused on the aviation industry and none of them have combined forecasting models to predict future performance for Asia airline companies. This lack has attracted our attention. The proposed approach has also been successfully applied to assess the current as well as future performance of 16 selected Asia airline companies. The main results have been summarized in the conclusion section.
2. Literature Review
2.1. Data Envelopment Analysis
Data envelopment analysis (DEA) is a linear programming (LP)-based technique that can be applied for measuring the relative performance of DMUs. This technique has been used in many areas, such as banking, insurance, education, and medical. Relevant studies applying DEA in the aviation industry are reviewed in this research. Distexhe and Perelman [6] used the DEA model and Malmquist productivity index to estimate the technological efficiency and productivity growth for 34 aviation companies for the time period of 1977 to 1988. Barbot et al. [7] used DEA and total factor productivity to examine the efficiency of US airline firms and the factors affecting efficiency change. Having determined the input and output variables, Barros and Peypoch [8] proposed an inventive two-stage DEA model for the assessment of operational efficiency of the European Airlines for the time period of 2000 to 2005. The Merkert and Hensher [9] used a two-stage DEA methodology to evaluate the efficiency of 58 passenger airlines companies. Partially bootstrapped random effects Tobit regression was employed in the second stage to evaluate key determinants affecting the airlines performance. Assaf and Josiassen [10] proposed a DEA bootstrap technique to evaluate the efficiency of UK airlines. Arjomandi and Seufert [11] also employed the bootstrapped DEA models, with variable returns to scale, to evaluate environmental and technical efficiencies of largest airlines in the world. Lee and Worthington [12] employed a two-stage DEA approach to evaluate the operational efficiency between private-owned airlines and traditional airlines in Europe. Lozano and Gutierrez (2014) [13] used a slacks-based network DEA to evaluate the efficiency of European airlines. Mallikarjun [14] applied the unoriented DEA network methodology to measure US airlines’ performance relative to that of peer airlines, in addition to identifying the sources of inefficiency. Tavassoli et al. [15] proposed a novel slacks-based measure network DEA (SBM-NDEA) to analyze both technical efficiency and service effectiveness of Iranian airlines in 2010. However, there is still a lack of evaluation on Asia airline companies. In addition, the combination of forecasting models to predicate their further performance is also not available.
2.2. Grey Forecasting
Proposed by Deng [16], Grey system theory is able to handle systems with ambiguity [17]. One branch of Grey system theory is Grey forecasting, which uses Grey models for prediction. Various Grey forecasting models have been proposed for different applications. These studies are introduced as follows. Hsu [18] used an innovative Grey model algorithm ITGM(1,1) to evaluate the performance for the time period of 1990 to 2008 for Taiwan optic-electronics industry. Compared with other forecasting models, including GM(1,1), rolling GM(1,1), and transformed GM(1,1), the ITGM(1,1) had better performance. In that study, mean absolute percentage error (MAPE) and root mean square percentage error (RMSPE) were used to evaluate the performance of these different approaches. Chen and Wang [19] proposed a new version, upgraded GM(1,1), to predict the global future need on energy and assess the energy engineering management. Hamzacebi and Es [20] proposed anther version, optimized Grey GM(1,1), to forecast the future need on electric energy for Turkey in the time period 2013–2025. In another study, Shaikh et al. [21] employed two optimized nonlinear grey models, the Grey Verhulst Model and the Nonlinear Grey Bernoulli Model, to predicate the future need on natural gas for China. As the grey model GM(1,1) is simple, efficient, and only dependent on few data [22], this kind of forecasting model is used in this research.
3. Methodology
This research includes two kinds of methodologies: GM(1,1) and DEA Window models. In addition, measurements, such as the Malmquist Productivity Index (MPI), Efficiency Change Index, and Technological Change Index, were used as evaluation measurements. In the GM(1,1) model, it needs to select DMUs, input, and output variables, which are detailed in this section.
3.1. The Selection of DMUs
Selecting DMUs is the first step when using DEA approach. However, when doing this there were some difficulties: One is that few airline companies have released their annual financial reports on their websites regularly. Another is that some firms are subsidiaries of a controlling company so that their financial reports are consolidated with the controlling company. For example, Scoot and Tiger Airways are subsidiaries of Budget Aviation Holdings established by Singapore Airlines. In addition, Singapore Airlines holds Sri Lankan Airlines. As a result, the business results of these companies were consolidated together.
After careful consideration, 16 airline companies (DMUs) listed in the website of Skytrax in 2017 were selected as DMUs in this research. The reason of selecting these airline companies is due to their importance in the Asia aviation industry and the availability of their financial data. The 16 airline companies are listed in Table 1 and each company is assigned with a DMU code.
3.2. The Selection of Inputs and Outputs Variables
Selecting the input and output variables is the second step for DEA approach. This step is important as the selected variables can affect the evaluation results. To determine these variables, some relevant studies with DEA approaches for the aviation industry have been referred. The input and output variables used in these researches are listed in Table 2.
Referring to Table 2, the “Fleet”, “Total Assets”, and “Operating Expenses” are selected as input variables and the “Revenue Passenger Kilometers (RPKs)” and “Available Set Kilometers (ASKs)” are selected as output variables as they have been widely used in past studies. These input and output variables are defined as follows:
- Total Assets: This input variable refers to the sum of all cash, investments, furniture, fixtures, equipment, receivables, intangibles, and any other items of value owned by a person or a business entity.
- Operating expenses: This input variable refers to expenses required to carry out an organization’s day-to-day activities. Relevant items include payroll, sales commissions, employee benefits and pension contributions, transportation and travel, amortization and depreciation, rent, repairs, and taxes. These items are not directly associated with production.
- Fleet: Refers to the number of operating airplanes of an airline company.
- Available seat kilometers (ASKs): This output variable refers to the number of seats available for sale multiplied by the kilometers flown.
- Revenue passenger kilometers (RPKs): This output variable is calculated by multiplying the number of revenue-paying passengers aboard the planes by the distance traveled.
Whether these selected variables are suitable for evaluating the selected DMUs is a question that can be answered by using Equation (1), which is used to calculate Pearson correlation coefficient.
The Pearson correlation coefficient is one of the best statistical tests for measuring the correlation between two variables. Information about the magnitude of correlation as well as the direction of the relationship can be generated. The degrees of correlation are specified as follows; if the Pearson correlation coefficient is >0.8 then the degree of correlation is considered extremely high; if the Pearson correlation coefficient is between 0.6 and 0.8 then the degree of correlation is considered high; if the Pearson correlation coefficient is between 0.4 and 0.6 then the degree of correlation is considered medium; if the Pearson correlation coefficient is between 0.2 and0.4 then the degree of correlation is considered low; and if the Pearson correlation coefficient is <0.2 then the degree of correlation is considered extremely low.
3.3. Malmquist Productivity Index
The Malmquist productivity index (MPI), which is the product of catch-up and frontier-shift, is defined as follows. It uses distance functions to measure productivity change.
where the catch-up effect is defined in Equation (3)
The frontier-shift effect is defined in Equation (4)
The MPI is useful for determining the overall productivity change of a DMU. If MPI > 1, it indicates the improvement of productivity of a DMU; otherwise, there is no change or even regression. The “catch-up effect” (C), also known as the efficiency change index, can indicate the degree of efficiency change of a DMU. If C > 1, it indicates an improvement of a DMU; otherwise, no change or even regression. The “frontier-shift effect” (F) is known as the technological change index, and can indicate the degree of technological change. If F > 1, it indicates an improvement of a DMU; otherwise, no improvement or even regression.
3.4. DEA Window Model
The DEA Window model is a nonparametric approach. If DMUn (n = 1, 2, 3, …, N; where N is the total number of DMUs) denotes the nth DMU that uses m inputs to produce s outputs. Let denote the nth DMU in the time period t (t = 1, 2, 3, …, T), then the input and output vectors of the are denoted as and and are represented as Equations (5) and (6), respectively:
and
Consider that the window starts at the time point k (1 k T) and the window width is w (1 w T − k), then the input () and output () matrix of each window () are presented by Equations (7) and (8), respectively:
and
Substituting inputs and outputs of into Equations (7) and (8) can result in DEA Window analysis.
3.5. GM (1,1)
The GM(1,1) model is the most commonly-used Grey forecasting model. It is a kind of time series prediction model that depends on the first-order differential equation. It has been proven to be effective and reliable. Thus, GM(1,1) is used in this research. In GM(1,1), the raw data sequence is presented as Equation (9), where n indicates the total number of raw data.
Then, the accumulated series of is defined as Equation (10).
where X(1)(1) = X(0)(1), = , k = 1, 2, …, n.
The generated mean sequence Z(1) of X(1) is calculated by Equation (11).
where = × , k = 2, 3, …, n.
GM(1,1) is defined by a first-order differential equation, such as Equation (12).
The coefficients a and b can be obtained by Equation (13).
where Y and B can be derived by Equation (14).
Discrete solution of the differential equation can be derived by Equation (15).
Finally, the predicted values can be found by Equation (16).
3.6. Measurement of Forecasting Accuracy
The mean absolute percentage error (MAPE), defined in Equation (17), is used for measuring forecasting accuracy. Due to the scale independency and interpretability, the MAPE has been widely used (Kim & Kim, 2016). The forecast error is presented as a percentage.
In terms of MAPE, the forecasting accuracy can be judged by the following criteria; if the MAPE <10%, then the accuracy level is considered as excellent; if the MAPE is between 10 and 20%, then the forecasting accuracy is considered as good; if the MAPE is between 20 and 50%, then the forecasting accuracy is considered as reasonable; and if the MAPE is >50%, then the forecasting accuracy is considered as poor.
4. Empirical Study Results
4.1. Data Collection
The input and output data for the time period of 2012 to 2016 for the 16 DMUs were collected. In the next section, the Person correlation test will be conducted to evaluate suitability of these variables. If highly correlated, these variables will be applied to evaluate the 16 DMUs for the time period of 2012 to 2016, and then to predicate the performance of these DMUs for the time period of 2017 to 2021. Then, the efficiency of these DMUs will be evaluated.
4.2. Pearson Correlation Test
Based on Equation (1), Table 3, Table 4, Table 5, Table 6 and Table 7 show the Person correlation coefficients of the input and output variables for DMU in the years of 2012, 2013, 2014, 2015, and 2016, respectively.
The above tables show that the correlation coefficients are all positive values ranging from 0.7 to 1. It is therefore concluded that these input and output variables are highly correlated, indicating that they are suitable variables.
4.3. Grey Forecasting
The Grey model GM(1,1) was used to forecast future values of DMUs for the time period of 2017 to 2021. The forecasting procedure is illustrated by taking the DMU-Emirates as an example. Table 8 shows the raw input and output data of the DMU-Emirates for the time period of 2012 to 2016. The bolded values in the “Fleet” column were used to illustrate the forecasting procedure of using the GM(1,1). The data in other columns can be calculated in a same procedure.
Stage 1: The original series X(0) of the “Fleet” column is derived by Equation (9) as follows.
X(0) = (197, 205, 217, 236, 244)
Stage 2: The accumulated series X(1) is derived by Equation (10) as follows.
in which
X(1) = (197, 402, 619, 855, 1099)
X(1)(1) = X(0)(1) = 197
X(1)(2) = X(0)(1) + X(0)(2) = 402
X(1)(3) = X(0)(1) + X(0)(2) + X(0)(3) = 619
X(1)(4) = X(0)(1) + X(0)(2) + X(0)(3) + X(0)(4) = 855
X(1)(5) = X(0)(1) + X(0)(2) + X(0)(3) + X(0)(4) + X(0)(5) = 1099
X(1)(2) = X(0)(1) + X(0)(2) = 402
X(1)(3) = X(0)(1) + X(0)(2) + X(0)(3) = 619
X(1)(4) = X(0)(1) + X(0)(2) + X(0)(3) + X(0)(4) = 855
X(1)(5) = X(0)(1) + X(0)(2) + X(0)(3) + X(0)(4) + X(0)(5) = 1099
Stage 3: The mean sequence Z(1) of X(1) is derived by Equation (11) as follows.
Stage 4: Based on Equation (14) the B and Y can be derived as follows.
Consequently, the coefficients a and b can be derived by Equation (13) as follows.
Stage 5: Generate the series of predictive values.
The Ẍ(1)(k) of the “fleet” column for the DMU-Emirates can be derived by Equation (15). Table 9 lists the derived results. The predictive values (0)(k) of the “fleet” column for the DMU-Emirates can be derived by Equation (16) and listed in the 5th column.
Following the same procedure, the predicted values of other variables for all DMUs in the same time period can be derived.
4.4. Evaluation of the Forecast Accuracy
Based on Equation (17), Table 10 lists the average MAPEs of predicative values obtained from the GM(1,1) for the 16 DMUs.
Table 10 shows that all average MAPEs are within the range of 0.161 to 0.393%. As these values are ≤10%, the forecasting accuracy of the GM(1,1) is found to be excellent.
4.5. DEA Window Analysis
The DEA Window model was used to measure the efficiency of DMUs for the time period of 2012 to 2016. Firstly, Window DEA of the whole time period was conducted, which helps the researcher establish a whole view of DMUs’ efficiency. Then, three widows of the 3-year period were used to investigate the performance of these DMUs.
4.5.1. DEA Window of the Whole Time Period
Table 11 shows the efficiency scores of the 16 DMUs obtained from the DEA Window for the whole time period (2012–2016). It is found that DMU14–Sri Lankan Airlines ranks No. 1, with the best efficiency score of 0.99106 in the whole time period, while the DMU8-All Nippon Airways ranks No. 16, with the worst efficiency score of 0.42.
4.5.2. DEA Window of 3-Year Period
To have a further investigation, Table 12 defines three widows for DEA Window analysis.
Based on Equations (6)–(8), Table 13 shows the efficiency scores of 16 DMUs obtained from the DEA Window model for a 3-year period. It is found that the rankings of these DMUs have a slight change between Table 11 and Table 13. This table provides a higher resolution on the efficiency scores for each DMU.
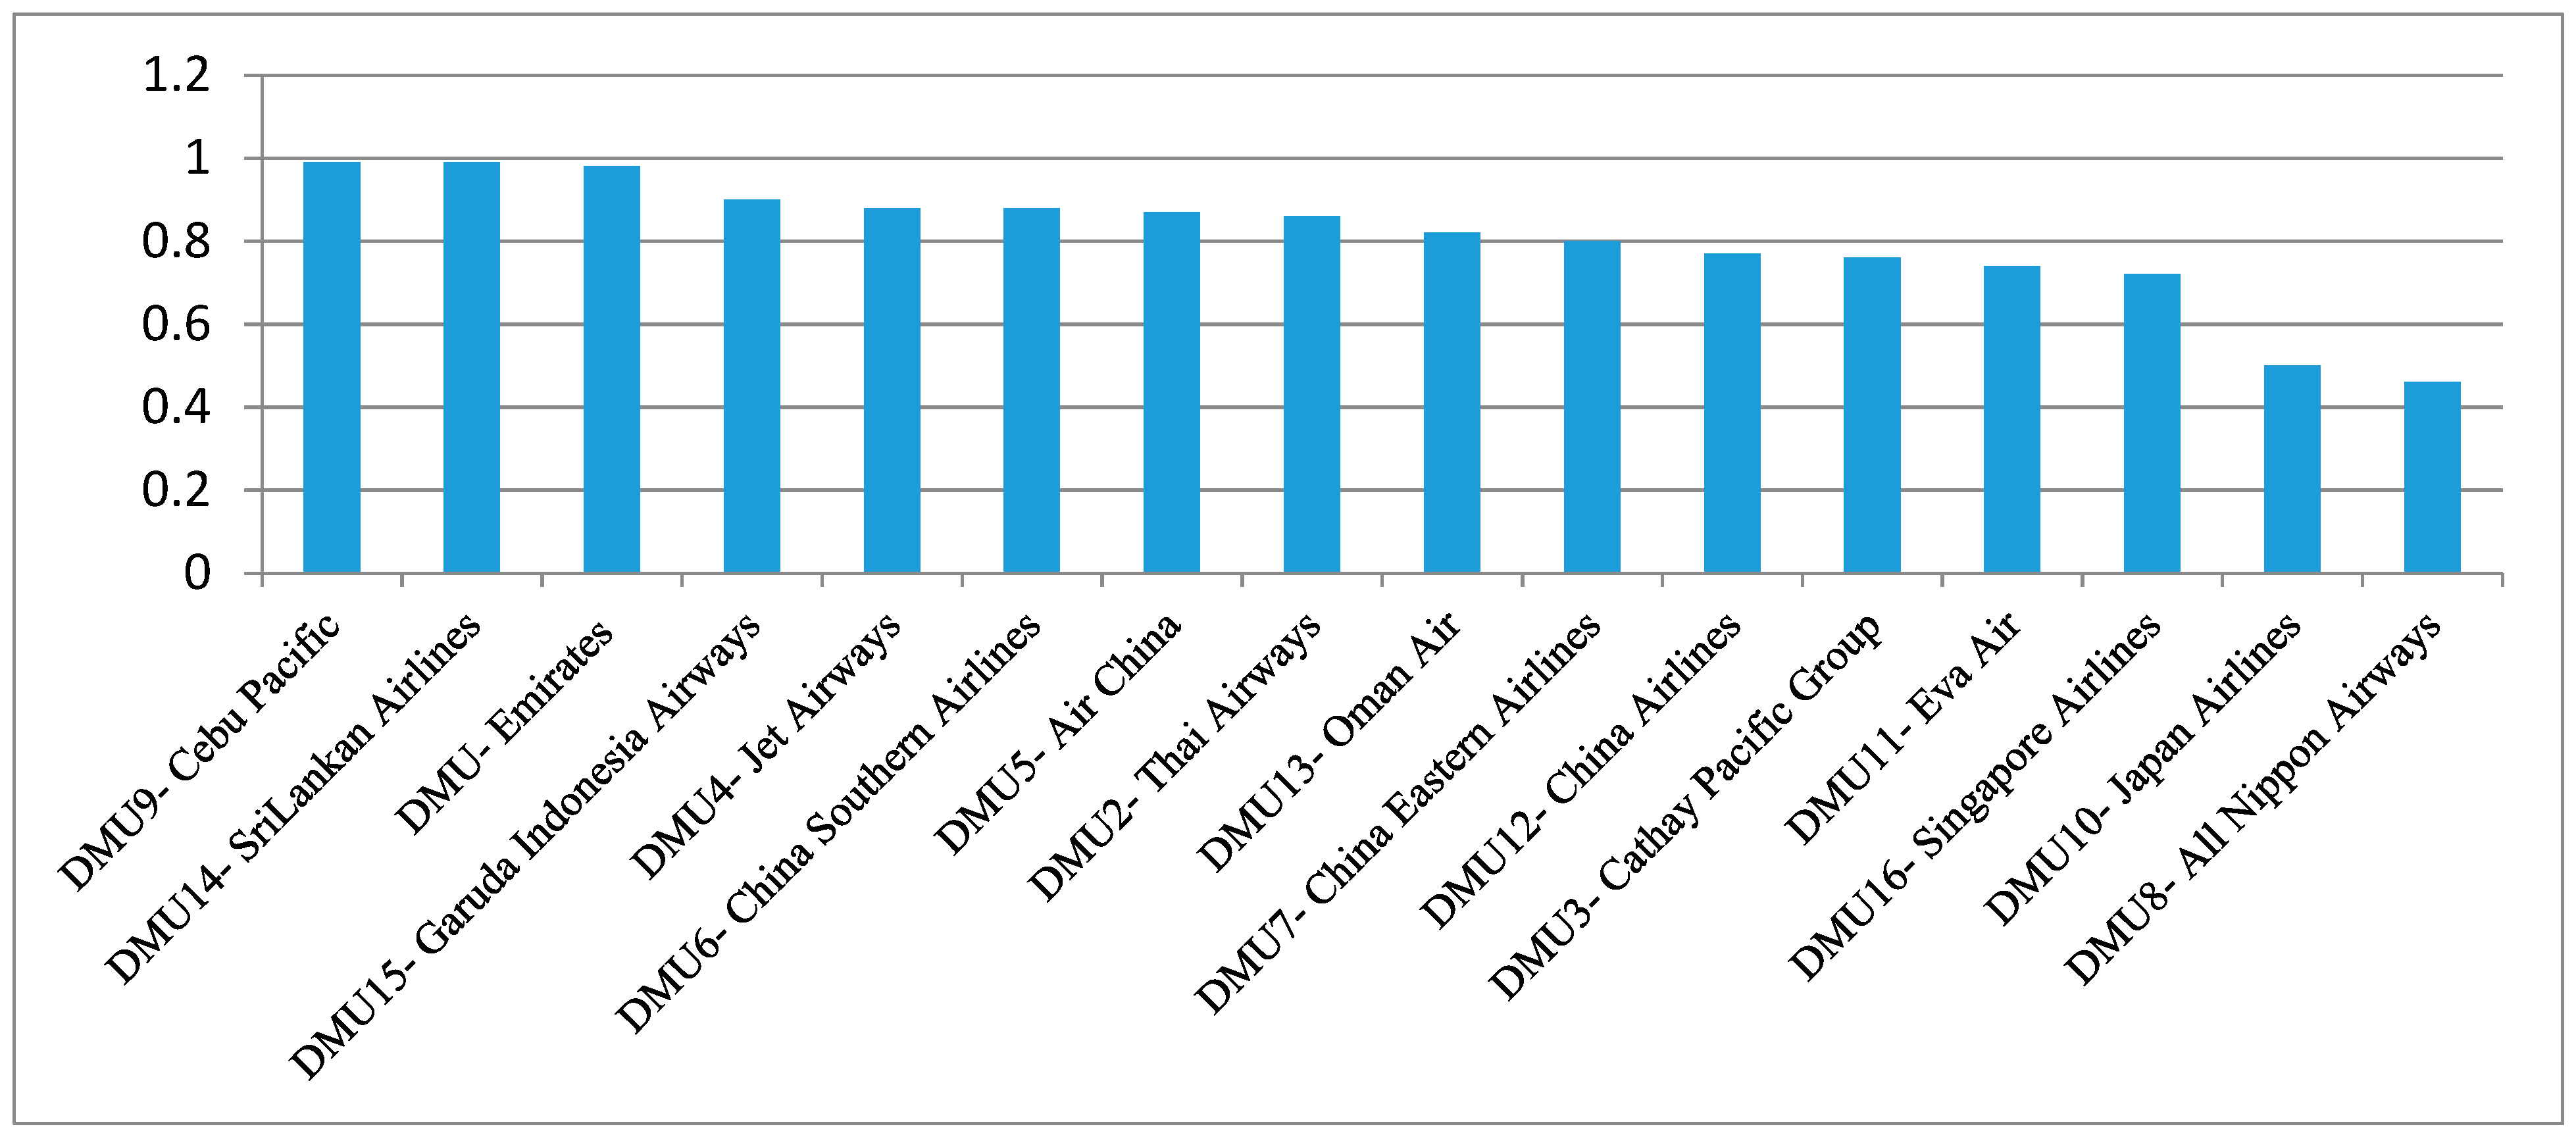
Figure 2 shows the average efficiency rankings of these DMUs listed in Table 13. According to their rankings, these DMUs can be separated into three groups. The 1st and 3rd groups include the top best and worst three companies. The 2nd group includes the rest companies.
The 1st group includes Cebu Pacific, Sri Lankan Airlines, and Emirates. Cebu Pacific is a privately owned low cost carrier while Sri Lankan Airlines and Emirates are two state owned flag carriers. The efficiency scores of Sri Lankan Airlines increased steadily from 0.96 in 2012 to 1.00 in 2013, and then remained stable in the last three years. Meanwhile, Emirates’ efficiency has improved year-by-year as the score had been increased from 0.94 in 2012 to 1.00 in 2016. On the contrary, Cebu Pacific witnessed a favorable initial efficiency of 1.00 in 2012 then the efficiency reduced to 0.93 in 2014 and then increased back to 1.00 in 2015 and 2016.
The 2nd group includes Garuda Indonesia Airway, Jet Airway, China Southern Airlines, Air China, Thai Airways, Oman Air, China Eastern Airlines, China Airlines, Cathy Pacific Group, and Eva Air. It was found that China’s commercial airline industry surged over the last 20 years. For instance, Air China has a fleet of over 600 planes that fly to 200 destinations worldwide. Table 16 shows that the efficiency scores of Air China, China Eastern, and China Southern Airlines had improved significantly from 0.84, 0.77, and 0.83 to 0.99, 0.93, and 1.00, respectively.
The 3rd group includes Singapore Airlines, Japan Airlines, and All Nippon Airways. These airline companies used to perform well in the Asia aviation, but they performed poorly throughout the whole time period.
Singapore Airlines and Cathay Pacific Group were forerunners in terms of long-haul air transportation. However, Figure 2 shows the turndown of the two companies. To survive, Cathay Pacific Group will need to dismiss employees and execute a large reassessment, while Singapore Airlines also has the same dilemma [30]. For Japan Airlines (JAL), investors wonder whether it can better survive after the process of liquidation and rearrangement [31]. Today, these airline companies are lagging behind their opponents such as China Southern Airlines, China Eastern Airlines, Air China, and Emirates [30].
4.6. Performance Evaluation
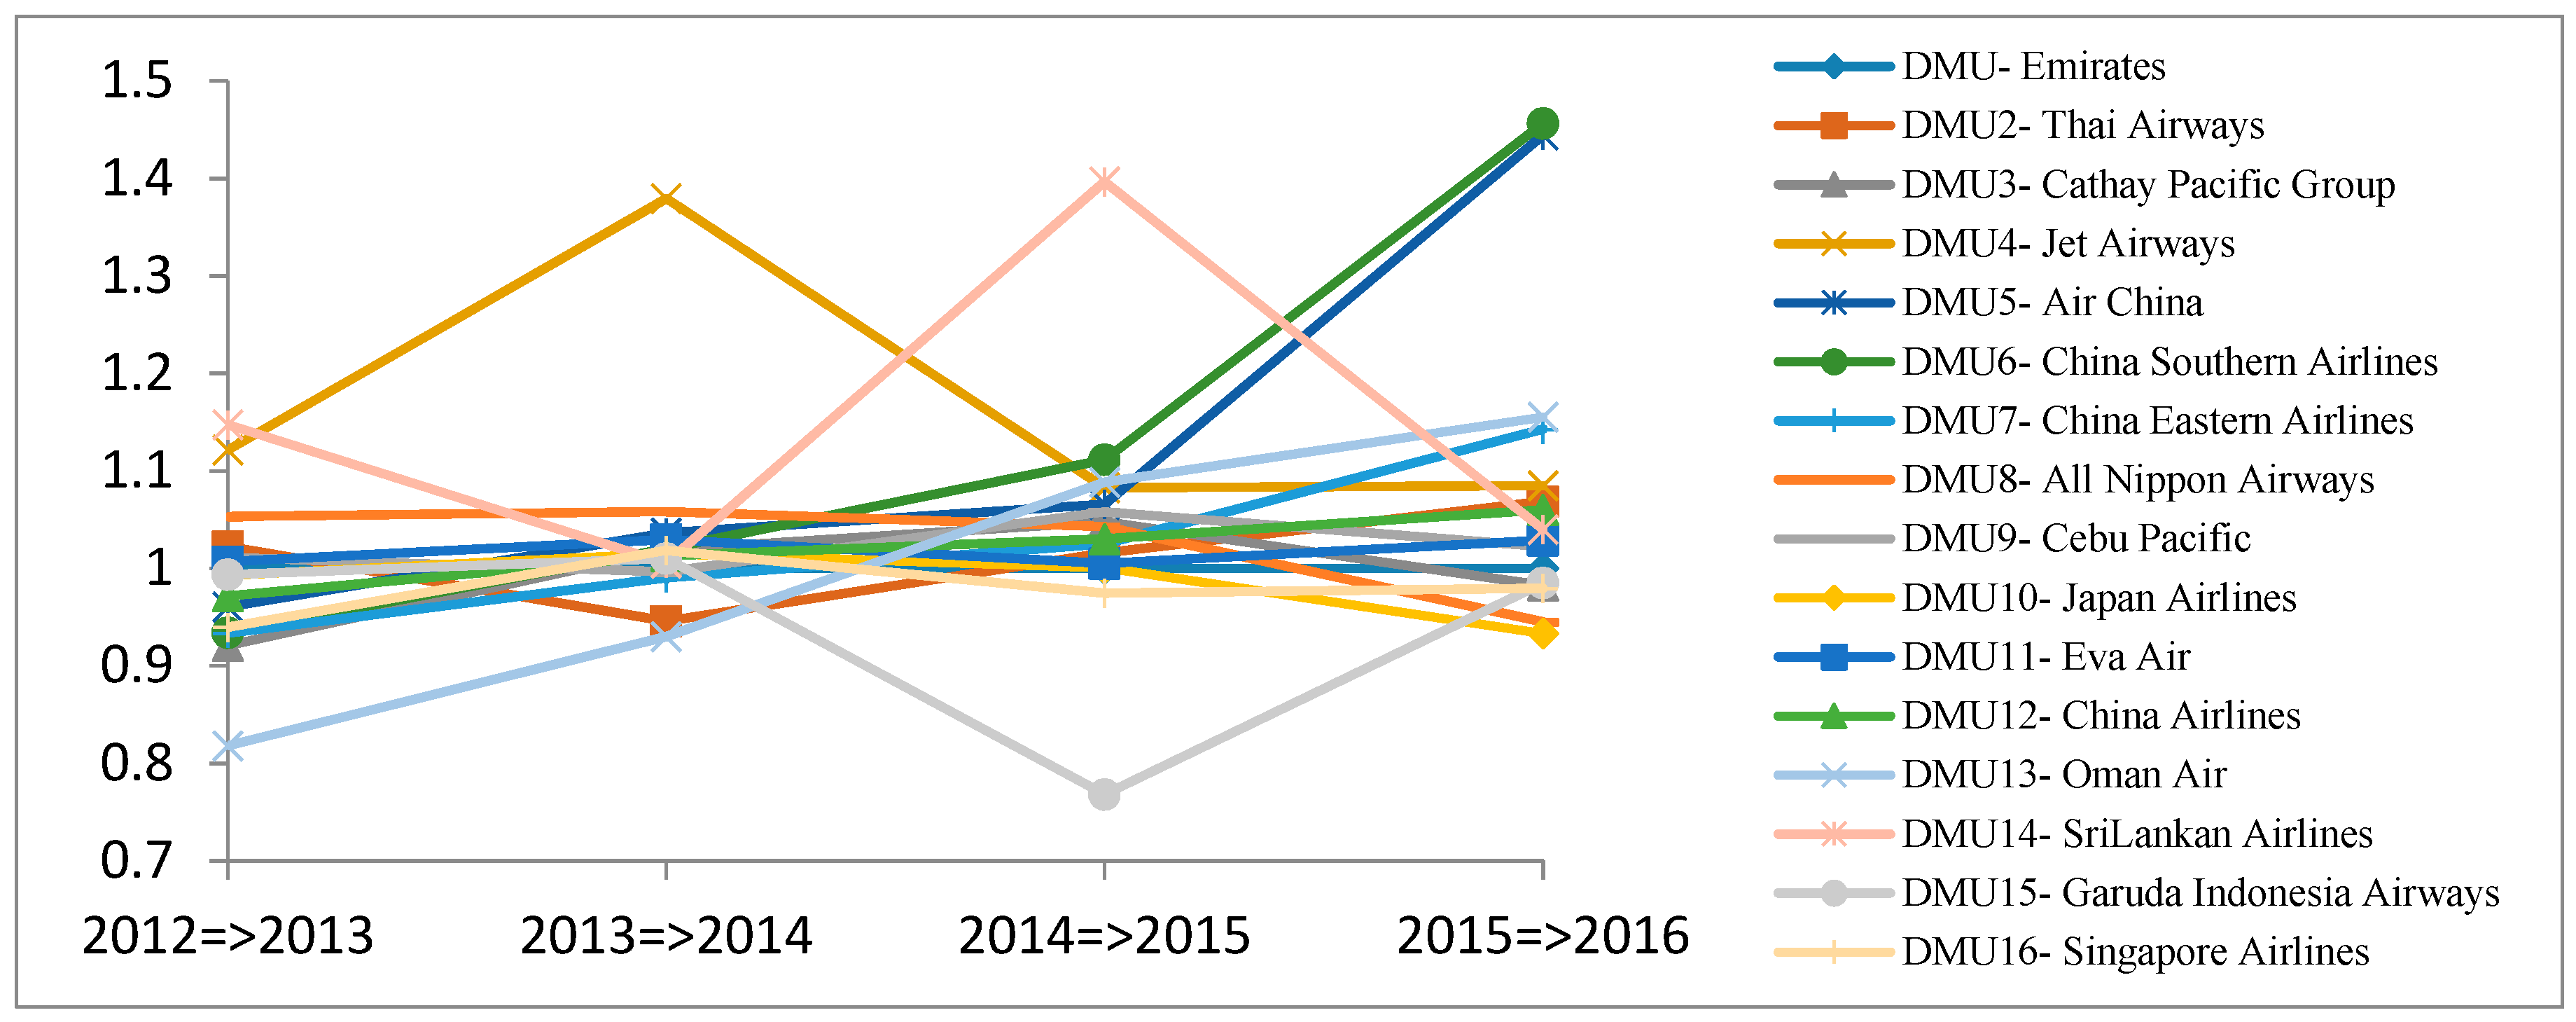
4.6.1. Efficiency Change Index
Based on Equation (3), Table 14 and Figure 3 show the efficiency change indexes (catch-up effects) of 16 DMUs for the time period of 2012 to 2016. The efficiency of each DMU changes year-by-year. DMU5-Air China, DMU6-China Southern Airlines, DMU7-China Eastern Airlines, DMU11-Eva Air, DMU12-China Airlines, and DMU13-Oman Air improved during that time period. Practically, a DMU5-Air China, DMU6-China, DMU7-China Eastern Airlines, DMU11-Eva Air, DMU12-China Airlines, and DMU13-Oman Air achieved a noticeable improvement, with their efficiency change indexes increasing from 0.96, 0.93, 0.93, 1, 0.98, and 0.81 to 1.44, 1.47, 1.14, 1.03, 1.04, and 1.16, respectively.
Meanwhile, DMU8-All Nippon Airways and DMU10-Japan Airlines experienced a decline in efficiency change index, with their efficiency change indexes decreasing to 0.95 and 0.3 (in 2016) from 1.05 and 1.00 (in 2013), respectively.
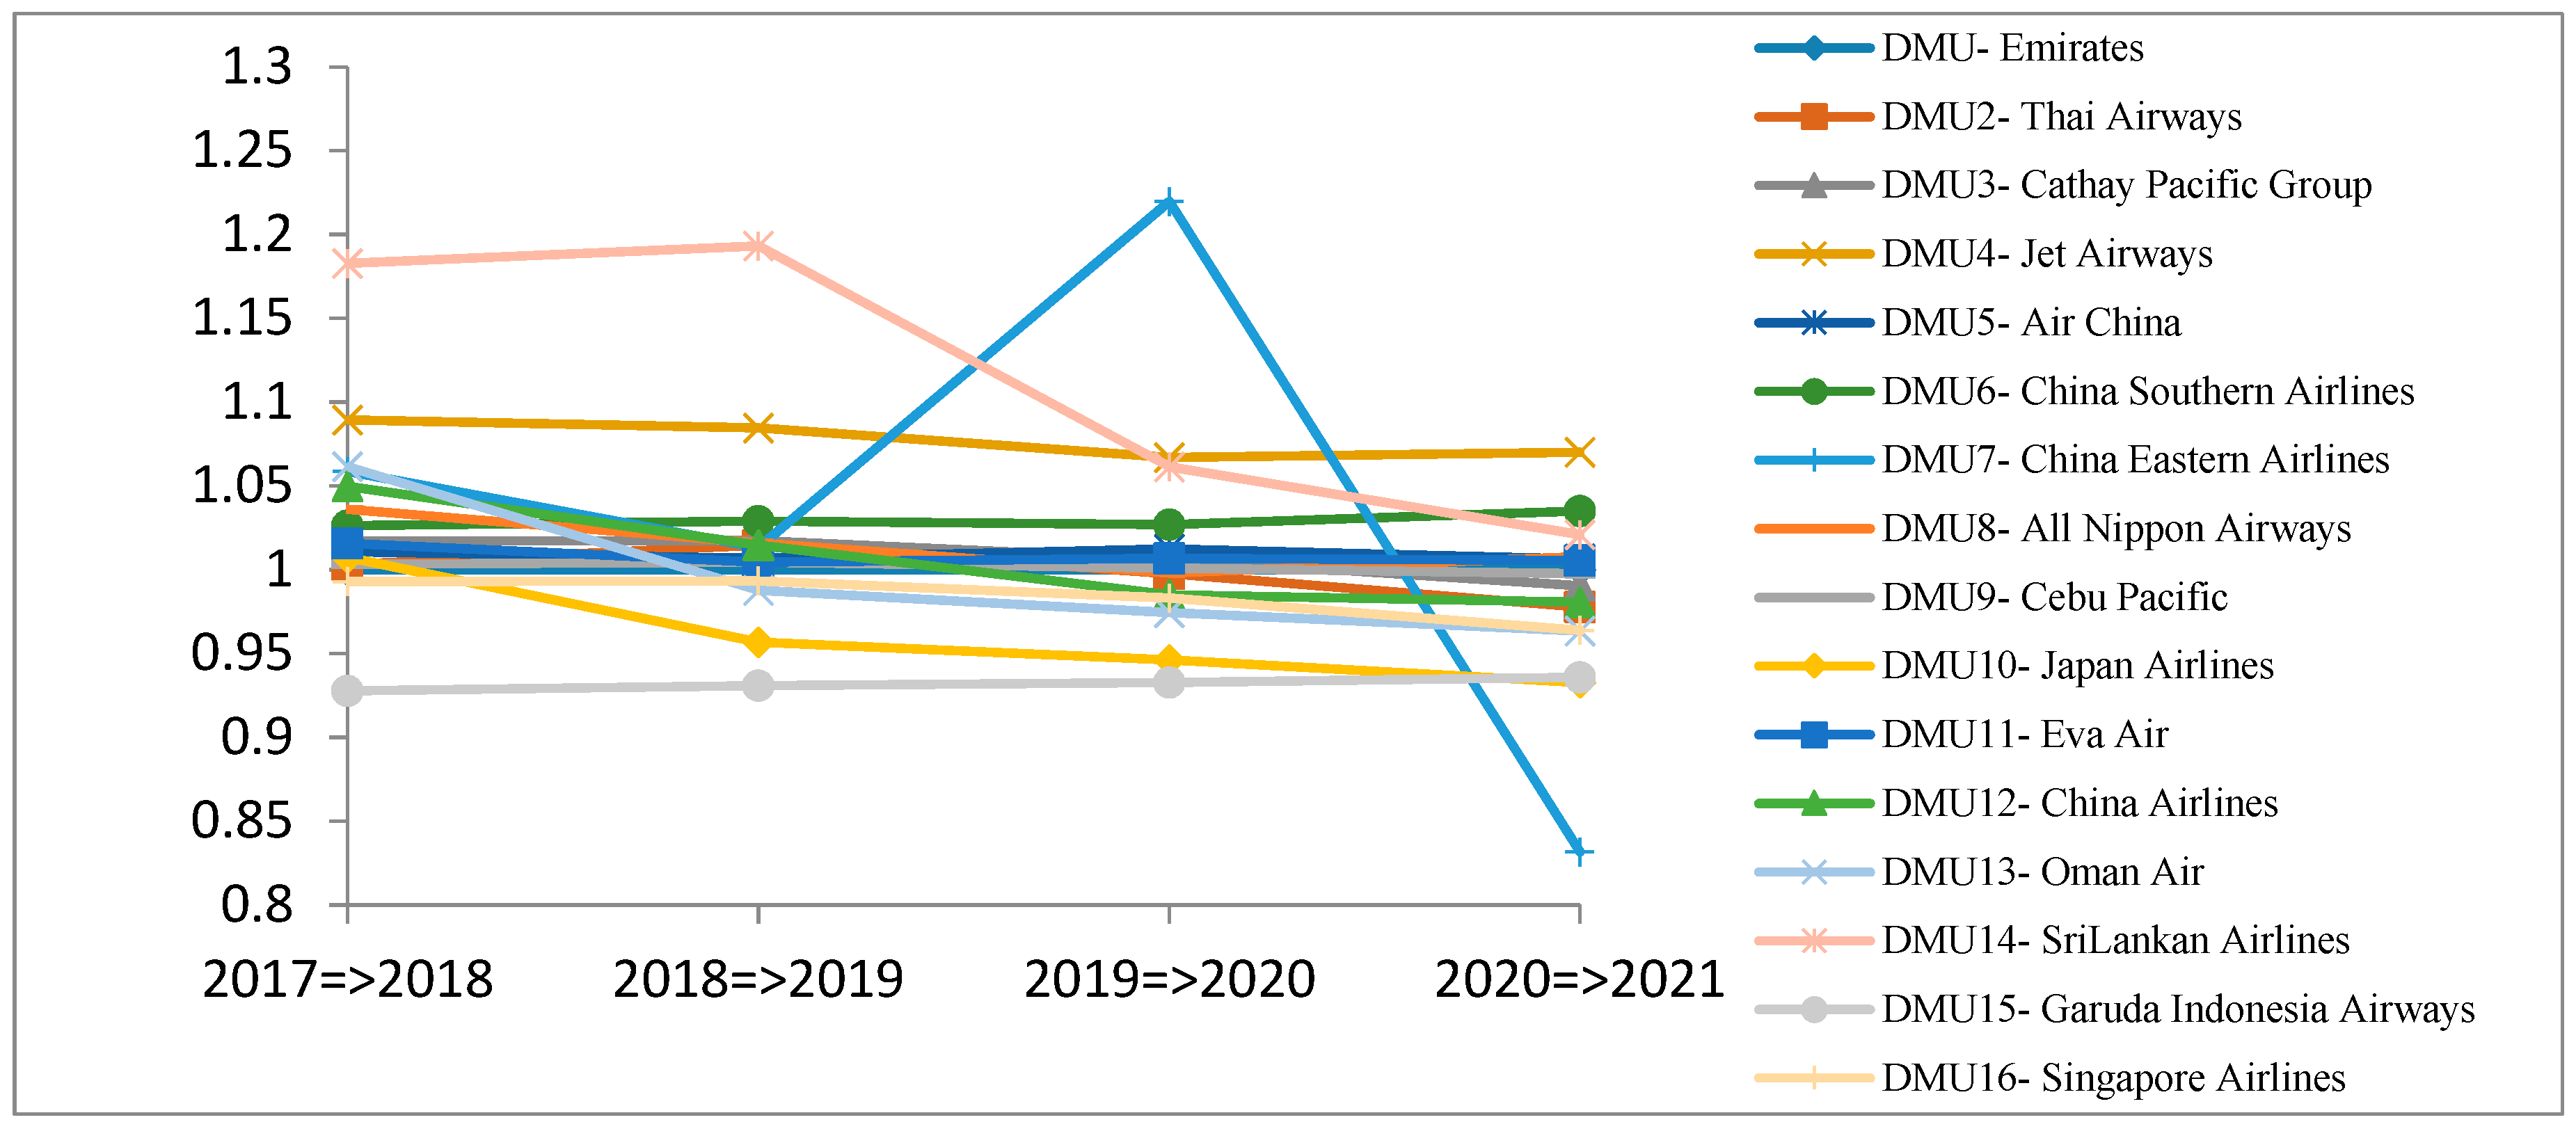
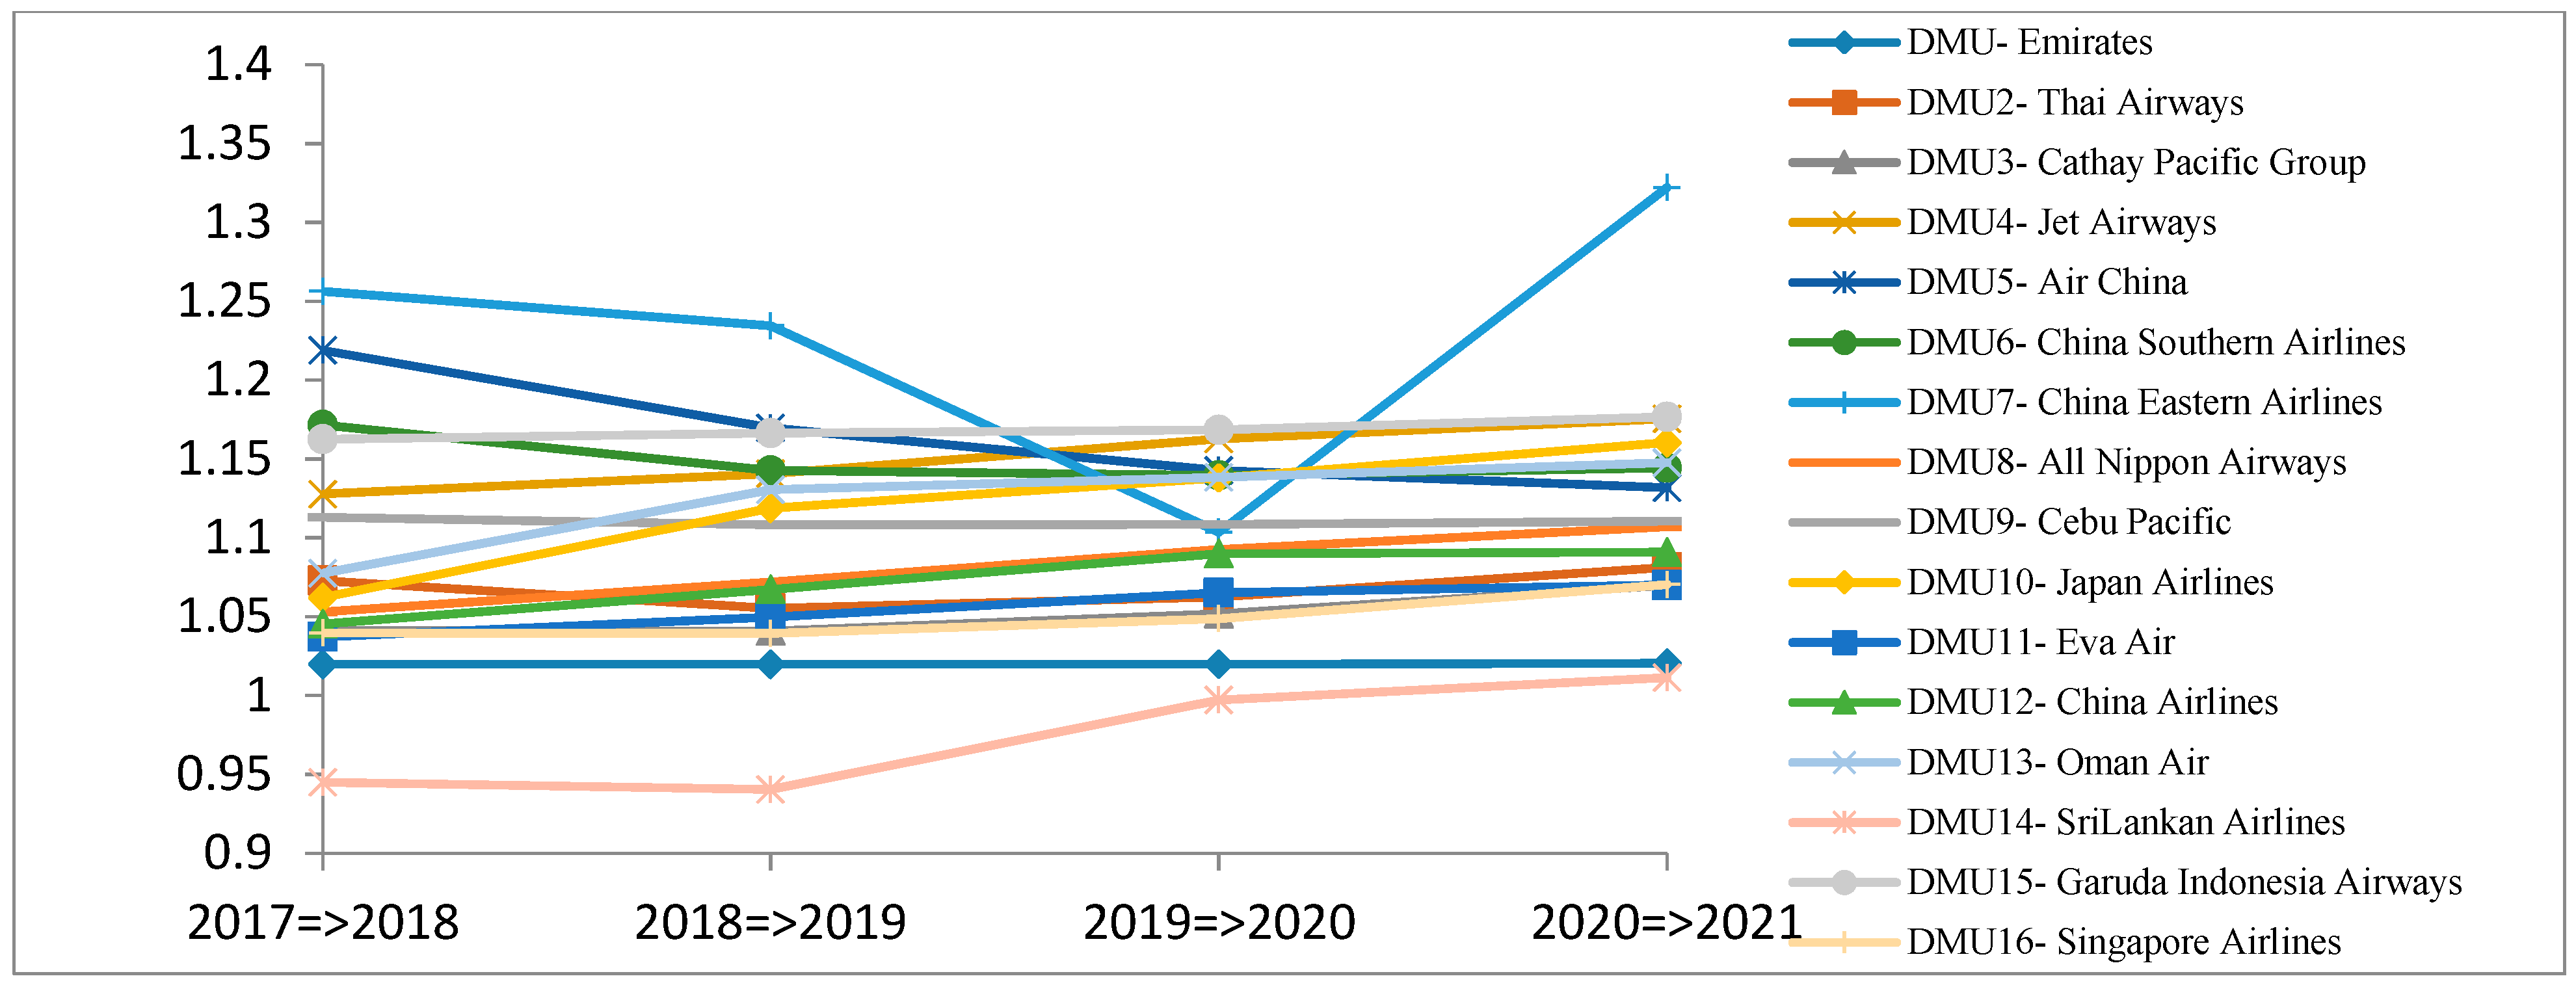
Figure 4 shows the forecasted efficiency change indexes of 16 DMUs for the time period of 2017 to 2021. Most of the efficiency changes of the 16 DMUs are expected to decline. Especially, DMU14-SriLankan Airlines and DMU7-China Eastern Airlines are expected to have a dramatic dip.
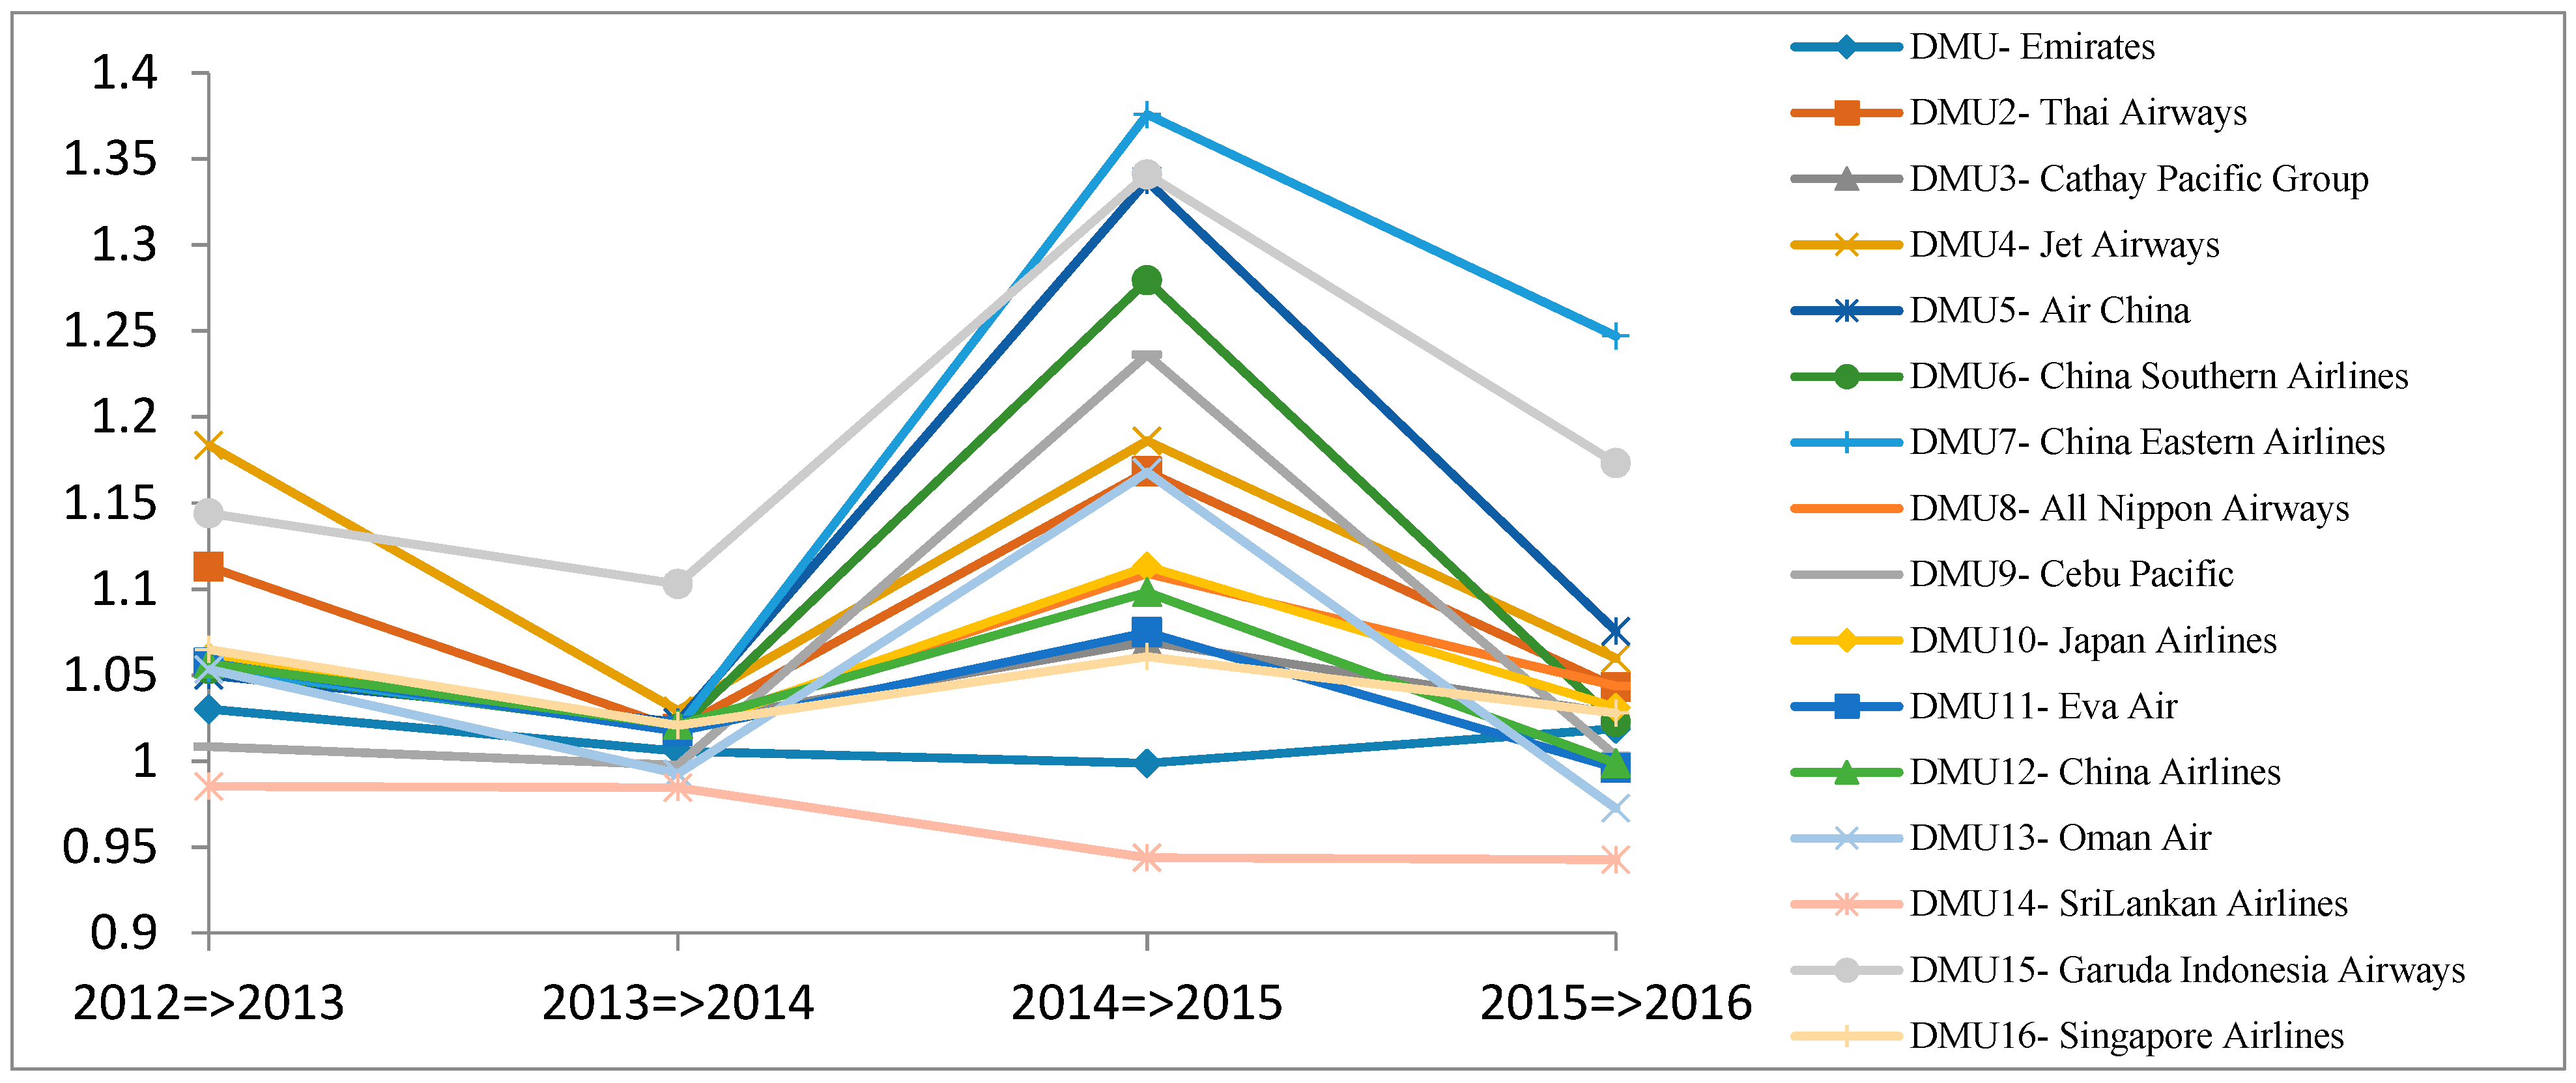
4.6.2. Technological Change Index
Table 15 and Figure 5 show the technological change indexes (frontier-shift effects) of the 16 Asia airline companies for the time period of 2012 to 2016. Figure 6 shows the trends of the technological change indexes for the 16 DMUs. Many of the DMUs have a fluctuating trend.
Almost all the technological change indexes of these DMUs dropped for the time period of 2013 to 2014 and then surged dramatically for the time period of 2014 to 2015. This recovery, however, was short-lived as there was a dramatic dip for the time period of 2105 to 2016. Thus, it is concluded that the technological capabilities of these DMUs had not improved over recent years.
Table 15 shows that DMU15-Garuda Indonesia Airways, DMU7-China Eastern Airlines, and DMU5-Air China had the best average technological change indexes of 1.19, 1.17, and 1.12, respectively. On the contrary, DMU11-Eva Air, DMU-Emirates, and DMU14-Sri Lankan Airlines are the three worst companies, in which DMU14-Sri Lankan Airlines had the lowest score (with an overall average score of 0.96 ≤ 1).
Figure 6 shows the technological change indexes for the 16 DMUs for the time period of 2017 to 2021. During this time period most of the DMUs are expected to have a stable technological change index. However, DMU7-China Eastern Airlines is expected to have a declined index in 2017–2020 and then recover in 2021.
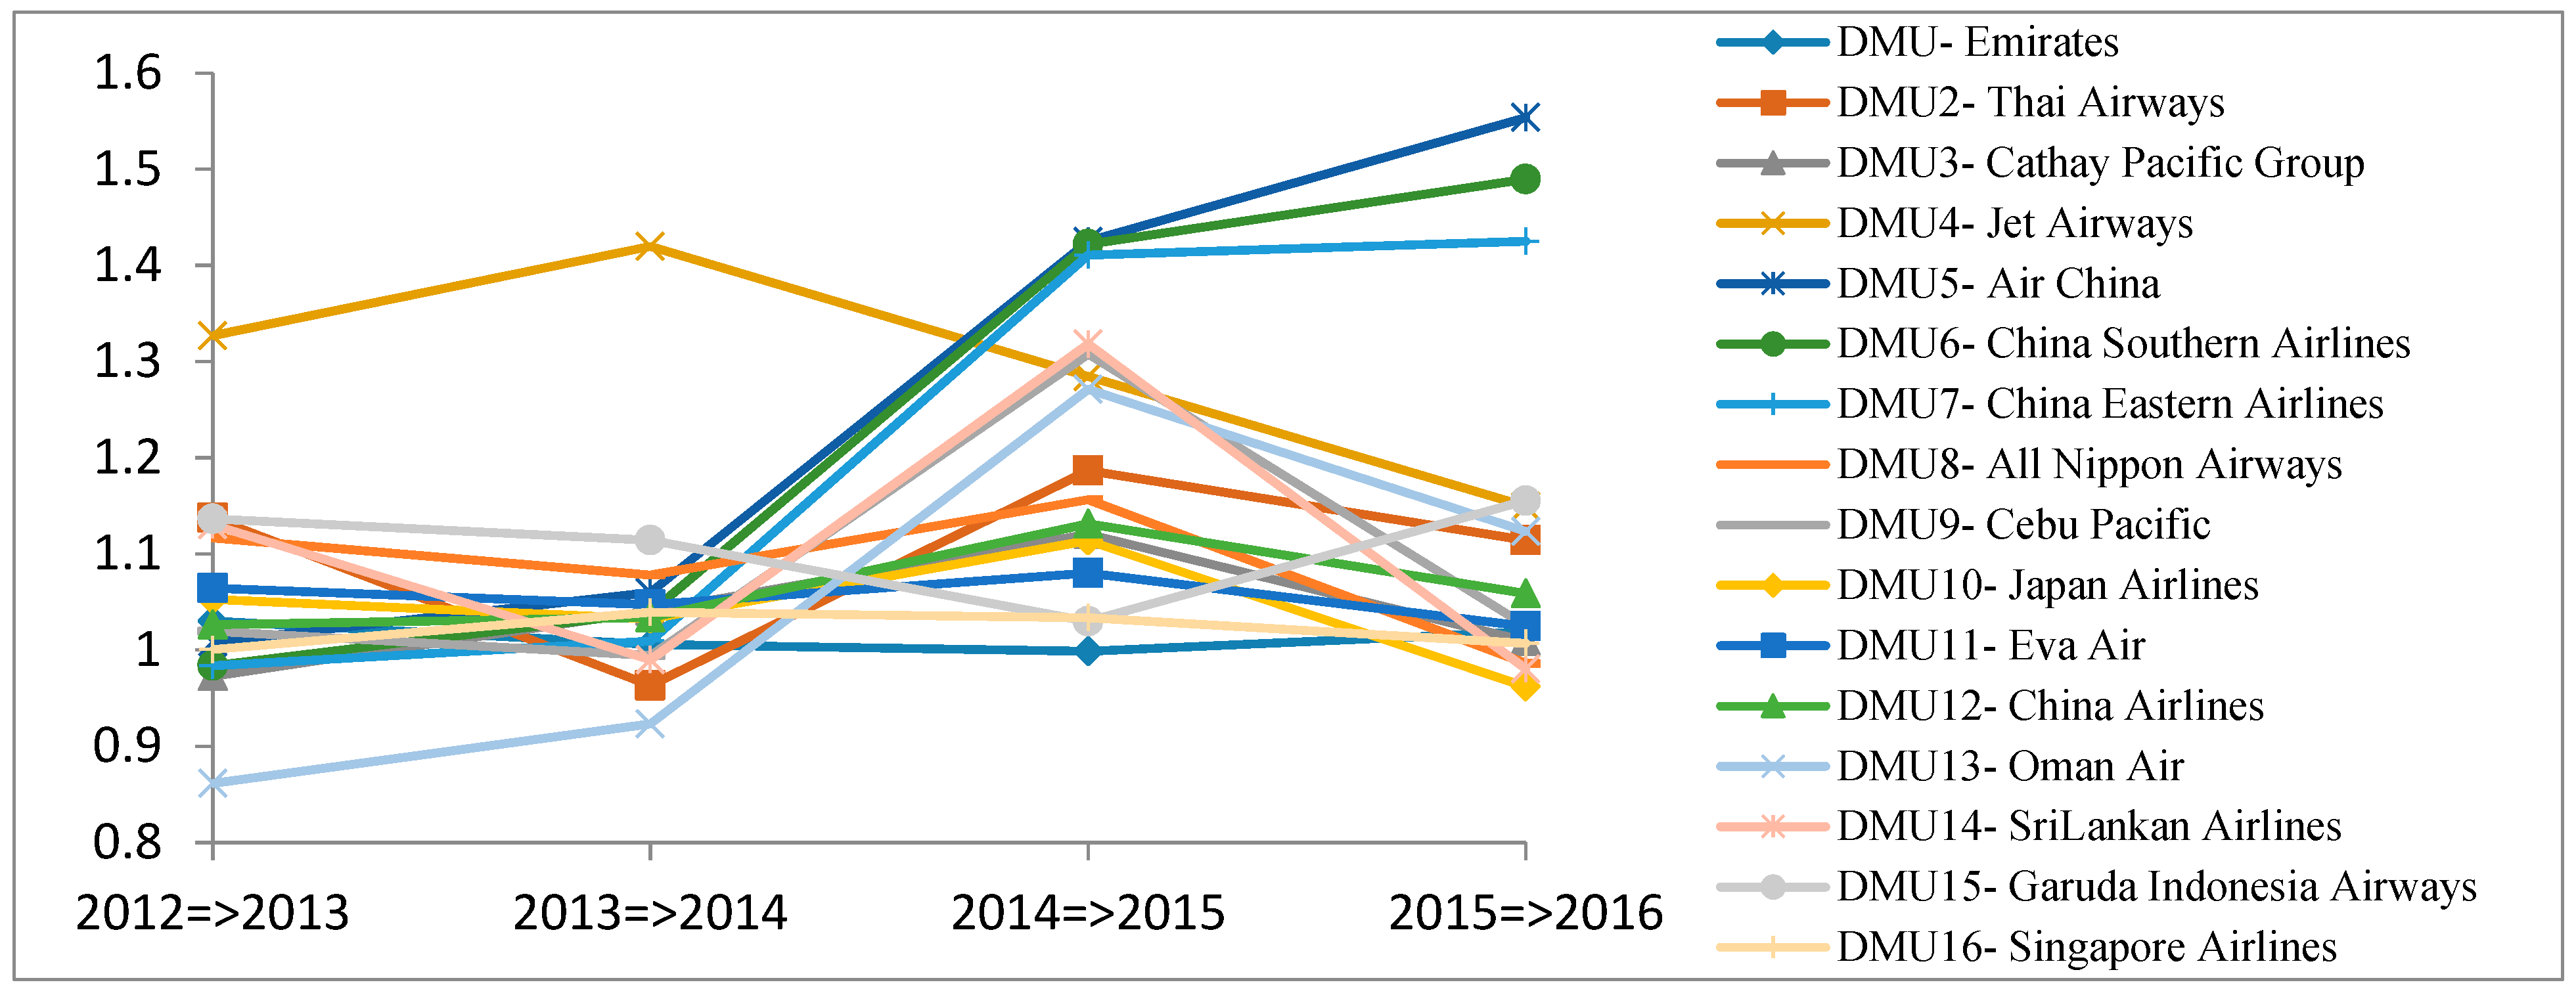
4.6.3. Malmquist Productivity Index
Based on Equation (2), Table 16 and Figure 7 show the MPIs of DMUs for the time period of 2012 to 2016. In the first time period (2012–2013) airline companies, including DMU3-Cathay Pacific Group, DMU6-China Southern Airlines, DMU7-China Eastern Airlines, and DMU13-Oman Air, had poor productivity (with MPIs of 0.97, 0.98, 0.98, and 0.86, respectively). Nevertheless, these airline companies had improved their performance for the time period of 2013 to 2016. In 2016, DMU6-China Southern Airlines, DMU7-China Eastern Airlines, and DMU13-Oman Air had increased their MPIs to 1.49, 1.43, and 1.12, respectively, which helps raise their average MPI scores.
Airline companies, including DMU8-All Nippon Airways, DMU10-Japan Airlines, and DMU14-SriLankan Airlines, failed to improve their productivity as their MPIs are down from 1.12, 1.05, and 1.13 in 2012 to their lowest points at 0.98, 0.96, and 0.98, respectively, in 2016.
Table 17 shows the forecasted MPIs of all 16 DMUs in the time period 2017–2021. Though with some fluctuations, all these DMUs are found with improved productivity as their MPIs >1.
5. Conclusions and Future Research Direction
This research proposes a hybrid model combining GM(1,1) with DEA Window model as a means to evaluate the current performance (2012–2016) and future performance (2017–2021) of 16 Asia airline companies. Their performance in different time periods was measured by measurements including the Efficiency Change Index, Technological Change Index, and MPI. The main results are summarized as follows.
- The DEA Window analysis showed that DMUs performed differently for the time period of 2012 to 2016. Specifically, airline companies, including Emirates, Cebu Pacific, and Sri Lankan Airlines, are in the 1st group with leading performance. Airline companies Thai Airways, Jet Airways, Air China, China Southern Airlines, China Eastern Airlines, Oman Air, Garuda Indonesia, and Cathay Pacific are in the 2nd group, followed by the 3rd group that includes Singapore Airlines, Japan Airlines, and All Nippon Airway. Singapore Airlines and Cathay Pacific used to perform well in the Asia air transport industry, but they have lost their leading positions.
- The Efficiency change indexes (catch-up effect) showed that Air China, China Southern Airlines, China Eastern Airlines, Eva Air, China Airlines, and Oman Air improved their efficiency for the time period 2012 to 2016. Especially, Air China, China, China Eastern Airlines, Eva Air, China Airlines, and Oman Air had a noticeable improvement. Meanwhile, All Nippon Airways and Japan Airlines had declined efficiency. In the time period 2017 to 2021 most airline companies are expected to have declined efficiency; especially China Eastern Airlines and Sir Lanka Airlines, which will experience a dramatic dip on their efficiency.
- The Technological change indexes (Frontier-shift effect) showed that these DMUs failed to improve their technological capabilities in the time period 2012 to 2016. In the time period 2017 to 2021 most of the DMUs are expected to have a stable Technological Change Index, excluding China Eastern Airlines that will have a declined Technological change index in the time period 2017 to 2020, which then recovers in 2021.
- The MPIs showed that Cathay Pacific Group, China Southern Airlines, China Eastern Airlines and Oman Air performed poorly in the first time period 2012 to 2013, but improved their performance in following years from 2013 to 2016. In 2016, airline companies China Southern Airlines, China Eastern Airlines, and Oman Air had greatly improved their MPIs in 2016, while airline companies All Nippon Airways, Japan Airlines, and Sri Lankan Airlines had a declined MPI. In the time period 2017 to 2021, all airline companies are expected to improve their productivity as their MPIs ≥1.
This paper proposed a novel approach and applied it to investigate the performance of Asia airline companies. To our best knowledge, in past studies this novel approach has never been proposed and used for this purpose. However, this research still has some limitations. First, due to the lack of annual reports, only some of the Asia airline companies have been included in this research: including more Asia airline companies can give a more detailed overall view. Second, this research only includes specific input and output variables. The use of other input and output variables may lead to different results. As one study cannot complete all these tasks, relaxing these limitations can be considered for future research.
Author Contributions
C.-N.W. guided the research direction and found the solutions; T.-T.T. conducted the literature review and designed the experiments; H.-P.H. summarized the data and edited the paper; L.-H.N. conducted experiments and derived the results. All authors have contribution to this paper.
Funding
This research received no external funding.
Conflicts of Interest
The authors declare no conflict of interest.
References
- Cederholm, T. The Global Airline Industry Contributes to Economic Development. Available online: https://finance.yahoo.com/news/global-airline-industry-contributes-economic-174012431.html (accessed on 6 November 2017).
- Domínguez, G. Asia’s Aviation Industry Flying High. Available online: http://www.dw.com/en/asias-aviation-industry-flying-high/a-19049866 (accessed on 6 November 2017).
- Boeing Commercial Airplanes. Current Market Outlook 2017–2036. Available online: http://www.boeing.com/resources/boeingdotcom/commercial/market/current-market-outlook-2017/assets/downloads/2017-cmo-6-19.pdf (accessed on 6 November 2017).
- Recio, A. Asia Pacific: The World’s Fastest Growing Aviation Market. Available online: https://knect365.com/gad/article/9a586c65-a7e0-4b8d-85a5-4409bc2fc613/asia-pacific-the-worlds-fastest-growing-aviation-market (accessed on 6 November 2017).
- Welford, R.; Roeth, H.; Bal, S. Airlines in Asia; Issues for Responsible Investors; Responsible Research Pte Ltd.: Singapore, Singapore, 2010. [Google Scholar]
- Distexhe, V.; Perelman, S. Technical Efficiency and Productivity Growth in an Era of Deregulation: The Case of Airlines. Swiss J. Econ. Stat. 1994, 130, 669–689. [Google Scholar]
- Barbot, C.; Costa, A.; Sochirca, E. Airlines performance in the new market context: A comparative productivity and efficiency analysis. J. Air Transp. Manag. 2008, 14, 270–274. [Google Scholar] [CrossRef] [Green Version]
- Barros, C.P.; Peypoch, N. An evaluation of European Airlines’ operational performance. Int. J. Prod. Econ. 2009, 122, 525–533. [Google Scholar] [CrossRef]
- Merkert, R.; Hensher, D.A. The impact of strategic management and fleet planning on airline efficiency: A random effects Tobit model based on DEA efficiency scores. Transp. Res. Part A Policy Pract. 2011, 45, 686–695. [Google Scholar] [CrossRef]
- Assaf, A.G.; Josiassen, A. European vs. U.S. airlines: Performance comparison in a dynamic market. Tour. Manag. 2012, 33, 317–326. [Google Scholar] [CrossRef]
- Arjomandi, A.; Seufert, J.H. An evaluation of the world’s major airlines’ technical and environmental performance. Econ. Model. 2014, 41, 133–144. [Google Scholar] [CrossRef]
- Lee, B.L.; Worthington, A.C. Technical efficiency of mainstream airlines and low cost carriers: New evidence using bootstrap data envelopment analysis truncated. J. Air Transp. Manag. 2014, 38, 15–20. [Google Scholar] [CrossRef]
- Lozano, S.; Gutiérrez, E. A slacks-based network DEA efficiency analysis of European airlines. Transp. Plan. Technol. 2014, 37, 623–637. [Google Scholar] [CrossRef]
- Mallikarjun, S. Efficiency of US airlines: A strategic operating model. J. Air Transp. Manag. 2015, 43, 46–56. [Google Scholar] [CrossRef]
- Tavassoli, M.; Faramarzi, G.R.; Farzipoor Saen, R. Efficiency and effectiveness in airline performance using a SBM-NDEA model in the presence of shared input. J. Air Transp. Manag. 2014, 34, 146–153. [Google Scholar] [CrossRef]
- Deng, J.L. Control problems of Grey Systems. Syst. Control Lett. 1982, 5, 288–294. [Google Scholar]
- Liu, S.; Yang, Y.; Xie, N.; Forrest, J. New progress of Grey System Theory in the new millennium. Grey Syst. Theory Appl. 2016, 6, 2–31. [Google Scholar] [CrossRef]
- Hsu, L. Using improved grey forecasting models to forecast the output of opto-electronics industry. Expert Syst. Appl. 2011, 38, 13879–13885. [Google Scholar] [CrossRef]
- Chen, Z.; Wang, X. Applying the Grey Forecasting Model to the Energy Supply Management Engineering. Syst. Eng. Procedia 2012, 5, 179–184. [Google Scholar] [CrossRef] [Green Version]
- Hamzacebi, C.; Es, H.A. Forecasting the annual electricity consumption of Turkey using an optimized grey model. Energy 2014, 70, 165–171. [Google Scholar] [CrossRef]
- Shaikh, F.; Ji, Q.; Shaikh, P.H.; Mirjat, N.H.; Uqaili, M.A. Forecasting China’s natural gas demand based on optimised nonlinear grey models. Energy 2017, 140, 941–951. [Google Scholar] [CrossRef]
- Liu, S.; Forrest, J. The current developing status on Grey System Theory. J. Grey Syst. 2007, 2, 111–123. [Google Scholar]
- Fethi, M.D.; Jackson, P.M.; Weyman-Jones, T.G. European Airlines: A Stochastic DEA Study of Efficiency with Market Liberalization; Efficiency and Productivity Research Unit, University of Leicester: Leicester, UK, 2001; pp. 1–4. [Google Scholar]
- Rashmi, M. Benchmarking the Operating Efficiency of U.S. Airlines Using DEA. In Proceedings of the Asia Pacific Decisions Sciences Institute’s Annual Meetings, Boston, MA, USA, 19–22 November 2011. [Google Scholar]
- Gramani, M.C. Efficiency decomposition approach: A cross-country airline analysis. Expert Syst. Appl. 2012, 39, 5815–5819. [Google Scholar] [CrossRef]
- Żółtaszek, A.; Pisarek, R. Effectiveness of National Airlines in Europe—The DEA Approach. Folia Oeconomica Stetin. 2016, 16. [Google Scholar] [CrossRef]
- Lee, B.L.; Worthington, A.C. The Relative Efficiency of International, Domestic, and Budget Airlines: Nonparametric Evidence; Griffith University: Brisbane, Australia, 2010. [Google Scholar]
- Jain, R.K.; Natarajan, R. A DEA study of airlines in India. Asia Pac. Manag. Rev. 2015, 20, 285–292. [Google Scholar] [CrossRef]
- Merkert, R.; Williams, G. Determinants of European PSO airline efficiency—Evidence from a semi-parametric approach. J. Air Transp. Manag. 2013, 29, 11–16. [Google Scholar] [CrossRef]
- Fickling, D. The Decline and Fall of Asia’s Airline Enterprises. Available online: https://www.bloomberg.com/gadfly/articles/2017-01-19/ominous-fading-of-air-power-in-hong-kong-and-singapore (accessed on 6 November 2017).
- Layne, N. After Bankruptcy and Makeover, Japan Airlines Returns. Available online: https://www.reuters.com/article/us-japanairlines-ipo/after-bankruptcy-and-makeover-japan-airlines-returns-idUSBRE88H1AP20120918 (accessed on 6 November 2017).
Figure 1.
Average annual growth rate of Asia aviation industry for the time period of 2016 to 2020. Sources: http://www.dw.com.
Figure 1.
Average annual growth rate of Asia aviation industry for the time period of 2016 to 2020. Sources: http://www.dw.com.

Figure 2.
Average efficiency ranking of DMUs from 2012 to 2016.

Figure 3.
The efficiency change indexes of DMUs (2012–2016).

Figure 4.
The efficiency change indexes of DMUs (2017–2021).

Figure 5.
The technological change indexes of DMUs (2012–2016).

Figure 6.
The technological change indexes of DMUs (2017–2021).

Figure 7.
Malmquist productivity index (2012–2016).


Table 1.
List of 16 airline companies (DMUs).
| No | Airline Company | Country | DMU Code |
|---|---|---|---|
| 1 | Emirates | United Arab Emirates | DMU |
| 2 | Thai Airways | Thailand | DMU2 |
| 3 | Cathay Pacific Group | Hong Kong | DMU3 |
| 4 | Jet Airways | India | DMU4 |
| 5 | Air China | China | DMU5 |
| 6 | China Southern Airlines | China | DMU6 |
| 7 | China Eastern Airlines | China | DMU7 |
| 8 | All Nippon Airways | Japan | DMU8 |
| 9 | Cebu Pacific | Philippines | DMU9 |
| 10 | Japan Airlines | Japan | DMU10 |
| 11 | Eva Air | Taiwan | DMU11 |
| 12 | China Airlines | Taiwan | DMU12 |
| 13 | Oman Air | Oman | DMU13 |
| 14 | Sri Lankan Airlines | Sri Lankan | DMU14 |
| 15 | Garuda Indonesia Airways | Indonesia | DMU15 |
| 16 | Singapore Airlines | Singapore | DMU16 |
Table 2.
Input and output variables used in previous researches.
| Previous Researches | Input Variable | Output Variable |
|---|---|---|
| Fethi et al. [23] | ATK (available tone kilometer), operating cost Nonflight assets | RPK (revenue passenger kilometer), Non passenger revenue |
| Rashmi, M. [24] | Operating cost as percentage of revenue Fixed assets turnover ratio | Passenger Load Factor |
| Gramani, M.C. [25] | Aircraft Fuel, Wages Salaries Benefits Cost per available seatmate | Flight Revenue Flight Income |
| Barbot et al. [7] | Labor (number of core business workers) Fleet (number of operating aircraft) Fuel (in gallons consumed) | ASK (available seat kilometer) RPK (revenue passenger kilometer) RTK (revenue ton kilometers) |
| Żółtaszek & Pisarek [26] | Fleet Number of employee Number of destinations | Total revenue Number of passenger Load factor |
| Lee & Worthington [27] | ATK Operating cost Nonflight assets | RPK Non passenger revenue |
| Jain & Natarajan (2015) [28] | Total Available ton kilometer (ATKM) Operating cost | RPK Non Passenger revenue |
| Assaf & Josiassen [10] | Staff number Total Assets Fuel Operating expenses | RPK Incidental revenues |
| Merkert and Williams [29] | ASK FTE | RPK Realized Departures |
Table 3.
Pearson correlation coefficients of input and output variables in 2012.
| Fleet | Total Asset | Operating Expenses | RPK | ASK | |
|---|---|---|---|---|---|
| Fleet | 1 | 0.766713 | 0.727115 | 0.724468 | 0.729144 |
| Total Asset | 0.766713 | 1 | 0.967721 | 0.883336 | 0.902239 |
| Operating expenses | 0.727115 | 0.967721 | 1 | 0.896062 | 0.920124 |
| RPK | 0.724468 | 0.883336 | 0.896062 | 1 | 0.997899 |
| ASK | 0.729144 | 0.902239 | 0.920124 | 0.997899 | 1 |
Table 4.
Pearson correlation coefficients of input and output variables in 2013.
| Fleet | Total Asset | Operating Expenses | RPK | ASK | |
|---|---|---|---|---|---|
| Fleet | 1 | 0.795090 | 0.712596 | 0.704832 | 0.707295 |
| Total Asset | 0.795090 | 1 | 0.952161 | 0.900676 | 0.909052 |
| Operating expenses | 0.712596 | 0.952161 | 1 | 0.916749 | 0.935786 |
| RPK | 0.704832 | 0.900676 | 0.916749 | 1 | 0.997813 |
| ASK | 0.707295 | 0.909052 | 0.935786 | 0.997813 | 1 |
Table 5.
Pearson correlation coefficients of input and output variables in 2014.
| Fleet | Total Asset | Operating Expenses | RPK | ASK | |
|---|---|---|---|---|---|
| Fleet | 1 | 0.819426 | 0.705601 | 0.705590 | 0.719359 |
| Total Asset | 0.819426 | 1 | 0.958505 | 0.922943 | 0.924216 |
| Operating expenses | 0.705601 | 0.958505 | 1 | 0.937495 | 0.945536 |
| RPK | 0.705590 | 0.922943 | 0.937495 | 1 | 0.995516 |
| ASK | 0.719359 | 0.924216 | 0.945536 | 0.995516 | 1 |
Table 6.
Pearson correlation coefficients of input and output variables in 2015.
| Fleet | Total Asset | Operating Expenses | RPK | ASK | |
|---|---|---|---|---|---|
| Fleet | 1 | 0.808687 | 0.697654 | 0.729319 | 0.714401 |
| Total Asset | 0.808687 | 1 | 0.958421 | 0.942910 | 0.936114 |
| Operating expenses | 0.697654 | 0.958421 | 1 | 0.940155 | 0.945504 |
| RPK | 0.729319 | 0.942910 | 0.940155 | 1 | 0.99780 |
| ASK | 0.714401 | 0.936114 | 0.945504 | 0.99780 | 1 |
Table 7.
Pearson correlation coefficients of input and output variables in 2016.
| Fleet | Total Asset | Operating Expenses | RPK | ASK | |
|---|---|---|---|---|---|
| Fleet | 1 | 0.790132 | 0.654574 | 0.739650 | 0.713132 |
| Total Asset | 0.790132 | 1 | 0.951402 | 0.936297 | 0.926245 |
| Operating expenses | 0.654574 | 0.951402 | 1 | 0.928332 | 0.935735 |
| RPK | 0.739650 | 0.936297 | 0.928332 | 1 | 0.997681 |
| ASK | 0.713132 | 0.926245 | 0.935735 | 0.997681 | 1 |
Table 8.
Input and output data of DMU-Emirates for the time period of 2012 to 2016.
| DMU | Input Variables | Output Variables | |||
|---|---|---|---|---|---|
| Fleet (N) | Total Asset (M) | Operating Expenses (M) | RPK (M) | ASK (M) | |
| 2012 | 197 | 25,810 | 19,132 | 188,618 | 236,645 |
| 2013 | 205 | 27,663 | 21,339 | 215,353 | 271,133 |
| 2014 | 217 | 30,319 | 22,577 | 235,498 | 295,740 |
| 2015 | 236 | 32,446 | 20,885 | 255,176 | 333,726 |
| 2016 | 244 | 33,095 | 22,496 | 276,608 | 368,102 |
N: number of planes; M: Millions of dollars.
Table 9.
Predictive values for the DMU-Emirates from 2017 to 2021.
| k (year) | Ẍ(1)(k) | Value | Ẍ(0)(k) | Value |
|---|---|---|---|---|
| 0 (2012) | Ẍ(1)(0) | 197 | Ẍ(0)(0) | 197 |
| 1 (2013) | Ẍ(1)(1) | 402.549 | Ẍ(0)(1) | 205.549 |
| 2 (2014) | Ẍ(1)(2) | 620.8188 | Ẍ(0)(2) | 218.2698 |
| 3 (2015) | Ẍ(1)(3) | 852.5966 | Ẍ(0)(3) | 231.7778 |
| 4 (2016) | Ẍ(1)(4) | 1098.718 | Ẍ(0)(4) | 246.1219 |
| 5 (2017) | Ẍ(1)(5) | 1360.072 | Ẍ(0)(5) | 261.3536 |
| 6 (2018) | Ẍ(1)(6) | 1637.6 | Ẍ(0)(6) | 277.528 |
| 7 (2019) | Ẍ(1)(7) | 1932.303 | Ẍ(0)(7) | 294.7034 |
| 8 (2020) | Ẍ(1)(8) | 2245.245 | Ẍ(0)(8) | 312.9417 |
| 9 (2021) | Ẍ(1)(9) | 2577.554 | Ẍ(0)(9) | 332.3087 |
Table 10.
Average mean absolute percentage error (MAPE) of 16 DMUs.
| DMU | Average MAPE | DMU | Average MAPE |
|---|---|---|---|
| DMU | 0.264% | DMU9 | 0.370% |
| DMU2 | 0.202% | DMU10 | 0.161% |
| DMU3 | 0.136% | DMU11 | 0.393% |
| DMU4 | 0.295% | DMU12 | 0.256% |
| DMU5 | 0.266% | DMU13 | 0.454% |
| DMU6 | 0.263% | DMU14 | 0.327% |
| DMU7 | 0.341% | DMU15 | 0.318% |
| DMU8 | 0.261% | DMU16 | 0.350% |
Table 11.
The results of DEA Window of the whole time period (2012–2016).
| DMU | 2012 | 2013 | 2014 | 2015 | 2016 | Average | Rank |
|---|---|---|---|---|---|---|---|
| DMU | 0.86087 | 0.93750 | 0.96418 | 0.99010 | 1 | 0.95053 | 3 |
| DMU2 | 0.71509 | 0.75317 | 0.72810 | 0.83631 | 0.92865 | 0.79226 | 8 |
| DMU3 | 0.63944 | 0.64499 | 0.66169 | 0.77884 | 0.80489 | 0.70597 | 13 |
| DMU4 | 0.60787 | 0.65282 | 0.75102 | 0.97636 | 1 | 0.79761 | 6 |
| DMU5 | 0.66655 | 0.69015 | 0.73300 | 0.88035 | 0.99459 | 0.79293 | 7 |
| DMU6 | 0.69301 | 0.69677 | 0.73283 | 0.90591 | 1 | 0.80570 | 4 |
| DMU7 | 0.63906 | 0.63079 | 0.66623 | 0.80734 | 0.93072 | 0.73483 | 11 |
| DMU8 | 0.34404 | 0.37457 | 0.41181 | 0.49835 | 0.48914 | 0.42358 | 16 |
| DMU9 | 0.99999 | 0.99999 | 0.88483 | 1 | 1 | 0.97696 | 2 |
| DMU10 | 0.40257 | 0.42807 | 0.44737 | 0.51833 | 0.49747 | 0.45876 | 15 |
| DMU11 | 0.71147 | 0.71166 | 0.67782 | 0.76469 | 0.79001 | 0.73113 | 12 |
| DMU12 | 0.74181 | 0.70856 | 0.67111 | 0.78235 | 0.83201 | 0.74717 | 10 |
| DMU13 | 0.83861 | 0.75311 | 0.71826 | 0.79151 | 0.82447 | 0.78519 | 9 |
| DMU14 | 0.95531 | 0.99999 | 1 | 1 | 1 | 0.99106 | 1 |
| DMU15 | 0.67835 | 0.72651 | 0.76804 | 0.87253 | 0.96227 | 0.80154 | 5 |
| DMU16 | 0.73829 | 0.71510 | 0.67015 | 0.67498 | 0.68741 | 0.69719 | 14 |
Table 12.
The three windows of 3-year period.
| Windows | Years |
|---|---|
| 1st Window | 2012–2014 |
| 2nd Window | 2013–2015 |
| 3rd Window | 2014–-2016 |
Table 13.
The results of DEA Window for a 3-year period.
| DMU | 2012 | 2013 | 2014 | 2015 | 2016 | Average | Rank |
|---|---|---|---|---|---|---|---|
| Emirates | 0.94 | 1.00 | 1.00 | ||||
| 0.98 | 1.00 | 1.00 | |||||
| 0.96 | 0.99 | 1.00 | |||||
| Average | 0.94 | 0.99 | 0.99 | 1.00 | 1.00 | 0.98 | 3 |
| Thai Airways | 0.86 | 0.92 | 0.89 | ||||
| 0.79 | 0.76 | 0.87 | |||||
| 0.73 | 0.84 | 0.93 | |||||
| Average | 0.86 | 0.85 | 0.79 | 0.85 | 0.93 | 0.86 | 8 |
| Cathay Pacific Group | 0.77 | 0.78 | 0.80 | ||||
| 0.66 | 0.67 | 0.79 | |||||
| 0.66 | 0.78 | 0.80 | |||||
| Average | 0.77 | 0.72 | 0.71 | 0.79 | 0.80 | 0.76 | 11 |
| Jet Airways | 0.78 | 0.86 | 1.00 | ||||
| 0.73 | 0.83 | 1.00 | |||||
| 0.75 | 0.98 | 1.00 | |||||
| Average | 0.78 | 0.79 | 0.86 | 0.99 | 1.00 | 0.88 | 5 |
| Air China | 0.84 | 0.87 | 0.92 | ||||
| 0.73 | 0.78 | 0.95 | |||||
| 0.73 | 0.88 | 0.99 | |||||
| Average | 0.84 | 0.80 | 0.81 | 0.92 | 0.99 | 0.87 | 7 |
| China Southern Airlines | 0.83 | 0.87 | 0.93 | ||||
| 0.73 | 0.78 | 0.98 | |||||
| 0.73 | 0.91 | 1.00 | |||||
| Average | 0.83 | 0.80 | 0.81 | 0.94 | 1.00 | 0.88 | 6 |
| China Eastern Airlines | 0.77 | 0.77 | 0.85 | ||||
| 0.65 | 0.71 | 0.88 | |||||
| 0.67 | 0.81 | 0.93 | |||||
| Average | 0.77 | 0.71 | 0.74 | 0.84 | 0.93 | 0.80 | 10 |
| All Nippon Airways | 0.42 | 0.46 | 0.51 | ||||
| 0.39 | 0.43 | 0.52 | |||||
| 0.41 | 0.50 | 0.49 | |||||
| Average | 0.42 | 0.43 | 0.45 | 0.51 | 0.49 | 0.46 | 16 |
| Cebu Pacific | 1.00 | 1.00 | 1.00 | ||||
| 1.00 | 0.89 | 1.00 | |||||
| 0.91 | 1.00 | 1.00 | |||||
| Average | 1.00 | 1.00 | 0.93 | 1.00 | 1.00 | 0.99 | 2 |
| Japan Airlines | 0.49 | 0.53 | 0.55 | ||||
| 0.47 | 0.47 | 0.54 | |||||
| 0.45 | 0.52 | 0.50 | |||||
| Average | 0.49 | 0.50 | 0.49 | 0.53 | 0.50 | 0.50 | 15 |
| Eva Air | 0.73 | 0.72 | 0.75 | ||||
| 0.72 | 0.69 | 0.77 | |||||
| 0.68 | 0.76 | 0.79 | |||||
| Average | 0.73 | 0.72 | 0.71 | 0.77 | 0.79 | 0.74 | 13 |
| China Airlines | 0.77 | 0.74 | 0.79 | ||||
| 0.73 | 0.68 | 0.79 | |||||
| 0.67 | 0.78 | 0.83 | |||||
| Average | 0.77 | 0.74 | 0.71 | 0.79 | 0.83 | 0.77 | 12 |
| Oman Air | 0.93 | 0.84 | 0.80 | ||||
| 0.76 | 0.72 | 0.80 | |||||
| 0.73 | 0.79 | 0.82 | |||||
| Average | 0.93 | 0.80 | 0.75 | 0.80 | 0.82 | 0.82 | 9 |
| SriLankan Airlines | 0.96 | 1.00 | 1.00 | ||||
| 1.00 | 1.00 | 1.00 | |||||
| 1.00 | 1.00 | 1.00 | |||||
| Average | 0.96 | 1.00 | 1.00 | 1.00 | 1.00 | 0.99 | 1 |
| Garuda Indonesia Airways | 0.88 | 0.95 | 1.00 | ||||
| 0.78 | 0.93 | 0.93 | |||||
| 0.77 | 0.87 | 0.96 | |||||
| Average | 0.88 | 0.86 | 0.90 | 0.90 | 0.96 | 0.90 | 4 |
| Singapore Airlines | 0.77 | 0.75 | 0.73 | ||||
| 0.74 | 0.69 | 0.70 | |||||
| 0.67 | 0.67 | 0.69 | |||||
| Average | 0.77 | 0.74 | 0.70 | 0.69 | 0.69 | 0.72 | 14 |
Table 14.
The efficiency change indexes of DMU (2012–2016).
| DMU | 2012–2013 | 2013–2014 | 2014–2015 | 2015–2016 | Average |
|---|---|---|---|---|---|
| DMU | 1 | 1 | 1 | 1 | 1 |
| DMU2 | 1.022144 | 0.945607 | 1.015684 | 1.068443 | 1.01296 |
| DMU3 | 0.920699 | 1.018862 | 1.047909 | 0.982322 | 0.99244 |
| DMU4 | 1.121351 | 1.379235 | 1.082651 | 1.084630 | 1.16696 |
| DMU5 | 0.960345 | 1.036379 | 1.065577 | 1.444541 | 1.12671 |
| DMU6 | 0.933864 | 1.020124 | 1.111289 | 1.456444 | 1.13043 |
| DMU7 | 0.933364 | 0.990430 | 1.025294 | 1.142754 | 1.02296 |
| DMU8 | 1.052998 | 1.058232 | 1.042745 | 0.945054 | 1.02475 |
| DMU9 | 1.011201 | 0.996441 | 1.057971 | 1.022223 | 1.02195 |
| DMU10 | 0.992907 | 1.014996 | 1.000655 | 0.932986 | 0.98538 |
| DMU11 | 1.006890 | 1.029436 | 1.004832 | 1.028759 | 1.01747 |
| DMU12 | 0.971682 | 1.012760 | 1.030212 | 1.059947 | 1.01865 |
| DMU13 | 0.817895 | 0.929828 | 1.088509 | 1.155010 | 0.99781 |
| DMU14 | 1.147281 | 1.005244 | 1.396500 | 1.039999 | 1.14725 |
| DMU15 | 0.993408 | 1.010125 | 0.768008 | 0.984767 | 0.93907 |
| DMU16 | 0.939675 | 1.018399 | 0.974501 | 0.979387 | 0.97799 |
Table 15.
The technological change indexes of DMUs (2012–2016).
| DMU | 2012–2013 | 2013–2014 | 2014–2015 | 2015–2016 | Average |
|---|---|---|---|---|---|
| DMU | 1.030308 | 1.005838 | 0.998817 | 1.018876 | 1.01345 |
| DMU2 | 1.112939 | 1.018684 | 1.168310 | 1.042989 | 1.08573 |
| DMU3 | 1.056719 | 1.021641 | 1.069319 | 1.027652 | 1.04383 |
| DMU4 | 1.183521 | 1.029377 | 1.186115 | 1.059748 | 1.11469 |
| DMU5 | 1.049983 | 1.022626 | 1.337322 | 1.075550 | 1.12137 |
| DMU6 | 1.053584 | 1.018625 | 1.279385 | 1.022795 | 1.09359 |
| DMU7 | 1.053960 | 1.018991 | 1.375833 | 1.247085 | 1.17396 |
| DMU8 | 1.060404 | 1.018654 | 1.109026 | 1.043595 | 1.05792 |
| DMU9 | 1.008379 | 0.997715 | 1.236168 | 1.002991 | 1.06131 |
| DMU10 | 1.060398 | 1.017276 | 1.113167 | 1.031216 | 1.05551 |
| DMU11 | 1.057101 | 1.017305 | 1.074853 | 0.996026 | 1.03632 |
| DMU12 | 1.056490 | 1.020859 | 1.098148 | 0.998859 | 1.04358 |
| DMU13 | 1.053349 | 0.992803 | 1.167868 | 0.972591 | 1.04665 |
| DMU14 | 0.985295 | 0.984564 | 0.943874 | 0.942748 | 0.96412 |
| DMU15 | 1.143990 | 1.102972 | 1.341016 | 1.173203 | 1.19029 |
| DMU16 | 1.064881 | 1.020747 | 1.060730 | 1.028048 | 1.04360 |
Table 16.
The MPIs of DMUs (2012–2016).
| DMU | 2012–2013 | 2013–2014 | 2014–2015 | 2015–2016 | Average |
|---|---|---|---|---|---|
| DMU | 1.030308 | 1.005838 | 0.998817 | 1.018876 | 1.01345 |
| DMU2 | 1.137584 | 0.963275 | 1.186634 | 1.114373 | 1.10046 |
| DMU3 | 0.972920 | 1.040911 | 1.120549 | 1.009486 | 1.03596 |
| DMU4 | 1.327143 | 1.419753 | 1.284148 | 1.149435 | 1.29512 |
| DMU5 | 1.008346 | 1.059828 | 1.425019 | 1.553675 | 1.26171 |
| DMU6 | 0.983904 | 1.039124 | 1.421766 | 1.489644 | 1.23360 |
| DMU7 | 0.983728 | 1.009239 | 1.410633 | 1.425112 | 1.20717 |
| DMU8 | 1.116603 | 1.077972 | 1.156431 | 0.986254 | 1.08431 |
| DMU9 | 1.019674 | 0.994165 | 1.307830 | 1.025280 | 1.08673 |
| DMU10 | 1.052876 | 1.032531 | 1.113897 | 0.962110 | 1.04035 |
| DMU11 | 1.064385 | 1.047250 | 1.080047 | 1.024671 | 1.05408 |
| DMU12 | 1.026573 | 1.033884 | 1.131325 | 1.058738 | 1.06263 |
| DMU13 | 0.861529 | 0.923136 | 1.271235 | 1.123352 | 1.04481 |
| DMU14 | 1.130409 | 0.989726 | 1.318121 | 0.980457 | 1.10467 |
| DMU15 | 1.136449 | 1.114140 | 1.029911 | 1.155331 | 1.10895 |
| DMU16 | 1.000641 | 1.039527 | 1.033682 | 1.006857 | 1.02017 |
| Average | 1.053317 | 1.049394 | 1.205628 | 1.130228 | 1.10964 |
Table 17.
The forecasted MPIs of DMUs (2017–2021).
| DMU | 2017–2018 | 2018–2019 | 2019–2020 | 2020–2021 | Average |
|---|---|---|---|---|---|
| DMU | 1.019948 | 1.019883 | 1.019828 | 1.020415 | 1.020019 |
| DMU2 | 1.076143 | 1.070901 | 1.060145 | 1.057297 | 1.066121 |
| DMU3 | 1.059506 | 1.059120 | 1.058745 | 1.059874 | 1.059311 |
| DMU4 | 1.228791 | 1.237375 | 1.240584 | 1.257866 | 1.241154 |
| DMU5 | 1.232024 | 1.177755 | 1.157005 | 1.139002 | 1.176446 |
| DMU6 | 1.202669 | 1.175979 | 1.170434 | 1.184397 | 1.183370 |
| DMU7 | 1.330209 | 1.251003 | 1.346116 | 1.099687 | 1.256754 |
| DMU8 | 1.091076 | 1.089263 | 1.090702 | 1.115797 | 1.096709 |
| DMU9 | 1.116606 | 1.113391 | 1.109818 | 1.108030 | 1.111961 |
| DMU10 | 1.070202 | 1.070493 | 1.076761 | 1.082520 | 1.074994 |
| DMU11 | 1.053492 | 1.054542 | 1.072725 | 1.076058 | 1.064204 |
| DMU12 | 1.097660 | 1.083014 | 1.073699 | 1.070021 | 1.081098 |
| DMU13 | 1.143971 | 1.116903 | 1.109269 | 1.105917 | 1.119015 |
| DMU14 | 1.117836 | 1.122267 | 1.058430 | 1.032547 | 1.082770 |
| DMU15 | 1.078566 | 1.085943 | 1.090054 | 1.101419 | 1.088996 |
| DMU16 | 1.032213 | 1.032688 | 1.031053 | 1.031685 | 1.031910 |
| Average | 1.121932 | 1.110032 | 1.110335 | 1.096408 | 1.109677 |
© 2019 by the authors. Licensee MDPI, Basel, Switzerland. This article is an open access article distributed under the terms and conditions of the Creative Commons Attribution (CC BY) license (http://creativecommons.org/licenses/by/4.0/).
Share and Cite
MDPI and ACS Style
Wang, C.-N.; Tsai, T.-T.; Hsu, H.-P.; Nguyen, L.-H. Performance Evaluation of Major Asian Airline Companies Using DEA Window Model and Grey Theory. Sustainability 2019, 11, 2701. https://doi.org/10.3390/su11092701
AMA Style
Wang C-N, Tsai T-T, Hsu H-P, Nguyen L-H. Performance Evaluation of Major Asian Airline Companies Using DEA Window Model and Grey Theory. Sustainability. 2019; 11(9):2701. https://doi.org/10.3390/su11092701
Chicago/Turabian StyleWang, Chia-Nan, Tsang-Ta Tsai, Hsien-Pin Hsu, and Le-Hoang Nguyen. 2019. "Performance Evaluation of Major Asian Airline Companies Using DEA Window Model and Grey Theory" Sustainability 11, no. 9: 2701. https://doi.org/10.3390/su11092701
Note that from the first issue of 2016, this journal uses article numbers instead of page numbers. See further details here.