Article

Estimation of CO2 Emissions of Internal Combustion Engine Vehicle and Battery Electric Vehicle Using LCA

1
Product Strategy Div., Mazda Motor Corporation, 3-1 Shinchi, Fucho-cho, Aki-gun, Hiroshima 730-8670, Japan
2
Department of Environmental Chemistry and Chemical Engineering, School of Advanced Engineering, Kogakuin University, 1-24-2 Nishi-shinjuku, Shinjuku-ku, Tokyo 163-8677, Japan
*
Author to whom correspondence should be addressed.
Sustainability 2019, 11(9), 2690; https://doi.org/10.3390/su11092690
Submission received: 28 March 2019 / Revised: 3 May 2019 / Accepted: 8 May 2019 / Published: 11 May 2019
(This article belongs to the Special Issue Environmental Life Cycle Assessment)

Abstract

:
In order to reduce vehicle emitted greenhouse gases (GHGs) on a global scale, the scope of consideration should be expanded to include the manufacturing, fuel extraction, refinement, power generation, and end-of-life phases of a vehicle, in addition to the actual operational phase. In this paper, the CO2 emissions of conventional gasoline and diesel internal combustion engine vehicles (ICV) were compared with mainstream alternative powertrain technologies, namely battery electric vehicles (BEV), using life-cycle assessment (LCA). In most of the current studies, CO2 emissions were calculated assuming that the region where the vehicles were used, the lifetime driving distance in that region and the CO2 emission from the battery production were fixed. However, in this paper, the life cycle CO2 emissions in each region were calculated taking into consideration the vehicle’s lifetime driving distance in each region and the deviations in CO2 emissions for battery production. For this paper, the US, European Union (EU), Japan, China, and Australia were selected as the reference regions for vehicle operation. The calculated results showed that CO2 emission from the assembly of BEV was larger than that of ICV due to the added CO2 emissions from battery production. However, in regions where renewable energy sources and low CO2 emitting forms of electric power generation are widely used, as vehicle lifetime driving distance increase, the total operating CO2 emissions of BEV become less than that of ICV. But for BEV, the CO2 emissions for replacing the battery with a new one should be added when the lifetime driving distance is over 160,000 km. Moreover, it was shown that the life cycle CO2 emission of ICV was apt to be smaller than that of BEV when the CO2 emissions for battery production were very large.

1. Introduction

In response to the awareness of human induced climate change in the past decades, the international policy agenda has been driven toward greenhouse gas (GHG) reduction. The transport sector, especially land based passenger transport constitutes the fastest growing source of all GHG emissions. It is recognized as a primary sector [1]. Despite the growing importance of CO2 regulation in the passenger transport sector, the focal point of current regulations is limited only to a vehicle’s operational phase, i.e., tank-to-wheel tailpipe emissions. There is currently no regulatory consideration for the other phases of a vehicle’s life cycle.
A prospective unbiased measure to evaluate GHG emissions during a vehicle’s life can be a life-cycle assessment (LCA). This considers the CO2 emissions of vehicles during its operational phase as well as the emissions generated from the fuel extraction, refining, power generation, and its end-of-life phases. LCA studies have gained more attention in recent years as a more holistic view of powertrain solutions for passenger transport with the goal of reducing CO2 emissions.
Previous LCA studies for conventional internal combustion engine vehicles (ICV) [2,3,4,5,6] and advanced powertrain namely; battery electric vehicles (BEV) [2,3,4,5,6], hybrid electric vehicles (HEV) [3,6] and plug-in hybrid electric vehicles (plug-in HEV) [3,6] already exist. In these studies, the CO2 emissions were calculated assuming that the region, the lifetime driving distance, and the CO2 emission from the battery production were fixed at certain conditions which are summarized in Table 1. However, it is commonly understood that the power generation mix for BEV and plug-in HEV, and a vehicle’s lifetime driving distance, vary by region. Also, LCA could be affected by the difference of fuel and electricity consumption of vehicles by region due to the difference of the driving conditions, such as vehicle speed ranges, loading weights, etc. It is noteworthy that Delogu et al. [7] conducted LCA of a diesel car considering some kinds of fuel consumption test cycle. The fact that the CO2 emission from the battery production differs depending on the reference source cannot be overlooked [8,9,10,11]. Therefore, it is necessary to analyze the effects of those variations holistically.
This study focused on CO2 inventory analysis as a preliminary step for future life cycle impact assessment (LCIA) study. Therefore, in this paper, the life cycle CO2 emissions of gasoline and diesel ICV (GE, DE), and BEV were calculated. The US, European Union (EU), Japan, China, and Australia were selected as the regions of vehicle usage, and the fuel efficiency, the electric efficiency, the CO2 emission factor of electric power generation and the CO2 emission for battery production in each region were applied. Also, the effects of variations in driving distance and the CO2 emission from battery production on the total life cycle CO2 emissions was evaluated.

2. Scope of this Study

2.1. Regions for This Study

The US, EU (the average of member countries), Japan, China, and Australia were selected as the regions for this study considering variations in energy situations (e.g., electricity generation mix, petroleum refinery efficiency) and vehicle driving conditions.

2.2. Vehicles Assessed in This Study

In order to analyze the effect of regional vehicle’s lifetime and the CO2 emissions from battery production, the vehicle type for this study was unified to the compact class (also known as “C-segment” in Europe [19]) for both ICV (GE, DE) and BEV, which had the highest production volumes in the world. Specifications of the vehicles listed in Table 2 were referenced by the publicized information on existing vehicles sold in each region as of April 2018; whereby, fuel efficiency and electric efficiency data were officially provided by the automotive manufacturers. The difference in the fuel efficiency of the same vehicle by region could be caused by different driving conditions, as represented by vehicle speed ranges, loading weights, etc. In order to calculate the CO2 emissions of BEV in five regions, the electric efficiency of the BEV in the EU was substituted for China and Australia because the selected model in this paper was not actually sold in these regions and their test cycles for energy efficiency were similar to those of the EU [20]. On the other hand, the CO2 emissions of the selected DE were calculated only for the EU and Japan where they were sold. In Table 2, the fuel and electricity efficiency value in Europe and Japan are based on the NEDC and the JC08 test cycle respectively. Currently, these test cycles are both switched to the WLTC (Worldwide Light-duty vehicle Test Cycle) which reflects real driving conditions more precisely [21], but the data of NEDC and JC08 were used in this study due to limited availability of WLTC data in the market.

2.3. Lifetime

The LCA study for automobiles requires the lifetime driving distance of the vehicles as the functional unit. The lifetime driving distances were cited in the LCA literature for ICVs and/or BEVs such as 150,000 km [22], 160,000 km [23], 180,000 km [2] and 200,000 km [4,24] for the EU, 193,120 km [10] and 320,000 km [2] for the US, and 100,000 km [25] and 110,000 km [26] for Japan.
In this study the lifetime driving distance was defined as a variable from 0 km to 200,000 km in the five regions referring to the above literature.

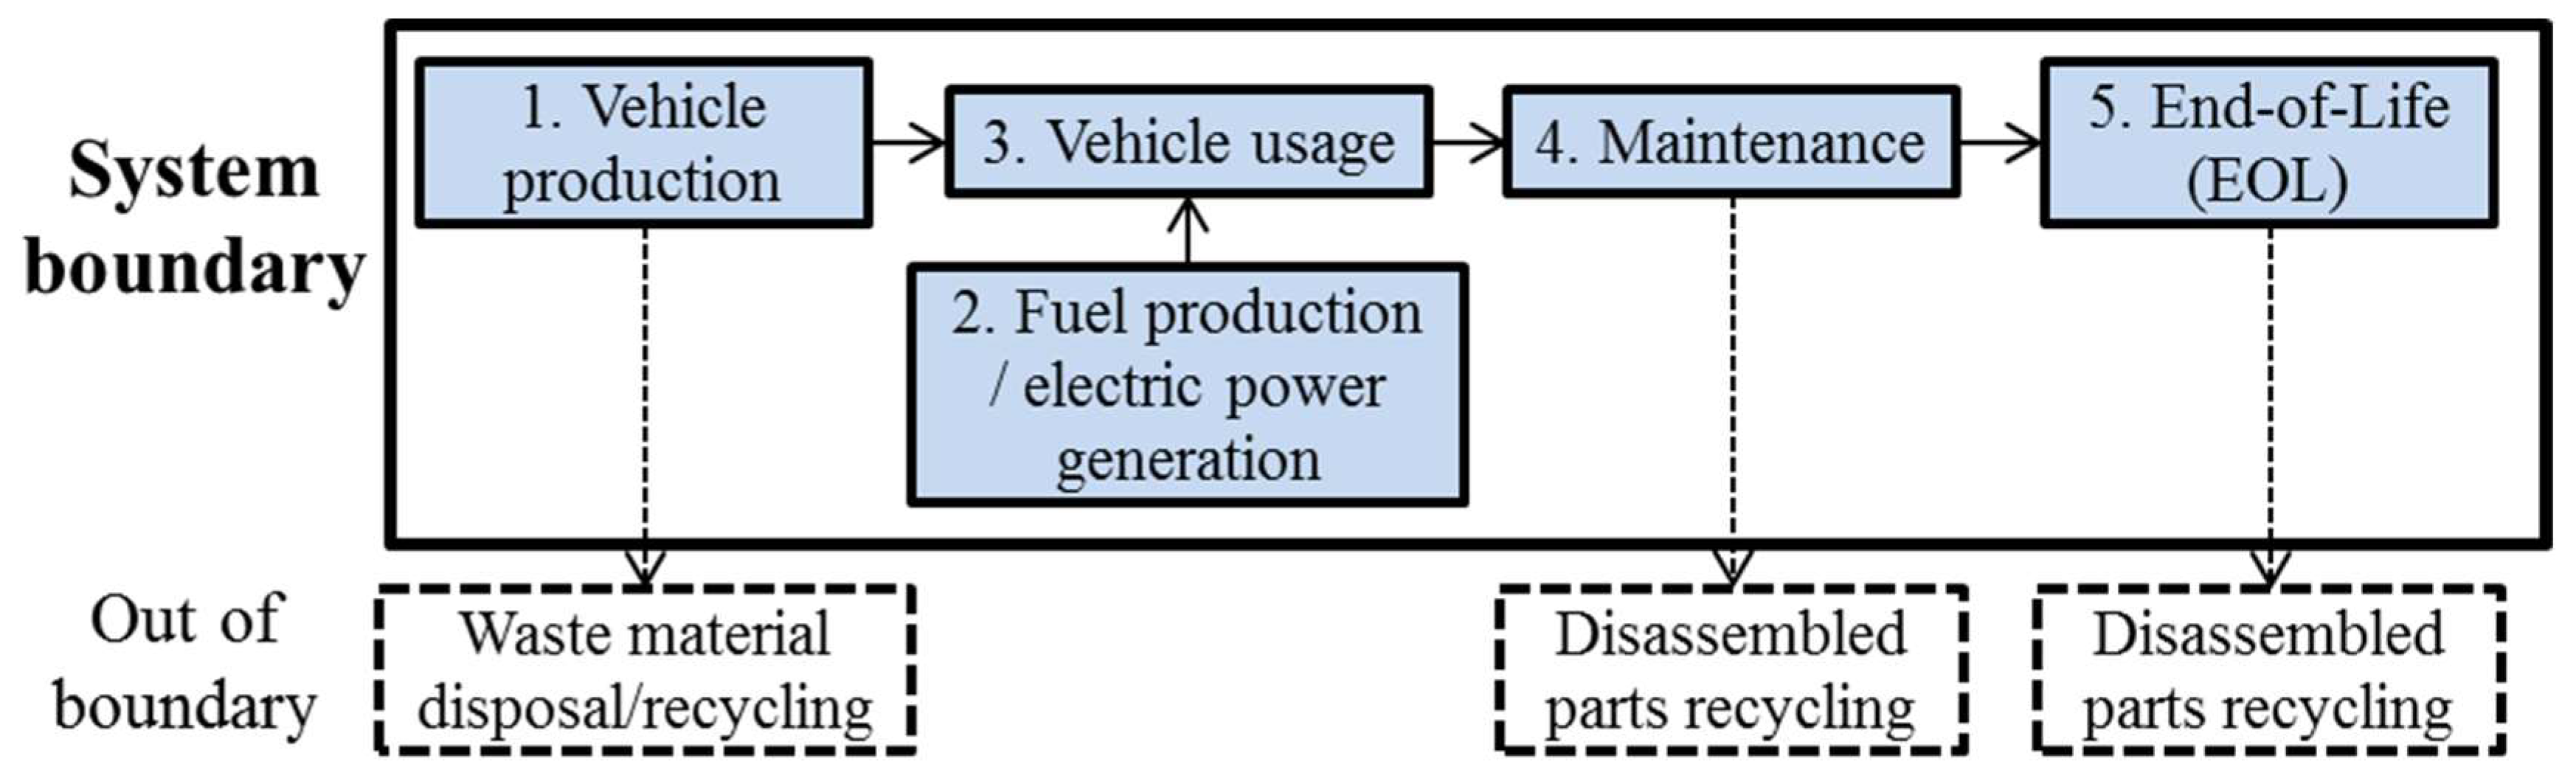
2.4. The Scope of the Assessment

The entire life cycle of vehicles was considered as the scope of this study. The amounts of CO2 emissions were calculated from phases 1 to 5.
Phase 1 Vehicle production: raw material extraction, material production, vehicle component production and vehicle assembly.
Phase 2 Fuel production/electric power generation: production of fuel for ICVs, generation of electric power for BEVs.
Phase 3 Vehicle usage: fuel combustion in driving ICVs
Phase 4 Maintenance: production of replacement parts
Phase 5 End-of-life (EOL): disposal of the vehicles once its useful life has expired.
The scope of this study excluded disposal and recycling of waste materials in the vehicle production phase, recycling of parts removed from the vehicle in the maintenance phase and recycling of the disassembled powertrain parts from the vehicles in the EOL phase. The scope of this assessment is shown as Figure 1.

3. The Calculation at Each Phase of the Life Cycle

3.1. Vehicle Production Phase

The amounts of CO2 emissions for the production phase were calculated by splitting them into four items such as (1) chassis, (2) engine and transmission for GE and DE, (3) inverter and motor for BEV, (4) battery for BEV as follows. In this study, the CO2 emission for the production phase was regarded as the same for all regions.
(1) Chassis parts (body, tires, interiors, etc.) of the GE, DE and BEV were assumed to be identical. The amounts of CO2 emissions of the chassis parts production in this study were calculated based on database of the Life-Cycle Assessment Society of Japan (JLCA) [27]. According to the database, CO2 inventory from material extraction to manufacturing of small passenger gasoline engine vehicle, whose vehicle size is similar to that in this study, was 5494 kg-CO2 and chassis parts account for 76.8% of total vehicle weight. To supplement this, material extraction to vehicle manufacturing was also modeled and the CO2 inventory was calculated based on database JLCA [27]. For the purposes of this study, CO2 emissions for production of chassis parts is assumed to be proportionate to their weight as a fraction of the total vehicle weight. Therefore, CO2 emissions for the production of chassis parts is assumed to be 4219 kg-CO2 (= 5494 kg-CO2 × 0.768) in this study.
(2) The amount of CO2 emissions from the gasoline engine and transmission production was also calculated based on JLCA [27] and assumed to be 1274 kg-CO2 (= 5494 kg-CO2–4219 kg-CO2). As the amount of CO2 emissions from the diesel engine and transmission production was not described in JLCA [27], it was estimated based on the weight difference of 50 kg (= 1360 kg–1310 kg) between GE and DE shown in Table 2 and the weight of the gasoline engine and transmission of 241 kg cited from JLCA [27]. As a result, the amount of CO2 emissions from the diesel engine and transmission production was estimated to be 1,539kg-CO2 (= 1274 kg-CO2 × (241 kg + 50 kg)/241 kg).
(3) The amount of CO2 emissions of the motor and inverter production for the BEV was estimated to be 1070 kg-CO2 and 641 kg-CO2 cited from Hawkins et al. [28] where the material compositions and the CO2 emission factor were quoted from the literature and the CO2 emissions of production of these parts were calculated considering each production process. Although their results were calculated with CO2 equivalent values (kgCO2-eq), these values were regarded as CO2 values in this study.
(4) The CO2 emission factor represents the amount of CO2 emissions per unit battery capacity, which was estimated based on various works in the literature [8,9,10,11]. The criteria for selecting the literature included the following three items: (1) The boundary encompassed raw material extraction through to production of a battery system (or battery pack, which was ready to be assembled to vehicles); (2) Each detailed process of battery production was considered (e.g., cathode production, cell assembly, pack assembly); (3) The lithium-ion battery included either mainstream cathode described as lithium nickel-manganese-cobalt oxide (NMC) cathode or lithium iron phosphate (LFP) cathode types. The results of the CO2 emission factor of battery production are shown in Table 3. The average of the values in the literature was 177 kg-CO2-eq/kWh with the lowest value (121 kg-CO2-eq /kWh) and the highest value (250 kg-CO2-eq /kWh). The summary of the CO2 emissions of the vehicle production phase is shown in Table 4. These values were regarded as CO2 values in this study.
As they were already mentioned above, the chassis parts production and the engine parts production were calculated as CO2 inventory but the motor, inverter and lithium-ion batteries were calculated as greenhouse gas inventory (CO2-eq). In terms of the production of the motor, inverter and lithium-ion batteries, the electricity generation for manufacturing is the main source of the greenhouse gas emissions. According to the LCA database “GaBi” [29], from the electricity generation, the greenhouse gases other than CO2 (e.g., CH4, N2O) are contained only around 5 %. So CO2-eq values were regarded as CO2 values in this study.

3.2. Fuel Production, Fuel Combustion and Electric Power Generation Phase

In this study, the CO2 emissions of gasoline and diesel fuel production, combustion of these fuels and electric power generation which were required to drive GE, DE and BEV, were calculated as follows.
(1)
The CO2 emission factors of the fuel production in each region were cited from the LCA database ”GaBi” [29] ; data was referenced from 2013. Each system boundary for gasoline and diesel fuel is from resource extraction up to service stations. The emission factors of the fuels in “GaBi” [29] are specified with the amount of CO2 emissions by 1 kg fuel [kg-CO2/kg], therefore, the density values of fuel (gasoline: 0.727 kg/L, diesel: 0.828 kg/L) [30] were used to convert [kg-CO2/L] into [kg-CO2/kg].
(2)
The CO2 emission factors of gasoline and diesel fuel combustion were cited [30] which were 2.28 kg-CO2/L for gasoline and 2.62 kg-CO2/L for diesel respectively and they were used in all five regions covered by the study. For both gasoline and diesel fuels, the CO2 emission factors of fuel combustion [30] are 5 to 8 times greater than those of fuel production [29] which varies from region to region.
(3)
The CO2 emission factors of the electric power generation in each region were cited from ”GaBi” [29] ; data was referenced from 2013. The system boundary for the electric power generation is from energy resource extraction to transformation of electric energy to low voltage as the grid mix.
Based on the above results, the amount of CO2 emissions in the phase of fuel production and combustion for ICV (GE and DE) was obtained by the equation below:
C O 2 , I C V ( F P ,   F C ) = ( C F F P + C F F C ) / E I C V · L D
where;
  • CO2, ICV (FP, FC) = the amount of CO2 emissions in the phase of fuel production and combustion [kg-CO2],
  • CFFP = CO2 emission factor of fuel production [kg-CO2/L],
  • CFFC = CO2 emission factor of fuel combustion [kg-CO2/L],
  • EICV = fuel efficiency of ICV [km/L],
  • LD = lifetime driving distance [km].
The amount of CO2 emissions in the phase of electric power generation for BEV was obtained with the following equation:
C O 2 , B E V ( E G ) = C F E G / E B E V · L D
where;
  • CO2, BEV (EG) = the amount of CO2 emissions in the phase of electric power generation [kg-CO2],
  • CFEG = CO2 emission factor of electric power generation [kg-CO2/kWh],
  • EBEV = Electric efficiency of BEV [km/kWh].

3.3. Maintenance Phase

In order to maintain vehicles, some parts need to be replaced at certain intervals. In this study, CO2 emissions from production of parts for maintenance were assessed considering maintenance intervals as shown in Table 5. The interval for a lithium-ion battery was cited from the warranty distances for a lithium-ion battery of BEVs in the US [31,32,33] in which similar distances were shown in the EU and Japan. Maintenance intervals for other parts and the amount of CO2 emissions for their production were cited from the JLCA [27].

3.4. End-of-Life (EOL) Phase

The amount of CO2 emissions in the phase of a vehicle’s end-of-life (EOL) for GE were estimated; referenced from [34] whereby, the EOL treatment consisted of four processes; “Disassembly”, “Shredding and sorting vehicles”, “Transportation (trucking) of the shredder residue” and “Landfilling of shredder residue”. The target parts were body parts, interior parts and exterior parts for the GE. The same boundary used in this literature was applied to DE and BEV in this study. As a result, the amount of CO2 emissions in the EOL phase was the same for GE, DE and BEV which is shown in Table 6.

4. Results

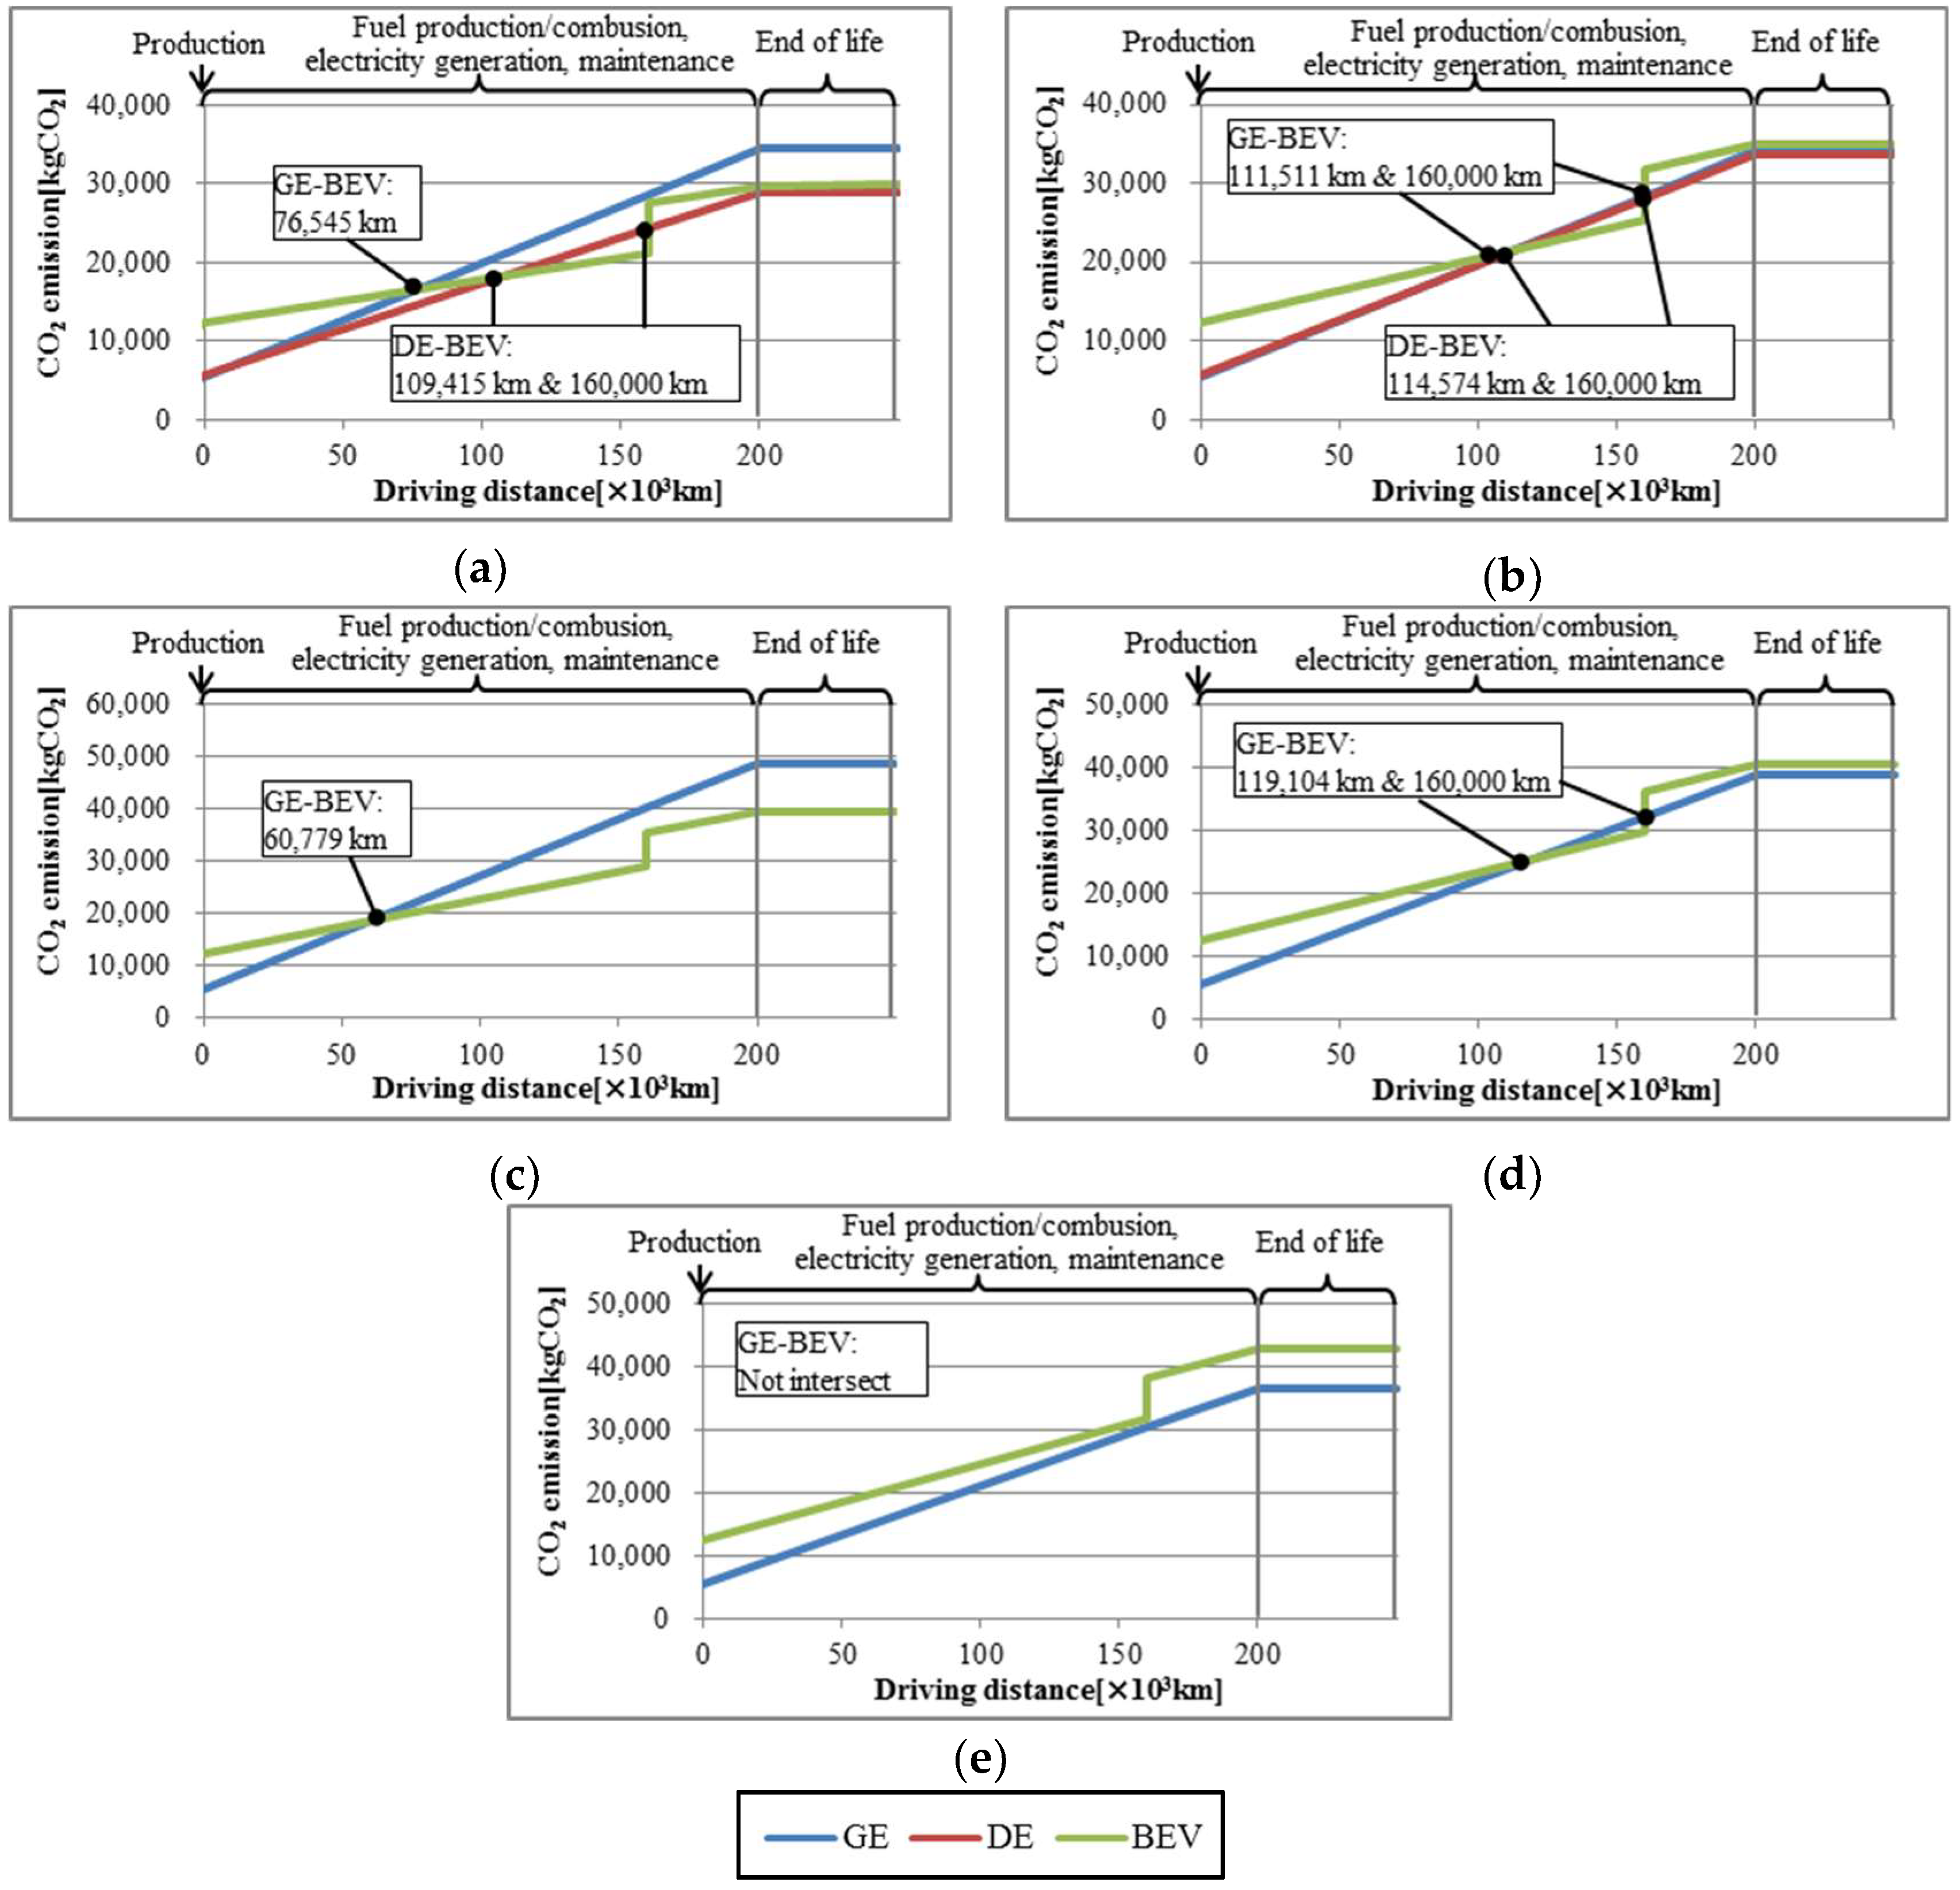
4.1. Effects of Lifetime Driving Distance

The calculation results of total life cycle CO2 emissions for five regions are shown in Figure 2, e.g., (a) EU, (b) Japan, (c) US, (d) China and (e) Australia. The amounts of CO2 emissions of GE, DE and BEV were calculated in the EU and Japan, while those for GE and BEV were calculated in the US, China, and Australia. For these assessments, the averaged value of the CO2 emission factor of the battery production of BEV (177 kg-CO2/kWh) was used as shown in Table 3. In each figure, the point at which lines of GE or DE and BEV intersect each other indicates the driving distance which was defined as “Distance of Intersection Point (DIP)” in this study.
The first observation from the results is that vehicles which exhibit lower CO2 emissions, i.e., ICVs or BEVs, were dependent on the driving distance. For example, as shown in Figure 2c for the US, GE indicated lower CO2 emissions than BEV when the driving distance was less than 60,779 km due to the high CO2 emissions associated with battery production for BEVs, while BEV indicated lower CO2 emissions when the driving distance was over 60,779 km.
Also, in this study, the battery of a BEV was assumed to be replaced once at 160,000 km. For example, in Figure 2a for EU, the amount of CO2 emission of DE was lower than BEV when the driving distance was less than 109,415 km (DIP) and more than 160,000 km (battery replacement mileage). One exception was seen in Figure 2e for Australia, where ICV (GE) consistently indicated lower CO2 emissions than BEV at any driving distance up to 200,000 km.
These results summarized that the longer the vehicle was driven during the vehicle’s lifetime distance, the more the BEVs benefited from CO2 reduction compared to ICV (Australia is only one exception to this point). It was also worth mentioning that the amount of the CO2 emissions of battery replacement of BEV could alter the amount CO2 emissions of ICV to become lower than those of BEV. About the end-of-life emissions, it is hard to identify them in Figure 2 because they were very small relative to the emissions of the other phases.

4.2. Regional Difference of the CO2 Emissions between Internal Combustion Engine Vehicles (ICV) and Battery Electric Vehicles (BEV)

The results shown in Figure 2 indicate that DIP varied by region. For example, for DIPs between GE and BEV, the U.S was the shortest followed by the EU, Japan, and China. Australia had no DIP. In the case of DE and BEV, the DIP in EU was by around 5,000 km less than that of Japan.
The DIP variation in each region was caused by the differences in the set of assumptions that were used in the calculation assumptions. The details will be discussed in Section 5.

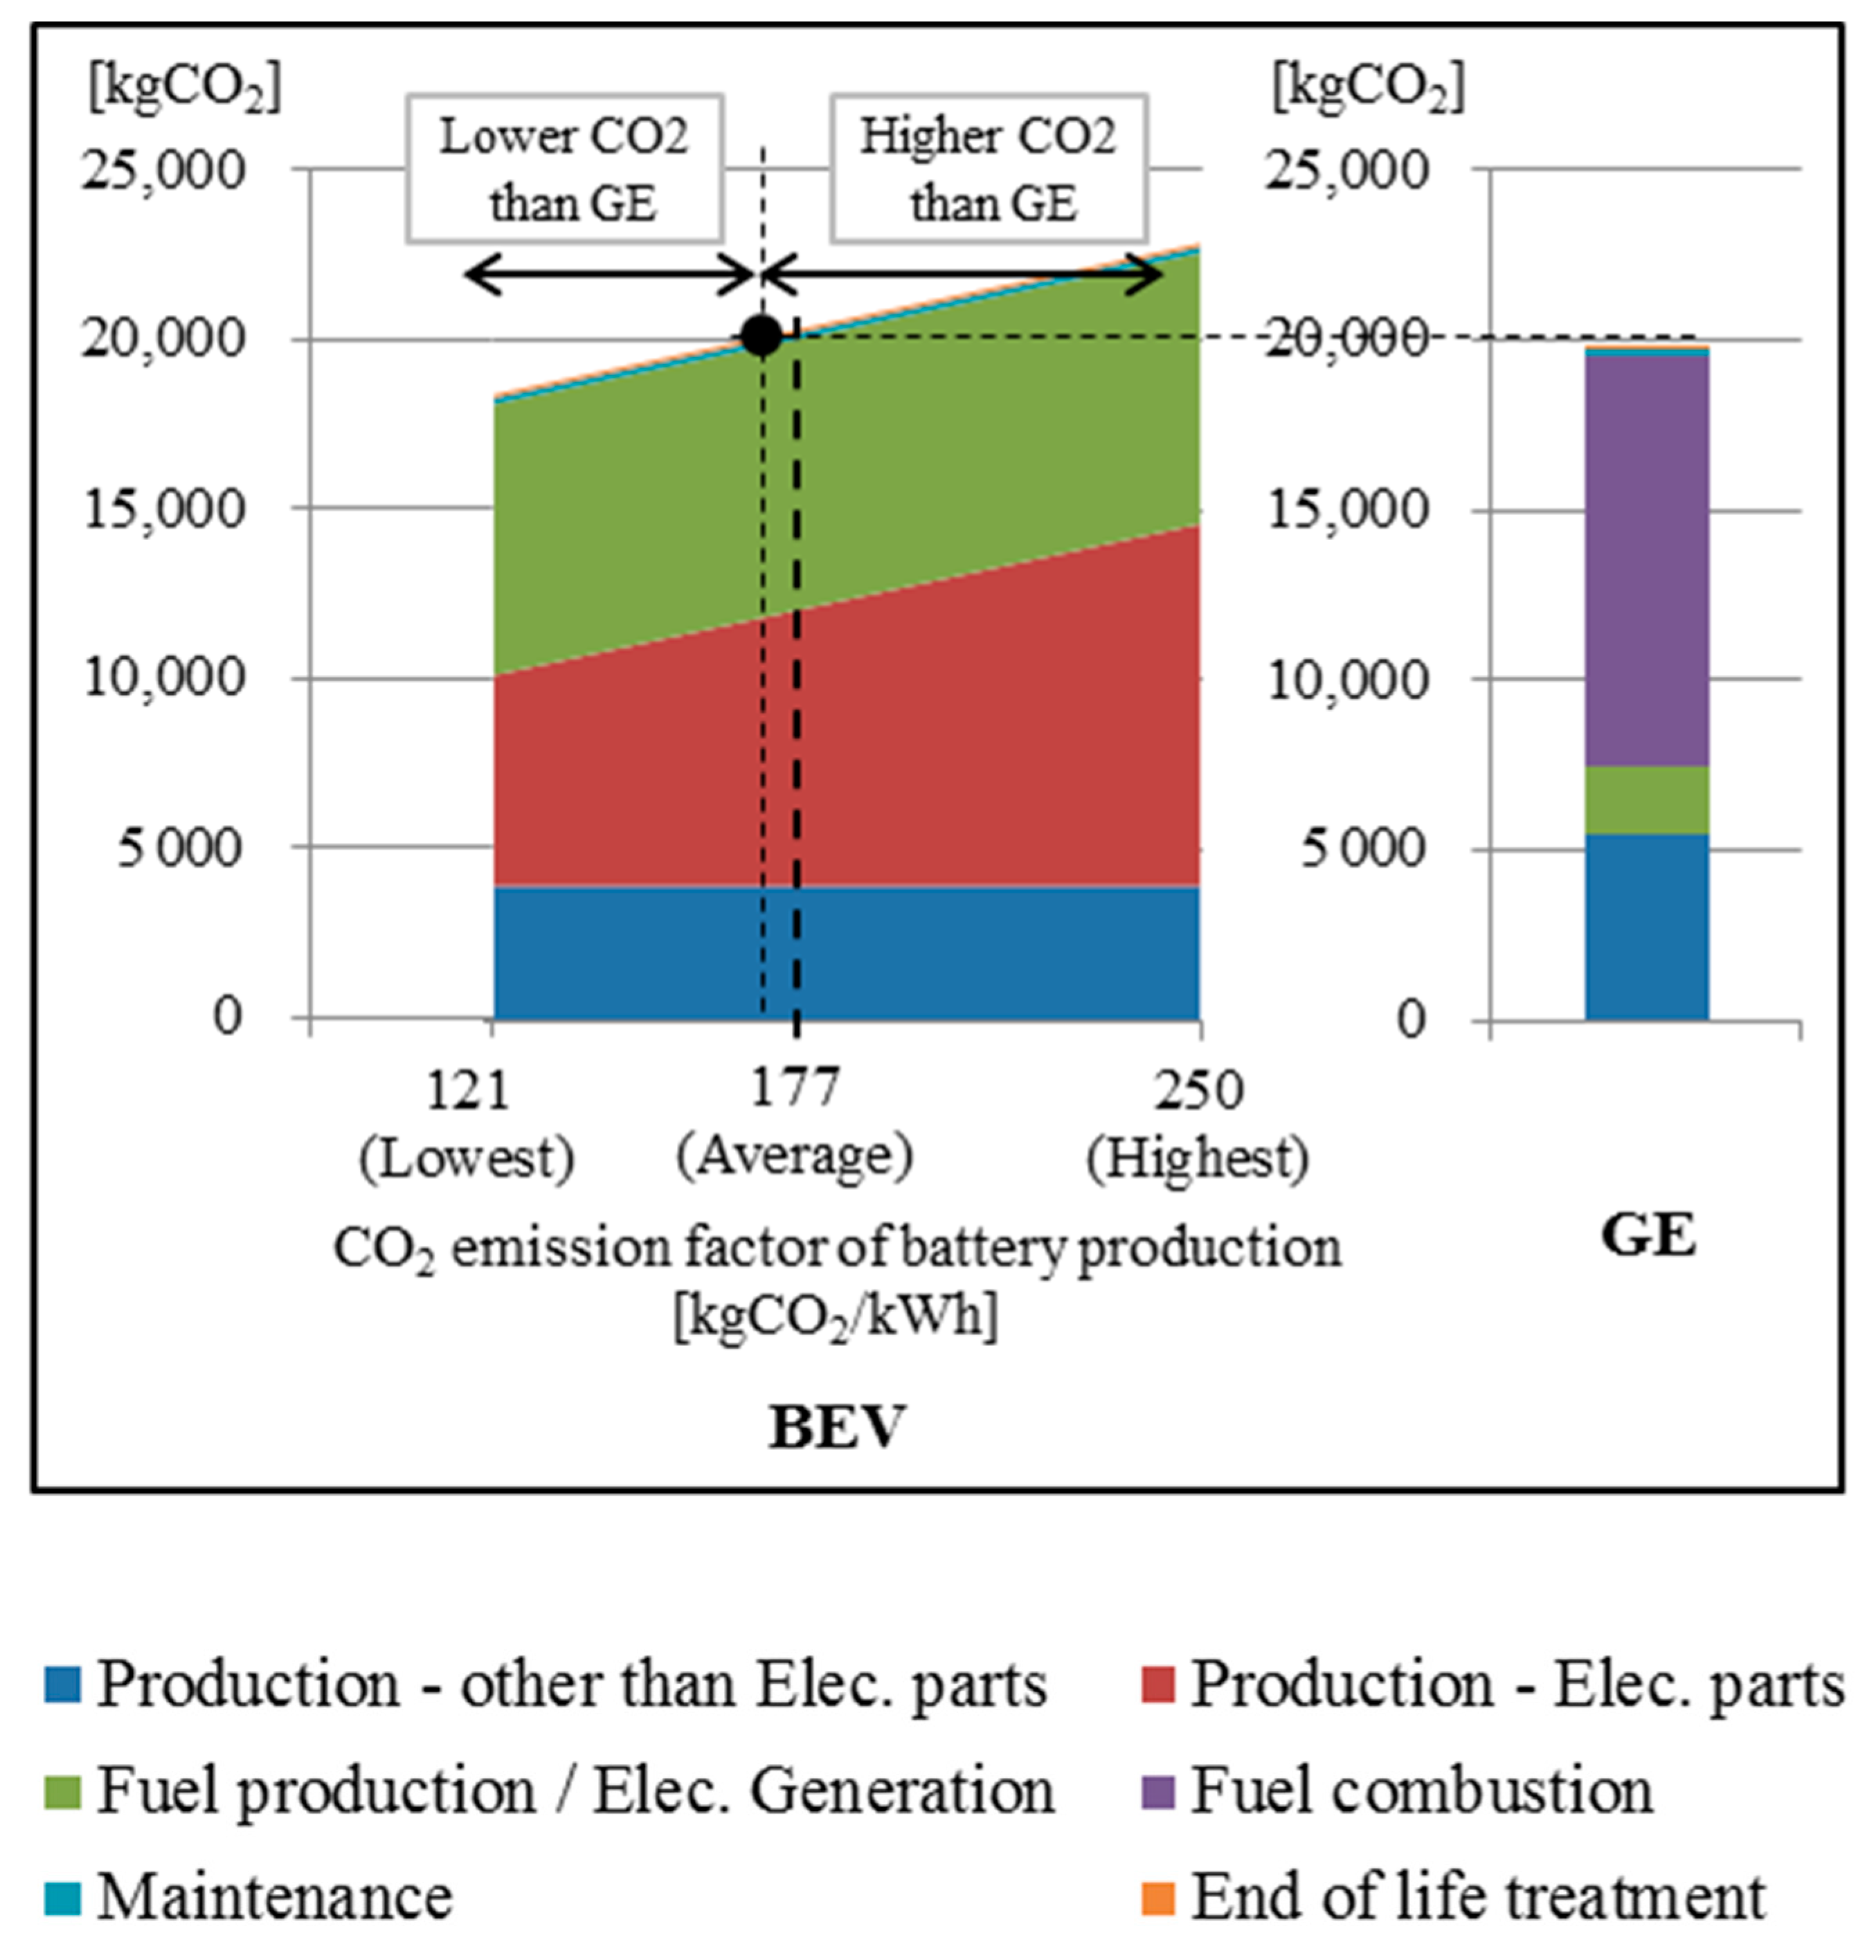
4.3. Effects of the CO2 Emission Factor of Battery Production

Figure 3 represents how the life-cycle CO2 emissions of BEV could alter at the driving distance of 100,000 km in Japan when the CO2 emission factor of the battery production deviates from the lowest value (121 kg-CO2/kWh) to the highest value (250 kg-CO2/kWh) as shown in Table 3 (emissions data for GE is included as a reference). The amount of total life-cycle CO2 emissions from BEV varies drastically depending on the CO2 emission factor of battery production. The lowest emission factor of the battery production showed lower CO2 emissions of BEV than those of GE but the highest factor brought the opposite result.

5. Discussion

5.1. Concern for the Setting of the Lifetime Driving Distance

As noted in Section 4.1, driving distance significantly affects the results of the lifecycle CO2 of ICV compared to BEV to the degree in which the conclusion may be reversed. Therefore, it is essential to use driving distances referenced from the averaged values of statistical data published, for instance, through governments and research institutes in order to properly assess which vehicle powertrain technology demonstrates lower CO2 emissions in the region, ICV or BEV.

5.2. Source of the Regional Differences of the CO2 Emissions between ICV and BEV

Table 7 illustrates the DIP between ICV (GE and DE) and BEV, the fuel efficiency for ICV and electric efficiency for BEV, and the relative emission factor of electric power generation in each area. As mentioned in Section 3.2, as the CO2 emission factor of fuel production accounts for a small portion of the amount of the CO2 emissions compared to combustion of fuel. Therefore, it was excluded in Table 7.
Figure 2 shows that BEV has a higher amount of CO2 emissions than ICV in all regions in the production phase (i.e., the driving distance of 0 km). Then the DIP is determined by the difference in the increased rate of the CO2 emissions during the driving sequences of ICV and BEV, which is the gradient of CO2 emission in Figure 2. More specifically, the DIP is shortened with a higher increase rate of CO2: (fuel efficiency value × [the CO2 emission factor of fuel production + the CO2 emission factor of fuel combustion]) for ICVs, and lower increase rate of CO2: (electric efficiency × the CO2 emission factor of electric power generation) for BEV. Additionally, another tendency found in Table 7 summarizes the effect of diminishing CO2 emission factor during electric power generation. It can be implied that the DIPs of GE and BEV become shorter in the four regions except for the US, which suggests that BEV shows a lower amount of CO2 emissions than GE as the CO2 emission factor of electric power generation decreases. Since the CO2 emission factor of electric power generation differs significantly by region—the factor in Australia, for example, is more than twice that of EU—it is a dominant factor in the difference between DIPs by region. As described in Table 7 (b), the DIP between DE and BEV in EU was shorter than that in Japan due to the CO2 emission factor of the electric power generation in EU being less than that in Japan.
On the other hand, although the CO2 emission factor of electric power generation in the US was larger than that in the EU, the DIP of the US was shorter than that of the EU. Such causes are attributed by the reason that the fuel efficiency of ICV (GE, DE) and the electric efficiency of BEV in the US were substantially worse than those in other regions.
As explained above, the comparison results of CO2 emissions between ICV and BEV differ in each region. When more electricity is generated by renewables leading to a smaller CO2 emission factor of electricity, the amounts of the CO2 emissions of BEV are lower than those of ICV and the DIP comes at a shorter distance. Besides CO2 emission factor of electric power generation, the fuel efficiency of ICV and the electric efficiency of BEV also contribute to the variability between regional differences.

5.3. Estimation of the CO2 Emission Factor of Battery Production

In Section 4.3., it was made clear that the CO2 emission factor of battery production for BEVs significantly affects the results of the total life-cycle CO2 emissions. As described in Section 3, the CO2 emission factor of battery production for BEVs was estimated from previous studies.
Variations in this CO2 factor in past studies result from a variety of different assumptions used in the calculation of CO2 emissions. These include battery manufacturing processes, types of battery materials (cathode, anode, electrolyte, battery pack structure, etc.), system boundaries (how many direct/indirect processes relating to manufacturing are included), and public database used for the calculation.
Peters et al. investigated some literature pertaining to battery production, including batteries for stationary systems in the same manner as this study, and calculated the averaged values. The results were, 160 kg-CO2/kWh for lithium nickel-manganese-cobalt oxide (NCM)-type batteries and 161 kg-CO2/kWh for lithium iron phosphate (LFP)-type batteries [13]. The difference in averaged values between Peters et al. [13] and this study was approximately 10 %. It was concluded that they analyzed differentials in the factors and concluded that the assessment assumptions were the main causes of the differences.
Ellingsen et al. cited in this study calculated the CO2 emissions from the battery production based on the electric power consumption for the battery production, etc. provided by a battery supplier [11]. It is desirable that more reliable CO2 emission data of battery production will become available in the future.

6. Conclusions

In this study, the CO2 emissions of conventional ICV (GE, DE), and BEV were evaluated using the methodology of LCA.
From the regional vehicle’s lifetime perspective, the calculation of CO2 emissions revealed that as the vehicle was driven longer, the lifecycle CO2 emission of BEV became lower than that of ICV, except in Australia where ICV emission was lower than BEV until the end of life. Another observation was that regional sources of power generation (coal, contribution from renewable sources, etc.) had a great effect on the CO2 emissions of BEV. The more the generated electricity came from renewables, the lower the CO2 emissions of BEV were than those of ICV and the DIP comes at a shorter distance. From the viewpoint of battery production, the CO2 emission of BEV had a wide variety which results in the lowest emission factor of battery production, which in turn lowered the CO2 emissions of BEV compared to those of ICV while the highest factor resulted in the opposite conclusion.
This study revealed that the CO2 emissions of ICV (GE, DE), and BEV are dependent on the regions as well as the CO2 emissions of battery production. This study suggested that BEV is not only solution for reducing CO2 emissions globally, but it is important for car manufacturers to introduce ICV as well as BEV to each region in consideration of electricity mixes and so on. In the meanwhile, this study included the limitations listed below.
  • This study focused on the regional differences of the CO2 emission on the fuel production, electric power generation, and fuel combustion phase (i.e., vehicle use stage) but the CO2 emission on the vehicle and parts production phase is assumed to be the same for all regions.
  • As the Joint Research Centre in the EU mentioned [35], the reuse and recycling of lithium-ion batteries is important to mitigate the CO2 emissions because it can avoid productions of new materials or parts, but it was out of scope of this study because there are not sufficient data of recycling in each region.
  • This study focused on ICV and BEV. A fuel cell electric vehicle fueled by hydrogen is also important to mitigate the CO2 emissions [36,37] but it was out of scope of this study.
  • The CO2 emissions in the use phase were calculated based on the fuel/electricity efficiency values of type approval test in each region. These values can be different from the values by real driving conditions.
  • The uncertainty of cited data from references were taken care of in this study, but this study did not holistically perform a sensitivity check to examine which data could change the results widely other than battery production.
It is essential to assess the CO2 emissions of ICV, BEV and the other vehicles, considering the change of the regional power generation mix in the future, along with the introduction of advanced ICV technologies and more reliable CO2 emissions data for battery production with a broader perspective as mentioned in the foregoing limitations of this study.

Author Contributions

Conceptualization, H.M., Y.M., T.N. and M.M.; Writing—original draft, R.K.; Writing—review and editing, Y.S. and A.I.

Funding

This research received no external funding.

Conflicts of Interest

The authors declare no conflict of interest.

References

  1. FIA. Global reduction in CO2 Emissions from Cars: A Consumer’s Perspective—Policy Recommendations for Decision Makers. Available online: https://www.fia.com/sites/default/files/global_reduction_in_co2_emissions_from_cars-_a_consumers_perspective_0.pdf (accessed on 20 August 2018).
  2. Ellingsen, L.A.W.; Singh, B.; Strømman, A.H. The size and range effect: Lifecycle greenhouse gas emissions of electric vehicles. Environ. Res. Lett. 2016, 11, 054010. [Google Scholar] [CrossRef]
  3. Mayyas, A.; Omar, M.; Hayajneh, M.; Mayyas, A.R. Vehicle’s lightweight design vs. electrification from life cycle assessment perspective. J. Clean Prod. 2017, 167, 687–701. [Google Scholar] [CrossRef]
  4. Messagie, M. Life Cycle Analysis of the Climate Impact of Electric Vehicles. European Federation for Transport and Environment AISBL. Available online: https://www.transportenvironment.org/sites/te/files/publications/TE%20-%20draft%20report%20v04.pdf (accessed on 30 May 2018).
  5. Ou, X.; Zhang, X.; Zhang, X.; Zhang, Q. Life Cycle GHG of NG-Based Fuel and Electric Vehicle in China. Energies 2013, 6, 2644–2662. [Google Scholar] [CrossRef] [Green Version]
  6. Sharma, R.; Manzie, C.; Bessede, M.; Crawford, R.H.; Brear, M.J. Conventional, hybrid and electric vehicles for Australian driving conditions. Part 2: Life cycle CO2-e emissions. Transport. Res. C Emerg. Technol. 2013, 28, 63–73. [Google Scholar] [CrossRef]
  7. Delogu, M.; Del Pero, F.; Pierini, M. Lightweight Design Solutions in the Automotive Field: Environmental Modelling Based on Fuel Reduction Value Applied to Diesel Turbocharged Vehicles. Sustainability 2016, 8, 1167. [Google Scholar] [CrossRef]
  8. Zackrisson, M.; Avellán, L.; Orlenius, J. Life cycle assessment of lithium-ion batteries for plug-in hybrid electric vehicles–Critical issues. J. Clean Prod. 2010, 18, 1519–1529. [Google Scholar] [CrossRef]
  9. Majeau-Bettez, G.; Hawkins, T.R.; Strømman, A.H. Life cycle environmental assessment of lithium-ion and nickel metal hydride batteries for plug-in hybrid and battery electric vehicles. Environ. Sci. Technol. 2011, 45, 4548–4554. [Google Scholar] [CrossRef]
  10. Amarakoon, S.; Smith, J.; Segal, B. Application of Life-Cycle Assessment to Nano Scale Technology: Lithium-ion Batteries for Electric Vehicles; United States Environmental Protection Agency: Washington, DC, USA, 2013.
  11. Ellingsen, L.A.W.; Majeau-Bettez, G.; Singh, B.; Srivastava, A.K.; Valøen, L.O.; Strømman, A.H. Life Cycle Assessment of a Lithium-Ion Battery Vehicle Pack. J. Ind. Ecol. 2013, 18, 113–124. [Google Scholar] [CrossRef] [Green Version]
  12. Itten, R.; Frischknecht, R.; Stucki, M. Life Cycle Inventories of Electricity Mixes and Grid. Paul Scherrer Institut, PSI, Switzerland. Available online: http://esu-services.ch/fileadmin/download/publicLCI/itten-2012-electricity-mix.pdf (accessed on 20 August 2018).
  13. Peters, J.F.; Baumann, M.; Zimmermann, B.; Braun, J.; Weil, M. The environmental impact of Li-Ion batteries and the role of key parameters—A review. Renew. Sustain. Energy Rev. 2016, 67, 491–506. [Google Scholar] [CrossRef]
  14. Fontaras, G.; Zacharof, N.; Ciuffo, B. Fuel consumption and CO2 emissions from passenger cars in Europe—Laboratory versus real-world emissions. Prog. Energy Combust. Sci. 2015, 60, 97–131. [Google Scholar] [CrossRef]
  15. De Cauwer, C.; Messagie, M.; Heyvaert, S.; Coosemans, T.; Van Mierlo, J. Electric vehicle use and energy consumption based on real-world electric vehicle fleet trip and charge data and its impact on existing EV research models. In Proceedings of the 28th International Electric Vehicle Symposium and Exhibition 2015 (EVS 2015), Goyang, Korea, 3–6 May 2015; pp. 645–655. [Google Scholar]
  16. EC (European Commission). EU Reference Scenario 2016 Energy, Transport and GHG Emissions: Trends to 2050; EC (European Commission): Luxembourg, 2016. [Google Scholar] [CrossRef]
  17. Burnham, A.; Wang, M.; Wu, Y. GREET 2.8 Transportation Vehicle-Cycle Model; Argonne National Laboratory: Argonne, IL, USA, 2008. [Google Scholar]
  18. Yan, X.Y.; Crookes, R.J. Reduction potentials of energy demand and GHG emissions in China’s road transport sector. Energy Policy 2009, 37, 658–668. [Google Scholar] [CrossRef]
  19. CEC (Commission of the European Communities). Case No COMP/M.1406—HYUNDAI/KIA, REGULATION (EEC) No 4064/89 MERGER PROCEDURE. Available online: http://ec.europa.eu/competition/mergers/cases/decisions/m1406_en.pdf (accessed on 9 October 2018).
  20. Mock, P.; Fuel Economy Labels: Focus on Non-EU Countries. Workshop Material for “GFEI Green Global NCAP Labeling /Green Scoring Workshop” Organized by International Energy Agency. Available online: https://www.iea.org/media/workshops/2013/gfeilabelling/02.ICCT.130430ICCTCO2labelingoutsideEU.pdf (accessed on 9 October 2018).
  21. Tsiakmakis, S.; Ciuffo, B.; Fontaras, G.; Cubito, C.; Pavlovic, J.; Anagnostopoulos, K. From NEDC to WLTP: Effect on the Type-Approval CO2 Emissions of Light-Duty Vehicles; EUR 28724 EN; Publications Office of the European Union: Luxembourg, 2017. [Google Scholar] [CrossRef]
  22. BMW. Environmental Report BMW i3 BEV. Available online: https://www.bmwgroup.com/content/dam/bmw-group-websites/bmwgroup_com/responsibility/downloads/en/2016/Environmental-report_BMW-i3.pdf (accessed on 30 May 2018).
  23. Daimler. Environmental Certificate Mercedes-Benz A-Class. Available online: https://www.daimler.com/images/sustainability/produkt/new-enviromentalcertificates/daimler-umweltzertifikat-mb-a-klasse.pdf (accessed on 30 May 2018).
  24. Audi. The New Audi A3 Life Cycle Assessment. Available online: http://www.audi.nl/content/dam/ngw/company/Corporate_Responsibility/PDF/A3%20Umweltbilanz.pdf (accessed on 30 May 2018).
  25. Toyota. Environmental Report 2017—Challenge 2 Life Cycle Zero CO2 Emissions Challenge. Available online: https://www.toyota.co.jp/jpn/sustainability/report/archive/er17/pdf/er17_18-21.pdf (accessed on 1 August 2018).
  26. Mazda. Mazda Sustainability Report 2017—Mazda Green Plan 2020 Mid-term Environmental Plan. Available online: http://www.mazda.com/globalassets/en/assets/csr/download/2017/2017_p057.pdf (accessed on 30 May 2018).
  27. JLCA (Life Cycle Assessment Society of Japan). LCA Database 2015FY, 4th ed.; JLCA (Life Cycle Assessment Society of Japan): Tokyo, Japan, 2015. [Google Scholar]
  28. Hawkins, T.; Singh, B.; Majeau-Bettez, G.; Strømman, A.H. Comparative Environmental Life Cycle Assessment of Conventional and Electric Vehicles. J. Ind. Ecol. 2012, 17, 53–64. [Google Scholar] [CrossRef] [Green Version]
  29. Thinkstep, A.G. GaBi: Software and Database Contents for Life Cycle Engineering; Thinkstep: Stuttgart, Germany, 2017. [Google Scholar]
  30. Kainou, K. Recommendation of Draft Revised Standard Calorific Value and Carbon Emission Factor for Fossil Fuel Energy Sources in Japan: 2013 FY Revised Standard Calorific Value and Carbon Emission Factor; RIETI (The Research Institute of Economy, Trade and Industry): Tokyo, Japan, 2014. (In Japanese) [Google Scholar]
  31. BMW. BMW i3—Features & Specifications—BMW USA. Available online: https://www.bmwusa.com/vehicles/bmwi/bmw-i3/bmw-i3-features-and-specs.html (accessed on 1 August 2018).
  32. Nissan. Nissan LEAF Range & Charging, Nissan USA. Available online: https://www.nissanusa.com/vehicles/electric-cars/leaf/range-charging.html (accessed on 1 August 2018).
  33. Volkswagen. Volkswagen Unveils the People First Warranty, the New Industry Leader—Newsroom. 2017. Available online: http://newsroom.vw.com/vehicles/volkswagen-unveils-the-people-first-warranty-the-new-industry-leader (accessed on 1 August 2018).
  34. Funasaki, A.; Katsunori, T. Life cycle assessment on End-of-life vehicles. J. Soc. Automot. Eng. Jpn. 2002, 56, 57–63. (In Japanese) [Google Scholar]
  35. Bobba, S.; Podias, A.; Di Persio, F.; Messagie, M.; Tecchio, P.; Cusenza, M.A.; Eynard, U.; Mathieux, F.; Pfrang, A. Sustainability Assessment of Second Life Application of Automotive Batteries (SASLAB): JRC Exploratory Research (2016–2017): Final technical report: August 2018; EUR 29321 EN; Publications Office of the European Union: Luxembourg, 2018. [Google Scholar] [CrossRef]
  36. Maeda, H.; Moro, T.; Matsuno, Y.; Sagisaka, M.; Inaba, A. Life cycle assessment case study for fuel cell vehicle. J. Adv. Sci. 2001, 13, 285–289. [Google Scholar] [CrossRef]
  37. Toyota. The MIRAI Life Cycle Assessment Report for Communication. Available online: https://global.toyota/pages/global_toyota/sustainability/esg/challenge2050/challenge2/life_cycle_assessment_report_en.pdf (accessed on 18 April 2019).
Figure 1. Scope of this study.
Sustainability 11 02690 g001
Figure 2. CO2 emissions during life cycle for GE, DE and BEV. (a) European Union (EU); (b) Japan; (c) US; (d) China; (e) Australia.
Sustainability 11 02690 g002
Figure 3. CO2 emissions of battery electric vehicles (BEV) compared to GE with different CO2 emission factor of the battery production (Japan, lifetime driving distance 100,000 km).
Sustainability 11 02690 g003
Table 1. Assumptions of previous life-cycle assessment (LCA) studies for internal combustion engine vehicle and advanced powertrain vehicle.
ReferenceStudied RegionStudied VehiclesLifetime Driving Distance [km]Estimation of Battery ProductionFuel Efficiency/Electric EfficiencyCO2 Emission Factor of Electricity
[kg-CO2/kWh]
Study Results
Ellingsen et al. [2]EuropeICV *1 and BEV *2
from A (mini size) to F (luxury size) segment *3
180,000Referring to own earlier study [8]ICV: average of actual ICVs (NEDC) *4
BEV: estimating from the relationship between electric efficiency and weight of actual BEVs
0.521
(European average mix [12])
—The life cycle Climate Change Potential of the F segment BEV was 1.7 times higher than that of the A segment BEV.
—The CO2 emissions in the use phase of BEVs became lower when its electricity was coming from energy source of lower CO2 emission factor such as renewables.
Mayyas et al. [3]USICV (GE *5, HEV *6, plug-in HEV) and BEV with lightweight technologies320,000Referring to some other studies
(120 kg-CO2- /kWh)
Estimation from running resistances and energy for driving force, assuming US driving cycle (55 % FTP-75 *7 and 45 % HFET *8)0.8515
(US average mix)
—The life cycle CO2 emissions of BEV and plug-in HEV were region dependent due to regional source of power generation. In the case of the US, HEV showed lower CO2 emissions than BEV and plug-in HEV.
Messagie [4]European average and each countryICV, BEV200,000Referring to Peters et al. [13]
(55 kg-CO2- /kWh for LMO battery*2*9)
ICV: European fleet average, augmented by 35% to reflect real driving conditions based on Fontaras et al. [14]
BEV: Real driving efficiency based on De Cauwer et al. [15] (average of BEVs from A to C-segments)
0.300
(European average mix [16])
—BEVs showed significant lower CO2 emissions, compared to ICV in most European countries.
Ou et al. [5]ChinaICV (GE, DE *10, Natural gas), BEV240,000Referring to GREET 2.8 [17]
(30 kg-CO2- /kWh)
Referring to some other studies, e.g., 6 L/100 km for GE [18]0.539 (by natural gas single cycle)
0.485 (by natural gas combined cycle)
—BEV reduces life cycle greenhouse gas emissions by 36%–47% compared to GE.
Sharma et al. [6]AustraliaICV (GE, HEV, plug-in HEV) and BEV150,000Estimation by referring to some other studiesAustralian Urban Drive Cycle (AUDC)1.04 (Australian average mix).—Regarding larger size vehicles, BEV shows lower greenhouse gas emissions than GE, but higher than HEV and plug-in HEV.
*1 ICV: Internal combustion engine vehicle; *2 BEV: Battery electric vehicle; *3 The size segment has been defined by the European Commission [19]; *4 NEDC (New European Driving Cycle): the fuel efficiency test cycle in Europe; *5 GE: Gasoline engine vehicle; *6 HEV: Hybrid electric vehicle; *7 FTP-75: the fuel efficiency test cycle for city driving in the US; *8 HFET: the fuel efficiency test cycle for highway driving in the US; *9 LMO: Lithium manganese oxide; *10 DE: Diesel engine vehicle.
Table 2. Specifications of assessed vehicles.
Vehicle Gasoline Engine Vehicle (GE)Diesel Engine Vehicle (DE)Battery Electric Vehicle (BEV)
Weight [kg] 131013601590
Displacement [cc] 19981498-
Battery capacity [kWh] --35.8
Output [kW] 88–11477100
Torque [Nm] 196270290
Fuel / Electric efficiency*1US (5cycle)13.2 km/L-5.75 km/kWh
Europe (NEDC)19.6 km/L26.3 km/L7.87 km/kWh
Japan (JC08)19.0 km/L21.6 km/L8.06 km/kWh
China (NEDC)16.1 km/L-7.87 km/kWh
Australia (NEDC)17.2 km/L-7.87 km/kWh
*1: Test cycle in each region is noted in brackets; Note: these specifications were set by reference to Mazda 3 (also known as Axela in some regions) and Volkswagen e-Golf sold in each region as of April 2018.
Table 3. Review results of works of literature about LCA for battery production.
LiteratureCathode Type*1CO2 Emission Factor
[kg-CO2eq/kWh]
Zackrisson et al. [8]LFP166
Majeau-Bettez et al. [9]NMC200
LFP250
Amarakoon et al. [10]NMC121
LFP151
Ellingsen et al. [11]NMC172
Average 177
*1 NMC: Lithium nickel-manganese-cobalt oxide; LFP: Lithium iron phosphate.
Table 4. The amount of CO2 emissions of vehicle production phase.
Part Name ReferenceReferenced Data of CO2 Emission [kg-CO2]Apply to
Chassis parts
(Body, tires, interior, etc.)
JLCA [27]4219
(76.8 % of overall production)
GE, DE, BEV
Gasoline engine and transmission JLCA [27]1274
(23.2 % of overall production)
GE
Diesel engine and transmission JLCA [27] modified1539 (20.8% higher than the gasoline engine)DE
Electric drive unit parts
(Elec. parts)
Li-ion
battery
CO2 factor: Average of Table 3
Capacity: Table 2
6337
(177 kg-CO2/kWh × 35.8 kWh)
BEV
MotorHawkins et al. [28]1070BEV
InverterHawkins et al. [28]641BEV
Table 5. Assumptions for the maintenance phase.
Part NameMaintenance Interval
[km/Maintenance]
CO2 Emission
[kg-CO2/Maintenance]
ReferenceApplied Vehicles
Tire40,000108JLCA [27]GE, DE, BEV
Lead-acid battery50,00019.5JLCA [27]GE, DE, BEV
Engine oil10,0003.22JLCA [27]GE, DE
Radiator coolant27,0007.03JLCA [27]GE, DE
Li-ion battery160,0006337Table 4BEV
Table 6. CO2 emissions from end-of-life (EOL) treatment (GE, DE and BEV).
Process NameCO2 Emission [kg-CO2]
Disassembly *-
Shredding and sorting24
Transport4
Landfilling38
Total65
*: Energy consumption in disassembly is relatively lower than the other treatment [34].
Table 7. DIP (distance of intersection point, where the CO2 emissions from GE or DE and BEV are the same), fuel efficiency, electric efficiency and CO2 emission factor of electric generation (relative value) in each area. (a) DIP for GE and BEV; (b) DIP for DE and BEV.
(a)
AreaDIP [km]Fuel and Electric Efficiency Relative Value of CO2 Factor * for Electricity
GE [km/L]BEV [km/kWh]
US60,77913.25.75100
Europe (EU28)76,54519.67.8772
Japan111,51119.08.06110
China119,10416.17.87144
Australianot intersect17.27.87160
(b)
AreaDIP [km]Fuel and Electric Efficiency Relative Value of CO2 Factor * for Electricity
DE [km/L]BEV [km/kWh]
Europe (EU28)109,41526.37.8772
Japan114,57421.68.06110
* relative to the value of the US = 100.

