Vibration Analysis and Dynamic Characterization of Structural Glass Elements with Different Restraints Based on Operational Modal Analysis


Department of Engineering and Architecture (DIA), University of Trieste, 34127 Trieste, Italy
*
Author to whom correspondence should be addressed.
Buildings 2019, 9(1), 13; https://doi.org/10.3390/buildings9010013
Submission received: 12 December 2018
/
Revised: 28 December 2018
/
Accepted: 29 December 2018
/
Published: 5 January 2019
(This article belongs to the Special Issue Non-destructive Testing for Building Evaluation)
Abstract
:Given a series of intrinsic features of structural glass systems (i.e., material properties, type of restraints, operational conditions, etc.), special care should be spent at the design stage, to ensure appropriate fail-safe requirements, but also in the service life of these innovative building components and assemblies. In this paper, the dynamic characterization of simple monolithic glass elements is presented, based on non-destructive laboratory experiments and Operational Modal Analysis (OMA) techniques, including Finite Element (FE) numerical simulations, classical analytical models, and video-tracking approaches. It is shown, in particular, how the actual restraint condition (i.e., flexibility of supports, with respect to ideal boundaries) can affect the vibration parameters of a given glass member (frequency and damping capacity). This turns out in possible variations of its overall structural performance, including stress-strain-related effects, hence suggesting the need for even further dedicated studies and methods for the reliable analysis and design of structural glass assemblies and complex systems under dynamic loads.
1. Introduction and State-of-the-Art
In recent decades, glass has been increasingly used as load-bearing material, and the number of projects/research studies showed an exponential increase. Although it represents a relatively new solution for constructions and buildings, requiring appropriate design methods and knowledge, glass is actually largely used for facades, roofs, and footbridges. Given a series of intrinsic features (i.e., material properties, types of restraints, operational conditions, etc.), however, special care should be spent at the design stage, to ensure appropriate fail-safe requirements, and also in the service life of glass building components and structures (see for example [1,2,3]). The vulnerability assessment of glazing systems under dynamic loads (i.e., seismic events, human-induced vibrations, impacts, etc.) and extreme loads in general is still an open topic, requiring huge efforts. Especially in terms of dynamic-related effects, the use of Finite Element (FE) software packages can represent an efficient tool for design, with respect to a simple analytical formulation. However, special care should be spent for the definition of key input parameters, such as for example damping properties, restraints features, etc. [4]. Several research studies, especially in the last few years, have been dedicated to the structural performance assessment of even complex glazed assemblies under various boundary/loading conditions, including destructive impact experiments on glass columns [5], pendulum tests on glass balustrades [6,7], and a series of research studies focused on the wind/blast/seismic induced vibration responses of glass facades [8,9,10,11,12,13,14], etc.
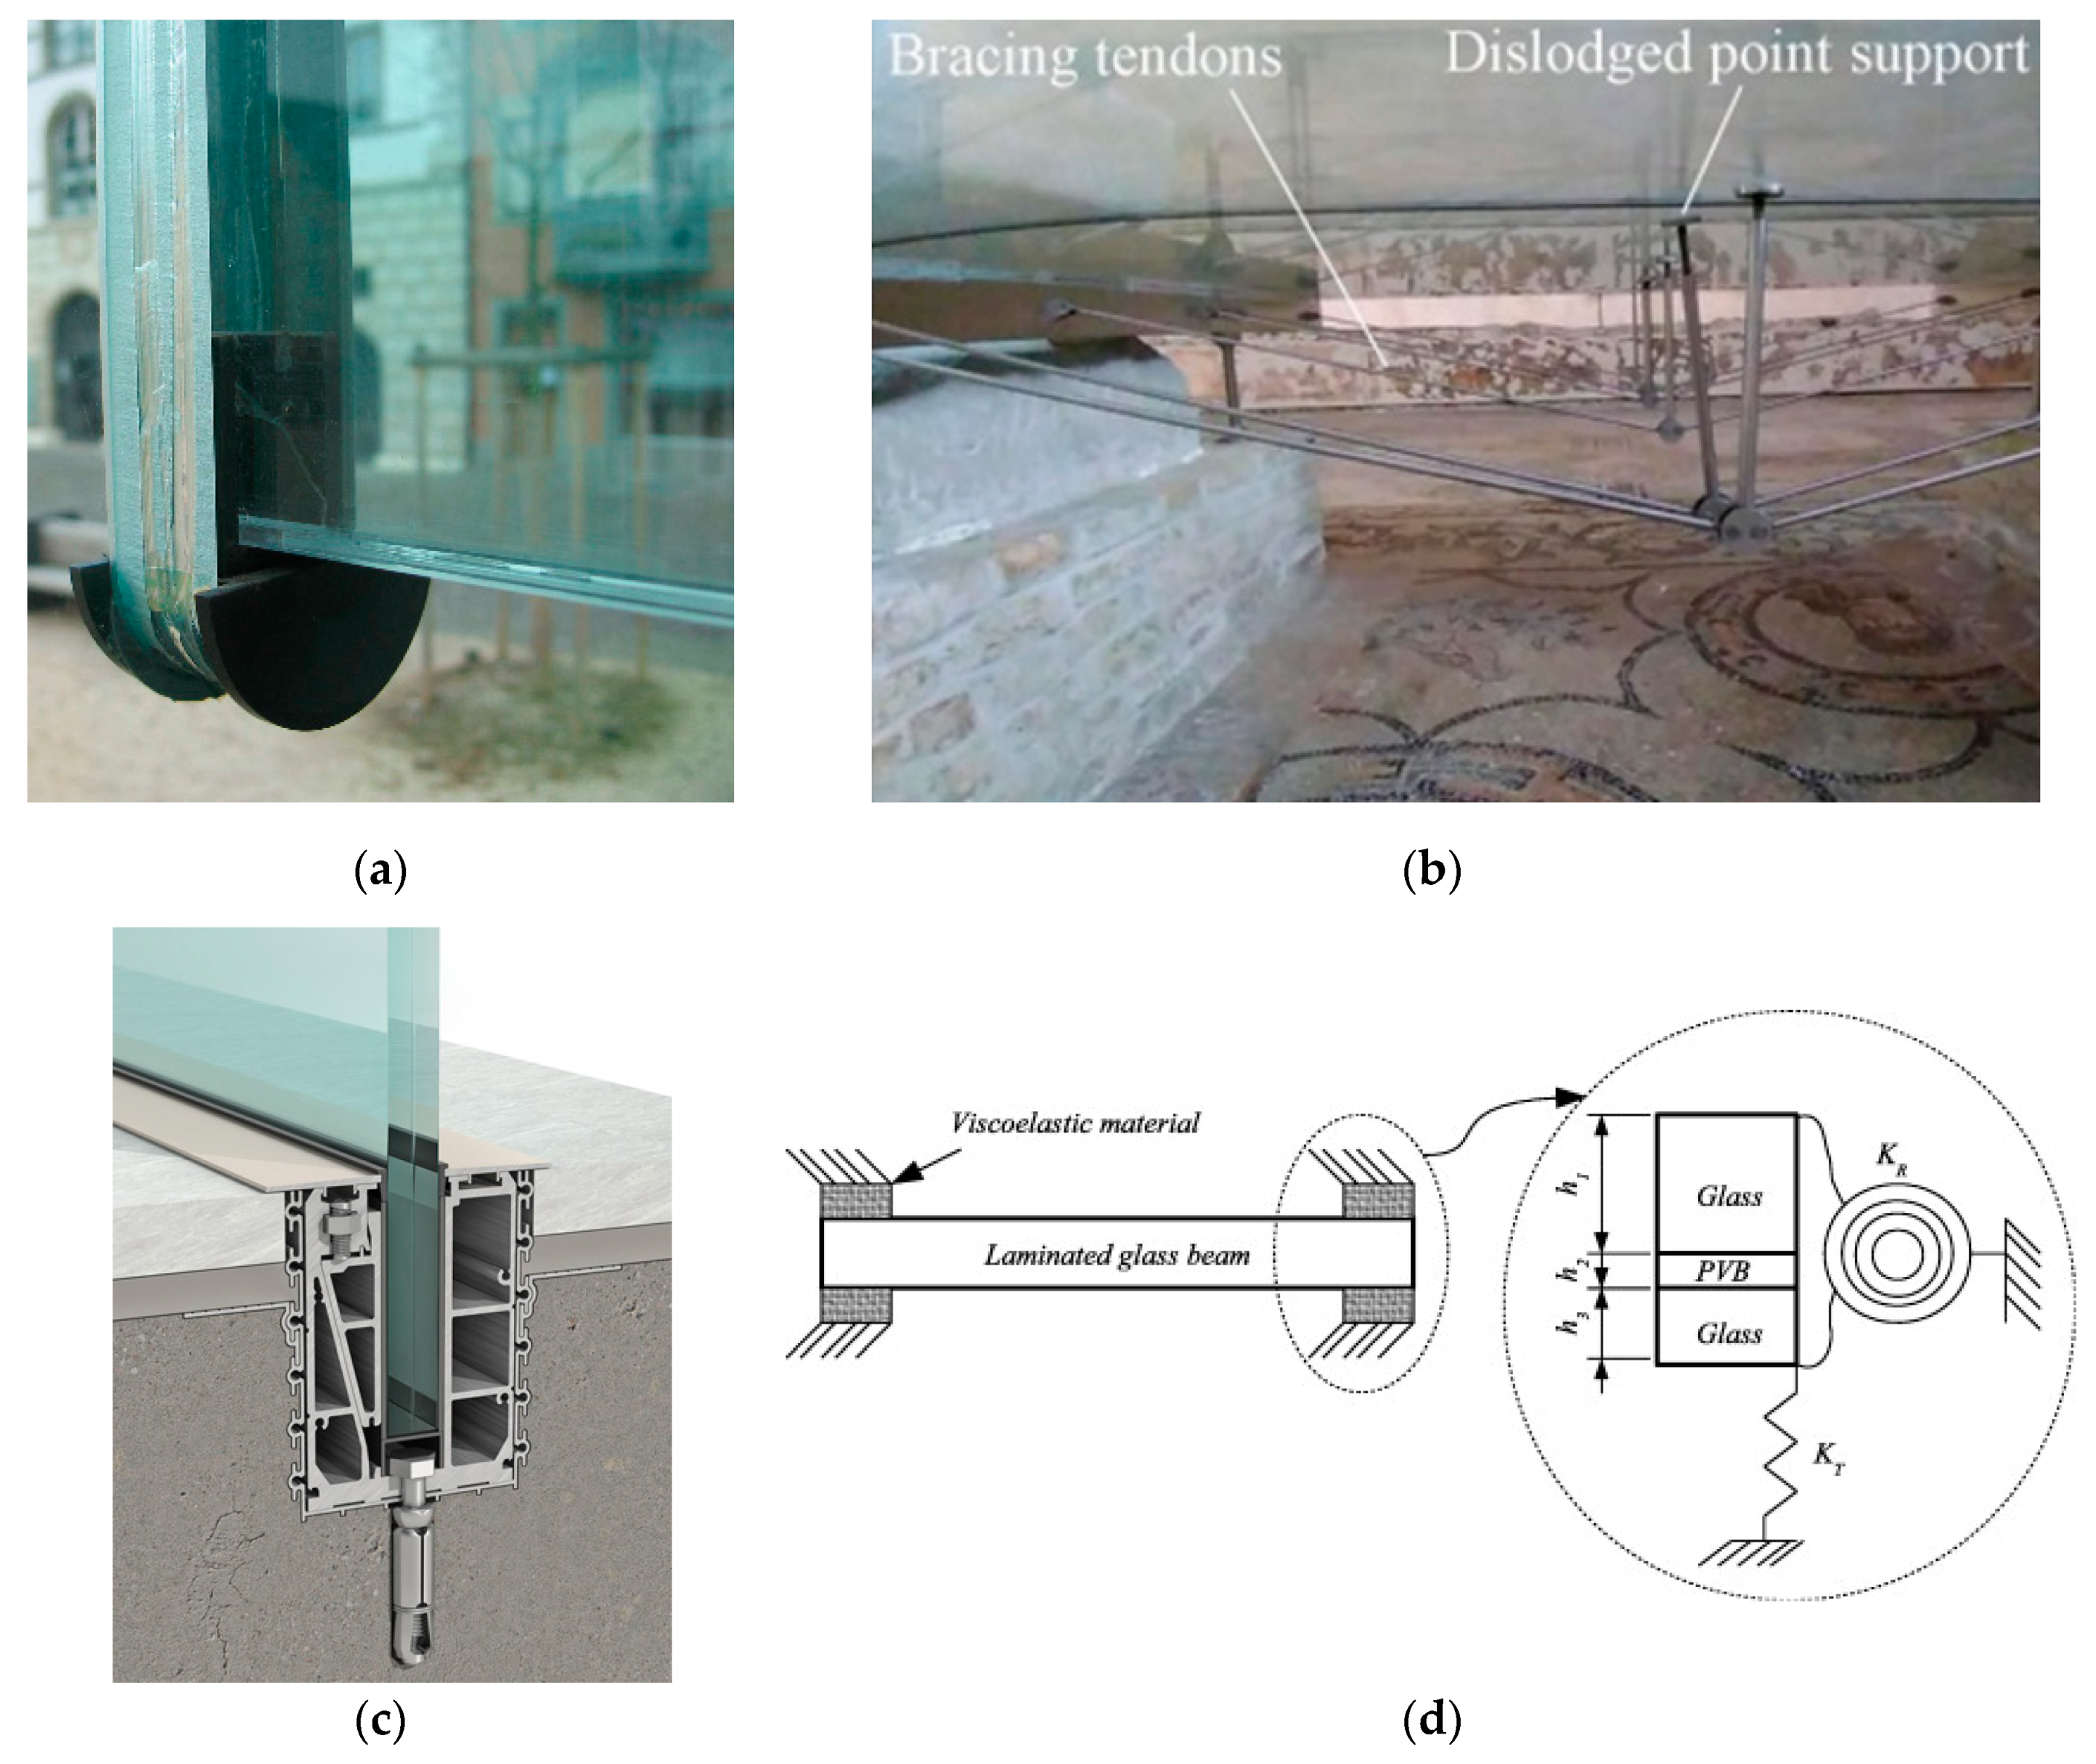
In this paper, the dynamic characterization of simple monolithic glass elements is presented, based on laboratory vibration experiments and Operational Modal Analysis (OMA) techniques [15]. The study aims at following and further extending the limited research contributions of literature, with careful consideration for the analysis of the fundamental frequency and damping capacity of various boundary configurations. Given a set of float monolithic glass samples (L = 1 m × B = 0.2 m the global size, with 6 mm the nominal thickness), both clamped and pinned conditions are considered, also including variations in the flexibility of supports. Such an assumption aims at assessing the sensitivity of the basic dynamic parameters to even small variations in the geometrical and mechanical features of real supports in use for structural glass applications, where adhesive joints, soft spacers and gaskets are commonly interposed to metal fasteners, to avoid local stress peaks (see for example Figure 1a–c). Boundary conditions could also modify, during the lifetime of a given glass assembly, due to external factors or materials degradation, hence resulting in possible unsafe structural performances (see the detail of Figure 1b), or premature damage ([16,17], etc.). Preliminary numerical studies, in this regard, were reported in [18] by Koutsawa and Daya, where a simple laminated glass (LG) beam with viscoelastic supports was analyzed under static and dynamic loads (Figure 1d), giving theoretical evidence of the potential effects due to variable mechanical features for the supports (i.e., stress distribution and peaks, displacements, modal parameters).
In this research project, the OMA outcomes are compared and discussed with the support of literature background, as well as FE numerical simulations (ABAQUS computer software [19]), classical analytical estimations from beam theory [20] and video-recording tracking-based techniques [21]. It is experimentally and numerically shown, in particular, how the actual restraint condition can affect the dynamic parameters of a given glass member (frequency and damping, in this paper), hence requiring even further careful consideration for the reliable analysis and design of real structural systems and complex glazed assemblies. Frequency-stiffness fitting curves are numerically derived for a wide set of geometrical configurations, to further enforce and extend the test observations. Based on past efforts, a semi-analytical approach is also applied to damping estimates for the collected experimental outcomes, to provide practical suggestions for design and simulation purposes.
The use of OMA techniques for glass-related investigations already attracted the efforts of several research studies. Their intrinsic advantage is that modal parameters can be derived under service conditions, and/or under unknown random artificial loads. However, a certain uncertainty can be often perceived from data available in the literature. In several cases, the sensitivity of frequency and damping measurements to local effects (i.e., actual boundaries and instruments) is emphasized. In addition, still limited efforts are available in the literature, hence suggesting the need for extended investigations, at the material, component and assembly levels.
Lenci et al. [22], for example, experimentally derived the dynamic properties of glass, based on the application of the OMA approach to glass beams excited by an instrumented hammer. Careful consideration was spent to estimate the frequency and damping properties of glass specimens with two-layer LG section, to assess the effects of PolyVinyl Butyral (PVB®) foils on the measured vibration responses (10 mm the thickness of glass layers, with a 1.52 mm thick interlayer). The tested specimens (L = 1 m × B = 0.1 m) were investigated under a free-free boundary configuration. Dedicated inverse studies, inclusive of analytical and numerical calculations, were hence carried out to assess the dynamic stiffness of the viscous PVB interlayer, and the related effects on the frequency and damping estimations. It was also demonstrated, finally, a lack of correlation between the excitation point and the estimated dynamic features.
Ramos et al. [10] carried out OMA studies and impact experiments (pendulum tests according to EN 12660:2002 provisions [23]) on glass plates glued to a supporting steel frame (1.938 × 0.876 m the dimensions of each plate), to calculate the vibration frequencies, the modal shapes, and the damping ratios of the so assembled samples. All the test repetitions were carried out on three different configurations, namely obtained by means of one monolithic (10 mm the thickness) and two different sections of two-layer LG plates (2 × 5 mm glass layers, bonded by 0.38 mm or 1.52 mm thick PVB foils). Based on OMA investigations, it was proved that the thicker the PVB layer was, the higher damping capacity was derived for the LG samples, with respect to the monolithic specimens.
Damping ratios in the order of 1.05% (up to 1.8%) were experimentally derived for monolithic and LG samples, respectively. A certain damping effect of rubber bands and fasteners (i.e., within the clamping restraints), however, was also perceived for the calculated frequencies and damping terms, even such an effect was not properly assessed and quantified (due to the limited number of samples). In any case, the so estimated damping ratios resulted in close correlation with previous literature efforts, see Lenk and Coult [24]. There, the authors tried to preliminary assess the dynamic response of glass beams (L = 3 m × B = 0.3 m, with 2 × 6 mm/1.52 mm PVB, or 2 × 15 mm/2.25 mm PVB sections respectively), with careful attention for the estimation of the damping coefficient. Free damped vibration and harmonic excitation analyses were compared for two-layer LG sections. In the latter case, the half-power bandwidth method resulted in damping ratios in the range of 0.88% to 1.2%. Later, Pelayo and Lopez-Aenlle [25] proposed a dynamic effective thickness formulation, for the reliable estimation of natural frequencies and damping ratios of multi-layered LG beams. To assess the viscous effect of PVB interlayers, OMA investigations were discussed for beam-like specimens with ideally rigid restraints, under different operational temperatures (20–35 °C the explored range). In [26], Zemanova et al. carried out a wide set of parametric analytical calculations, aimed at assessing the frequency and loss factor estimations that can be derived from the modal analysis of beam-like LG elements with ideal supports, by considering several interlayer types (PVB, SentryGlas® (SG), or Ethyl Vinyl Acetate (EVA)).
Bloss and Rao [27] explored—even for automobile applications—the reliability of Power Input Method (PIM) technique to estimate the damping capacity of vehicle glass windshields. Based on laser vibrometer acquisitions, the authors generally detected a higher loss factor for LG specimens, with respect to monolithic samples with identical dimensions and restraints. In addition, the PIM approach resulted in typical advantages due to the use of non-contact instruments, but the study also emphasized the high sensitivity of experimental results to noise-induced errors. In this regard, Barredo et al. [28] assessed different measurement techniques (i.e., laser measurements and accelerometers records) for the frequency and damping estimation of pinned-pinned, beam-like monolithic and LG samples (L = 1 m × B = 0.1 m their size, with 5.83 mm and 2 × 2.8 mm + 0.38 mm PVB the thicknesses of monolithic and LG specimens respectively). It was shown that stable estimations can be generally obtained in terms of frequencies, for both monolithic and LG specimens (less than 2–3% frequency variations, for the “instrumented” and “non-instrumented” samples), while the authors declared a marked sensitivity of the calculated damping ratios, to the presence of instruments (i.e., sensors of unknown size and weight, and related connection cables). A marked sensitivity of damping results was also noticed between accelerometers or laser estimations, for the same instrumented beams. The monolithic specimens were found to offer damping ratios of 0.81% and 0.53% respectively, from sensors or laser measurements [28]. Laser acquisitions for the still instrumented samples, but with cables removed, gave then evidence of a 0.35% damping capacity. A certain disturbance of the number and layout of instruments was hence reasonably recognized (6 accelerometers/glass specimen). However, such an unreliable variation of experimental estimations was also further justified in [28], with the support of full solid FE models, by un-quantified local effects due to supports.
In this regard, the use of innovative, non-destructive and contact-less monitoring techniques for the vulnerability assessment of complex glass systems and facades is attracting the efforts of researchers, but preliminary results and limited applications are actually available in the literature (see for example [29,30] for recent studies based on laser Doppler vibrometer or ultrasonic measurements).
2. Experimental (EMA) and Operational (OMA) Modal Analysis Techniques
In civil engineering applications, both Experimental Modal Analysis (EMA) and OMA techniques are widely used for structural assessment purposes. While input-output techniques are used for EMA, the output-only OMA approach is particularly suitable to explore the dynamic response of systems and components in operational conditions, without knowledge of the imposed excitation. Both the techniques are especially recommended when the vibration parameters of a structure cannot be rationally estimated by means of analytical models, due to specific restraint configurations, uncertainties on the material properties (i.e., including possible viscous effects due to polymers and adhesives, in the case of glass systems) or complex damping phenomena. Provided that identical boundary conditions are considered for a given structure, mostly coincident frequency and damping estimations are expected from EMA and OMA tests [31]. In this regard, experimental comparisons are proposed in [32] for plexiglass panels, aiming at reproducing the dynamic performance of a glass façade prototype.
According to classical dynamic theories, the governing equation of motion of a vibrating system can be conventionally described by referring to a simple spring (k)—mass (m) system with damping coefficient c, that is [20]:
In Equation (1), u(t) denotes the displacement of the system from the static-equilibrium position, while p(t) is the effective loading (i.e., external load or indirect load deriving from the motion of supports).
The free-vibration response of the system (p(t) = 0) is strictly related to its geometrical and mechanical features, and is typically characterized by displacement histories according to Equation (2):
where G is an arbitrary complex constant and the damped circular frequency is given by:
With
As far as the damping term ξ is small, it is:
with ccr the critical damping, and hence:
Following Equations (1)–(6), OMA techniques are hence intended to provide a reliable estimation of the key dynamic parameters of a given structure, even in presence of non-ideal boundary conditions, as it is the case of experimental samples discussed in this paper.
3. Laboratory Experiments
A series of vibration experimental tests was carried out at the Official laboratory of materials and structures (University of Trieste, Department of Engineering and Architecture, Italy).
3.1. Boundaries and Loads
Output-only vibration experiments were performed on a set of monolithic glass specimens (12 in total, see Table 1), having constant geometrical properties (6 mm their thickness, with L = 1 m × B = 0.2 m the nominal dimensions) but various boundary configurations.
More in detail, the tests were performed on fixed-end samples (i.e., cantilever type, denoted as C-type samples, in the following), and pinned-pinned (i.e., beam-like samples, B-type) specimens. Given the total set of glass samples (12 panels), an average number of ten test repetitions was carried out for each one of the C-type and B-type configurations described in Figure 2 and Table 1, to collect a sufficiently wide and reliable series of dynamic estimates.
The so detected restraint conditions were selected to reproduce—even at a small-scale level—the boundary configurations of common structural glass components. In the first case, the C-type samples reflect the performance of a balustrade with linear clamps (Figure 1c). In the case of B-type samples, the typical design example is a glass wall spanning from floor-to-floor and belonging to an external façade or to an internal partition (i.e., with top/bottom linear restraints at the level of inter-storey floors, and fully unrestrained vertical edges, see also [33]).
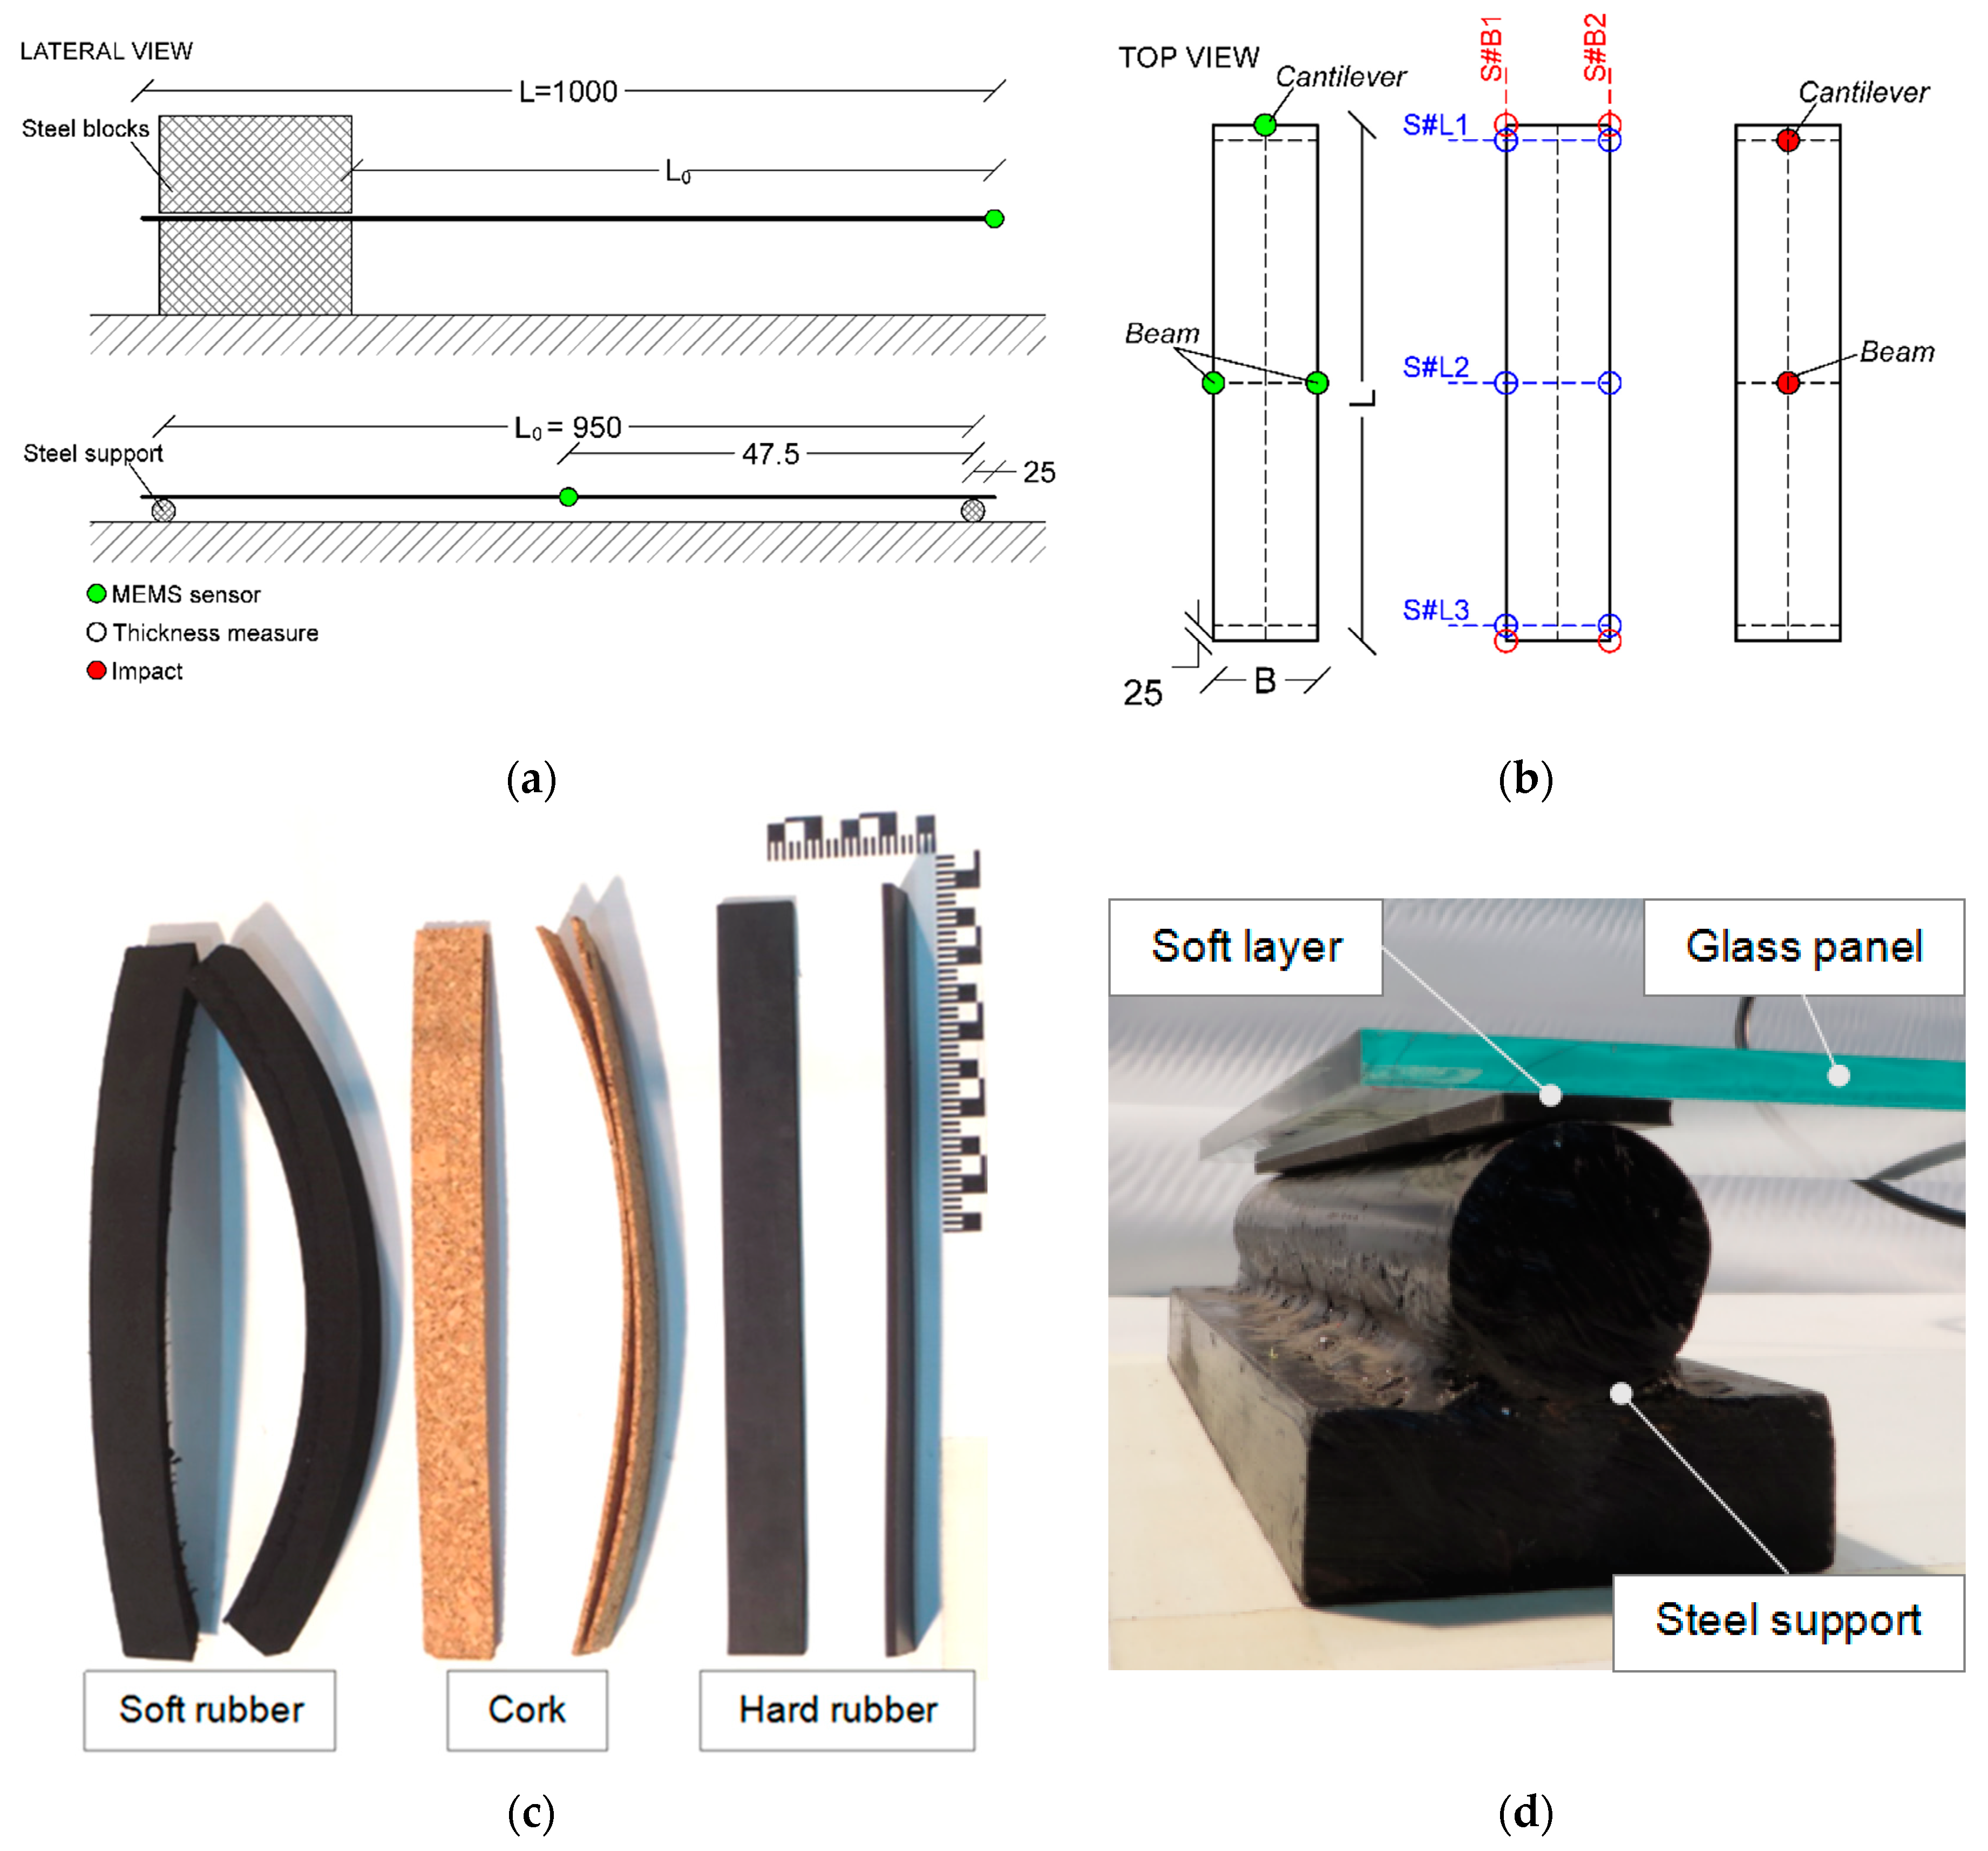
The dynamic performance of the full set of glass samples was investigated under the vibrations induced by random artificial excitations due to a soft body. In doing so, Micro Electro-Mechanical Systems (MEMS) accelerometers were used to record the acceleration-time histories of the glass specimens (see Figure 2b and Section 3.2 for further instrumentation details). Before the execution of the output-only experiments, all the glass plates dimensions were measured, to ensure the correlation between their real and nominal size (see Figure 2b and Section 3.3). The soft body vibration was then imposed via a tennis ball (58.26 g its weight) impacting the glass panels on the reference points reproduced in the drawing scheme of Figure 2b.
For the C-type samples, setup variations were considered in the form of bending span L0. Such an effect was obtained by assigning different positions to a set of steel plates (45 kg/each) in use to realize the typical rigid clamp restraint, see Figure 2a. In the case of B-type samples, their bending span was kept fix, equal to L0 = 0.95 m (with 0.025 m the distance of supports from the lateral edges). Indeed, variations were accounted in the form of boundaries. The first set of vibration tests was in fact carried out by assuming fully rigid supports for the glass beams (i.e., steel devices according to Figure 2a). Further test series were then performed to assess and quantify the effects of supports’ flexibility on the actual dynamic parameters of the examined specimens.
To this aim, small strips (Bs = 0.2 m long × Ls = 20 mm wide (As = 0.02 × 0.2 m2 their compressive resisting surface, assuming that each soft layer is subjected to uniform compression), and ss the thickness) of selected materials of technical interest for building applications were interposed between the glass samples and the steel devices (see Figure 2c,d). Globally, test repetitions were carried out on three different “soft” supports, as obtained via hard rubber (B-2), cork (B-3) and soft rubber (B-4) layers, respectively.
Given the Bs × Ls × ss geometrical features of each flexible layer and Es the modulus of elasticity in the direction perpendicular to the glass plane, the ks values summarized in Table 1 can be reasonably estimated as:
where Es = 10 MPa, 6 MPa and 1.5 MPa respectively for the hard rubber, cork, and soft rubber layers in use (Es = 210 GPa for steel supports). The frequency and damping variations with the restraint axial stiffness ks were hence experimentally assessed.
3.2. Test Instruments and Methods
All the output-only experiments were performed with the support of the MEMS accelerometers prototyped in [34]. There, the validation of cost-efficient and portable MEMS accelerometers was carried out by means of laboratory experiments (shake table tests and noise level comparisons), as well as on-site vibration tests on a case study cable-stayed bridge, giving evidence of the high potential of the sensors for structural health monitoring applications and diagnostic investigations.
The choice of the same instruments for the dynamic characterization of the glass specimens herein presented was justified by the accuracy of measurements summarized in [34], as well as by the relatively small weight and size of MEMS devices, compared to the vibrating glass plates (WMEMS = 136 g/each, corresponding to 0.045 W, with W = 3 kg the weight of a single glass sample). More in detail, a single MEMS device was used for the cantilever samples (i.e., mid-section of the cantilever free edge (see Figure 2b)), while two symmetric sensors (i.e., mid-span cross-section (Figure 2b)) were taken into account for the beam specimens. For all the test repetitions, the acceleration data were recorded with a sampling frequency of 128 Hz. Based on the collected test measurements, the OMA investigation and post-processing of test records was then carried out with the support of the SMIT Toolsuite [35].
3.3. Preliminary Geometrical Measurements
Before the execution of the series of vibration tests, preliminary geometrical measurements were carried out on the full set of samples, to verify possible deviations of real-to-nominal dimensions (according to product tolerances), as well as to verify the material density.
All the measurements were performed with a caliber, on a set of 12 control points and reference sections for each glass plate (see Figure 2b). The total weight of the samples was then also calculated, aiming at verifying the actual material density, with respect to the nominal value of 2500 kg/m3 [36]. Generally, the global L × B dimensions of the specimens were found to closely agree with their corresponding nominal values, with a maximum scatter of real measurements in the order of ≈0.5% (i.e., maximum size variations of 0.1–0.2 mm). In terms of glass thickness t, otherwise, real measurements lower than the expected nominal 6 mm were usually recorded, with a mean value tmean = 5.86 mm, down to a minimum tmin = 5.80 mm (see Figure 3). For a couple of test measurements only (see the G#12 values of Figure 3), a minimum thickness equal to tmin = 5.79 mm was found for two of the selected control points. Within the full set of collected thickness values (132 in total), in this regard, most of the geometrical data resulted in line with product standards [36], where a ±0.2 mm of tolerance is accepted for annealed, 6 mm thick plates. Weight measurements of the full set of glass samples, finally, resulted in an average material density of 2500.79 kg/m3, that is in close agreement with the nominal value.
4. Vibration Test Results and Comparisons
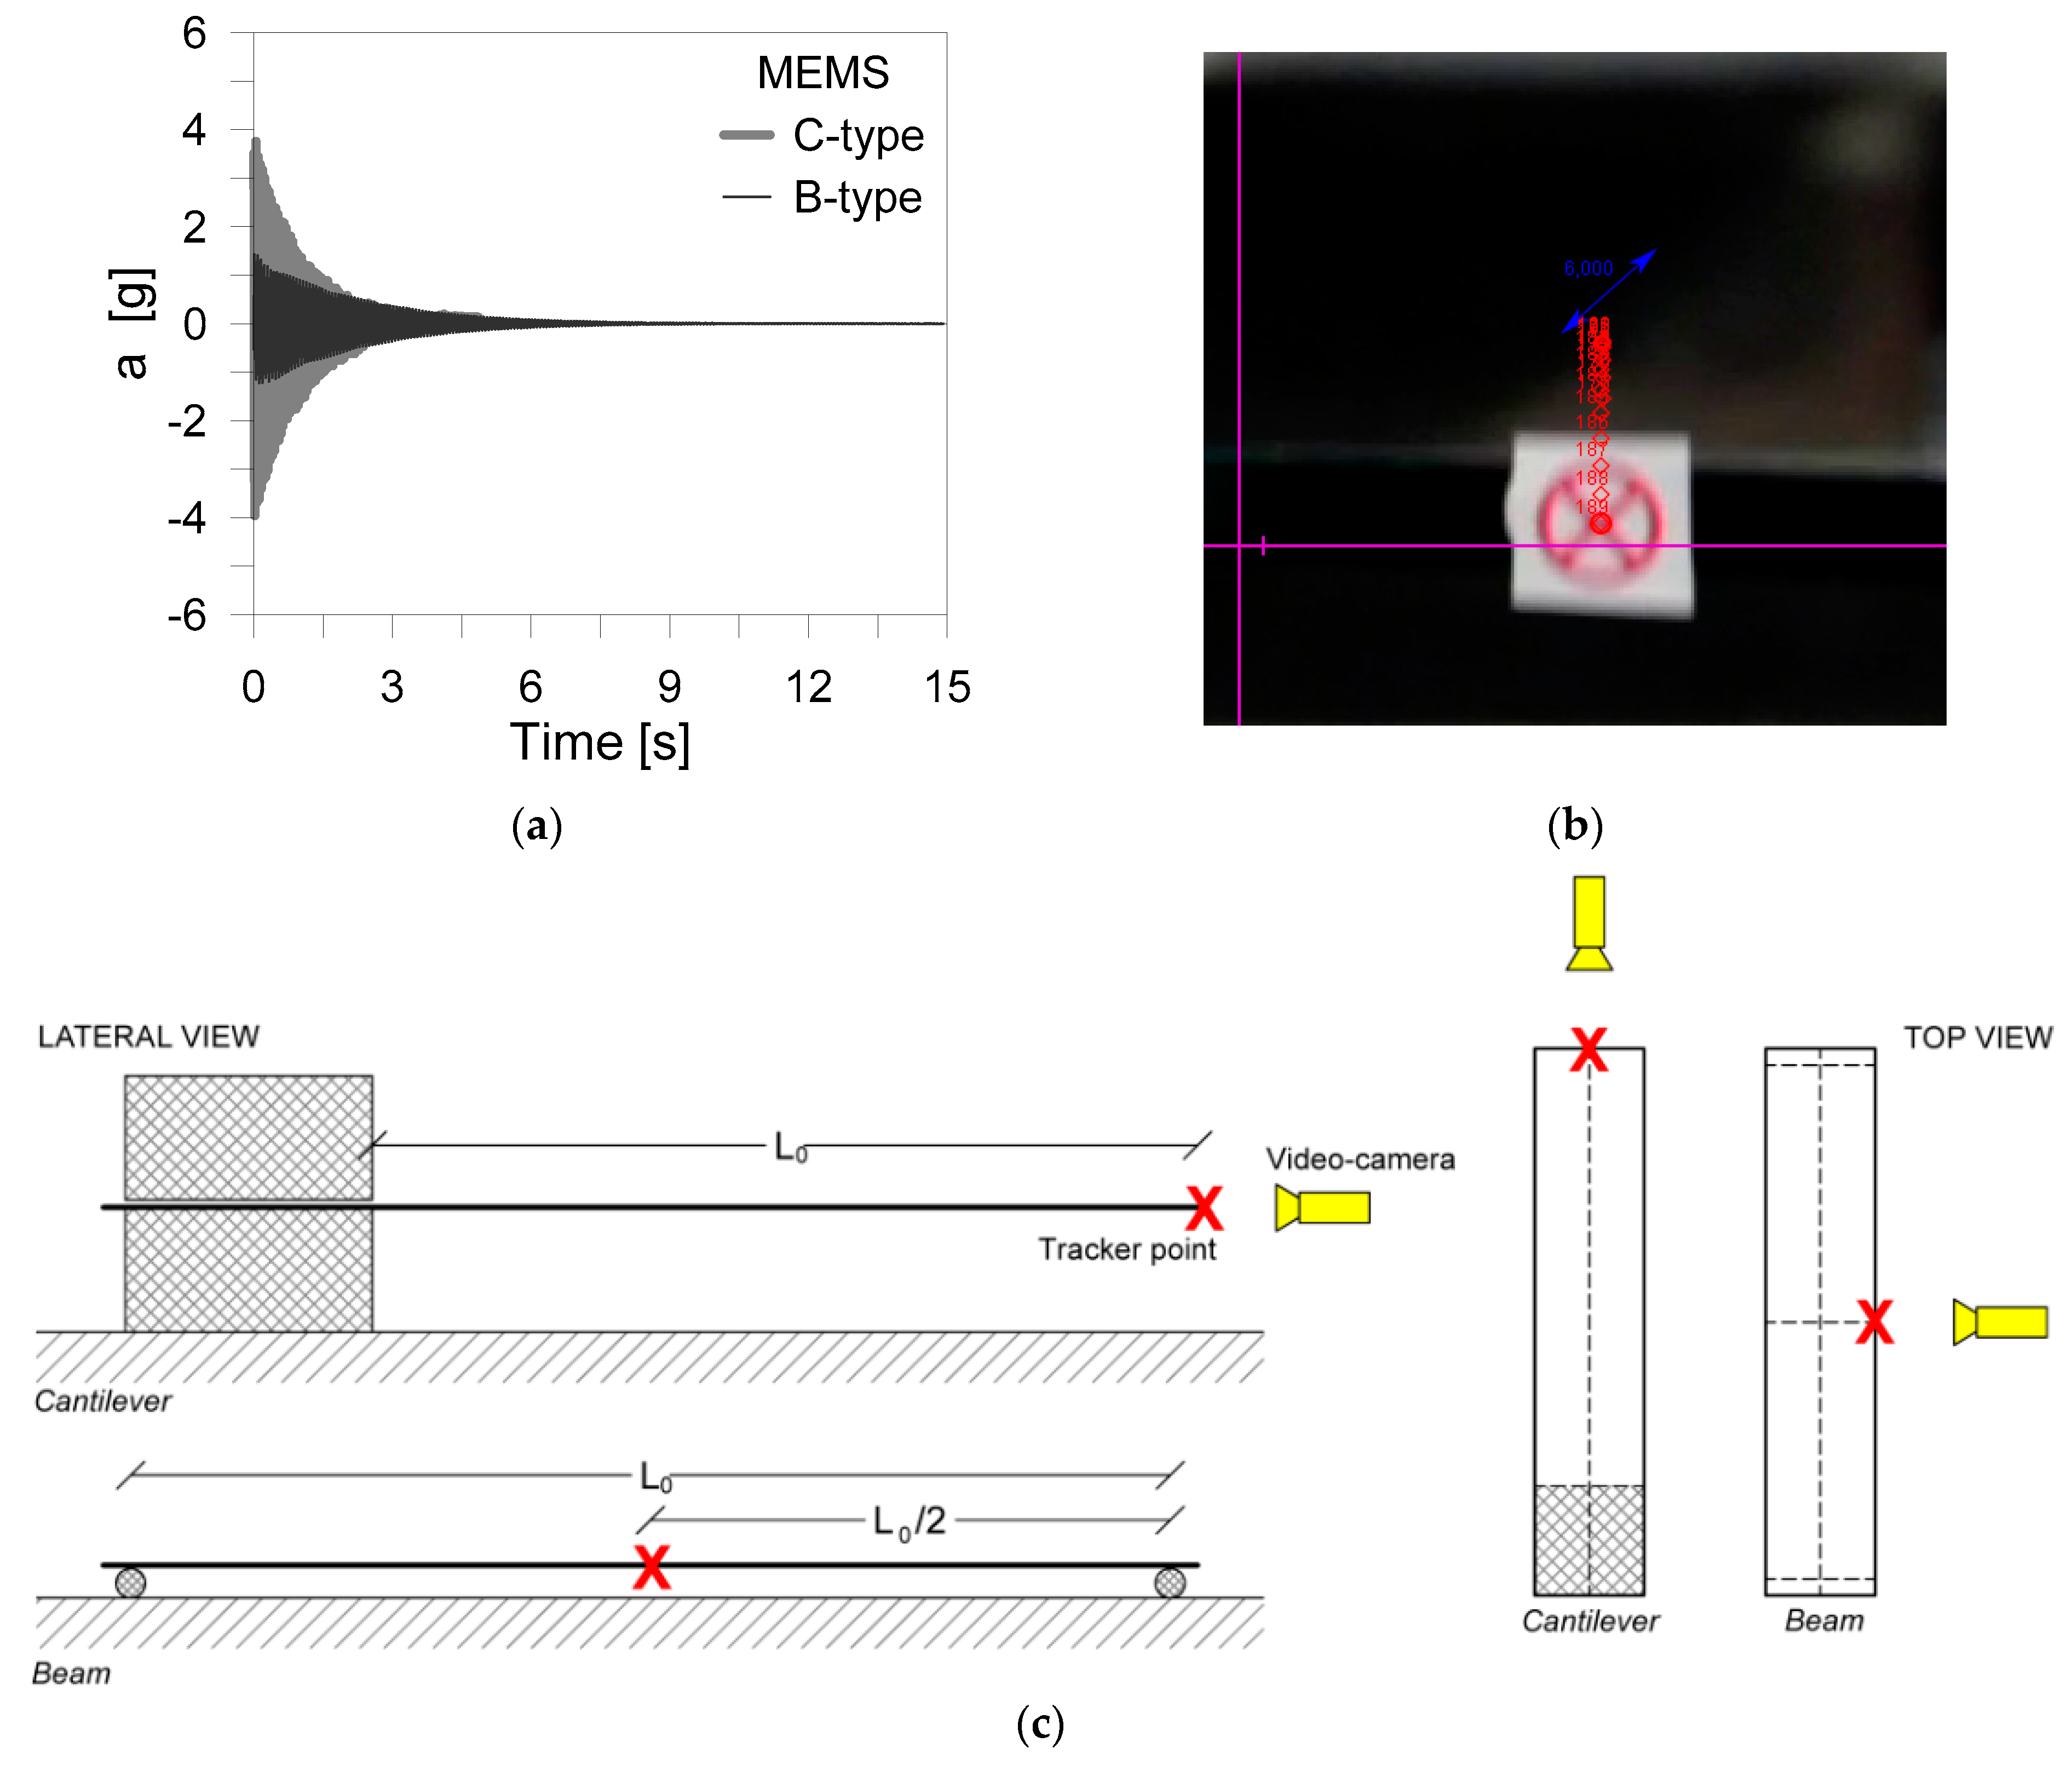
A set of acceleration-time history records according to Figure 4a were collected for all the test repetitions, for comparative purposes. MEMS data were recorded, for each specimen, in a time interval of 60 s. However, depending on the tested setup, the typical experiment resulted in mostly null vibrations after an interval of 10–15 s.
In addition to the MEMS measurements, a high-performance video-camera was also used during some of the experiment repetitions (540 fps the sampling rate), see Figure 4b,c. In Figure 4b, more in detail, the typical tracking method is shown for a selected glass sample (in evidence, the tracking point and the tracked displacements in time (red dots)). All the collected video-based registrations were in fact used to derive further feedback on MEMS estimations, from the post-processed digital images, as well as to assess the reliability of simple video-tracking techniques for dynamic identification and diagnostic purposes (i.e., [37,38,39,40], etc.). For engineering applications, the use of advanced video-based and digital image correlation techniques attracts the continuous attention of several research studies, both for remote-control and diagnostic investigations as well as dynamic identification purposes, and various promising contributions are available in the literature, even for large-scale and complex structures ([41,42,43,44,45], etc.).
In this paper, the open source Tracker software was used [21,40]. In doing so, the possible sensitivity of the MEMS-estimated dynamic parameters was also indirectly assessed (the video acquisitions were carried out on non-instrumented glass specimens). Both in the case of MEMS and video-based predictions, most of the attention was spent on the assessment of the calculated fundamental frequencies and damping ratios. Due to the limited number of measurement points for the C-type and B-type specimens, modal shape comparisons and possible Modal Assurance Criterion (MAC) correlations with FE results were in fact disregarded.
4.1. Fundamental Frequency
The fundamental frequency of the tested samples was first calculated and compared, as obtained from experimental data, simple analytical formulations from the literature (i.e., beam theory models) and FE numerical analyses (ABAQUS).
4.1.1. Experimental, FE Numerical and Analytical Comparisons
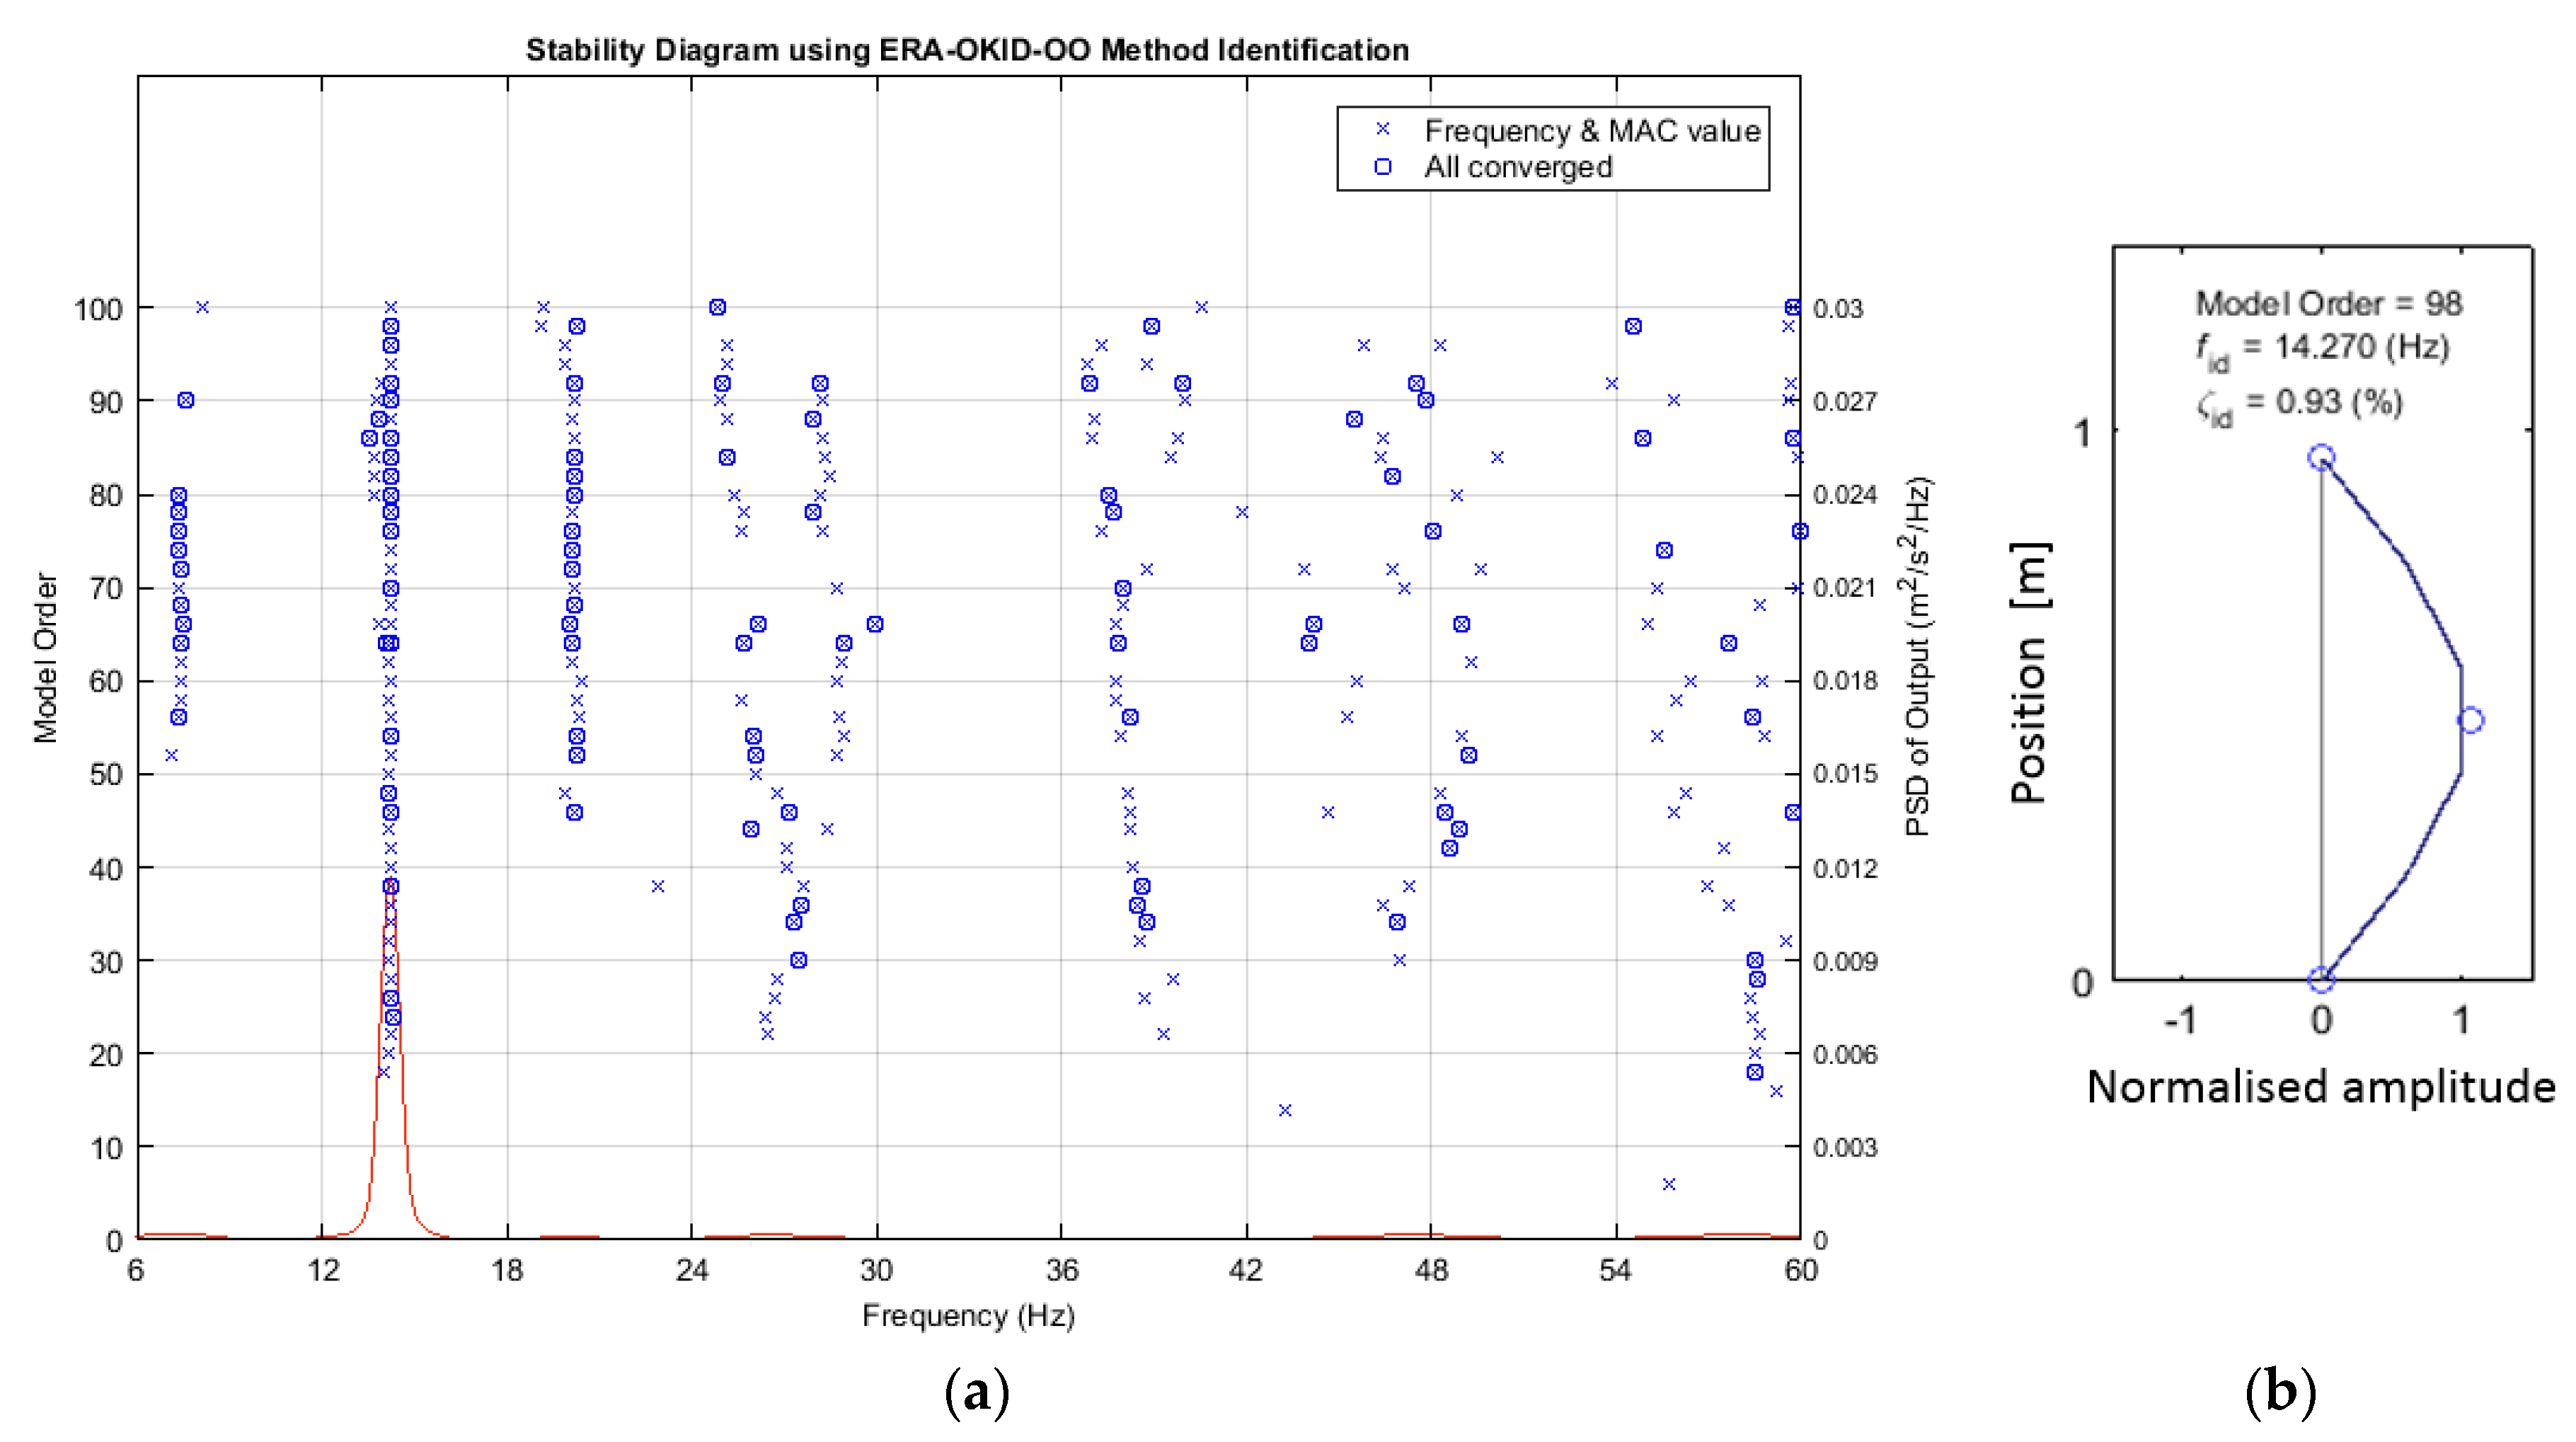
The SMIT Toolsuite was used to detect the structural modal parameters of the tested glass plates, according to the ERA-OKID-OO approach. The method represents an extension of the Eigenvalue Realization Algorithm (ERA)—Observer Kalman filter Identification (OKID), for the dynamic detection of modal parameters from Output-Only (OO) systems. Compared to the widely used ERA-OKID approach, the latter considers as a basic working assumption that only the stochastic subsystem contributes to the output response of a given vibrating structure, while the deterministic subsystem can be neglected. Compared to other approaches, the ERA-OKID-OO method is hence more computationally efficient (see also [46,47] for a detailed discussion of assumptions and comparisons). Given the collected experimental acceleration-time histories, see Figure 5, modal frequency and damping values were separately identified for each MEMS-based record, and then used to calculate the average dynamic parameters of each test setup/series of experiments.
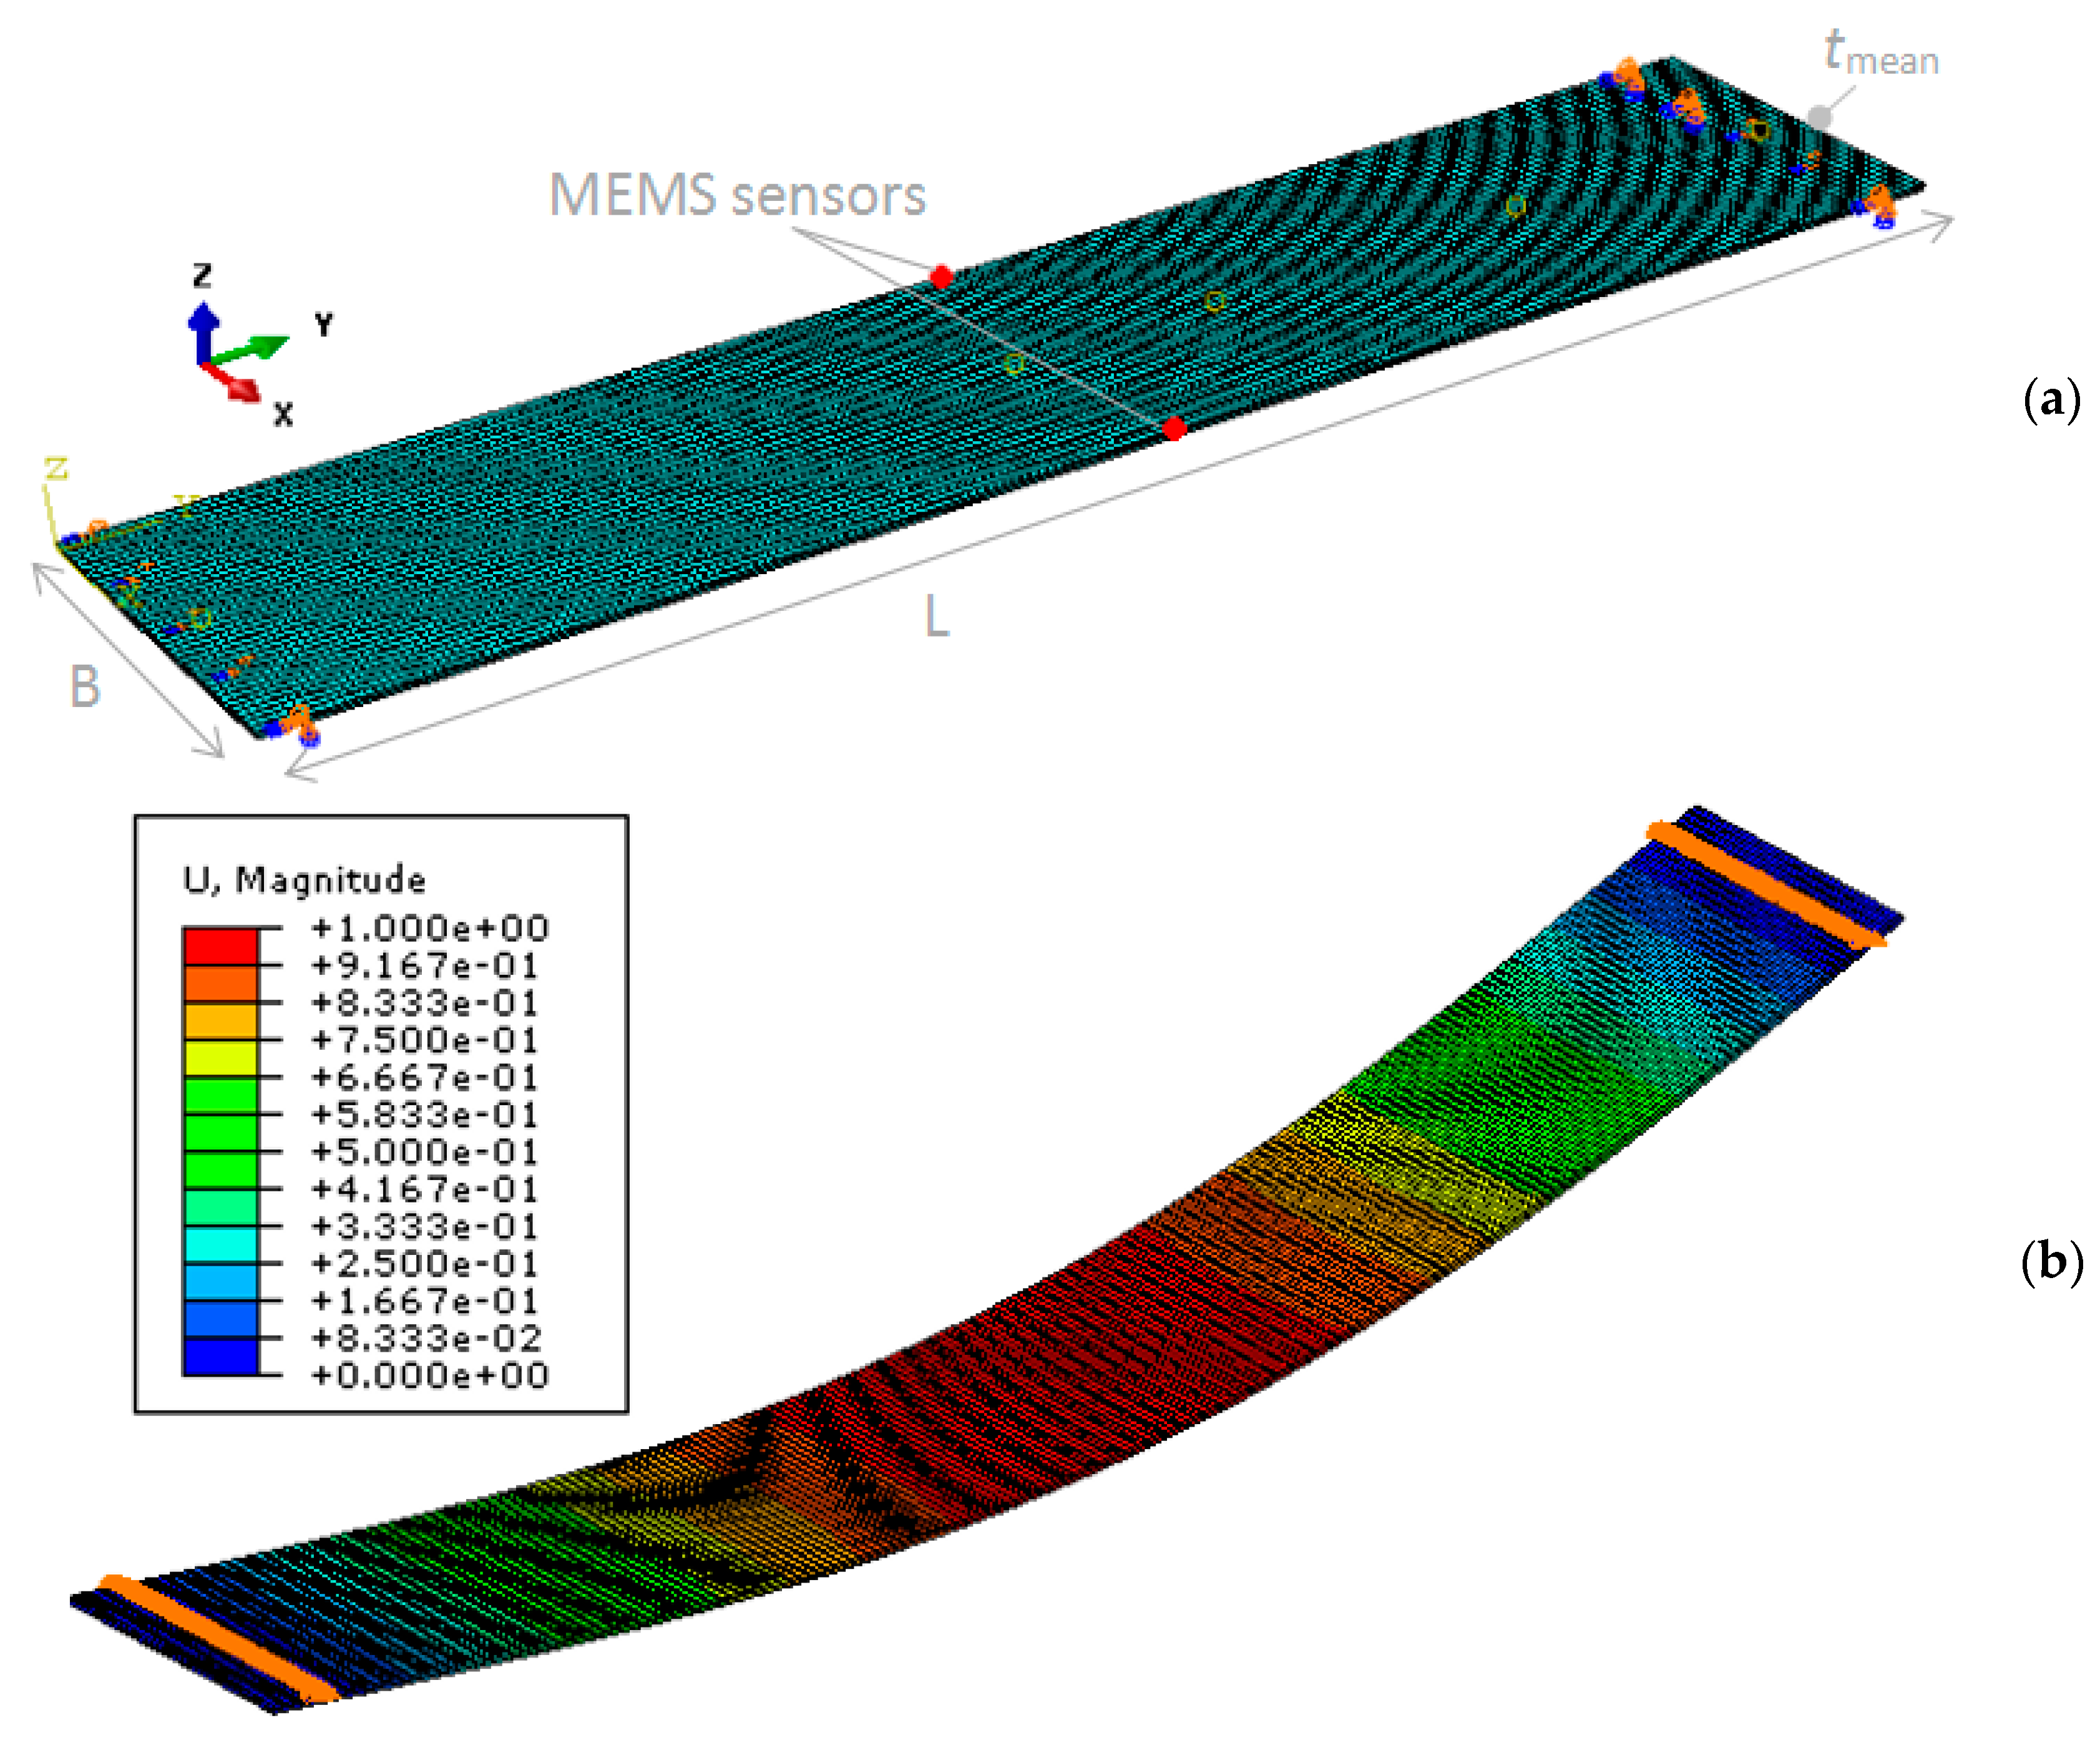
Finite Element numerical predictions of fundamental frequencies, in addition, were estimated via linear perturbation, frequency analyses carried out in ABAQUS [19]. There, each glass specimen was described in the form of 20-node, quadratic brick, with reduced integration, stress/strain solid elements (C3D20R type). A regular mesh pattern was used, with 5 mm the reference edge size and three elements in the thickness of glass (with a total of ≈16,000 solid elements and ≈27,000 DOFs for each FE model), see Figure 6. “Rigid” steel restraints were described in the form of equivalent nodal boundaries, to reproduce the nominal test setup configuration of Figure 1a. Equivalent springs where then introduced for the B-2, B-3 and B-4 type samples, according to Equation (7) and Table 1. In terms of geometry, the nominal B × L dimensions were considered for each specimen, while assuming the average thickness derived from Figure 3 (t = tmean = 5.86 mm). Based on preliminary laboratory measurements, glass was described in the form of a linear elastic material, with E = 70 GPa its nominal modulus of elasticity, ν = 0.23 the Poisson ratio and ρ = 2500 kg/m3 the material density [36]. The MEMS sensors were finally also accounted, in each FE assembly, via lumped masses able to reproduce the actual weight and position of the accelerometers in use during the experiments.
In terms of analytical estimations, limited damping contributions were expected for the tested glass specimens (see also Section 2), and their fundamental frequency f was consequently calculated via classical beam-theory formulations of literature [20], that is:
with
the undamped fundamental period of vibration.
In Equation (9), μA denotes the weight per unit of length of each sample (μ the density and A the t × B cross-section), L0 the bending span (Table 1). In addition, EI is the flexural stiffness of each specimen, with E = 70 GPa the modulus of elasticity of glass, and I = Bt3/12 the second moment of area. For analytical calculation purposes, the mean thickness t = tmean was accounted. In Equation (9), finally, the coefficient α defines the boundary condition of each sample (α = 3.516 and 9.869 for cantilever and beam specimens, respectively).
The so derived experimental, analytical, and numerical frequency values are reported in Table 2, where mean test frequencies are collected for the experimental samples.
Worth of interest is that Equation (8) roughly captures the actual frequency of the tested samples. Such an effect is mostly related to the lack of the local mass contribution due to the MEMS sensors, for the so estimated values. In addition, the analytical model is suitable for fully undamped systems in free vibrations and assumes ideally rigid restraints. The latter condition is reliable for the cantilever and beam specimens with “rigid” steel supports, while is not able to account for the presence of flexible restraints, as in the case of B-2, B-3 and B-4 samples.
From Table 2, in particular, it is possible to notice that the experimental frequency of B-n samples reduces as far as the restraint stiffness decreases. Given the geometrical and mechanical features of the rubber and cork layers in use (see Table 1), these frequency variations were found to be relatively small in the current study, i.e., in the order of ≈−2% the “rigid” B-1 configuration. As far as the modulus of elasticity (Es) and size of the soft layers modify; however, marked modifications can be also obtained for the expected fundamental frequency f, including further possible local deformations in the regions of supports and hence requiring dedicated studies. In this regard, it is also interesting to notice that the B-1 experimental frequency of Table 2 is in close correlation with the test estimations collected in [28] for monolithic beam-like samples with similar dimensions and thickness (with f = 14.72 Hz the laser-derived fundamental frequency).
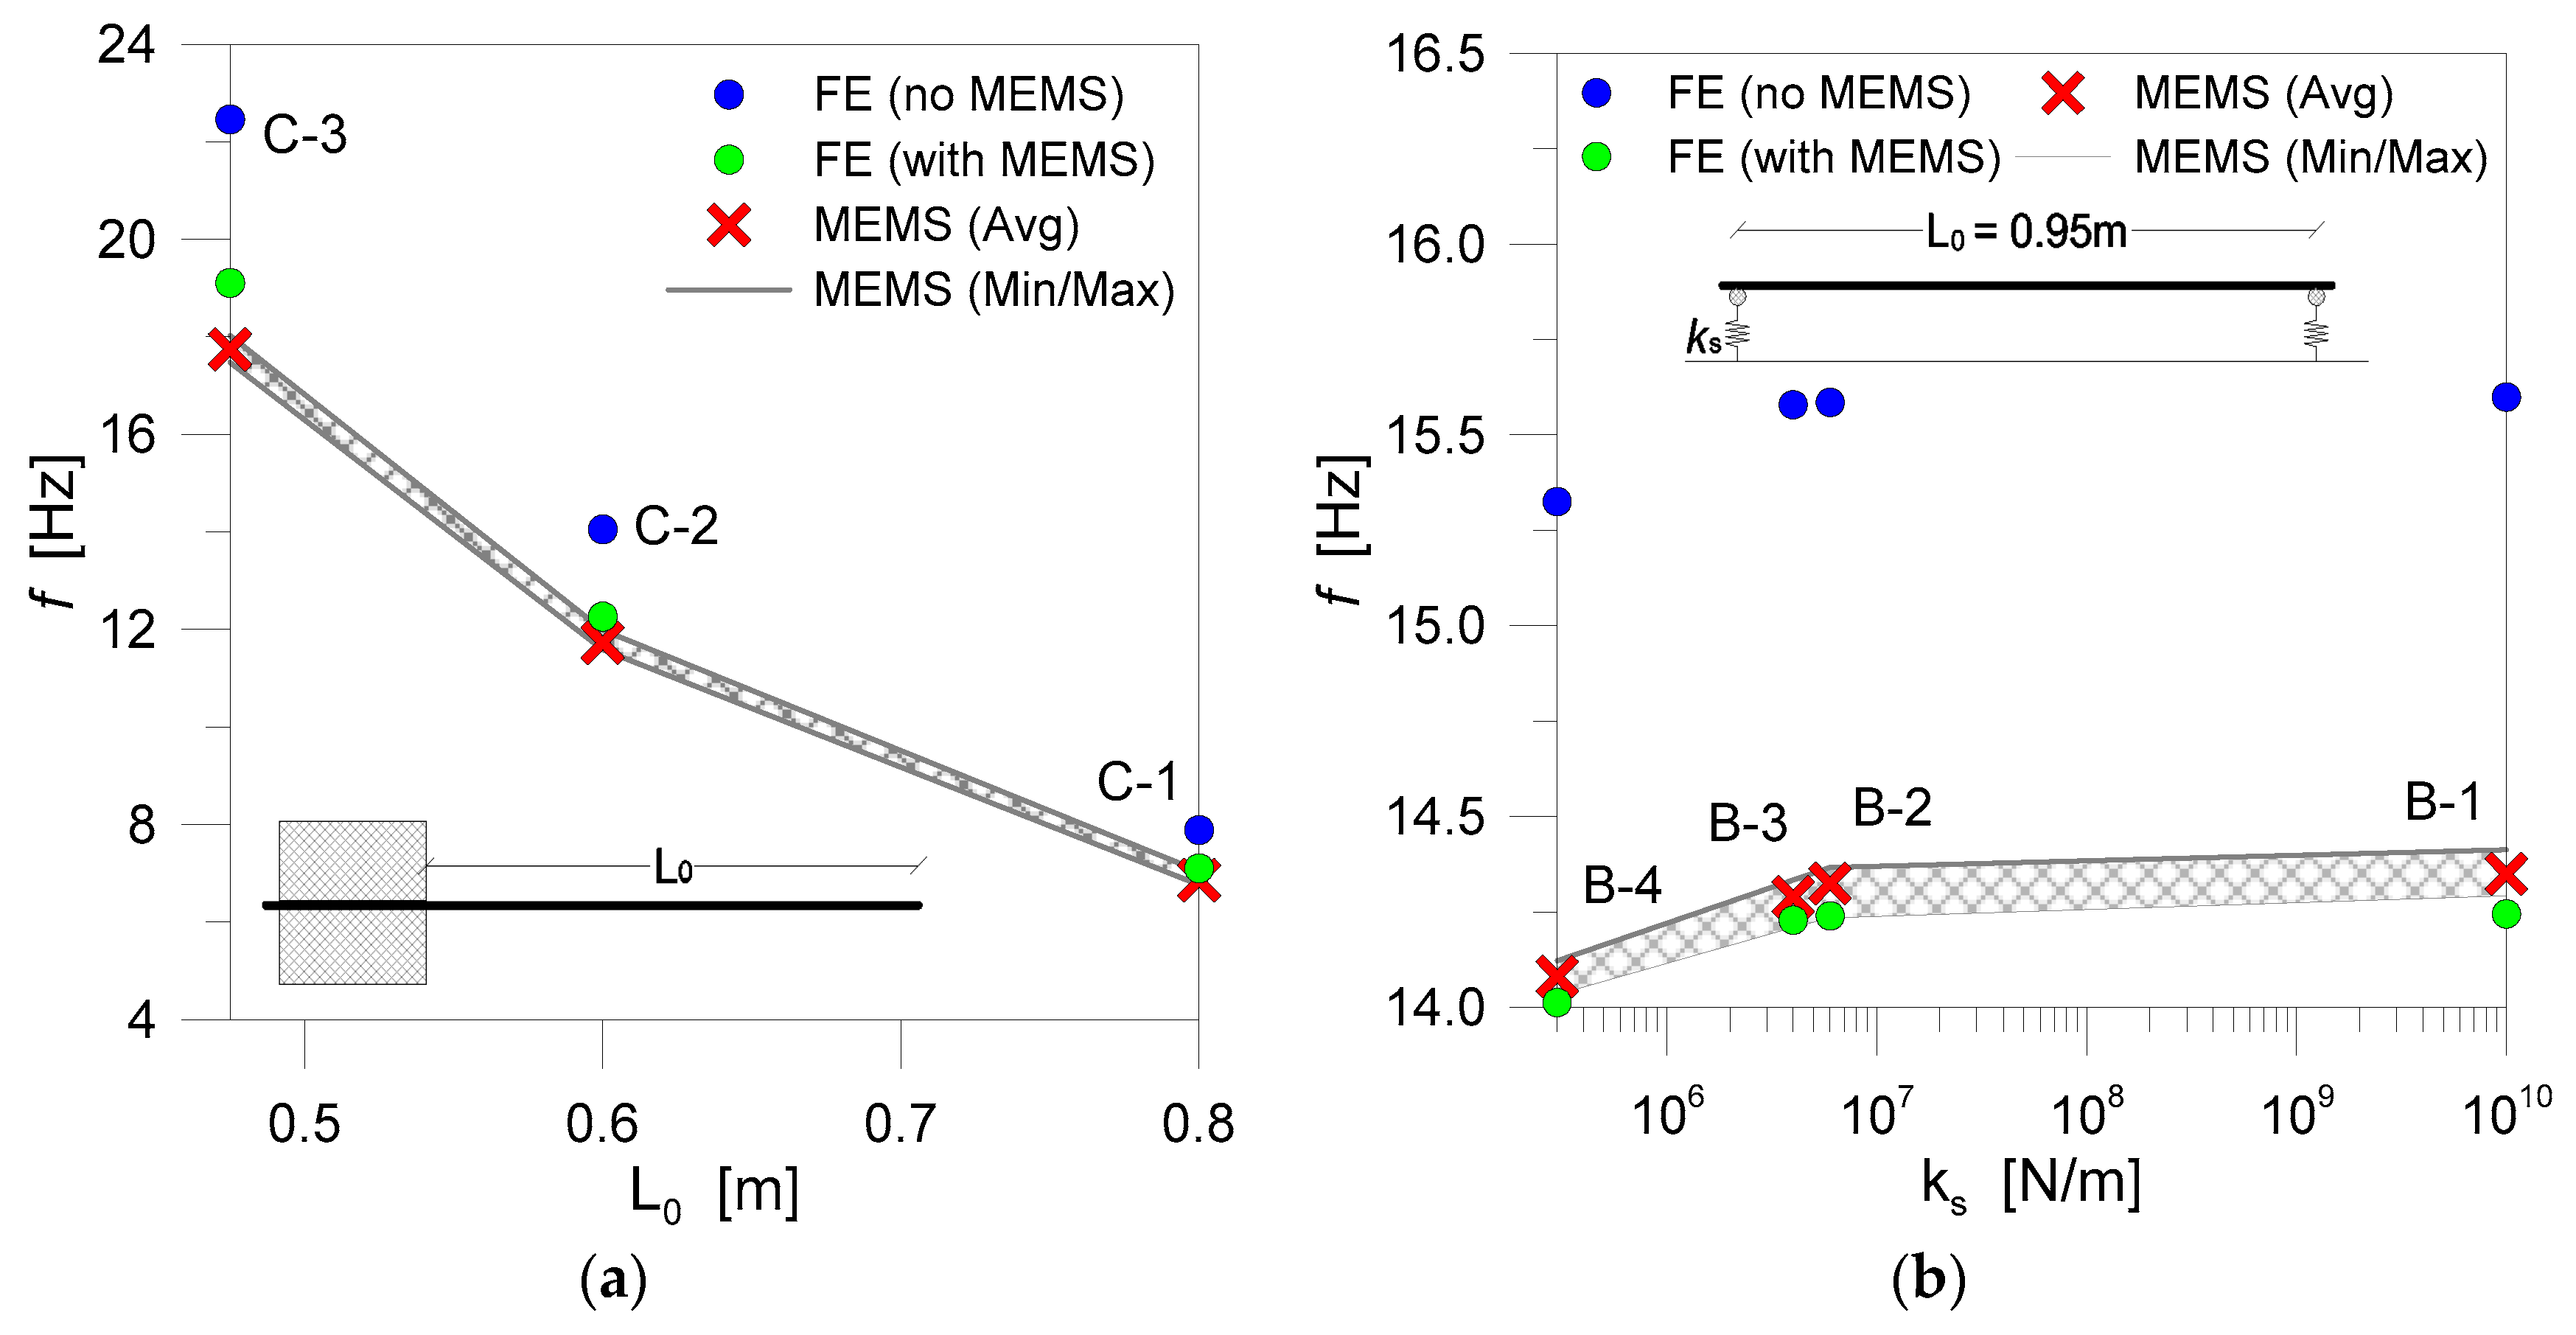
In Figure 7, further comparative data are proposed. Figure 7a,b, more in detail, present the frequency estimations for C-type and B-type samples, as derived from the MEMS measurements and from the corresponding FE models. In both plots, evidence of the variation of experimental predictions is also shown (i.e., “MEMS (Min/Max)” curves). According to Equation (9), a non-linear trend can be perceived between the collected frequency estimates and the given bending length L0, see Figure 7a. However, in both the plots, a mostly stable sensitivity of the mean frequency values can be perceived, as also emphasized by the gray contour plots. More in detail, mostly stable frequency values were obtained for the beam specimens (Figure 7b), where a minimum sensitivity of test results was observed (±0.06 Hz, with respect to the average). The cantilever specimens resulted in a maximum deviation of ±0.27 Hz, compared to the mean test value, for the short C-3 samples characterized by higher frequency and maximum MEMS-to-sample weight ratio (WMEMS = 0.095 W). Such a frequency deviation was found to progressively decrease while increasing the bending span and the MEMS-to-sample weight ratio of the C-type samples, down to 0.15 Hz and 0.1 Hz for the C-2 (WMEMS = 0.075 W) and C-1 specimens respectively (WMEMS = 0.056 W).
In both Figure 7a,b, the numerical frequencies derived from ABAQUS are in fact also reported, giving evidence of the frequency variations due to the mass contribution of MEMS sensors. As shown, the best frequency correlation was obtained when accounting for the presence of MEMS devices, hence confirming the key role of local setup details for reliable predictions. When the percentage scatter ∆ of numerical and experimental data is considered for the comparisons of Figure 7a, with:
it can be easily perceived that as far as L0 decreases, ∆ increases (see for example the C-3 comparisons of Figure 7a). Such a weak correspondence (∆ = 7% the scatter of the “FE (with MEMS)” frequency value, compared to the test prediction) could be justified using a mean glass thickness tmean for the C-3 numerical assembly, in place of the nominal 6 mm thickness. According to the test setup and input features of Figure 2 and Table 1, even small variations in the reference glass thickness would in fact result—for both the analytical and FE numerical models—in marked variations of the bending stiffness of the samples, with higher sensitivity of short beams. According to Equations (8) and (9), more in detail, a ± 0.2 mm thickness variation would manifest in a frequency variation up to ≈0.55 Hz for the C-3 samples (with 0.4 Hz and 0.2 Hz the expected variation for the C-2 and C-1 specimens).
A certain scatter, finally, could be justified by the accelerometers themselves, as also discussed in [28], and the use of laser acquisition (or general contact-less) systems should be preferred, when possible. In [34], the accelerometers were in fact assessed and validated for diagnostic investigations in buildings and constructional components having frequencies of vibration up to a maximum of ≈15 Hz, based on the available software and hardware packages.
As far as the bending span increases for the C-2 and C-1 samples of Figure 7a, hence their vibration frequencies progressively decrease, the FE predictions were found to present a gradually lower scatter (∆ = 4% and 3%, for C-2 and C-1 respectively), compared to the C-3 specimens. The latter assumption is partly confirmed by the B-type numerical and experimental results collected in Figure 7b. There, it is possible to perceive a rather close correlation of “FE (with MEMS)” estimations, compared to the average test predictions, with a mostly stable scatter, in the order of ∆ = 0.4–0.6% for all the configurations. In addition, the general trend of collected frequency values, as far as the axial stiffness ks (Equation (7)) of supports modifies, is further emphasized.
4.1.2. FE Numerical Study on Boundary Effects
According to Figure 7, it is clear that the geometrical and mechanical features of restraints can have a certain effect on the actual dynamic parameters of glass components and assemblies. To further explore the sensitivity of such a frequency variation, a FE numerical study was hence carried out on the tested configurations. More in detail, the fundamental frequency of cantilever and beam-like glass samples according to Figure 2 was numerically assessed, via linear perturbation frequency analyses, by taking into account different stiffness properties, compared to the reference ideal restraints.
In the case of the C-type samples, variations were numerically imposed in the form of rotational stiffness kc for their fixed restraint, in a sufficiently wide range (kc → ∞ for the rigid steel clamp). Such a simulation choice was aimed at reproducing the presence of a linear clamp with partial flexibility, being well representative of various real design conditions (see for example the balustrade detail of Figure 1). Similarly, within the FE numerical study, B-type specimens were analyzed by assigning different values for the axial stiffness ks of each support (ks → ∞ for the rigid steel restraints).
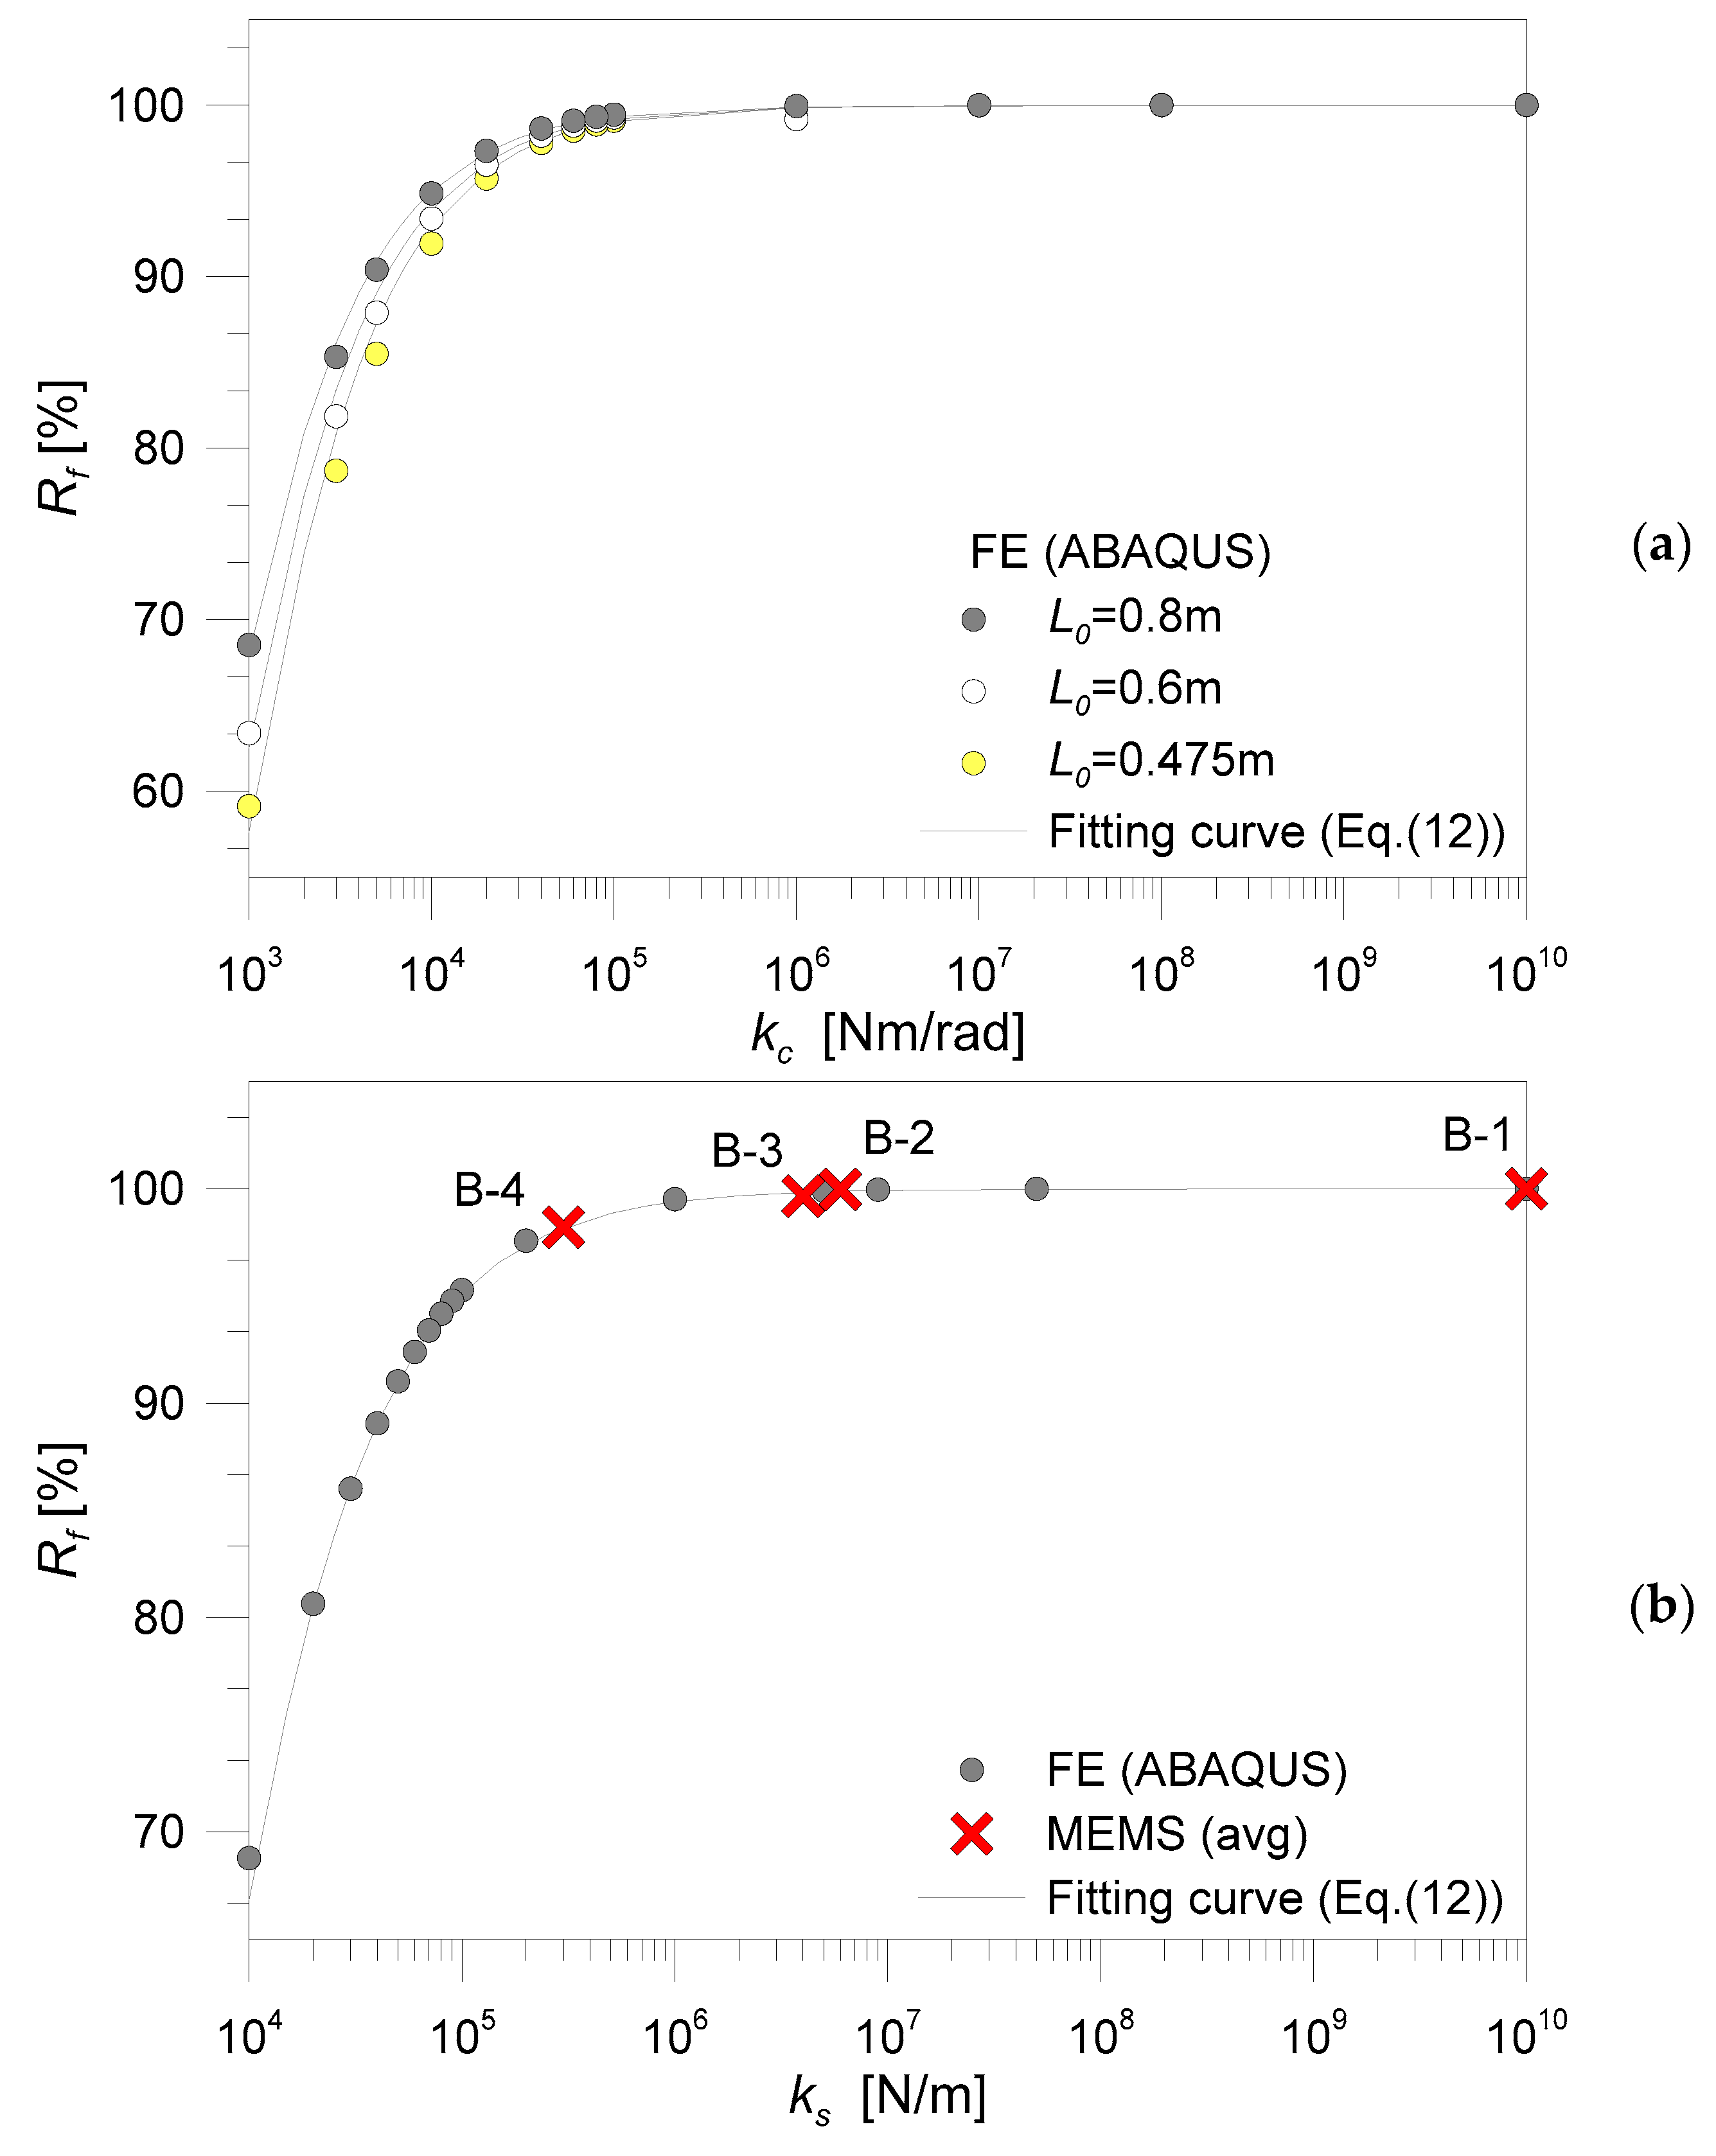
Selected results from the so defined parametric study are proposed in Figure 8. There, Rf denotes the percentage variation of the calculated fundamental frequencies f*, with respect to the frequency f of the reference glass systems with ideally rigid “steel” restraints (Rf = 100%).
As far as f is calculated for the examined glass panels according to Equation (8), a reliable estimation of f* values for non-ideal restraint conditions can be in fact performed as:
where
According to Figure 8, the input parameters of Equation (12) can be reasonably calculated on the base of simplified fitting curves, that is:
- ✔
- for C-type specimens
- ✔
- for B-type specimens
For all the numerically investigated C-type specimens, in particular, variations of the reference rotational stiffness proved to have negligible effects on the obtained frequencies, hence resulting in mostly null sensitivity (i.e., Rf ≈ 100%), as far as kc > 105 Nm/rad (see Figure 8a). When kc < 105 Nm/rad, otherwise, it is possible to notice that the frequency variation exponentially modifies, according to Equations (12) and (13). In the same figure, finally, the cantilever span L0 (and hence the corresponding bending stiffness) marginally affects the frequency trend. For real design applications (i.e., Figure 1 and similar), however, such a potential sensitivity of vibration responses (and related stress-strain distributions) should be properly assessed.
In terms of FE parametric results for the B-type samples, comparative curves are collected in Figure 8b. In addition, due to the availability of test results, average experimental frequencies from MEMS accelerometers are also reported in the same figure. The FE study highlighted that as far as the axial stiffness of supports is ks > 108 N/m, no frequency variations are expected for beam-like samples. The Rf coefficient, as shown, exponentially decreases as far as the support flexibility increases, according to Equations (12) and (14).
4.1.3. Some Considerations on Video-Camera Acquisitions and Results
Further assessment of the calculated frequency values was carried out based on the acquired video-camera records. During the experimental investigation, several tentative measurements were carried out on selected test specimens, to assess the accuracy and sensitivity of the derived dynamic estimations to the setup assumptions for the method in use.
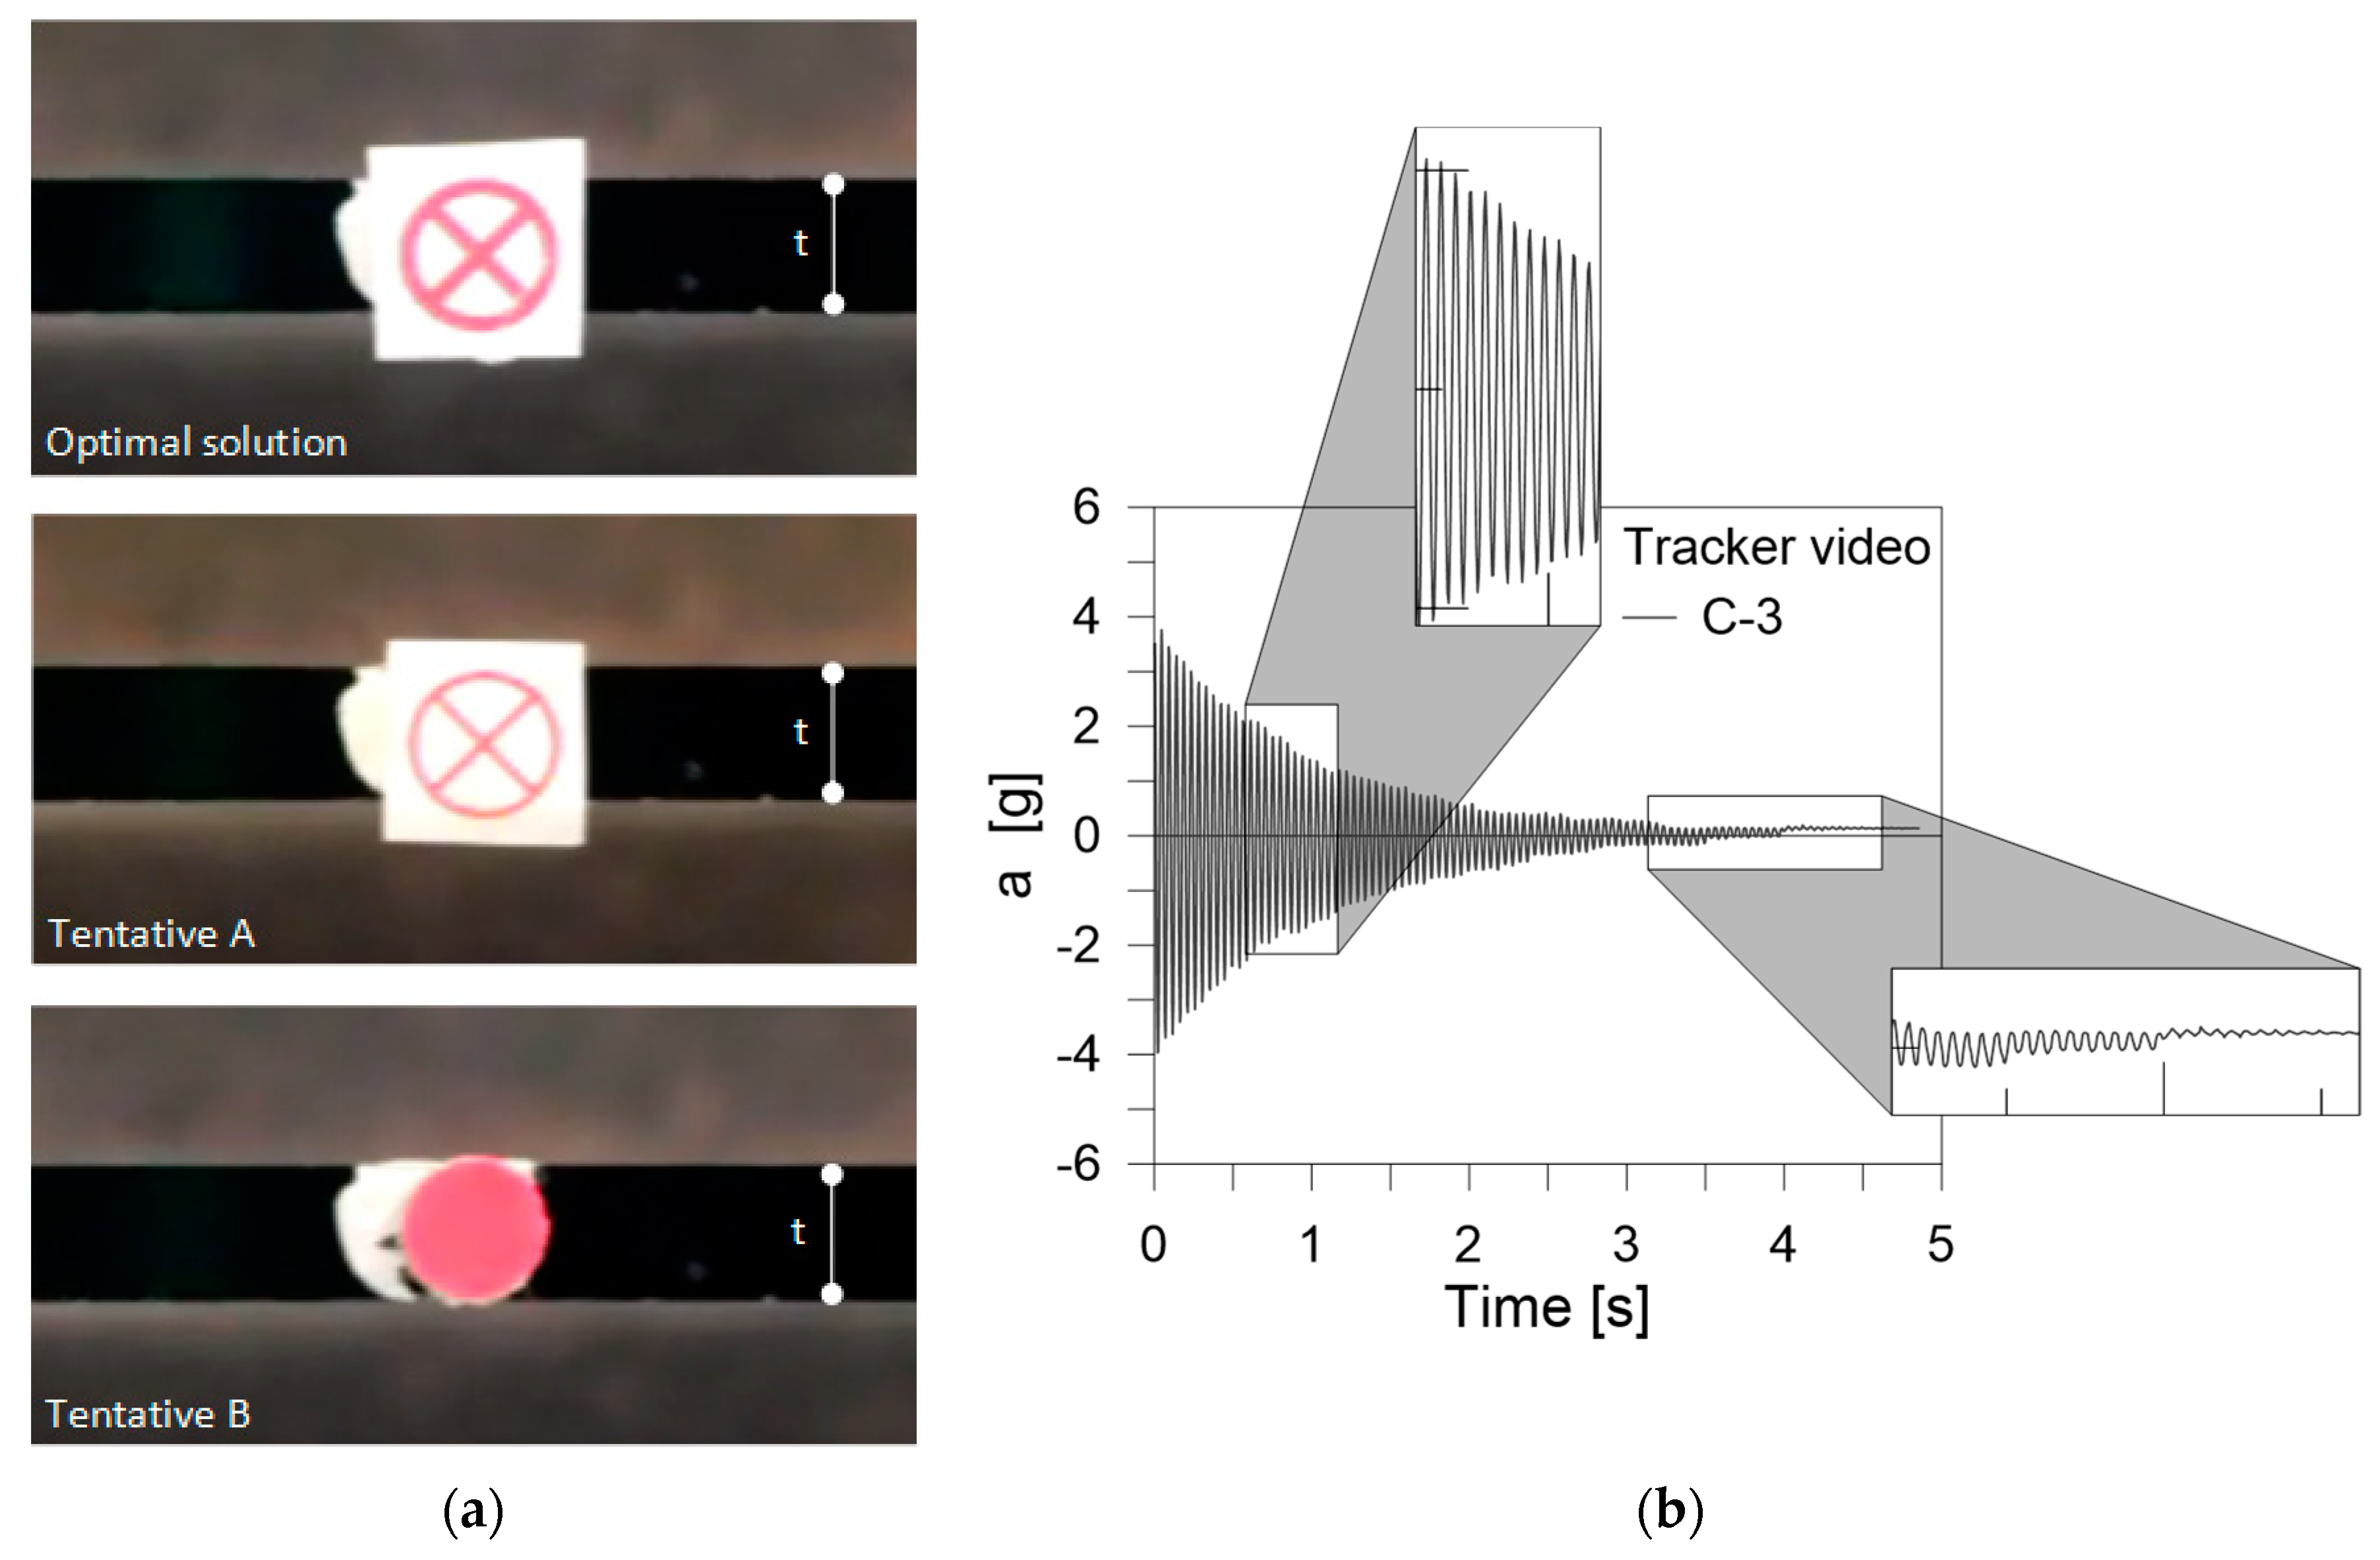
In general, the so acquired dynamic responses proved in fact to be sensitive to even minor detail assumptions for the execution of the experiments (see for example Figure 9a). The acceleration-time histories derived from the post-processing of video records also emphasized some limits of such a simplified technique, with respect to more advanced and refined digital image correlation approaches (see for example the box details of Figure 9b), hence requiring careful attention for practical applications, and suggesting a reliable implementation of the method for simple configurations only. In any case, promising dynamic estimations were obtained for the investigated glass panels. In Table 3, for example, some comparisons are proposed for the C-type specimens, in terms of fundamental frequency values and corresponding scatter.
Worth of interest, in Table 3, is the generally good correlation between the calculated video-based frequencies and the available MEMS, analytical and numerical comparative data, as far as the influence of local masses due to MEMS sensors is properly accounted (i.e., “analytical” and “FE (no MEMS)” scatter values). Such a sensitivity of frequency estimations to test instruments was also briefly emphasized in [28].
4.2. Damping
The damping ratio ξ for the same experimental samples was then experimentally derived, both from MEMS records and video-camera acquisitions.
Compared to the frequency estimations of Section 4.1, a higher sensitivity of damping measurements was generally observed for all the collected data, being the vibration response of the tested samples highly susceptible to external perturbations, especially in the first instants of the vibrating response. In addition, it is important to recall that the measured damping ratios are inclusive of both material and aeroelastic terms, where the second depends on the amplitude of the imposed vibrations. In any case, a certain correlation was found with past efforts of literature.
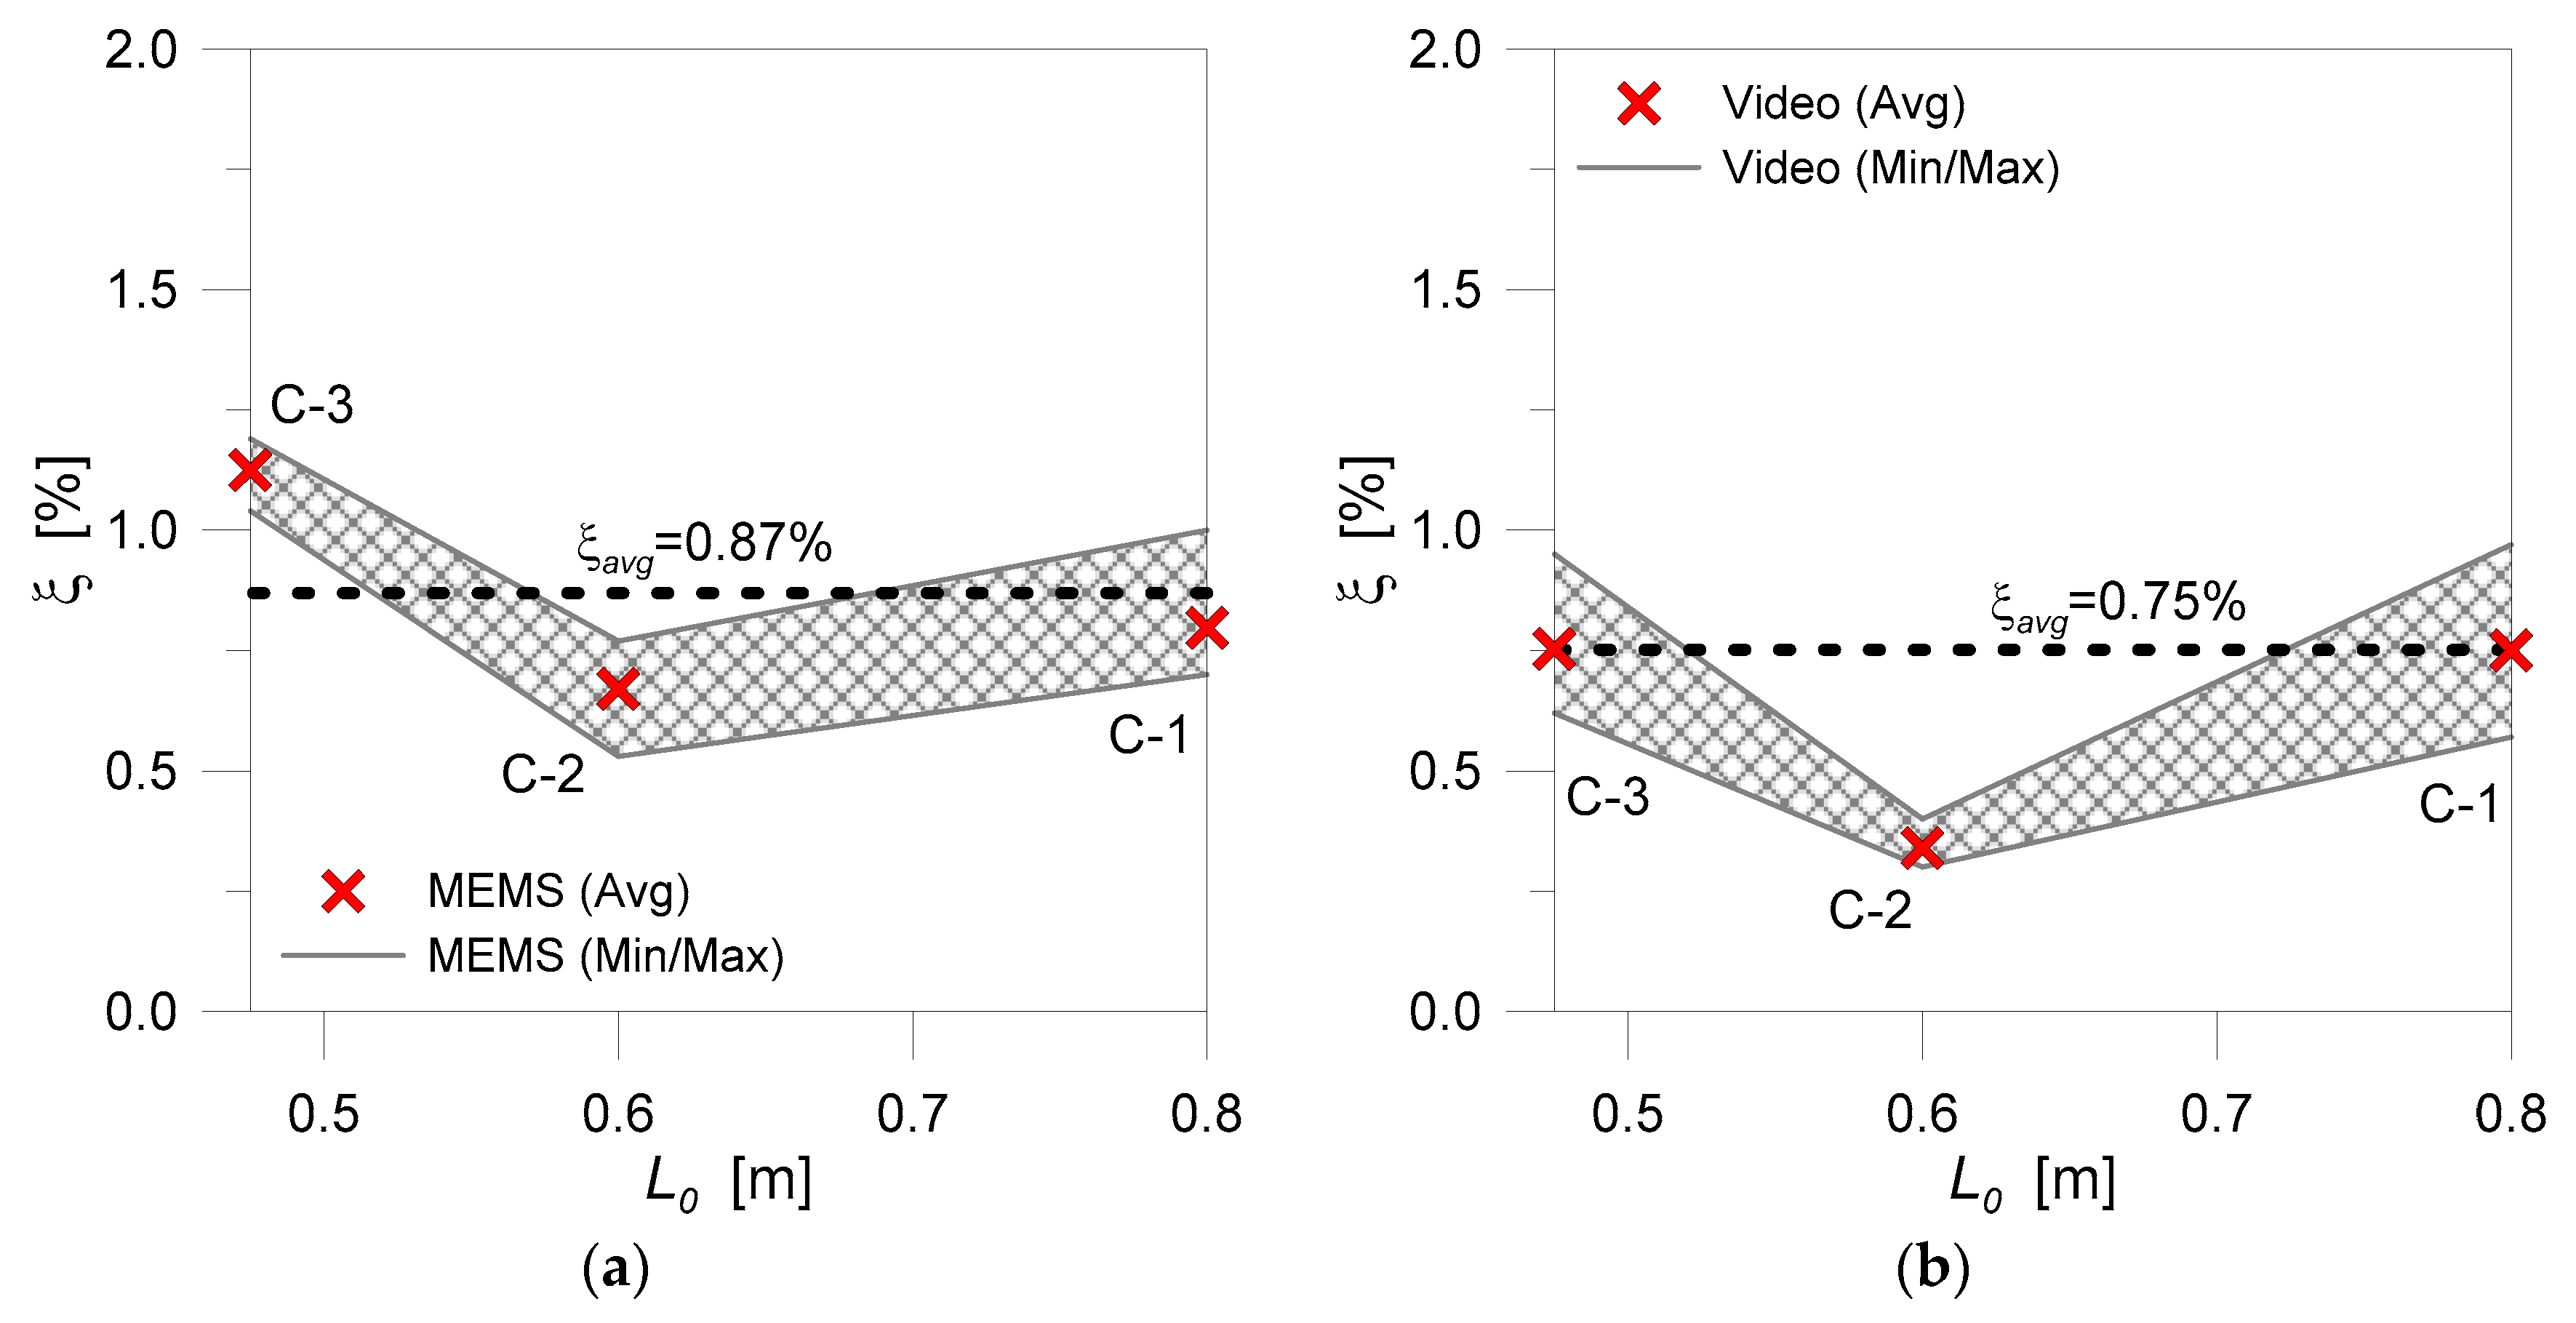
In Figure 10a and Figure 11, the damping ratios calculated from MEMS records are proposed for the C-type and B-type samples (average values, with “Min/Max” interval of variation). For the cantilever specimens, further test estimations are also collected in Figure 10b, as obtained from video-camera post-processing analyses on the non-instrumented glass samples. In the latter case, all the ξ values were calculated as the logarithmic decrement of video-acquired acceleration-time histories according to Figure 9.
By comparing the test estimations of Figure 10a,b, a certain correlation can be perceived between MEMS and video-based results, as well as past literature efforts. According to [28], for example, it is possible to preliminary conclude that the used MEMS accelerometers (and related cables) partly affected the collected dynamic records and the derived dynamic parameters, with a global average scatter of ≈+15%, compared to the video-record calculated damping ratios for the non-instrumented glass samples. A mean damping coefficient of ξavg = 0.87% and ξavg = 0.75% was in fact calculated for the instrumented and non-instrumented C-type samples, respectively. The best correlation between MEMS and vide-record damping estimates can be observed for the C-1 specimens, being characterized by a maximum bending span and a minimum disturbance effects due to the presence of the accelerometers. Otherwise, as also discussed in [28], the damping estimations for the short cantilever samples proved to be highly susceptible to the presence of MEMS.
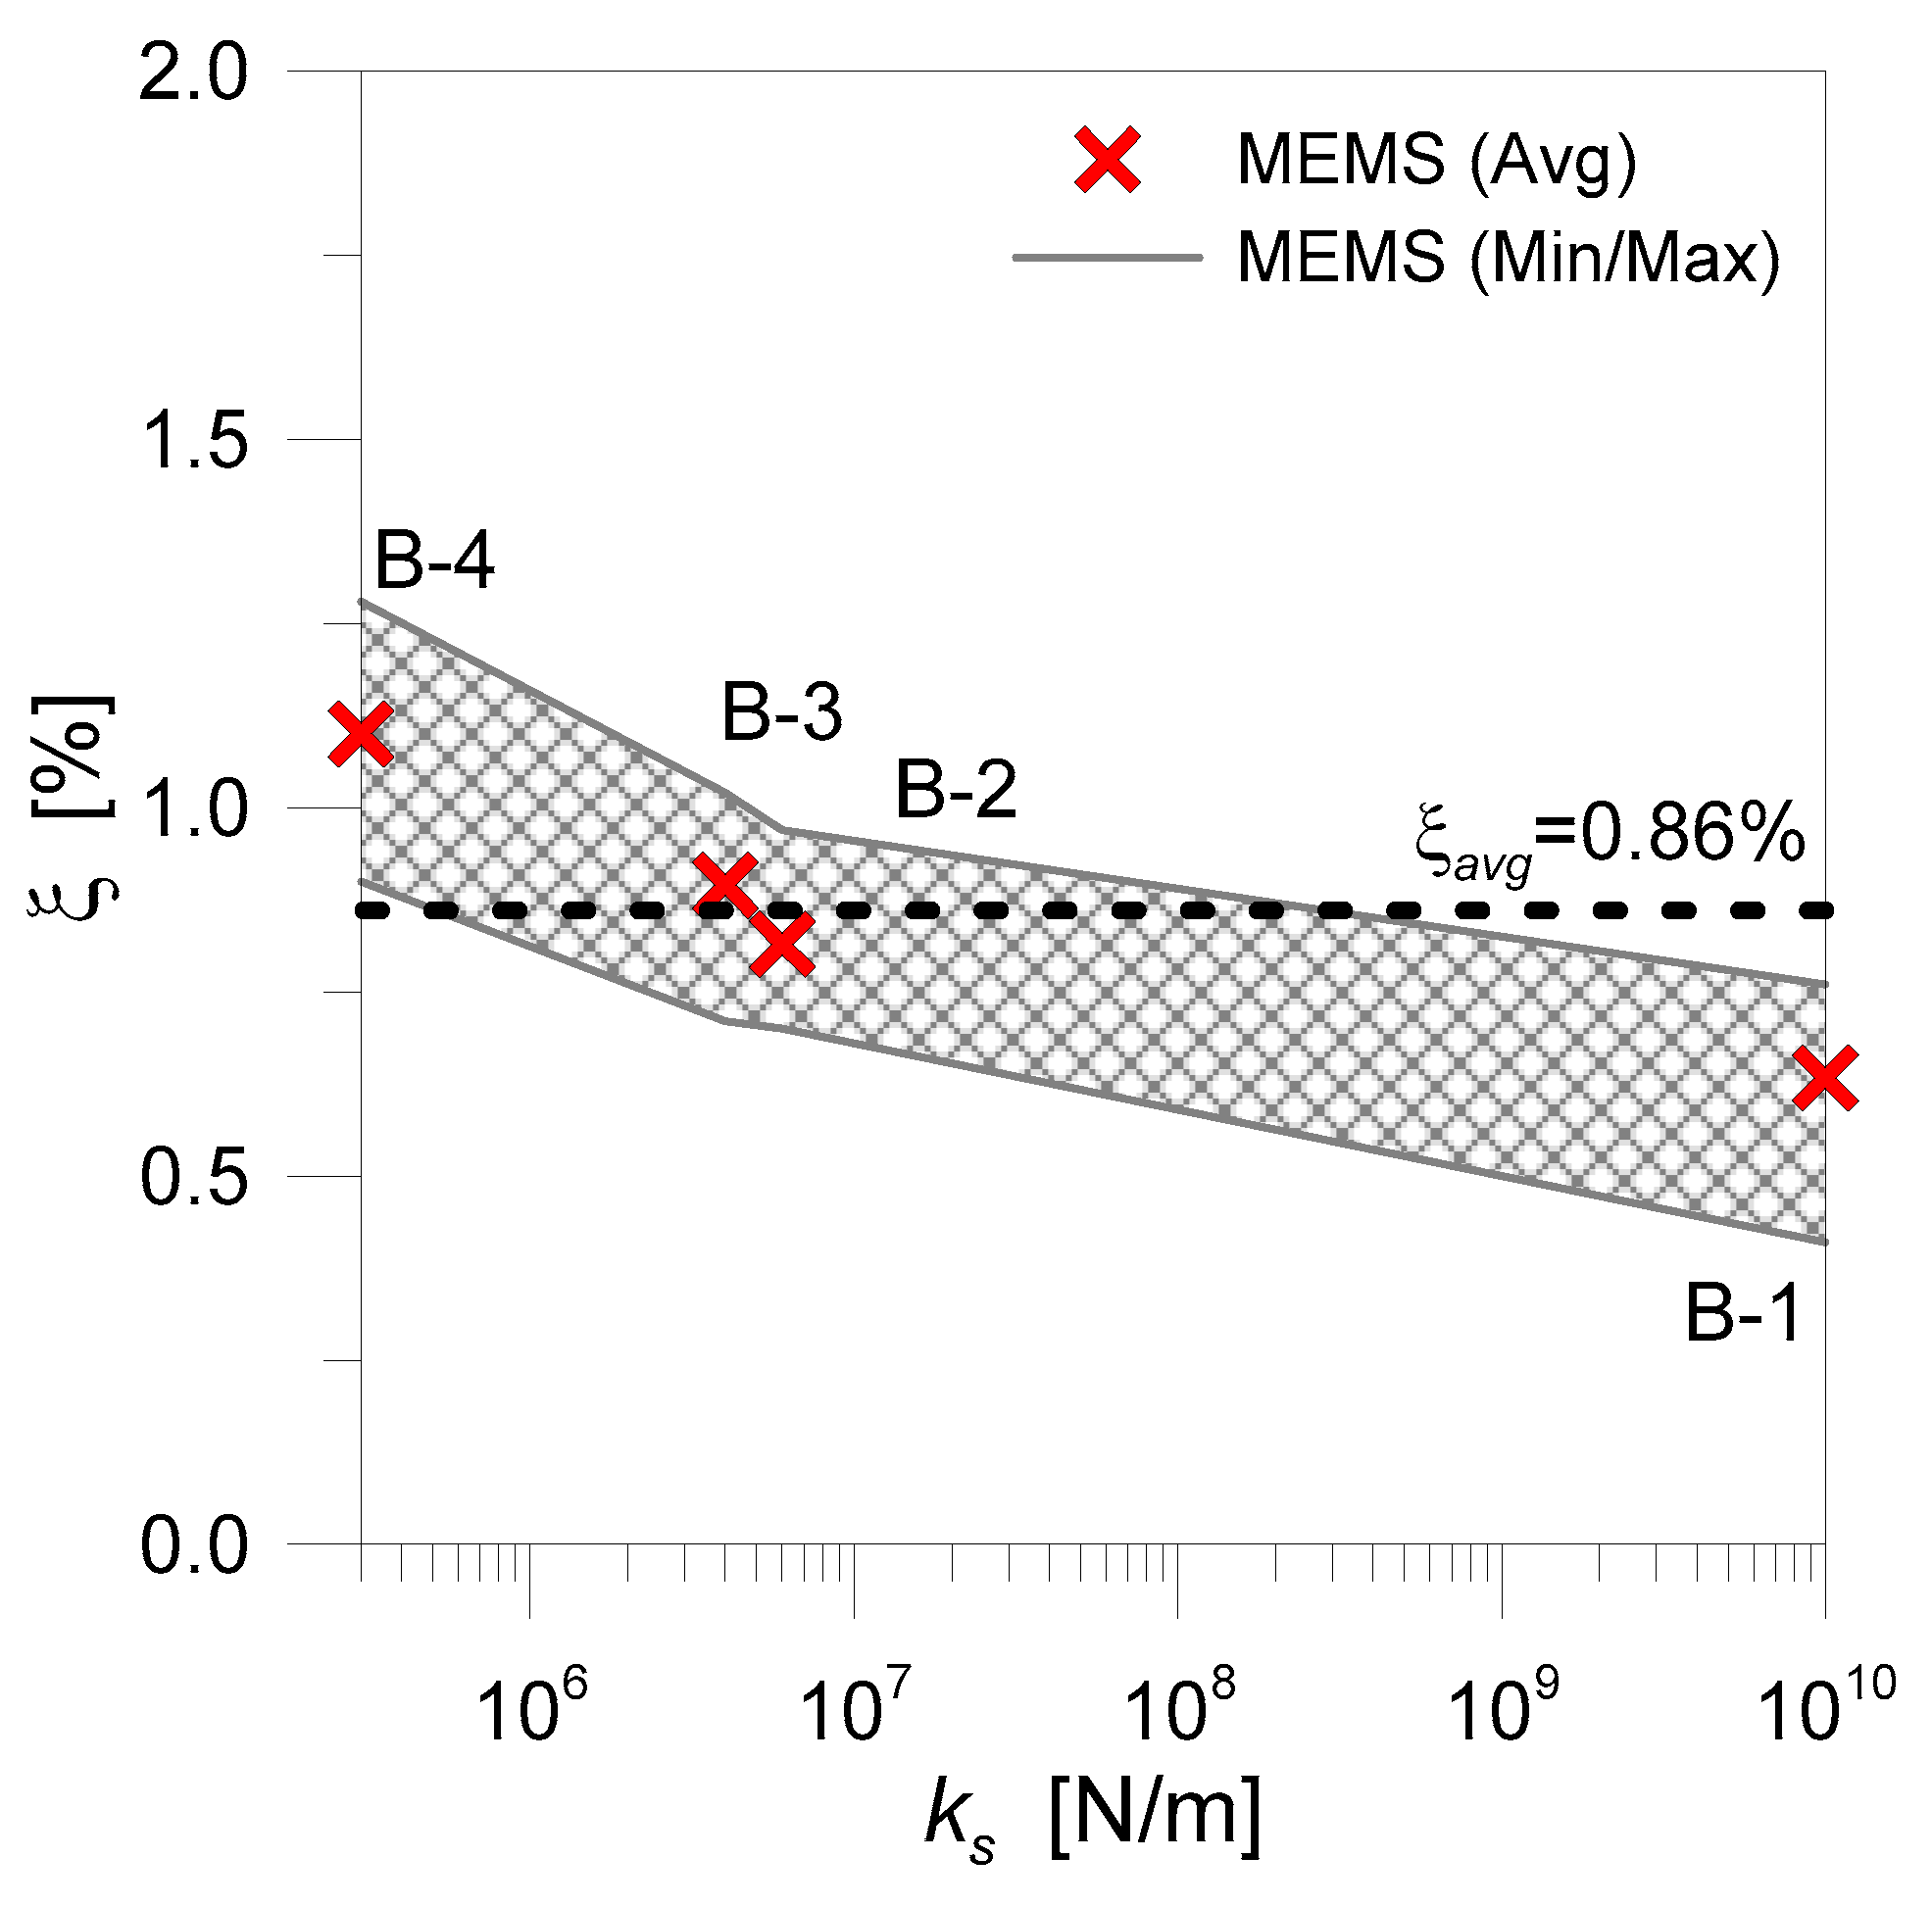
In terms of B-type specimens, an average value ξavg = 0.86% was calculated from MEMS records, see Figure 11, that agrees with C-type mean results. In addition, a certain correlation can be perceived between beam-like estimations of Figure 11 and past literature investigations, where damping ratios in the order of ≈0.8% were experimentally derived for fully instrumented glass samples with similar dimensions (see [28]). Worth of interest, from the current study, is the variation of the ξ values in Figure 11 with the flexibility of supports. The calculated damping ratios, as shown, tend progressively to increase for the B-2, B-3 and B-4 samples, with respect to the B-1 specimens with “rigid” steel boundaries, hence confirming a certain contribution due to the presence of non-ideal restraints. In any case, a widely extended experimental campaign would be required to further validate and generalize the actual test estimates. Refined investigations, in this regard, should be carried out on real glazed components and assemblies in service conditions (i.e., Figure 1).
4.2.1. Derivation of Frequency-Based Fitting Curves for Damping Estimations
Given the full set of available test predictions of Figure 10 and Figure 11, their general expression can be particularly useful for design considerations, at least from preliminary calculations and tentative FE analyses. Such a kind of result can be derived, from example, from the correlation between the mean experimental damping values and the fundamental frequency f of the tested samples, as also in accordance with past literature efforts.
In [22], a simple linear fitting curve was proposed by Lenci et al., for approximate damping estimations for free-free LG specimens, where it was shown that:
According to Equation (15), it is evident that higher damping ratios ξ were experimentally derived in [22], compared to the current investigation, with estimated dissipative capacities up to 3–4 times the comparative results of Figure 10 and Figure 11, even in presence of mostly comparable frequency ranges. One of the major motivations can be represented by the analysis, in the past literature study, of LG sections with marked damping effects due to the interposed viscoelastic PVB foils. Some further sensitivity of damping estimates of literature can then be also justified by their sensitivity to the excitation intensity and to the imposed vibration amplitude, hence resulting in weak direct comparisons (see also [28]).
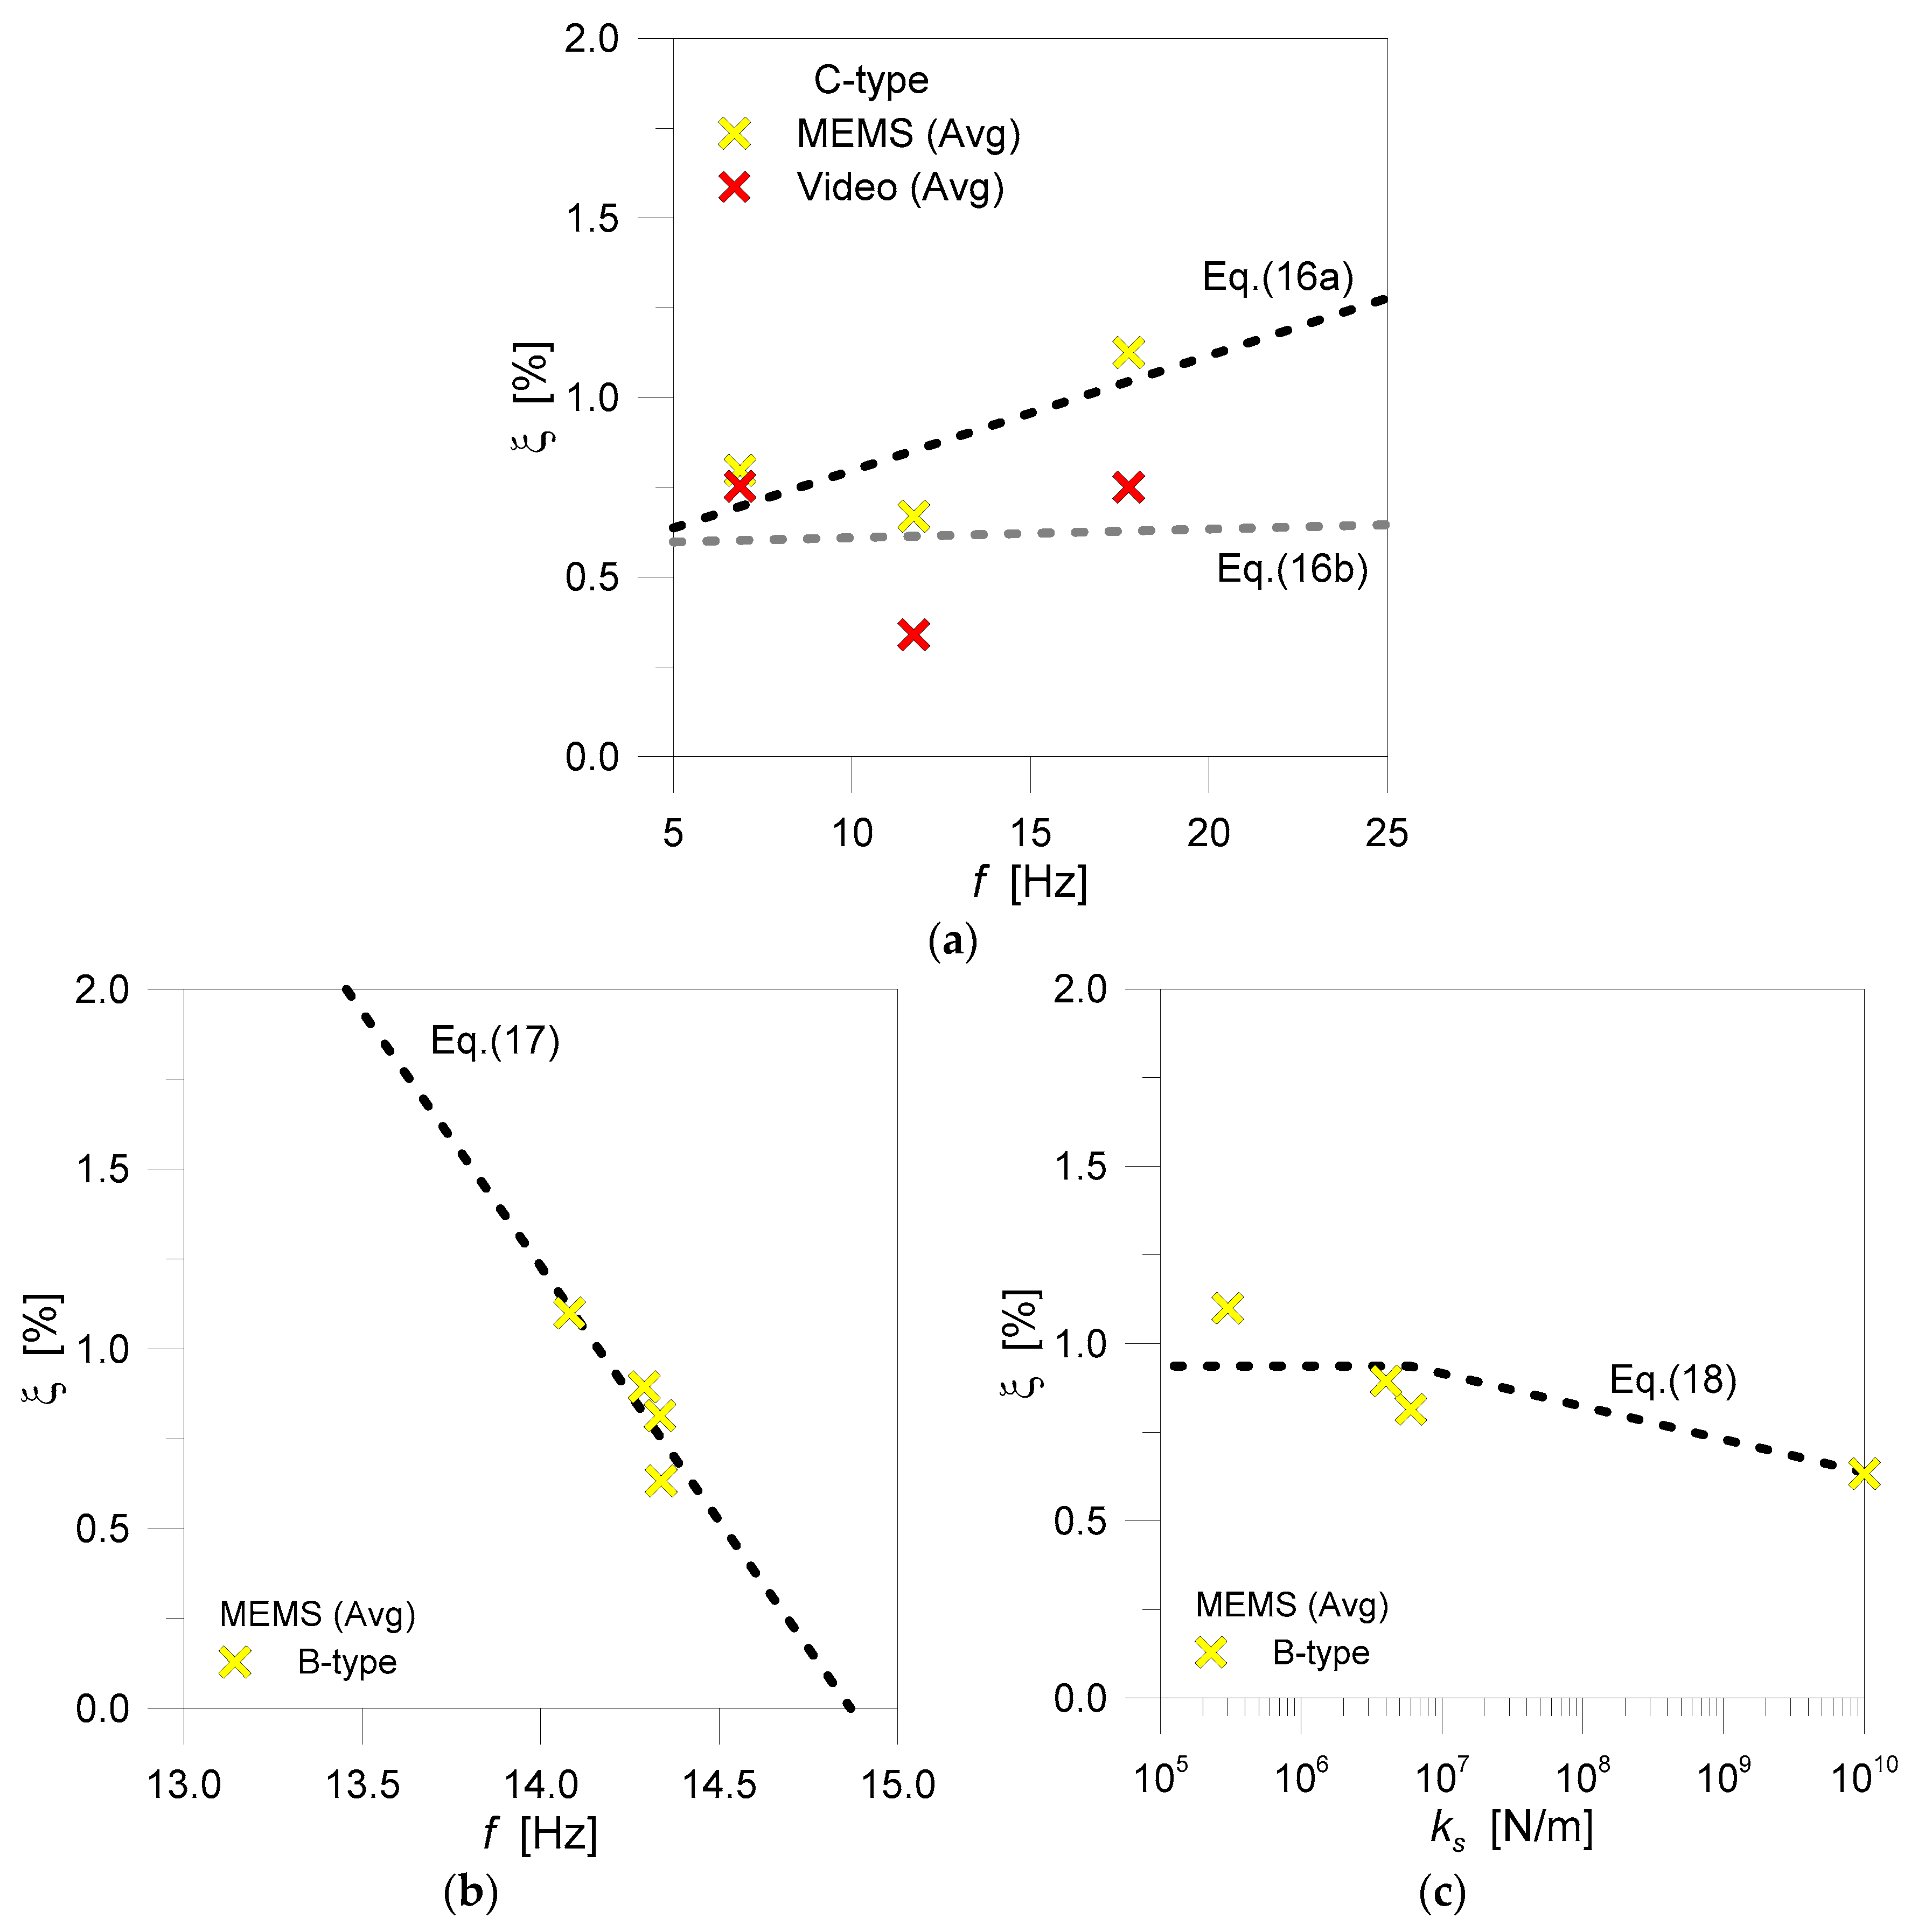
As far as the experimental outcomes discussed herein are taken into account, see Figure 12a, simple linear fitting curves can be still derived to reproduce—with reliable accuracy and computational efficiency—the expected damping ratio of a given glass member. In Figure 12a, in particular, the fitting curves:
and
are obtained for the instrumented and non-instrumented C-type monolithic glass samples.
Accordingly, the damping ratio for the B-type specimens of Figure 12c could be calculated as:
However, for B-type samples, the most influencing parameter is certainly represented by the stiffness of supports. Consequently, as an alternative to Equation (17), it is worth emphasizing in Figure 12c the linear dependency of ξ ratios on ks, where:
4.2.2. Semi-Analytical Formulation for Damping Estimations
According to Equation (5), reliable damping estimations for design applications could be obtained as far as the mass m and the fundamental circular frequency ω of the system object of analysis are known, where:
and
The challenge arises from the correct calculation—even for relatively small damping ratios ξ = ξTOT—of both the expected dissipative contributions of materials (i.e., ξM, due to glass, gaskets, viscous interlayers, connection details, etc.) and aeroelastic effects (ξA).
The herein recalled formulation was proposed in [13,48] for the FE analysis of the dynamic performance of complex steel-glass facades under blast pressures. There, it was shown that an average ξM ≈ 1% ratio can be considered for complex glazed assemblies and is strictly related to the velocity of vibration. According to Figure 10 and Figure 11, it is hence reasonable to assume that the collected ξ estimations are inclusive—although for limited vibration amplitudes and surfaces exposed to air—of both the ξM and ξA contributions, where the first term prevails on the second.
Following [13,48], the aeroelastic term of ξA can be indeed calculated by taking advantage of the theoretical definition of drag force for an oscillating mass:
as well as by the expression of damping force at a given time instant, in the governing equation for the dynamic motion of a vibrating system (i.e., Equation (1)), where:
Based on Equations (19) and (22), the semi-analytical estimation of ξA is given by:
with cD = 1.17 the drag coefficient for rectangular plates [13], ρA = 1.225 kg/m3 the density of air, S the surface of glass (S = B × L0, in this study) and vrel the velocity of the vibrating system, relative to air. In addition, m is the total mass of each glass specimen, ρ the density of glass, t the thickness and ω the fundamental frequency.
As far as the relative velocity vrel of the oscillating system is known, based on Equation (23), the ξA contribution is also defined. Based on [13,48], such an input value can be reasonably assumed as the average speed of the system object of analysis, being dependent on the maximum velocity vmax and on the actual distribution of speeds along the system span. When available, as in the current study, the experimental measurements for vmax could be taken into account. Accordingly, the mean speed vrel can be assumed—for cantilever and beam samples—equal to vmax/3.
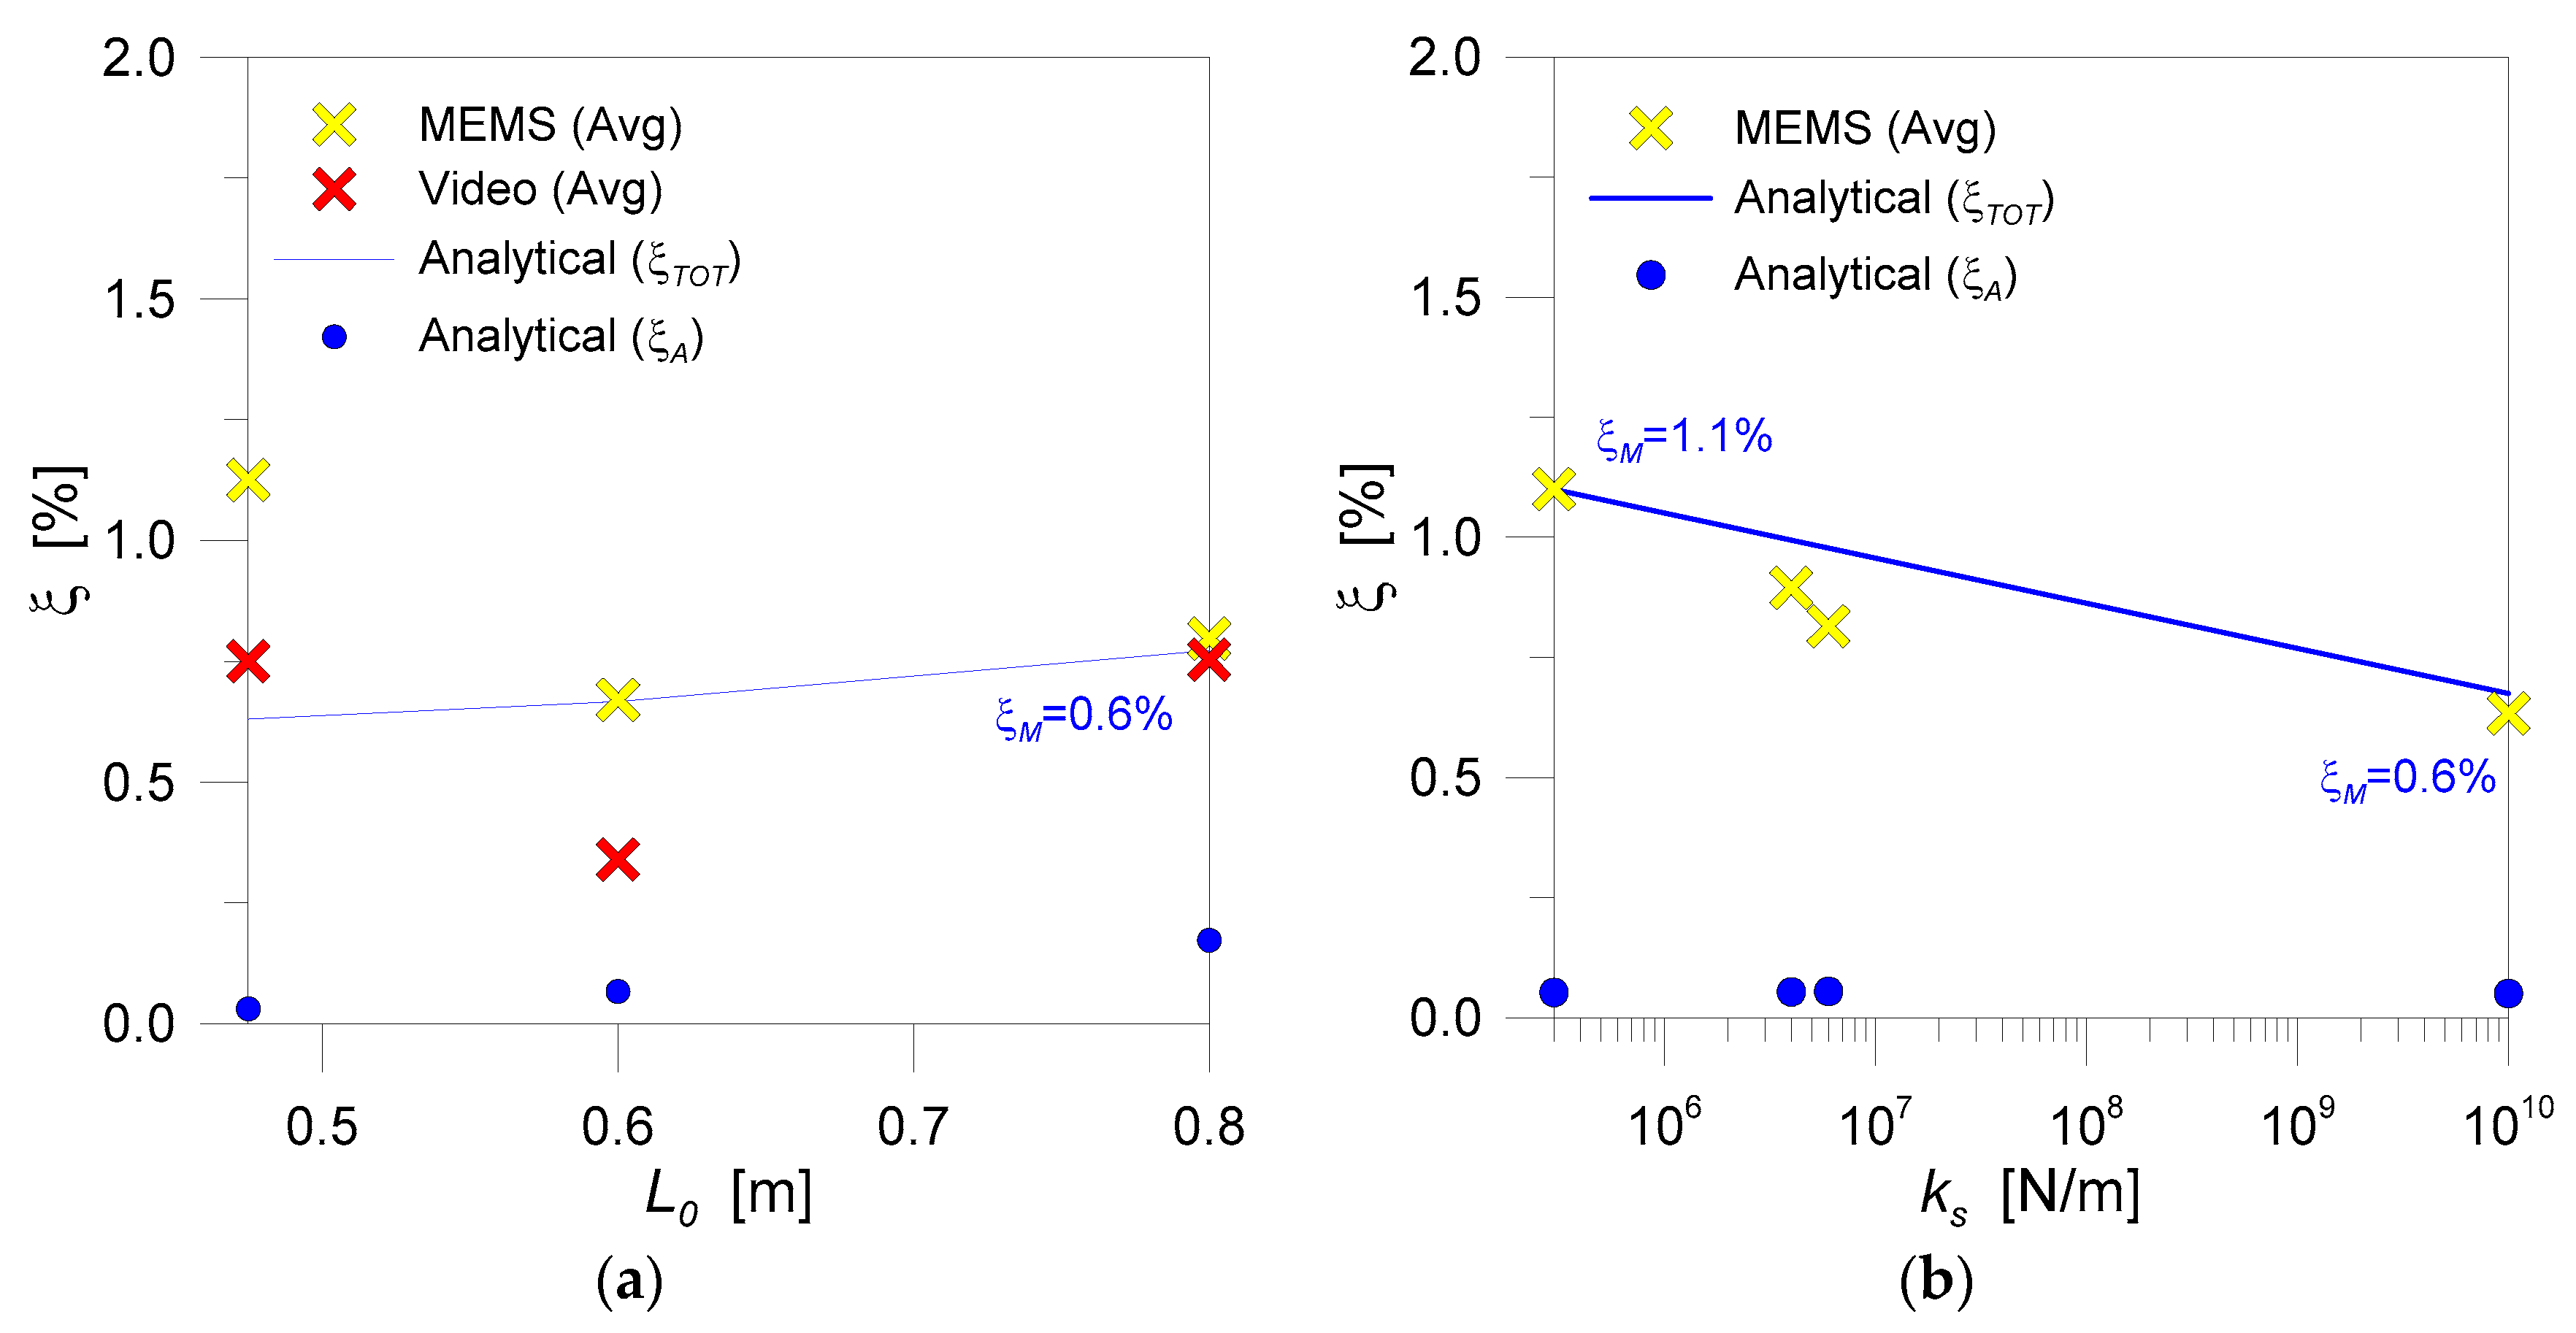
In Figure 13, the so derived analytical estimations are compared with the collected mean experimental damping results, with evidence of the analytically estimated ξA and ξM terms, with respect to the total ξ values.
There, based on Equation (23), the analytical estimates for ξA were carried out by considering the mean experimental frequencies, the nominal mass m, and the mean thickness t of each glass sample, together with the corresponding average velocity of vibration. This latter value was calculated as the mean speed experimentally derived for each tested configuration, for both the cantilever and beam samples. Such a kind of analytical estimation generally resulted, as expected for the selected test setup configurations, in mostly negligible aeroelastic effects, typically in the order of ξA ≈ 0.05% for both the C-type and B-type specimens (up to a maximum of 0.17%, for the cantilever samples with maximum span (L0 = 0.8 m)).
Worth of interest that in Figure 13a,b the analytically estimated material damping component (ξM) is also emphasized for each specimen. More in detail, given a test sample and its total experimental damping ratio (ξ = ξTOT), ξM was roughly analytically estimated as the difference between ξTOT (from the tests) and ξA (Equation (23)), to match the total experimental damping results.
For the C-type samples, for example, a relatively small ξM ≈ 0.6% fitting value was calculated for C-1 and C-2 samples, to suggest a minimum effect due to rigid clamps. Accordingly, the B-type samples highlighted that as far as the flexibility of supports increases, a progressively higher material damping contribution can be expected, with respect to a relatively small aeroelastic term, see Figure 13b. Worth of interest that for the beam specimens with rigid steel supports a material term ξM ≈ 0.6% was calculated, hence in close correlation with C-type results. At the same time, when the stiffness of supports decreases in Figure 13b, material damping contributions due to soft layers can be estimated up to a maximum of ξM ≈ 1.1 %.
5. Summary and Conclusions
In this paper, a preliminary dynamic characterization of glass elements was carried out, based on OMA techniques, analytical estimations, FE numerical analyses and video-tracking approaches.
Compared to past efforts available in the literature—mainly related to the dynamic performance of LG components inclusive of viscoelastic effects due to the interlayers in use—careful consideration was spent in this study for the assessment of frequency and damping sensitivity to boundary conditions. To this aim, the additional uncertainties due to possible viscous interlayers were avoided, by investigating simple monolithic glass panels under different restraint configurations. Such an exploratory analysis must be intended, in this regard, as a first step outcome of an ongoing research study. Through the experimental analysis herein discussed, the reliability of video-recording tracking-based approaches for the dynamic identification and structural health monitoring of building systems and components was also partly explored. With respect to the boundary configuration of all the tested samples, it was shown via vibration experiments and parametric FE analyses that the fundamental frequency can be markedly sensitive to variations in the ideal axial and rotational stiffness of restraints. Dedicated studies are hence required for real design applications, where the use of soft layers, gaskets, spacers, etc., is a common practice. In addition, the collected test estimations resulted in mostly linear variations of the calculated damping ratios, with respect to the fundamental frequency of the tested samples, as well as with respect to the axial stiffness of supports. In this regard, simple fitting curves were presented, for a quick preliminary calculation of the key dynamic parameters of interest for design. As a valid alternative for preliminary damping estimates, a semi-analytical approach was also recalled, giving evidence of the actual role of material and aeroelastic damping contributions for the tested glass samples.
Video-tracker-based techniques, in conclusion, proved to offer a certain potential for the dynamic investigation and identification of simple structural systems (i.e., structural components or details). For the cantilever samples with rigid clamps, for example, video-based frequency estimations resulted in an average scatter of 2%, with respect to classical analytical calculations or refined numerical models. On the other hand, the so collected results gave evidence of the limitations of such a technique, being highly sensitive to several setup parameters and assumptions, hence resulting in potential unsafe predictions.
Author Contributions
This paper results from a joint collaboration of the involved authors.
Funding
This research study is financially supported by the “INVERSE” project—“Experimental and numerical dynamic identification of structural glass elements” (“Università degli Studi di Trieste—Finanziamento di Ateneo per progetti di ricerca scientifica—FRA2016-BEDON grant”).
Acknowledgments
Ing. Enrico Bergamo, Ing. Cristina Rossi and Ing. Franco Trevisan (UniTS, DIA) are gratefully acknowledged for providing the MEMS instruments and for offering their valuable technical support during the test measurements and post-processing of data. Serex Multivitrum (Alviero Seretti) is also acknowledged for providing the glass samples.
Conflicts of Interest
The authors declare no conflicts of interest.
References
- Haldimann, M.; Luible, A.; Overend, M. Structural Use of Glass; IABSE: Zurich, Switzerland, 2008; ISBN 978-3-85748-119-2. [Google Scholar]
- Abeln, B.; Rajcic, V.; Hoegner, H.; Feldmann, M.; Neugebauer, J.; Langosch, K.; Dimova, S.; Pinto, A.V.; Siebert, G.; Kasper, R.; et al. Guidance for European Structural Design of Glass Components—Support to the Implementation, Harmonization and Further Development of the Eurocodes; Report EUR 26439; Dimova, S., Pinto, A.V., Feldmann, M., Denton, S., Eds.; Joint Research Centre-Institute for the Protection and Security of the Citizen: Ispra, Italy, 2014. [Google Scholar]
- CNR-DT 210/2013. Istruzioni per la Progettazione. l’Esecuzione ed il Controllo di Costruzioni con Elementi Strutturali in Vetro; National Research Council (CNR): Roma, Italy, 2013. (In Italian)
- Larcher, M.; Arrigoni, M.; Bedon, C.; van Doormaal, J.C.A.M.; Haberacker, C.; Hüsken, G.; Millon, O.; Saarenheimo, A.; Solomos, G.; Thamie, L.; et al. Design of blast-loaded glazing windows and facades: A review of essential requirements towards standardization. Adv. Civ. Eng. 2016, 2016, 2604232. [Google Scholar] [CrossRef]
- Bedon, C.; Kalamar, R.; Eliasova, M. Low velocity impact performance investigation on square hollow glass columns via full-scale experiments and Finite Element analyses. Compos. Struct. 2017, 182, 311–325. [Google Scholar] [CrossRef]
- Biolzi, L.; Bonati, A.; Cattaneo, S. Laminated glass cantilevered plates under static and impact loading. Adv. Civ. Eng. 2018, 2018, 7874618. [Google Scholar] [CrossRef]
- Nehme, K.; Nehme, S.G.; Jakab, A. Impact behaviour of glass balustrades. In Proceedings of the Glass Performance Days 2015, Tampere, Finland, 24–26 June 2015; pp. 350–355. [Google Scholar]
- Lago, A.; Sullivan, T.J. A Review of Glass Facade Systems and Research into the Seismic Design of Frameless Glass Facades; ROSE Research Report 2011/11; IUSS Press: Pavia, Italy, 2011; ISBN 978-88-6198-059-4. [Google Scholar]
- Santos, F.; Cismasiu, C.; Bedon, C. Smart glazed cable facade subjected to a blast loading. Struct. Build. 2016, 169, 223–232. [Google Scholar] [CrossRef]
- Ramos, A.; Pelayo, F.; Lamela, M.J.; Canteli, A.F.; Huerta, C.; Acios, A.P. Evaluation of damping properties of structural glass panes under impact loading. In COST Action TU0905 Mid-term Conference on Structural Glass; CRC Press: Boca Raton, FL, USA, 2013; ISBN 978-1-138-00044-5. [Google Scholar]
- Feng, Q.; Fan, L.; Huo, L.; Song, G. Vibration reduction of an existing glass window through a viscoelastic material-based retrofit. Appl. Sci. 2018, 8, 1061. [Google Scholar] [CrossRef]
- Bedon, C.; Amadio, C. Numerical assessment of vibration control systems for multi-hazard design and mitigation of glass curtain walls. J. Build. Eng. 2018, 15, 1–13. [Google Scholar] [CrossRef]
- Larcher, M.; Manara, G. Influence of Air Damping on Structures Especially Glass; JRC 57330 Technical Note; European Commission, Joint Research Centre—Institute for the Protection and Security of the Citizen: Ispra, Italy, 2010. [Google Scholar]
- Feng, R.-Q.; Zhang, L.L.; Wu, Y.; Shen, S.-Z. Dynamic performance of cable net facades. J. Constr. Steel Res. 2009, 65, 2217–2227. [Google Scholar] [CrossRef]
- Ranieri, C.; Fabbrocino, G. Operational Modal Analysis of Civil Engineering Structures: An Introduction and Guide for Applications; Springer: New York, NY, USA, 2014. [Google Scholar]
- Callewaert, D.; Belis, J.; Vanderbroek, M.; van Impe, R. Spontaneous failure of a passable laminated glass floor element. Eng. Fail. Anal. 2011, 18, 1889–1899. [Google Scholar] [CrossRef]
- Overend, M.; de Gaetano, S.; Haldimann, M. Diagnostic interpretation of glass failure. Struct. Eng. Int. 2007, 17, 151–158. [Google Scholar] [CrossRef]
- Koutsawa, Y.; Daya, E.M. Static and free vibration analysis of laminated glass beam on viscoelastic supports. Int. J. Solids Struct. 2007, 44, 8735–8750. [Google Scholar] [CrossRef] [Green Version]
- ABAQUS Computer Software v. 6.14, Dassault Systémes: Providence, RI, USA, 2017.
- Clough, R.W.; Penzien, J. Dynamics of structures; McGraw-Hill: New York, NY, USA, 1993; ISBN 0-07-011394-7. [Google Scholar]
- Tracker—Video Analysis and Modeling Tool. 2018. Available online: http://physlets.org/tracker (accessed on 12 December 2018).
- Lenci, S.; Consolini, L.; Clementi, F. On the experimental determination of dynamical properties of laminated glass. Ann. Solid Struct. Mech. 2015, 7, 27–43. [Google Scholar] [CrossRef]
- EN 12660. Glass in Building–Pendulum Test—Impact Test Method and Classification for Flat Glass; European Committee for Standardization (CEN): Brussels, Belgium, 2002.
- Lenk, P.; Coult, G. Damping of glass structures and components. In Challenging Glass 2—Conference on Architectural and Structural Applications of Glass; TU Delft: Delft, The Netherlands, 2010; Available online: https://journals.open.tudelft.nl/index.php/cgc/article/view/2422 (accessed on 12 December 2018).
- Pelayo, F.; Lopez-Aenlle, M. Natural frequencies and damping ratios of multi-layered laminated glass beams using a dynamic effective thickness. J. Sandw. Struct. Mater. 2017. [Google Scholar] [CrossRef]
- Zemanova, A.; Zeman, J.; Janda, T.; Schmidt, J.; Sejnoha, M. On modal analysis of laminated glass: Usability of simplified methods and Enhanced Effective Thickness. Compos. Part B Eng. 2018, 151, 92–105. [Google Scholar] [CrossRef] [Green Version]
- Bloss, B.; Rao, M.D. Measurement of damping in structures by the Power Input Method. Exp. Tech. 2006, 26, 30–32. [Google Scholar] [CrossRef]
- Barredo, J.; Soriano, M.; Gomez, M.S.; Hermanns, L. Viscoelastic vibration damping identification methods—Application to laminated glass. Procedia Eng. 2011, 10, 3208–3213. [Google Scholar] [CrossRef]
- Huang, Z.; Xie, M.; Du, J.Z.Y.; Song, H.-K. Rapid evaluation of safety-state in hidden-frame supported glass curtain walls using remote vibration measurements. J. Build. Eng. 2018, 19, 91–97. [Google Scholar] [CrossRef]
- Hong, X.; Liu, Y.; Liufu, Y.; Lin, P. Debonding detection in hidden frame supported glass curtain walls using the nonlinear ultrasonic modulation method with piezoceramic transducers. Sensors 2018, 18, 2094. [Google Scholar] [CrossRef]
- Brincker, R. Some elements of Operational Modal Analysis. Shock Vib. 2014, 2014, 325839. [Google Scholar] [CrossRef]
- Olowitz, E.; Brandt, A. Damping estimation from Operational and Experimental Modal Analysis on a laboratory test plate. In Proceedings of the IOMAC 2015—6th International Operational Modal Analysis Conference, Gijon, Spain, 12–14 May 2015; pp. 305–318. [Google Scholar]
- Bedon, C.; Amadio, C. Buckling analysis and design proposal for 2-side supported double Insulated Glass Units (IGUs) in compression. Eng. Struct. 2018, 168, 23–34. [Google Scholar] [CrossRef]
- Bedon, C.; Bergamo, E.; Izzi, M.; Noè, S. Prototyping and Validation of MEMS Accelerometers for Structural Health Monitoring—The Case Study of the Pietratagliata Cable-Stayed Bridge. J. Sens. Actuator Netw. 2018, 7, 30. [Google Scholar] [CrossRef]
- SMIT. Structural Modal Identification Toolsuite. 2018. Available online: http://smit.atlss.lehigh.edu (accessed on 12 December 2018).
- ISO 16293-2:2017. Glass in Building—Basic Soda Lime Silicate Glass Products—Part 2: Float Glass; International Organization for Standardization: Geneva, Switzerland, 2017.
- Laws, P.; Pfister, H. Using digital video analysis in introductory mechanics projects. Phys. Teach. 1998, 36, 282–287. [Google Scholar] [CrossRef]
- Mas, D.; Espinosa, J.; Perez, J.; Illueca, C.; Ferrer, B.; Roig, A.B. High speed imaging and algorithms for non-invasive vibrations measurements. In Proceedings of the EVACES 2011—Experimental Vibration Analysis for Civil Engineering Structures, Varenna, Italy, 3–5 October 2011; pp. 531–538. [Google Scholar]
- Anissofira, A.; Latief, F.D.E.; Kholida, L.; Sinaga, P. Newton’s cradle experiment using video tracking analysis with multiple representation approach. IOP Conf. Ser. J. 2017, 895. [Google Scholar] [CrossRef]
- Brown, D.; Cox, A.J. Innovative uses of video analysis. Phys. Teach. 2009, 47. [Google Scholar] [CrossRef]
- Yang, Y.; Dorn, C.; Mancini, T.; Talken, Z.; Nagarajaiah, S.; Kenyon, G.; Farrar, C.; Mascarenas, D. Blind identification of full-field vibration modes of output-only structures from uniformly-sampled, possibly temporally-aliased (sub-Nyquist), video measurements. J. Sound Vib. 2017, 390, 232–256. [Google Scholar] [CrossRef]
- Patil, K.; Srivastava, V.; Baqersad, J. A multi-view optical technique to obtain mode shapes of structures. Measurement 2018, 122, 358–367. [Google Scholar] [CrossRef]
- Diamond, D.H.; Heyns, P.S.; Oberholster, A.J. Accuracy evaluation of sub-pixel structural vibration measurements through optical flow analysis of a video sequence. Measurement 2017, 95, 166–172. [Google Scholar] [CrossRef]
- Wu, L.-J.; Casciati, F.; Casciati, S. Dynamic testing of a laboratory model via vision-based sensing. Eng. Struct. 2014, 60, 113–125. [Google Scholar] [CrossRef]
- Chen, J.G.; Wadhwa, N.; Cha, Y.-J.; Durand, F.; Freeman, W.T.; Buyukozturk, O. Modal identification of simple structures with high-speed video using motion magnification. J. Sound Vib. 2015, 345, 58–71. [Google Scholar] [CrossRef]
- Chang, M.; Leonard, R.L.; Pakzad, S.N. SMIT User’s Guide. Release 1.0. 2012. Available online: http://smit.atlss.lehigh.edu/wp-content/uploads/2012/07/SMIT-Users-Guide.pdf (accessed on 12 December 2018).
- Chang, M.; Pakzad, S.N. Observer Kalman Filter Identification for Output-Only Systems Using Interactive Structural Modal Identification Toolsuite. J. Bridge Eng. 2014, 19, 04014002. [Google Scholar] [CrossRef]
- Bedon, C.; Amadio, C. Exploratory numerical analysis of two-way straight cable-net facades subjected to air blast loads. Eng. Struct. 2014, 79, 276–289. [Google Scholar] [CrossRef]
Figure 1.
Examples of typical restraints for structural glass applications in buildings. (a) Beam-to-roof adhesive joint within a glass canopy (detail); (b) simply supported glass walkway (with dislodged mechanical restraints); (c) clamped glass balustrade; (d) mathematical model of a laminated glass beam with viscoelastic supports (picture reproduced from [18], with permission from Elsevier—copyright license number 4486030094766 (December 2018)).

Figure 2.
(a) Reference test setup (dimensions in mm) and (b) key control points for the tested glass panels, with (c) view of the soft layers in use and (d) example of a typical support detail for a beam-like specimen (hard rubber).
Figure 2.
(a) Reference test setup (dimensions in mm) and (b) key control points for the tested glass panels, with (c) view of the soft layers in use and (d) example of a typical support detail for a beam-like specimen (hard rubber).

Figure 3.
Preliminary measurements on the real thickness of the tested glass panels.

Figure 4.
Acquisition of vibration test measurements. (a) Example of acceleration-time history by MEMS devices, and (b,c) based on Tracker video recording.
Figure 4.
Acquisition of vibration test measurements. (a) Example of acceleration-time history by MEMS devices, and (b,c) based on Tracker video recording.

Figure 5.
Experimentally derived dynamic parameters for the tested glass specimens: (a) fundamental frequency, (b) modal damping and reference vibration shape (example referred to a B-1 sample with “rigid” steel supports).
Figure 5.
Experimentally derived dynamic parameters for the tested glass specimens: (a) fundamental frequency, (b) modal damping and reference vibration shape (example referred to a B-1 sample with “rigid” steel supports).

Figure 6.
Numerically derived fundamental frequency for the tested glass specimens (ABAQUS): (a) typical FE model and (b) normalized vibration shape (example referred to a B-1 sample with “rigid” steel supports).
Figure 6.
Numerically derived fundamental frequency for the tested glass specimens (ABAQUS): (a) typical FE model and (b) normalized vibration shape (example referred to a B-1 sample with “rigid” steel supports).

Figure 7.
Experimental and numerical fundamental frequencies for (a) cantilever and (b) beam specimens.
Figure 7.
Experimental and numerical fundamental frequencies for (a) cantilever and (b) beam specimens.

Figure 8.
Fundamental frequency variation for (a) cantilever (C-type) and (b) beam (B-type) glass specimens, as a function of the rotational (kc) and axial (ks) stiffness of restraints.
Figure 8.
Fundamental frequency variation for (a) cantilever (C-type) and (b) beam (B-type) glass specimens, as a function of the rotational (kc) and axial (ks) stiffness of restraints.

Figure 9.
Experimental results from Tracker video acquisition. (a) Detail of the test setup and tracker features, with (b) typical acceleration-time history.
Figure 9.
Experimental results from Tracker video acquisition. (a) Detail of the test setup and tracker features, with (b) typical acceleration-time history.

Figure 10.
Experimentally derived damping ratio ξ for the tested glass samples, as obtained from post-processing of (a) MEMS records and (b) video-camera acquisitions. Data referred to C-type samples.
Figure 10.
Experimentally derived damping ratio ξ for the tested glass samples, as obtained from post-processing of (a) MEMS records and (b) video-camera acquisitions. Data referred to C-type samples.

Figure 11.
Experimentally derived damping ratio ξ for the tested glass samples, as obtained from post-processing of MEMS records (B-type samples).
Figure 11.
Experimentally derived damping ratio ξ for the tested glass samples, as obtained from post-processing of MEMS records (B-type samples).

Figure 12.
Derivation of analytical fitting curves for the damping estimation of (a) cantilever and (b,c) beam-like monolithic glass samples.
Figure 12.
Derivation of analytical fitting curves for the damping estimation of (a) cantilever and (b,c) beam-like monolithic glass samples.

Figure 13.
Analytical estimation of the damping ratio ξ for (a) cantilever and (b) beam-like monolithic glass samples.
Figure 13.
Analytical estimation of the damping ratio ξ for (a) cantilever and (b) beam-like monolithic glass samples.


Table 1.
Cantilever and beam tested configurations.
| Specimen | Restraint | |||||
|---|---|---|---|---|---|---|
| Setup | Series | L0 [m] | Type | Material | ss [mm] | ks (Equation (7)) [N/m] |
| Cantilever | C-1 | 0.8 | Rigid | Steel | - | ∞ |
| C-2 | 0.6 | Rigid | Steel | - | ∞ | |
| C-3 | 0.475 | Rigid | Steel | - | ∞ | |
| Beam | B-1 | 0.95 | Rigid | Steel | - | ∞ |
| B-2 | 0.95 | Flexible | Hard rubber | 2 | 2 × 10⁷ | |
| B-3 | 0.95 | Flexible | Cork | 6 (3 × 2 mm layers) | 4 × 10⁶ | |
| B-4 | 0.95 | Flexible | Soft rubber | 20 | 3 × 10⁵ | |
Table 2.
Experimental (average of MEMS measurements), analytical and numerical prediction of fundamental frequencies.
Table 2.
Experimental (average of MEMS measurements), analytical and numerical prediction of fundamental frequencies.
| Specimen | Fundamental Frequency [Hz] | |||||
|---|---|---|---|---|---|---|
| Setup | Series | Support | MEMS (avg) | Analytical (Equation (8)) | FE (No MEMS) | FE (with MEMS) |
| Cantilever | C-1 | Steel | 6.859 | 7.826 | 7.889 | 7.102 |
| C-2 | Steel | 11.728 | 13.913 | 14.053 | 12.264 | |
| C-3 | Steel | 17.746 | 22.198 | 22.458 | 19.105 | |
| Beam | B-1 | Steel | 14.338 | 15.649 | 15.599 | 14.245 |
| B-2 | Hard rubber | 14.334 | - | 15.585 | 14.240 | |
| B-3 | Cork | 14.290 | - | 15.579 | 14.229 | |
| B-4 | Soft rubber | 14.081 | - | 15.325 | 14.013 | |
Table 3.
Fundamental frequencies of C-type samples, as derived from video-camera records.
| Specimen | f [Hz] | ∆ (Equation (10)) [%] | |||
|---|---|---|---|---|---|
| Series | Video (avg) | MEMS (avg) | Analytical (Equation (8)) | FE (No MEMS) | FE (with MEMS) |
| C-1 | 7.644 | 11.44 | −2.33 | −3.11 | 7.63 |
| C-2 | 13.668 | 16.54 | −1.76 | −2.74 | 11.45 |
| C-3 | 21.143 | 19.14 | −4.75 | −5.86 | 10.67 |
© 2019 by the authors. Licensee MDPI, Basel, Switzerland. This article is an open access article distributed under the terms and conditions of the Creative Commons Attribution (CC BY) license (http://creativecommons.org/licenses/by/4.0/).
Share and Cite
MDPI and ACS Style
Bedon, C.; Fasan, M.; Amadio, C. Vibration Analysis and Dynamic Characterization of Structural Glass Elements with Different Restraints Based on Operational Modal Analysis. Buildings 2019, 9, 13. https://doi.org/10.3390/buildings9010013
AMA Style
Bedon C, Fasan M, Amadio C. Vibration Analysis and Dynamic Characterization of Structural Glass Elements with Different Restraints Based on Operational Modal Analysis. Buildings. 2019; 9(1):13. https://doi.org/10.3390/buildings9010013
Chicago/Turabian StyleBedon, Chiara, Marco Fasan, and Claudio Amadio. 2019. "Vibration Analysis and Dynamic Characterization of Structural Glass Elements with Different Restraints Based on Operational Modal Analysis" Buildings 9, no. 1: 13. https://doi.org/10.3390/buildings9010013
Note that from the first issue of 2016, this journal uses article numbers instead of page numbers. See further details here.