The Effects of Product Consistency and Consumer Resistance to Innovation on Green Product Diffusion in China

School of Management, Northwestern Polytechnical University, Xi’an 710072, China
*
Authors to whom correspondence should be addressed.
Sustainability 2019, 11(9), 2702; https://doi.org/10.3390/su11092702
Submission received: 1 April 2019
/
Revised: 1 May 2019
/
Accepted: 1 May 2019
/
Published: 13 May 2019
(This article belongs to the Section Economic and Business Aspects of Sustainability)
Abstract
:As consumers are becoming concernedabout environmental sustainability, firms are motivated to develop green products that adopt sustainable innovation or materials. This study contributes to the existing literature by specifically examining how consumers react to a firm’s green product introduction (i.e., the diffusion process of the green product) based on two factors: the extent to which the new green product shares common characteristics with the existing product offerings and the extent to which customers are resistant to innovation. The findings suggest that when firms introduce green products to the market, they need to consider the product consistency between existing product offerings and the new green product as well as the consumer resistance to new innovation.
1. Introduction
As consumers increasingly develop environmental consciousness, firms begin to develop green products that offer sustainable environmental outcomes [1,2]. For example, many firms are offering recyclable packaging for the product offerings to reduce waste of materials [3]. In addition, green products that use recyclable materials and green innovations are becoming popular in the market. As Chang [4] suggests, “being green is a catalyst for continuous innovation, new market opportunity, and wealth creation”. Similarly, Chen [5] suggests that increasing market competition motivates firms to develop differentiation strategies to achieve competitive advantage and one of the most popular strategies used by managers is to increase the green or sustainability identity. As a result, consumers will develop a better corporate image of the company, which ultimately will contribute to a firm’s success [6].
Prior studies focusing on green product mainly focus on the green product development, new product diffusion and production innovations. Although many aspects of green product have been examined and investigated, previous studies still neglect two important factors. Specifically, though previous studies have shed lights on the drivers and the outcomes of green product development, few focus on the consumer resistance when introducing the green products to the market. First, although green products can offer significant benefits for environmental sustainability, they can involve significant risk as adopting green products may require consumers to spend time and energy to acquire the features of the green products. Thus, the extent to which the green product provides consistent characteristics may influence the diffusion of the new green product. In this study, product consistency refers to the compatibility between the existing product offering and the new green product, concerning end-use consistency, production consistency and distribution channel consistency [7]. In addition, the technology acceptance literature [8,9] suggests that though consumers tend to favor newer innovations over existing market offerings, they may still resist adopting green products if they are risk averse towards trying out new innovation or new technologies. Overall, to extend our understanding of the green product development, especially the potential adoption problems in this process, this study employs the classic Norton-Bass model [10] and investigates the following research questions:
- (1)
- Can the product consistency between the existing product offering and the new green product influence the diffusion of the green product?
- (2)
- Can consumers’ resistance to new innovation influence the diffusion of the green product?
This rest of this paper is organized as follows. First, we review the original Bass model and the Norton-Bass model. Second, we specify a proposed model considering consistency of products between the existing products and the green product and the resistance from consumers. Then, we empirically test the proposed model using data collected from two companies. Finally, we discuss the findings of this study and address the limitations by proposing opportunities for future studies.
2. Literature Review
In this section, we review previous studies that are related to green product development, new product diffusion, and production innovations. The three groups of literature have a close relationship with our studies. Furthermore, we critically evaluate their contributions and limits to present studies.
Specifically, in green product development, Liu, Gao, Yan and Ma [11] demonstrated that green food certified growers have higher cost than that of non-certified ones with surveyed data from Kiwifruit growers. Such results would provide guidance for optimizing green food product sustainable development. Chang, Chen, Luan, and Chen [12] extended the green product development literature by investigating how green organizational identity (GOI), green shared vision (GSV) affect organizational citizenship behavior for the environment (OCBE) and green product development performance (GPDP). They found that GOI and GSV have a positive impact on the OCBE and GPDP and the two variables have partially mediated effects on the relationship between GOI (and GSV) and GPDP, indicating that OCBE is critical to the companies. Generally, although previous studies paid much attention to examining the green product development, they focused mainly on a single generation of specific product and do not consider the successive generation products.
Comparatively, researchin new product diffusion has a long history. Studies have examined many types of models that depict the process of new product diffusion [10,13,14,15]. Recently, Janssen and Jager [16] presented a model that analyzes the introduction of green products. In their model, both consumers and firms were stimulated with different behavioral features. They found that the consumers and firms behavioral features have different impacts on the success of migrating from original products to green products. Olson [17] developed green innovation value chain (GIVC) as a frame for analyzing the future financial benefit of green products. Such frame includes the perspective of manufacturer, distributors, consumer, environment, and government and thus has better results. Bulte [18] analyzed the diffusion acceleration of new products. The results showed that economic conditions and demographic change significantly affect the diffusion speed of new products and almost all the differences in diffusion speed among the focal products are explainable.In sum, though previous studies have used many canonical models (e.g., classic NB model) to depict product diffusion process under various conditions, few have looked into the effects of two important factors that can potentially influence this process, i.e., the effect of consumer resistance to technology and the effect of product consistency.
Finally, with regard to production innovations research, Ilma, Bernard, Lin, Jacky, Yulia and Satria [19] compared the behavior intention on ecolabel product usage in developing and developed regions (Indonesia and Taiwan). Based on the extended theory of planned behavior, they concluded that the attitude is the key factor that determines the behavioral intention on ecolabel product usage in both Taiwan and Indonesia.Maccioni, Borgianni, and Basso [20] found that, although consumers required greater efforts in searching for related information about green products, consumers would still show remarkable interest for sustainability issue of the green products. In general, the extant studies on production innovations mainly focus on the consumer side of green production innovations, the production diffusion (especially the successive generation of product diffusion), the producer perspective are neglected. Thus, this study is helpful for expanding the production innovations studies.
3. Model Development
In this section, we first provide a brief overview of the basic Bass model [14] and the classic Norton and Bass model [15]. Then, we introduce our new model for predicting the process of green product diffusion based on the classic Norton-Bass model.
3.1. Basic Bass Model
Bass Model argues that when a new product is released to a market, the diffusion rate of the product is mainly determined by two factors: innovation and imitation [14,16]. Innovation influences the product diffusion process mainly through external sources, such as mass-media advertising. It reflects the explicit characteristics of a product, which are usually easy to be identified by consumers. Imitation, on the contrary, influences product diffusion through internal sources, e.g., word-of-mouth. It reflects some product features that are not easily identifiable by consumers, namely implicit characteristics.
According to the basic Bass model, first, let f(t) be the probability function of the ratio of the number of new buyers to the number of total potential buyers at time t; F(t) is the ratio of the number of accumulative total buyers to the number of total potential buyers at time t. p is the coefficient of innovation influence, q represents the influence of imitation, and it is assumed that p, q ∈ [0, 1]. Then the basic Bass Model can be specified as follows:
Next, let m represent the maximal market potential. n(t)indicates the increased number of buyers at time t, and N(t) indicates the accumulated number of buyers at time t. Then the model is specified as follows:
3.2. Classic Norton-Bass Model
Norton and Bass [13] propose a new NB Model that investigates the product diffusion under a condition in which a company launches a new product after the original product has already been sold on the market for a period of time. The NB model suggests that, if a company introduces a new product at t2, the accumulated sale volume of the two generations of products can be predicted as follows:
where, m1 indicates market potential capacity of the first generation of product; m2 indicates the increased market potential after launching the second generation of product. F1(t) is the ratio of the number of accumulated buyers to the number of all potential buyers for generation one at time t > 0; F2(t) is the ratio of the number of accumulated buyers to the number of all potential buyers for generation two at t > t2. N1(t) and N2(t) indicate the accumulated sale of generation one and two at time t, respectively. If t < t2, then . In this model, represents the substituted portion of generation one by generation two, which also indicates the increased sales of generation two excluded from the increases resulted by diffusion.
3.3. The Proposed New Model
Erkut [21,22] take the perspective of evolutionary economics and proposes a conceptual model that analyzes the process of how a new idea is formulated, turned into technological knowledge and finally casted a new market segment. The conceptual model includes four continuous dimensions that combine the neuroscience, cognition science, psychology, marketing knowledge, and product innovation.
The model provides foundations for our new model. Specifically, as Myers [23], Ram [24] and Cherrier, Black, and Lee [25] suggests, there are always a group of consumers who are not willing to adopt the new product or new innovations. As a result, they tend to be resistant to the change of new product generations. In this study, we consider such factors by including a new coefficient, , in the classic NB model. We then have the number of new adopters as follows:
The ratio of the number of accumulated buyers to the number of all potential buyers can be predicted using the following equation:
Product consistency also influences consumers’ perceived value of the new product introduction and thus influences the product diffusion process [7]. Specifically, in this study, we define product consistency as the extent to which the new green product offering will be connected to the existing product offering in terms of market targeting, production, and channel of distribution. In our model, we assume that the product consistency between the existing product offering and the new green product is a continuous variable, .
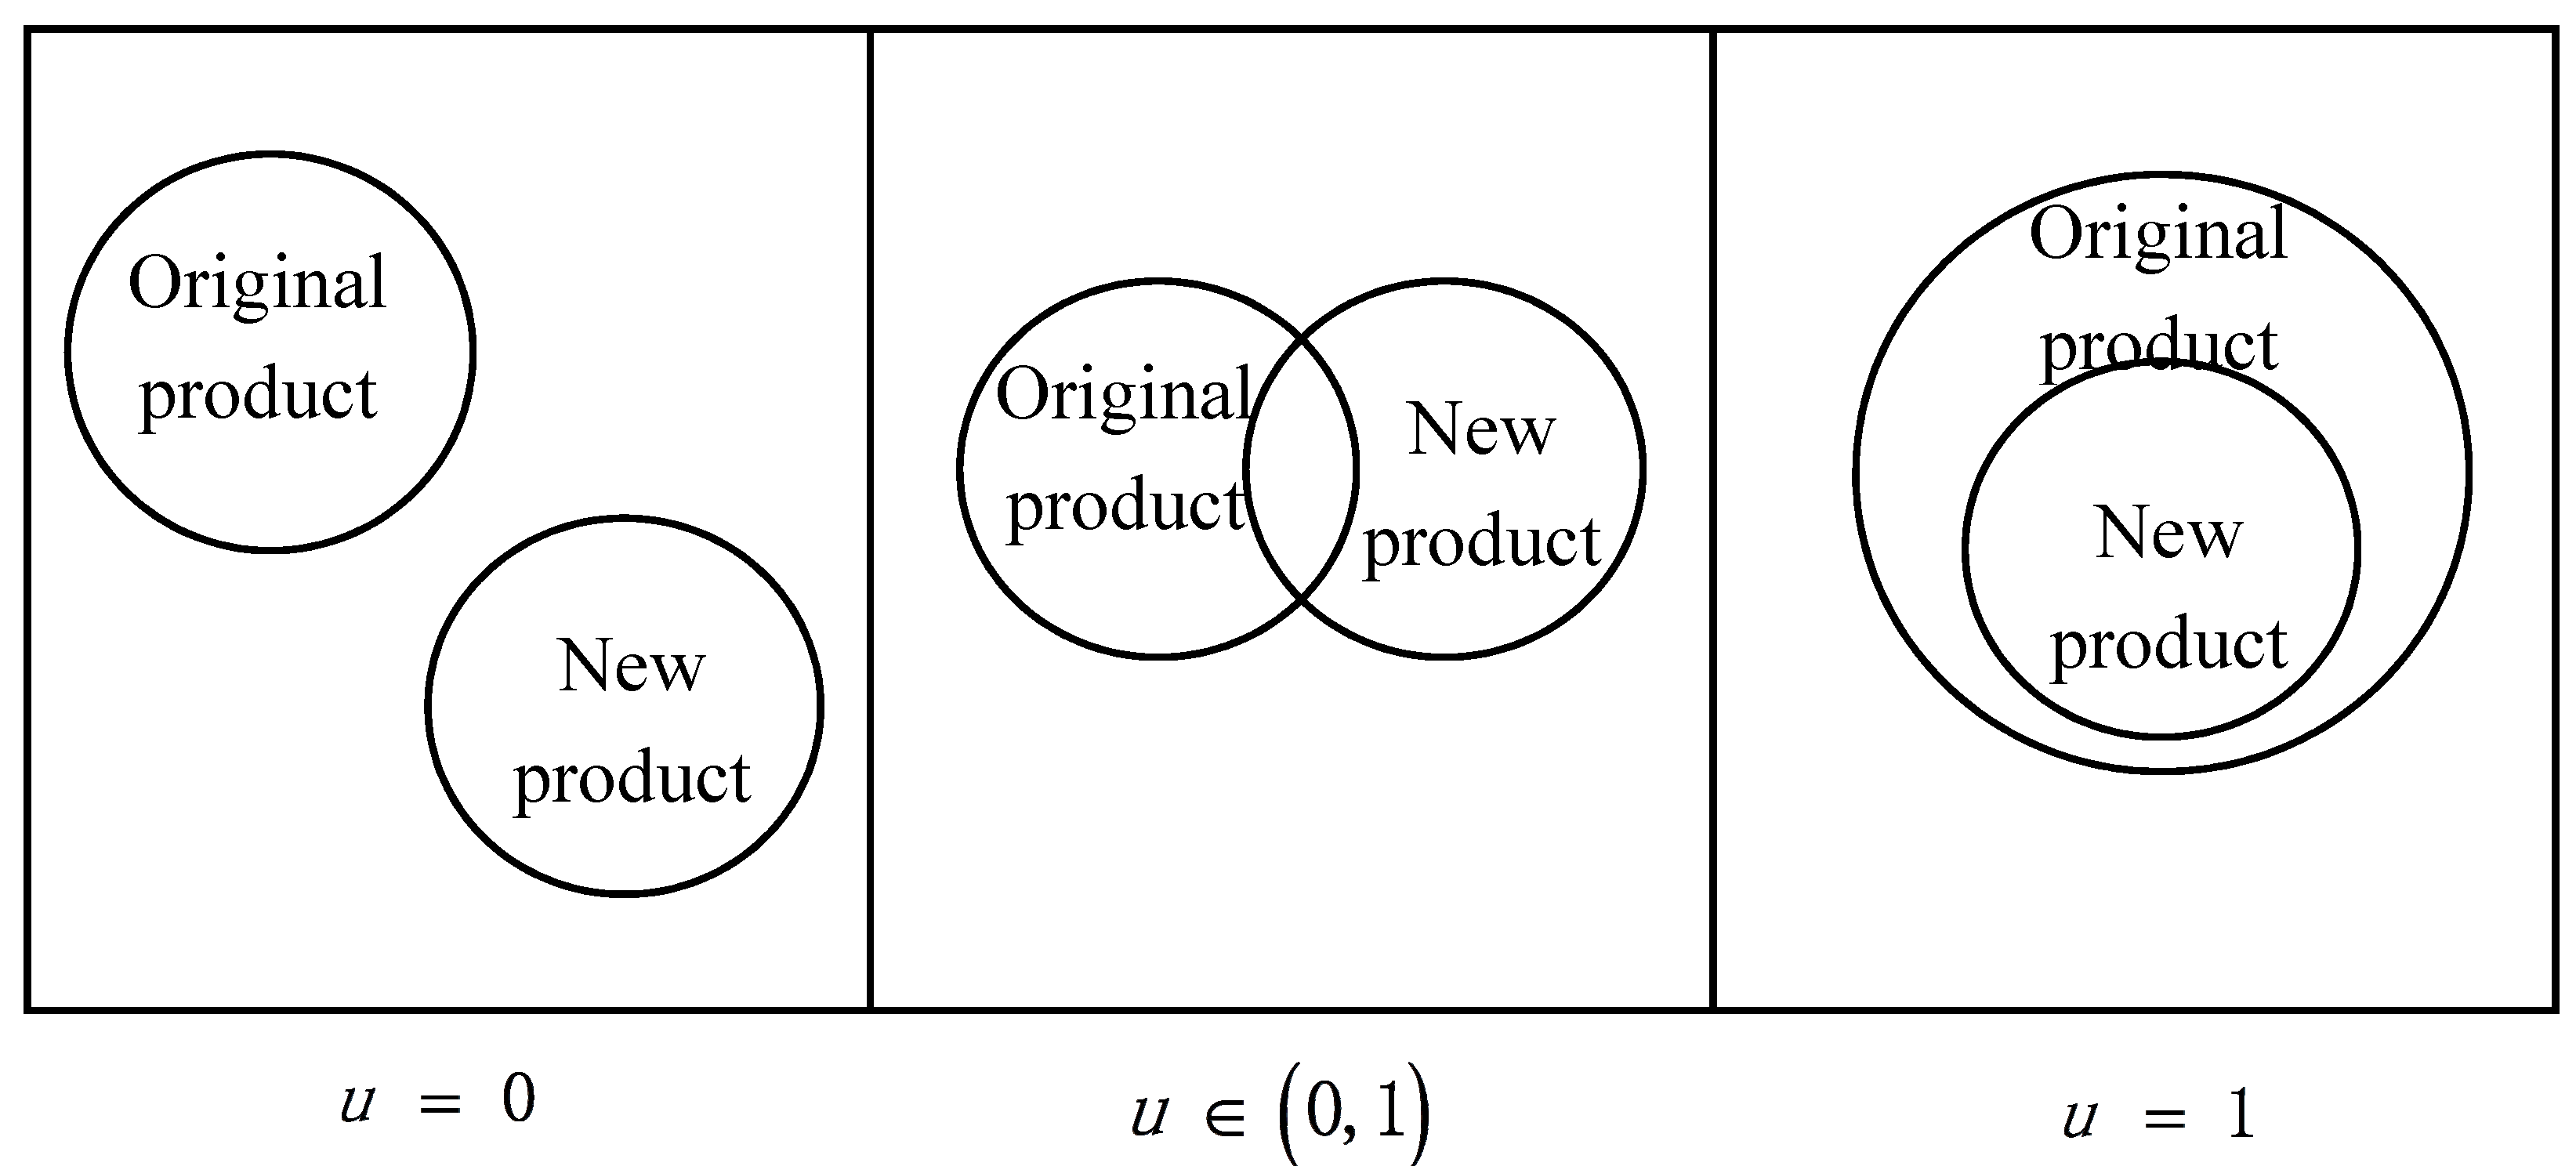
Due to different new product development strategies, the value of u could fall into three categories (see Figure 1). Specifically, first, u = 0. Under this condition, the new green product is completely different from the existing product offering, which suggests that the new green product will have a different target market, new production requirement, or new channel of distribution. Thus, there is no consistency between the two product offerings. As a result, the two products will have separate diffusion process. Second, 0 < u < 1. This condition suggests that some characteristicsof the new green product are inherited from the existing product. For example, the new green product may have similar function, or the same channel and OEM manufacture. Meanwhile, the two products also show some differences, such as sustainability of the materials used or slightly different target market. Under this condition, the performance of the new green product will influence the performance of existing product because they both use similar resources in the product diffusion process. Third, u = 1. Under this condition, there is no significant difference between the new green product and the existing product. In other words, there is no change in the target market, production, and channel of distribution. Thus, the diffusion of the new green product is also the substitution of the existing product, which is a typical research set in the classic NB model.
Given researchers have provided solutions for scenarios one and three (i.e., u = 0 and u = 1) in previous research, this study focuses on examining scenario two (i.e., 0 < u < 1), in which there is some consistency between the new green product and the existing product.
We specify the product consistency between the two products as follows:
where x1 is the product end usage consistency. Larger value of x1 indicates that the two products show more similar functionalities, which suggests that the target market for the two products is more likely to be the same. x2 reflects the product consistency in production, which involves the requirements for manufacture, technology, and materials. Thus, the larger the value of x2 is, the more possible it is for the new green product to replace the existing one because no further resources are required to produce the new green product. Finally, x3 indicates the consistency in channel of distributions. Larger x3 suggests that the new green product is more likely to choose the same channel of distribution as the old product does.
To model the product diffusion process considering both consumer resistance and product consistency, we make the following assumptions:
- A company sells a product on the market, then, it will introduce a green product offering to the market after a certain time of period (t > t0).
- Because the new green product is not completely replacing the existing product offering, thus, different from the classic NB model, our model does not require the influences of innovation, imitation, and consumer resistance are persistent. Specifically, p1 at time t0 is set not always equal to p1′ at time t. Similarly, q1 at time t0 is not always equal to q1′ at time t; α1 is not always equal to α2.
According to assumption 1, the substitution process of the new green product on the old product is a two-stage process: in the first stage, a company sells the old product. The performance of the old product can be predicted using the original Bass model. In the second stage, the company introduces the new green product to the market while they still offer old product. The performance of both the green product and the old product can be predicted using the NB model. Then, we suggest that there is some consistency between the old product and the new green product, thus, we add the product consistency, u, to the NB model. According to assumption 2, the ratio of the accumulated buyers to the total market potential, F1’(t), is the same as the value at t0, which is F1(t). Given F2(t) = 0 if t < t2, the performance of the two products can be predicted using the following model:
where, u ∈ [0,1]. In particular, when u = 0, the model examines the performance of two independent products while when u = 1, the model investigates the product performance of two similar products.
Based on the proposed model (Equations (8) and (9)), we present the following propositions:
Proposition 1.
As the product consistency between the existing product and the new green product increases, the remaining market potential for the existing product after the introduction of green product decreases.
Proposition 2.
As the consumer resistance to new technology/product increases, the growth rate of the green product will decrease. In particular, when the resistance to green product is greater than one of the existing product, the peak sales potential for the existing product will increase and will reach the peak point sooner, vice-versa.
4. Empirical Analyses
4.1. Study 1
In study 1, we collected sales data of two products in January 2018 from a manufacturer that produces and sells machinery and electronics equipment around China. We asked the sales manager of the manufacturer who was an MBA student to provide one-year sales data of two electrical-fire monitors (A and B) that had an inheritance relationship. Specifically, the manufacturer first launchedmonitor A (original product) in June 2015 to the market. After three months, in September 2015, it launched monitor B that uses more environmentally friendly materials to the market. Thus, monitor B is considered as an upgraded green one. The sales data of the two products is tracked until May 2016 (a total of 12 months).
In order to estimate the consistency between products A and B, we invited three professionals from this company to score the product consistency for these two products from three perspectives: end use, production and channel of distribution (1 to 10 with 1 = minimal consistency and 10 = maximum consistency). We then used the mean value of the estimates as the proposed value of product consistency for products A and B. The results suggest that the average estimated product consistency of A and B in the three aspects are as follows: x1 = 6.7, x2 = 8.2, and x3 = 9.5.
As the model assumes (assumption 1), in the first stage (0 < t < 3), the company only sells product A on the market. Based on the estimation by the professionals, we used the non-linear least squares to conduct parameter estimation for the sales volume of Product A in the first stage. The parameters are as follows: m1 = 45342.3, p1 = 0.0134, q1 = 0.5910, 1 = 0.0031, and the explained variance (R2) is 0.905. The results are acceptable. Substitute these parameters to Equation (8) and the diffusion performance of product A in the first stage is estimated as following:
In the second stage (t > t2 ≥ 3), the company sells both Product A and Product B. Using Equation (7), we obtained the product consistency between A and B (µ = 0.7017). We used the non-linear least squares to model the product diffusion of Product A and Product B in stage 2. For Product A, p1 and q1 are the same as their previous values. The parameters for Product B are estimated as follows: m2 = 59,620.8, p2 = 0.0234, q2 = 0.3691, 2 = 0.0021. Substitute these parameters into Equation (8), we get the explained variance for Product A, R2, as 0.842; for Product B, the explained variance is 0.993. All results are acceptable. Substitute the results into Equations (8) and (9), we get the diffusion model of Product A and Product B as follows:
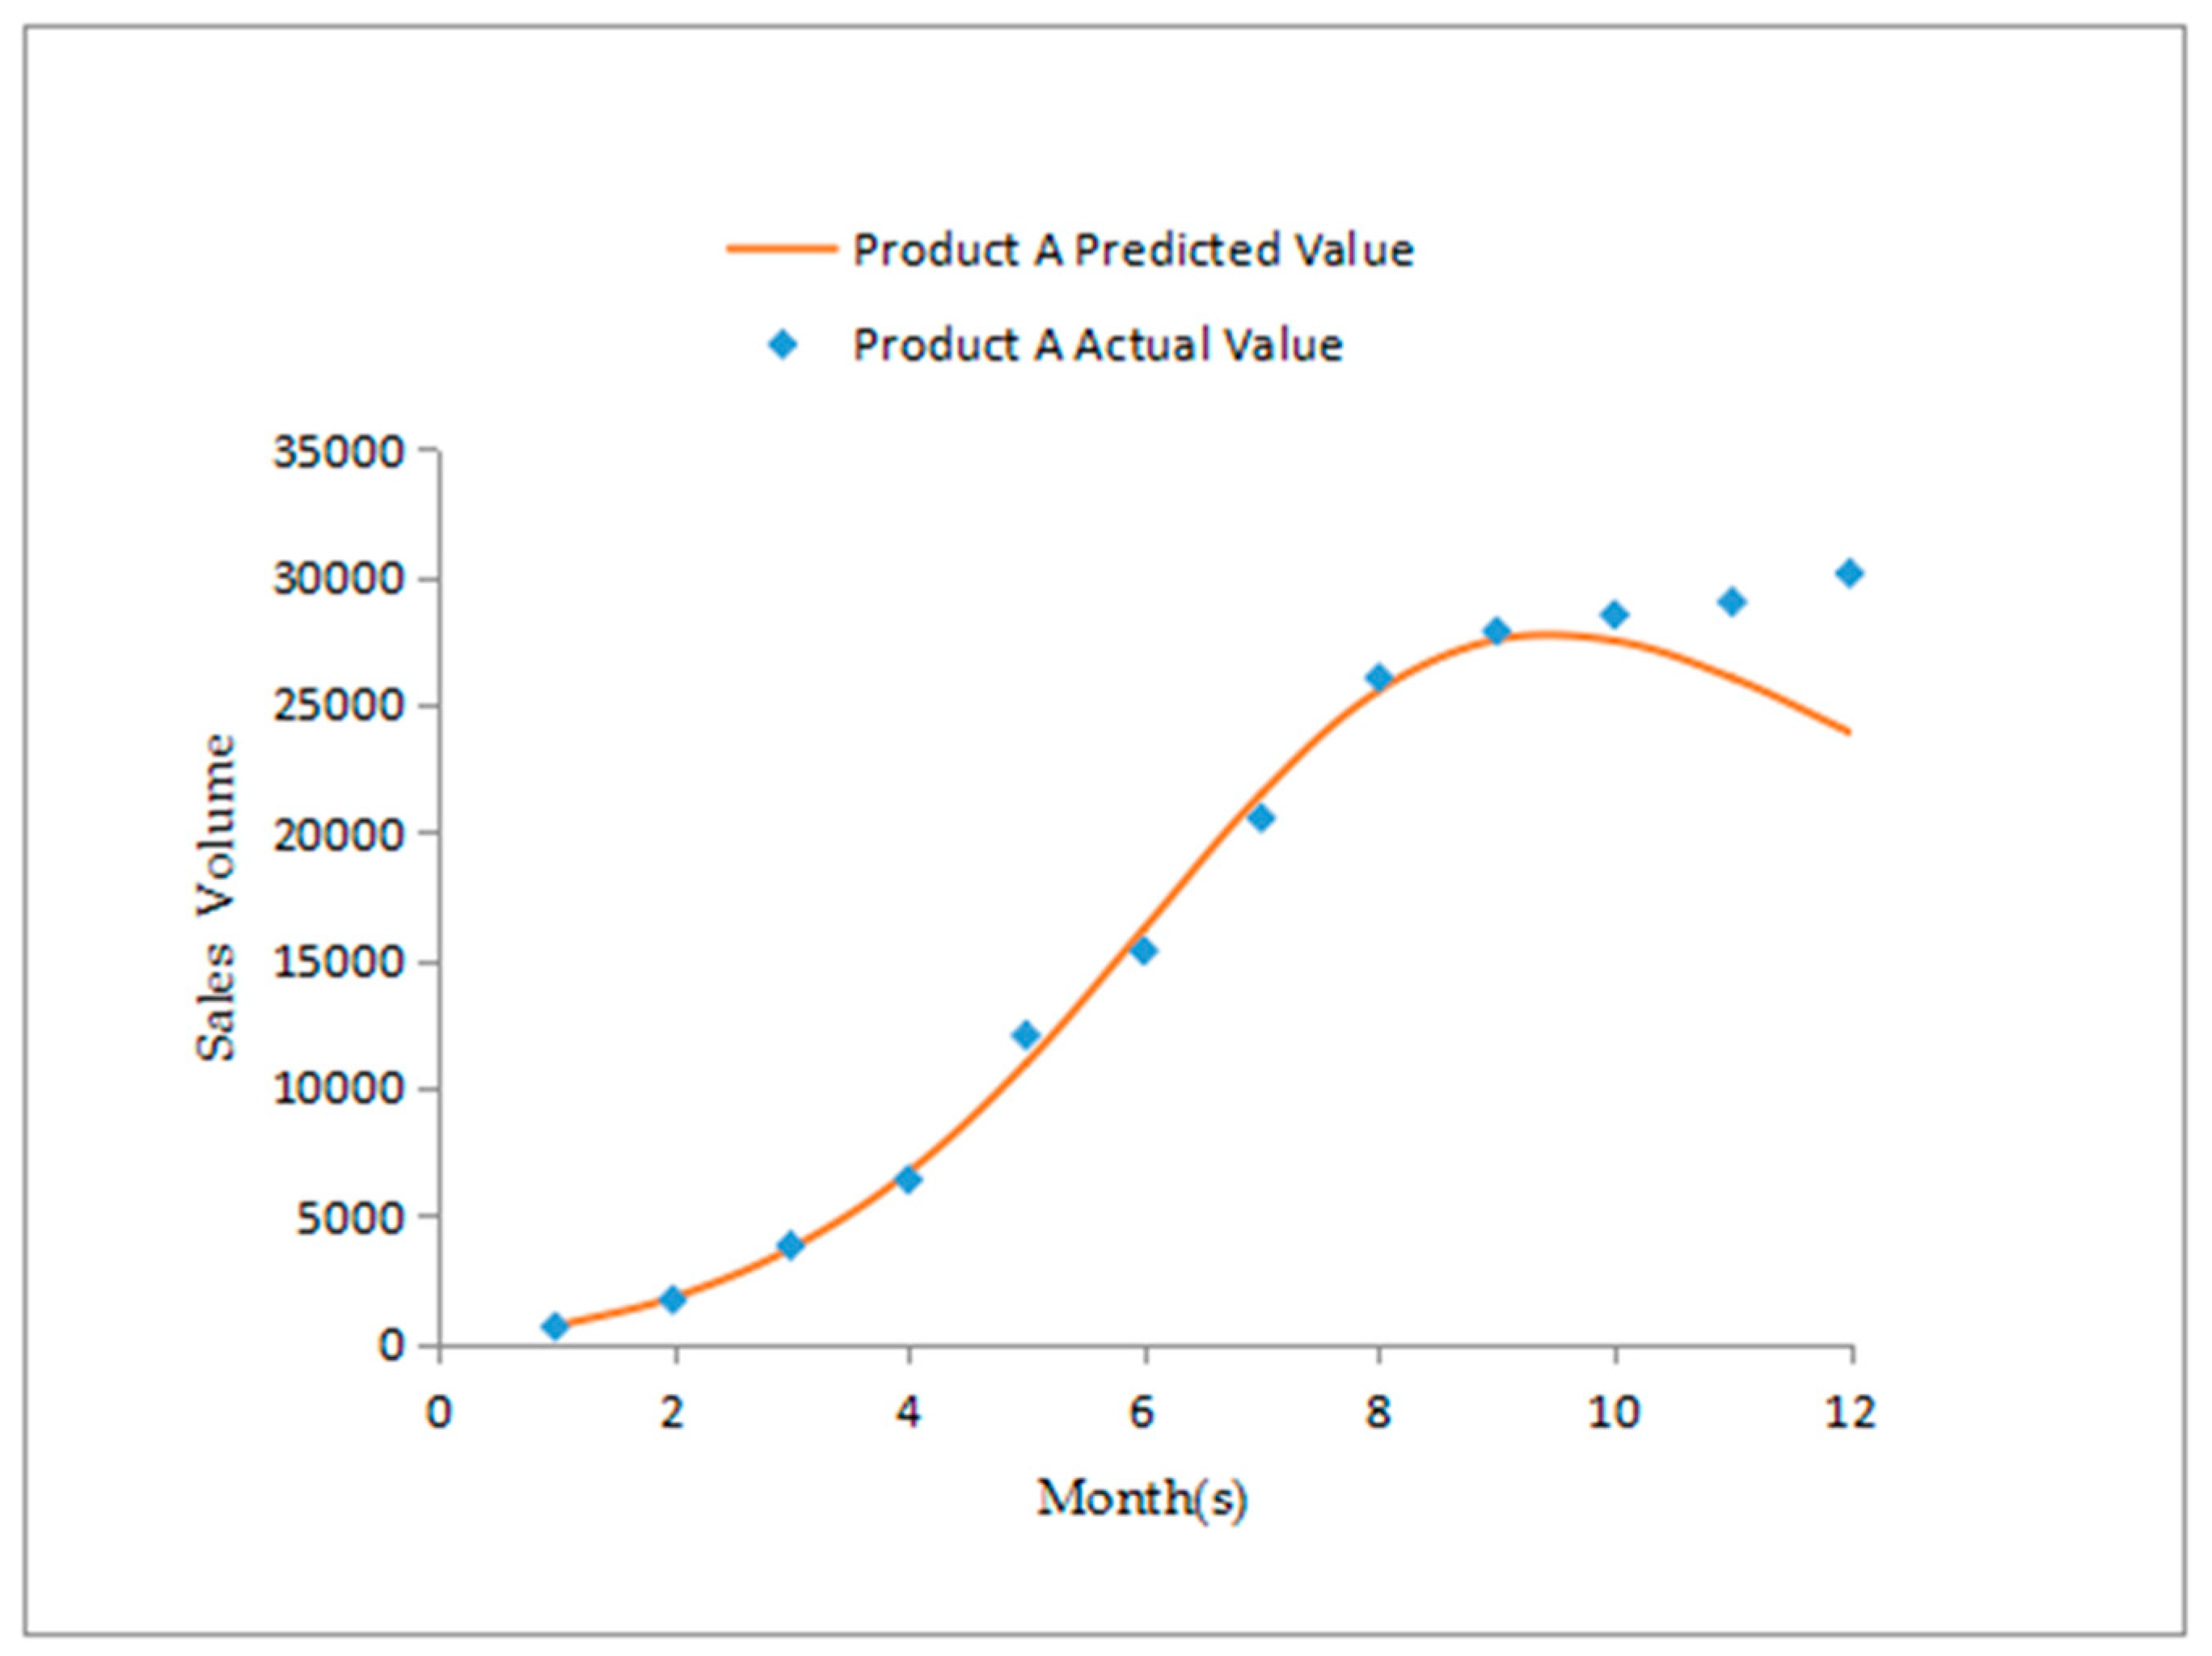
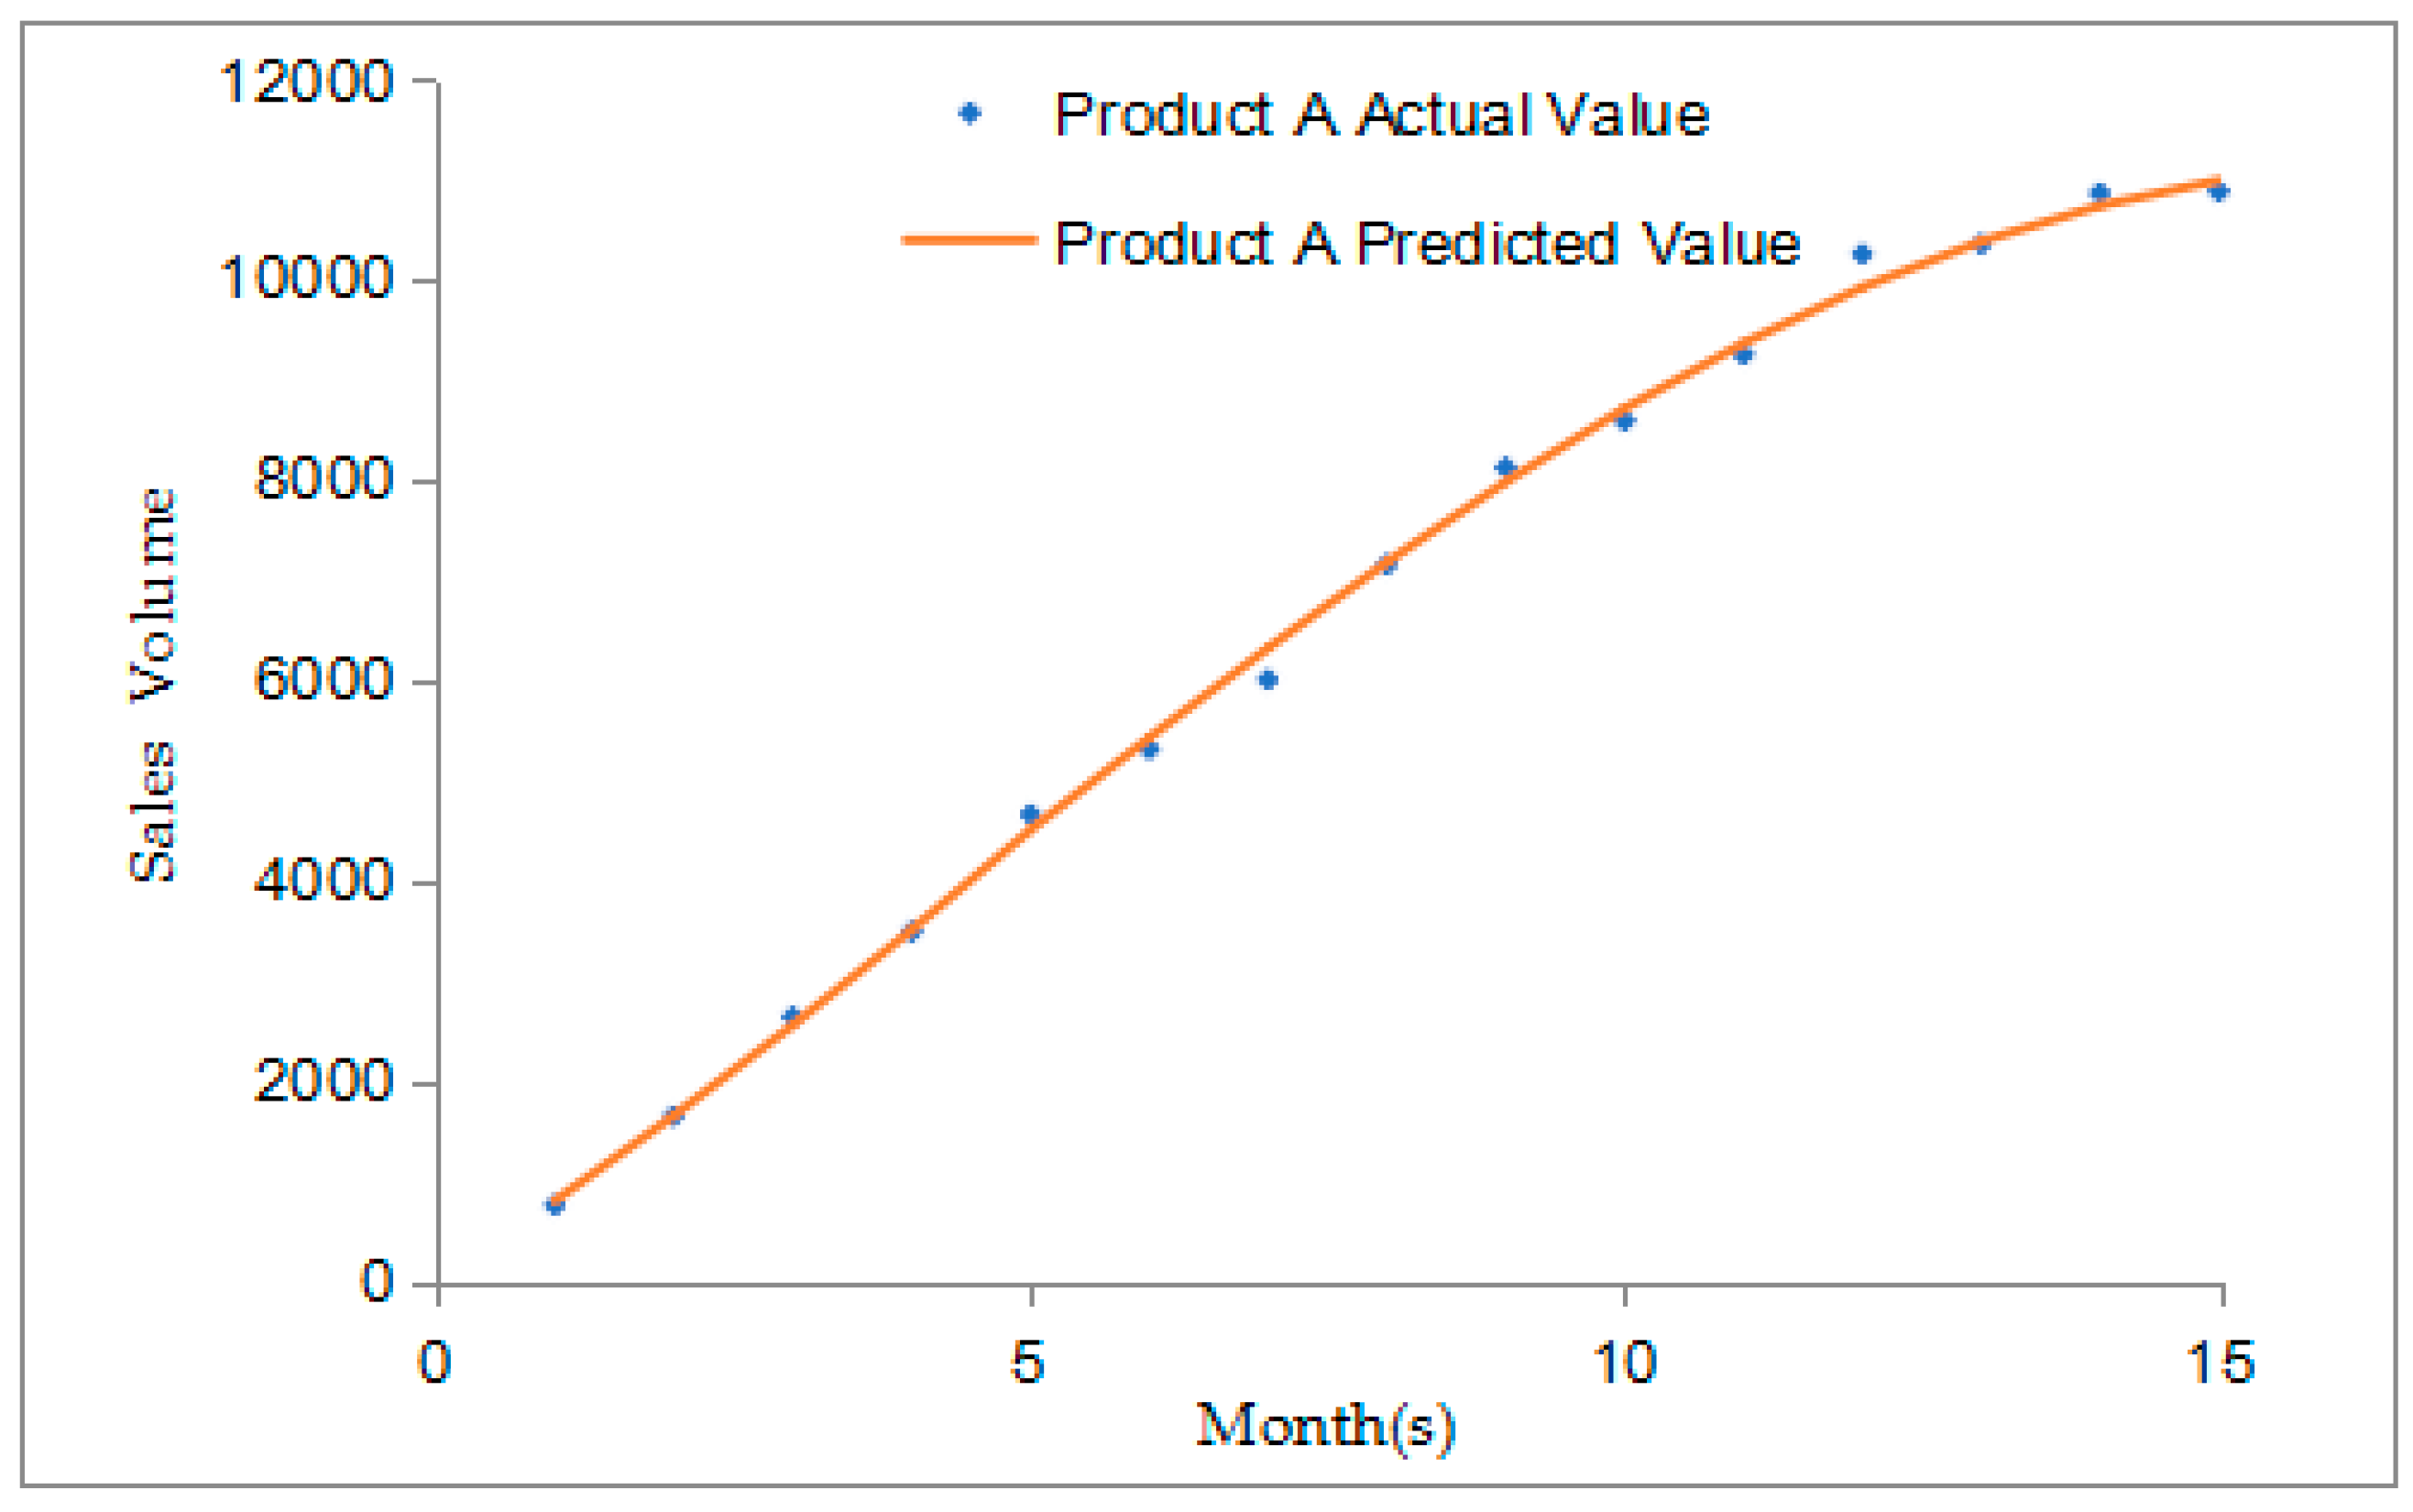
As shown in Figure 2, for Product A, the actual sales growth rate is consistent with the model prediction, which suggests that our model has good predicting power. In addition, the innovation coefficient is smaller than the imitation coefficient, which means that for Product A, the effect of imitation factors, such as word-of-mouth, is greater than that of innovation factors, such as advertising media, in the first stage of diffusion. The results also suggest that consumers’ resistance to technology has a negative influence on new product diffusion. However,1 < p1, 1 < q1, which suggests that the overall influence of consumers’ resistance on the diffusion of Product A is overcome by that of innovation and imitation. When t> 10, because the firm developed an overseas market for product A the data does not allow our model to accurately predict the diffusion of Product A.
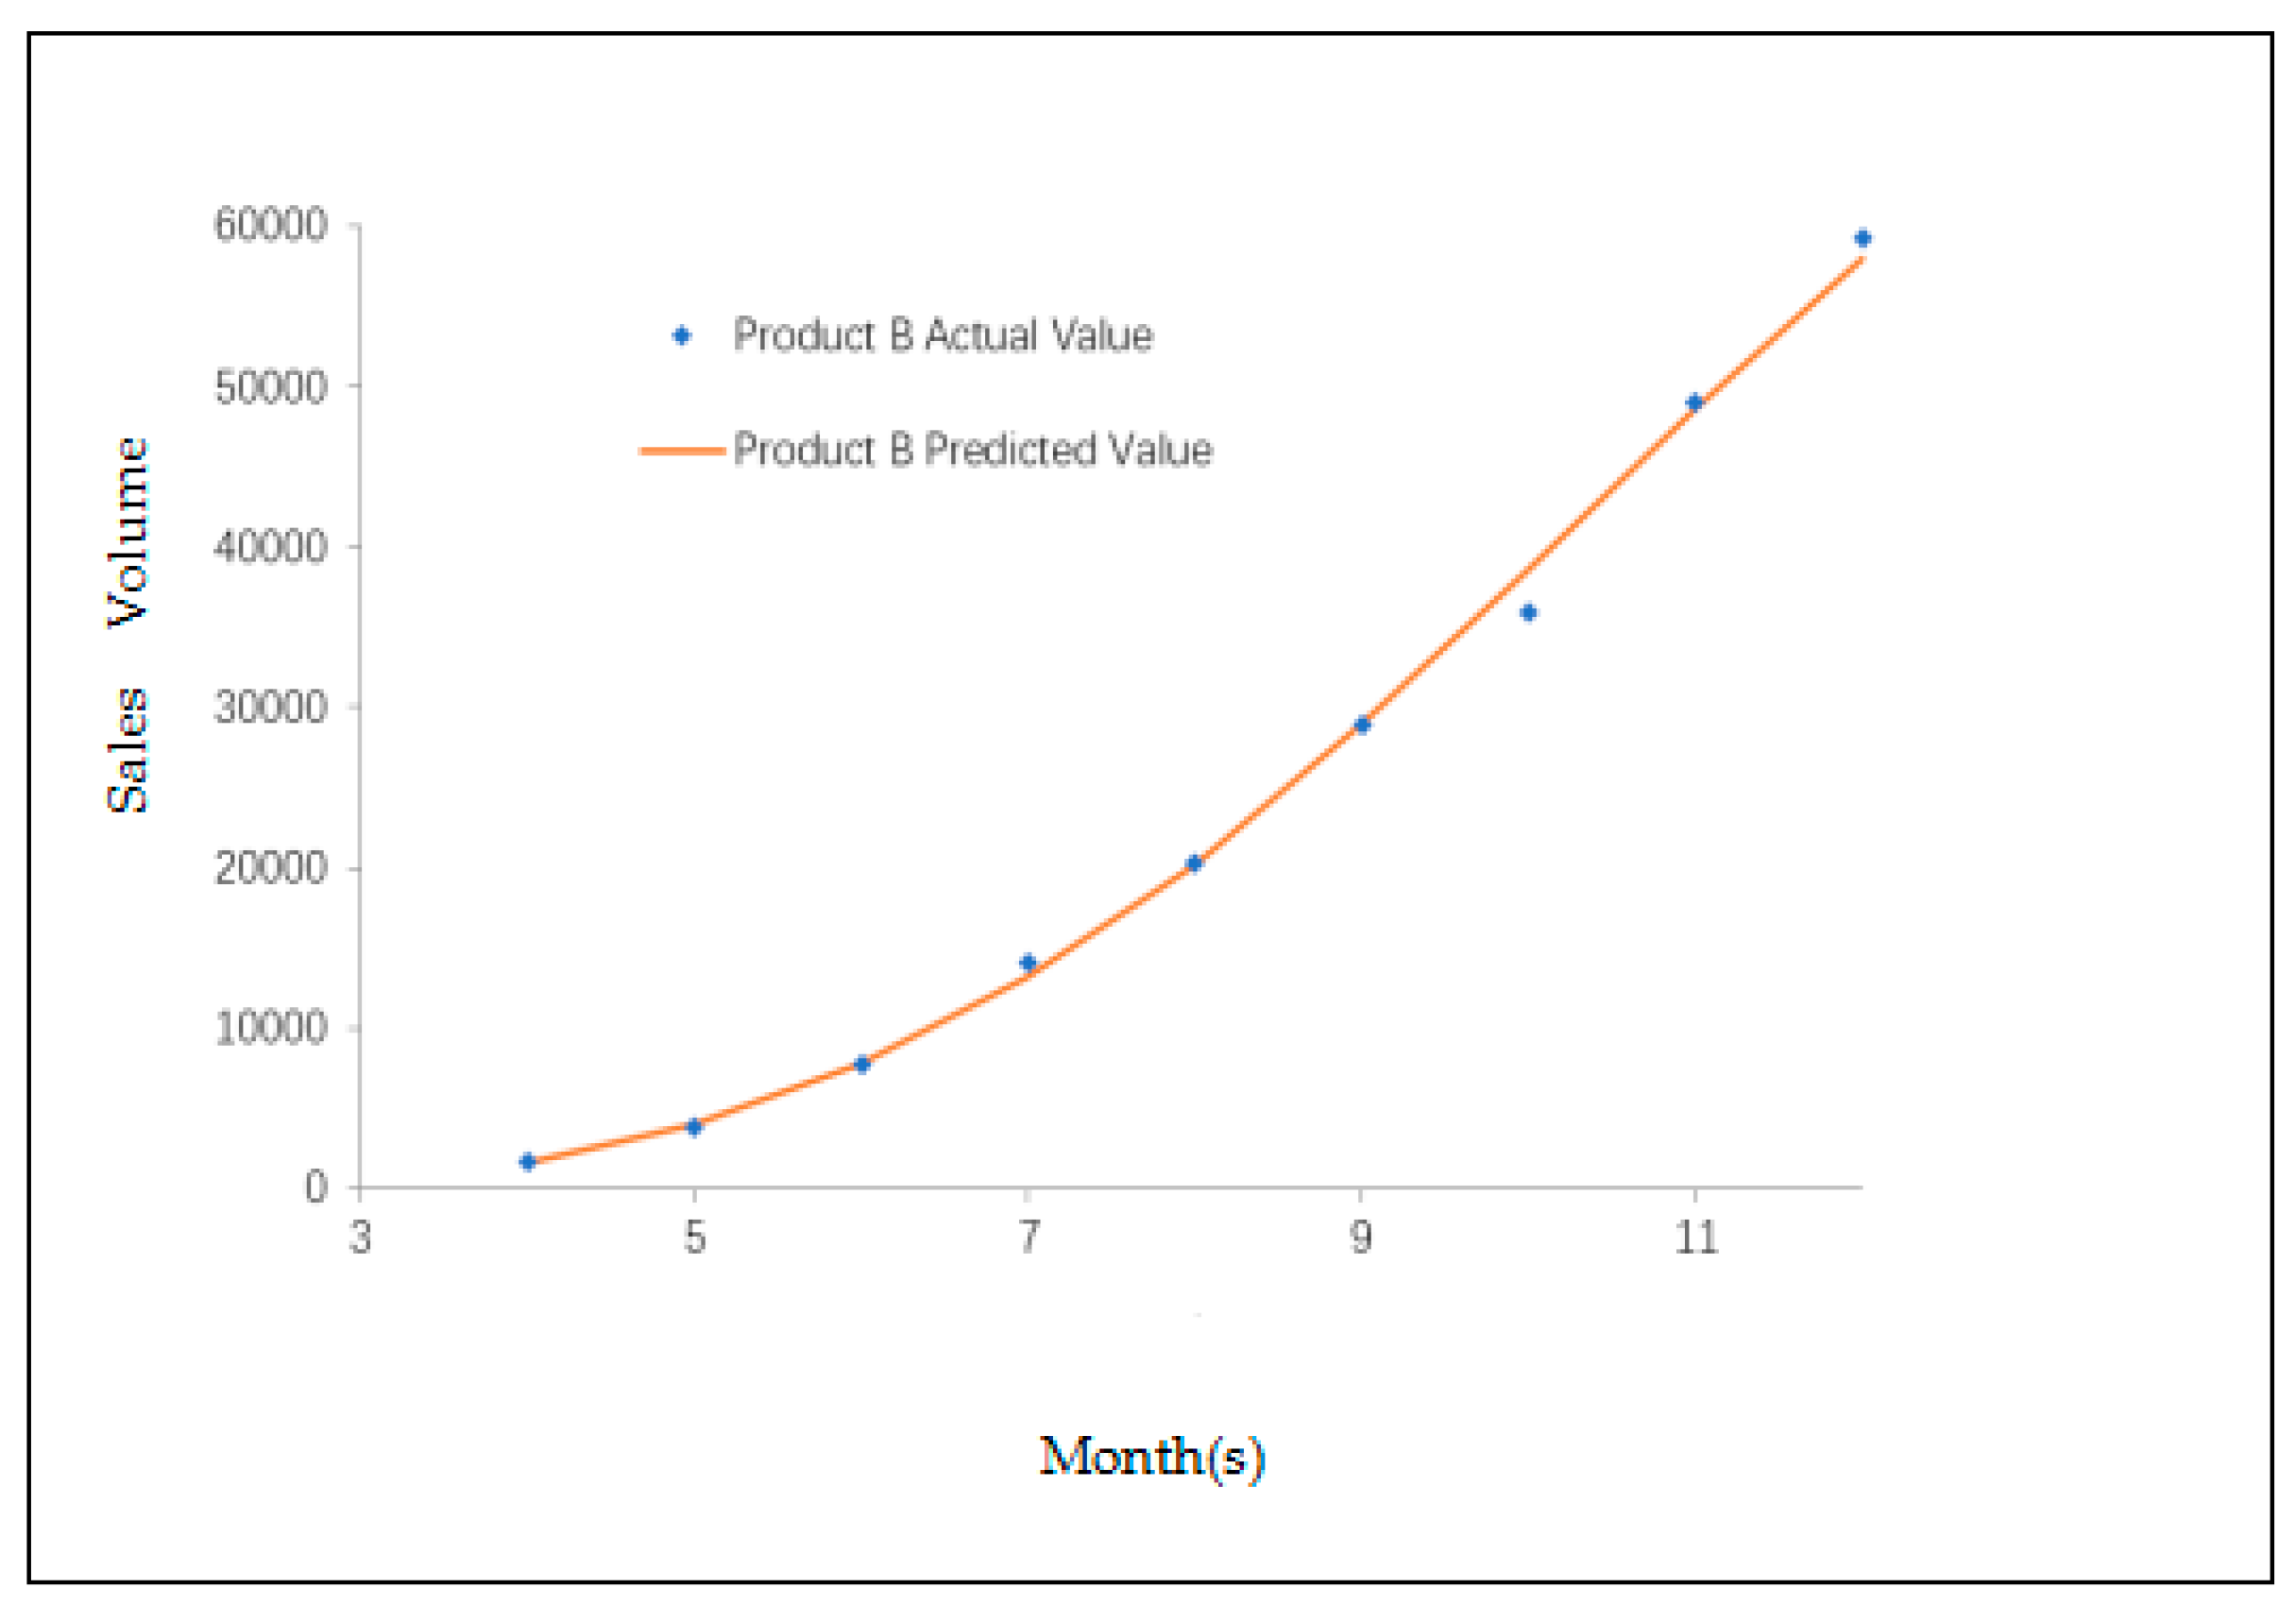
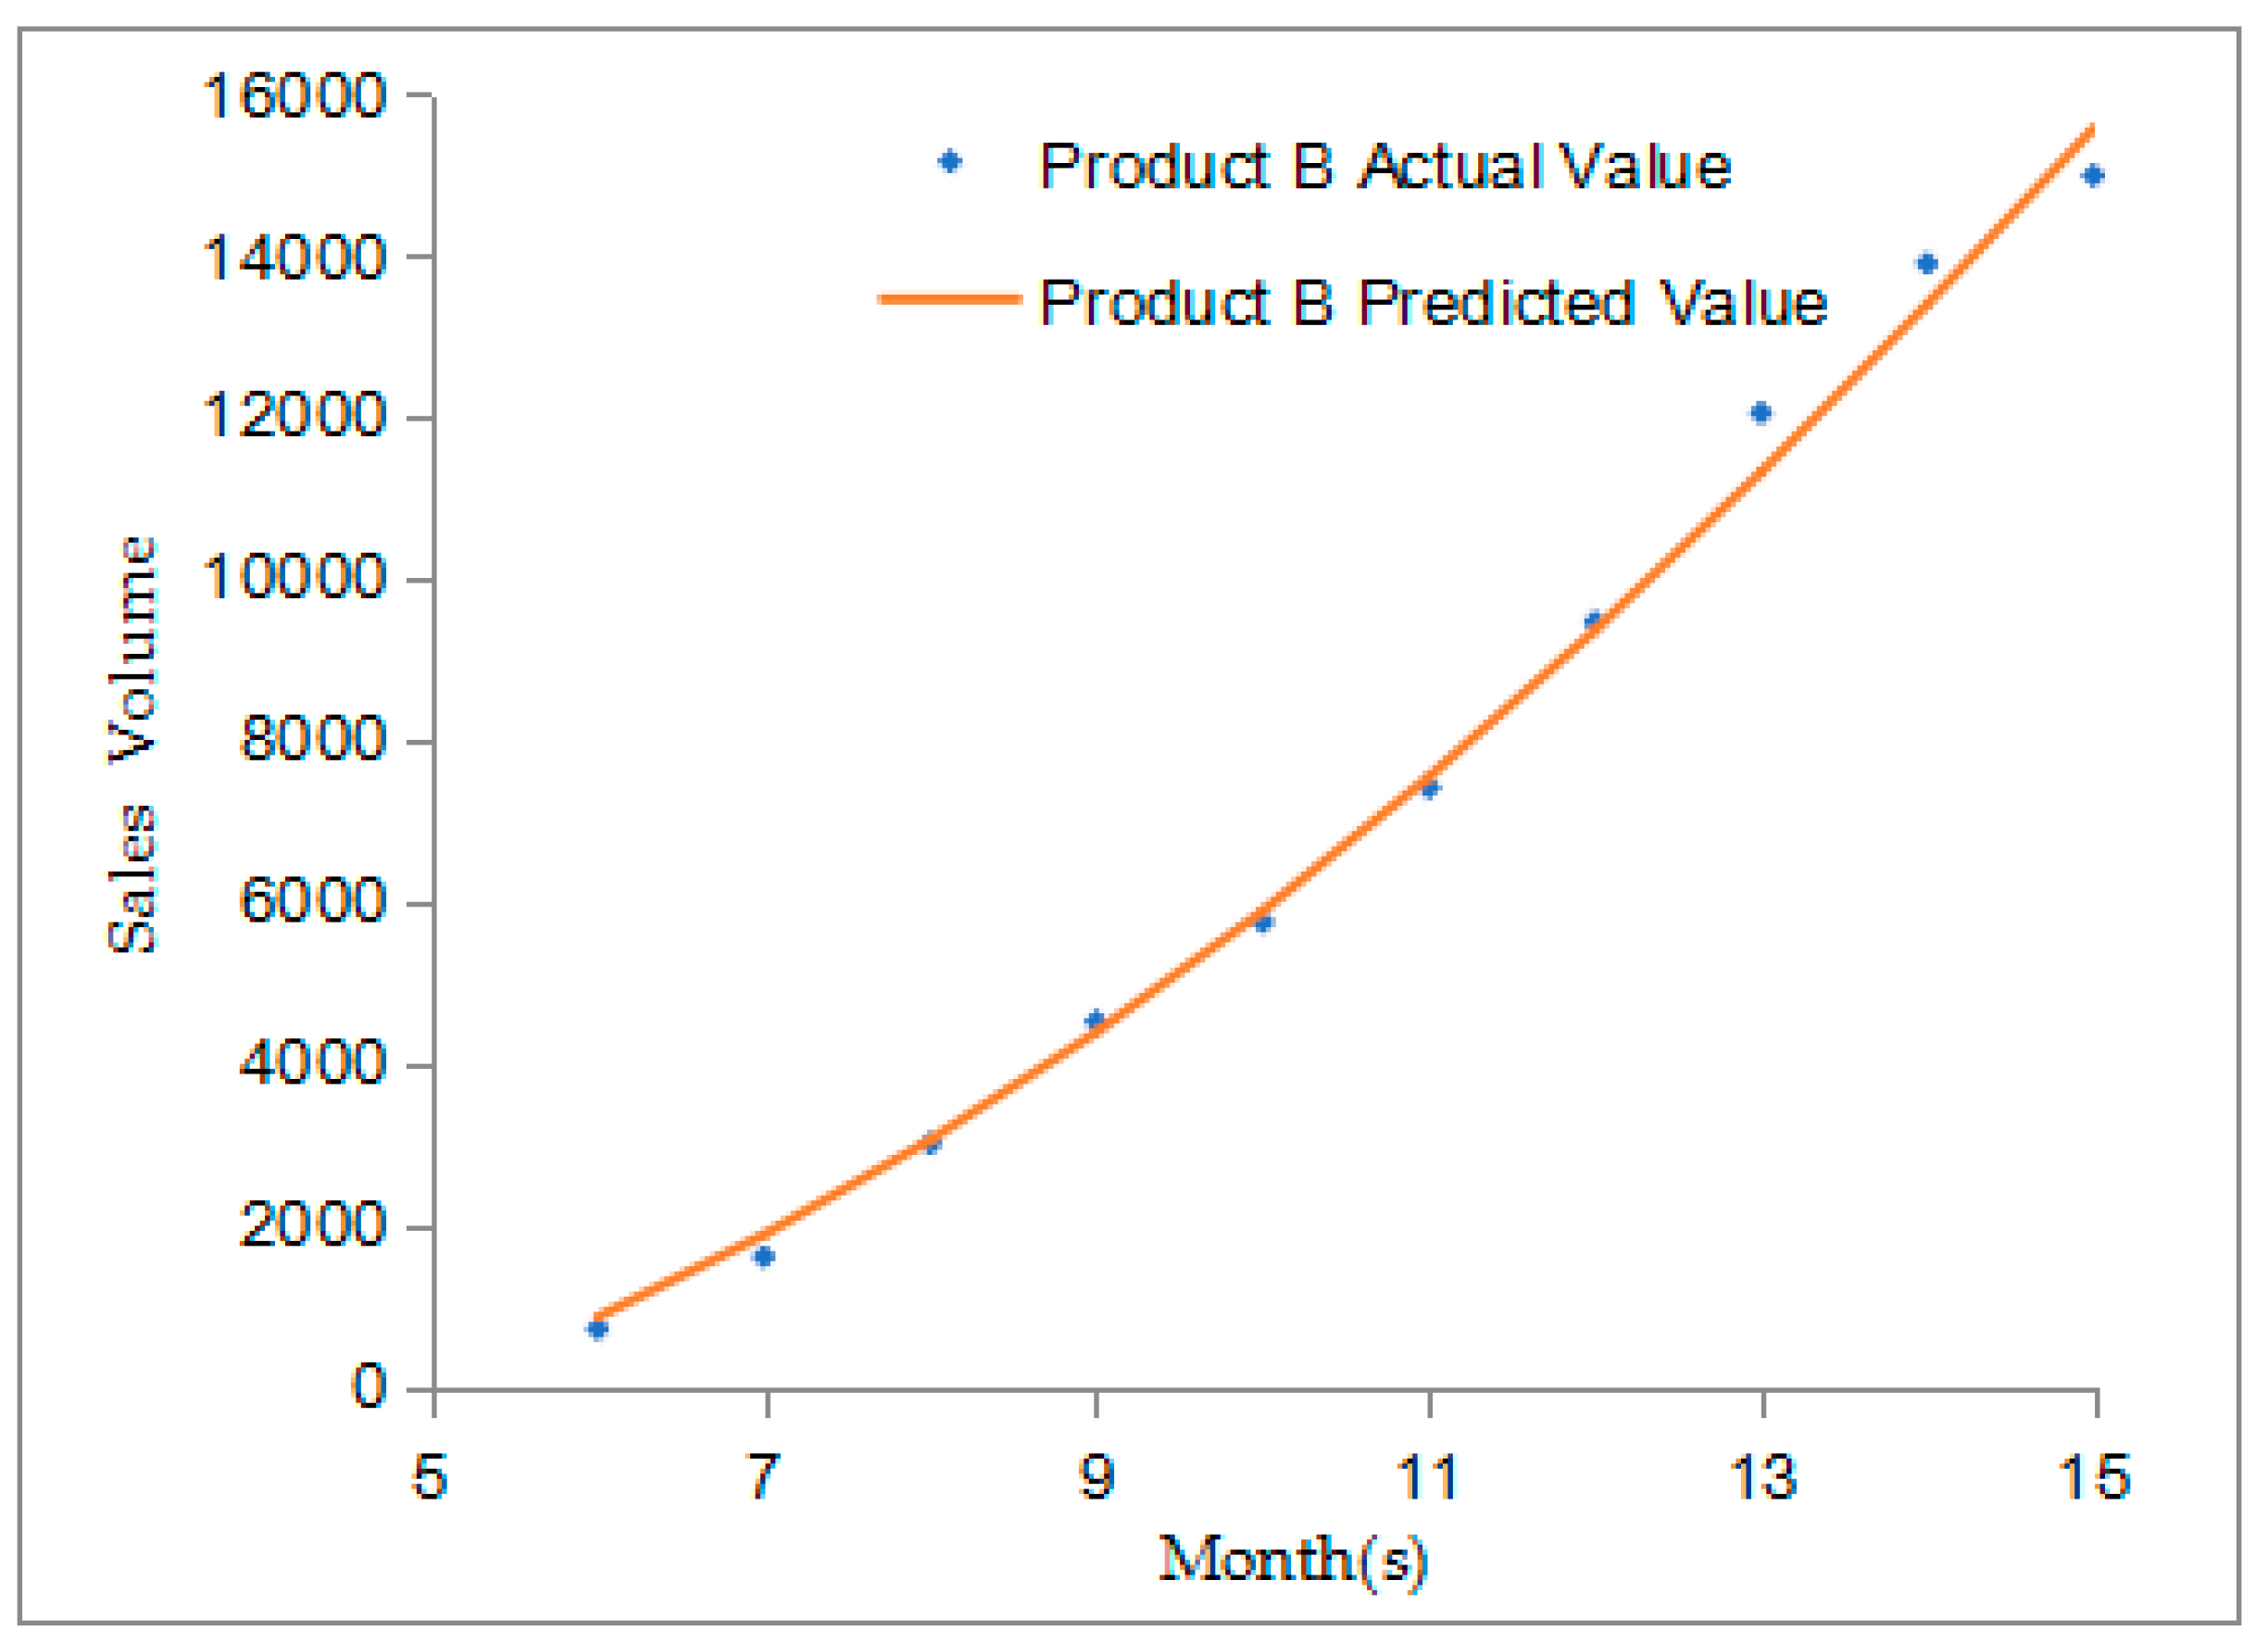
For Product B, as shown in Figure 3, the coefficient of innovation, p, is smaller than that of imitation, q. This evidence suggests that, for Product B, the influence of word-of-mouth is more important for the influence of advertising. In addition, given p2 > p1 and q2 < q1, Product B has a longer life cycle than Product A. The result also implies that the consumer resistance has a negative influence on product diffusion, but this effect is overcome by product innovation and imitation (α2 < p2, α2 < q2). Moreover, because α2 > α1, Product B received less of a negative impact of consumer resistance due to the effective promotion in the previous generation (i.e., Product A).
To analyze the model accuracy, we calculate the error rate between the actual sales value and the model predictions of the two products in two stages. Specifically, we take the ratio of the difference between the actual sales and the predicted value to the actual sales value. The prediction accuracy of Product A is shown in Table 1:
As shown in Table 1, in the growth stage of Product A, the model prediction accuracy reached a relatively high level (less than 10%) after the first month. However, the prediction accuracy started to decrease after the eleventh month, but overall error rate remained to be less than 30%. The increased error rate after the eleventh month is due to the fact that our data only shows that overall sales number of both Product A and Product B and after the eleventh month, Product A adopters started to switch to Product B. Thus, our model does not fit with the data. Overall, our model presents good fitness with the data.
As shown in Table 2, in the early sales stages of Product B, the model prediction accuracy of Product B is good with only the error rate in the eighth month is relatively high (higher than 10%).
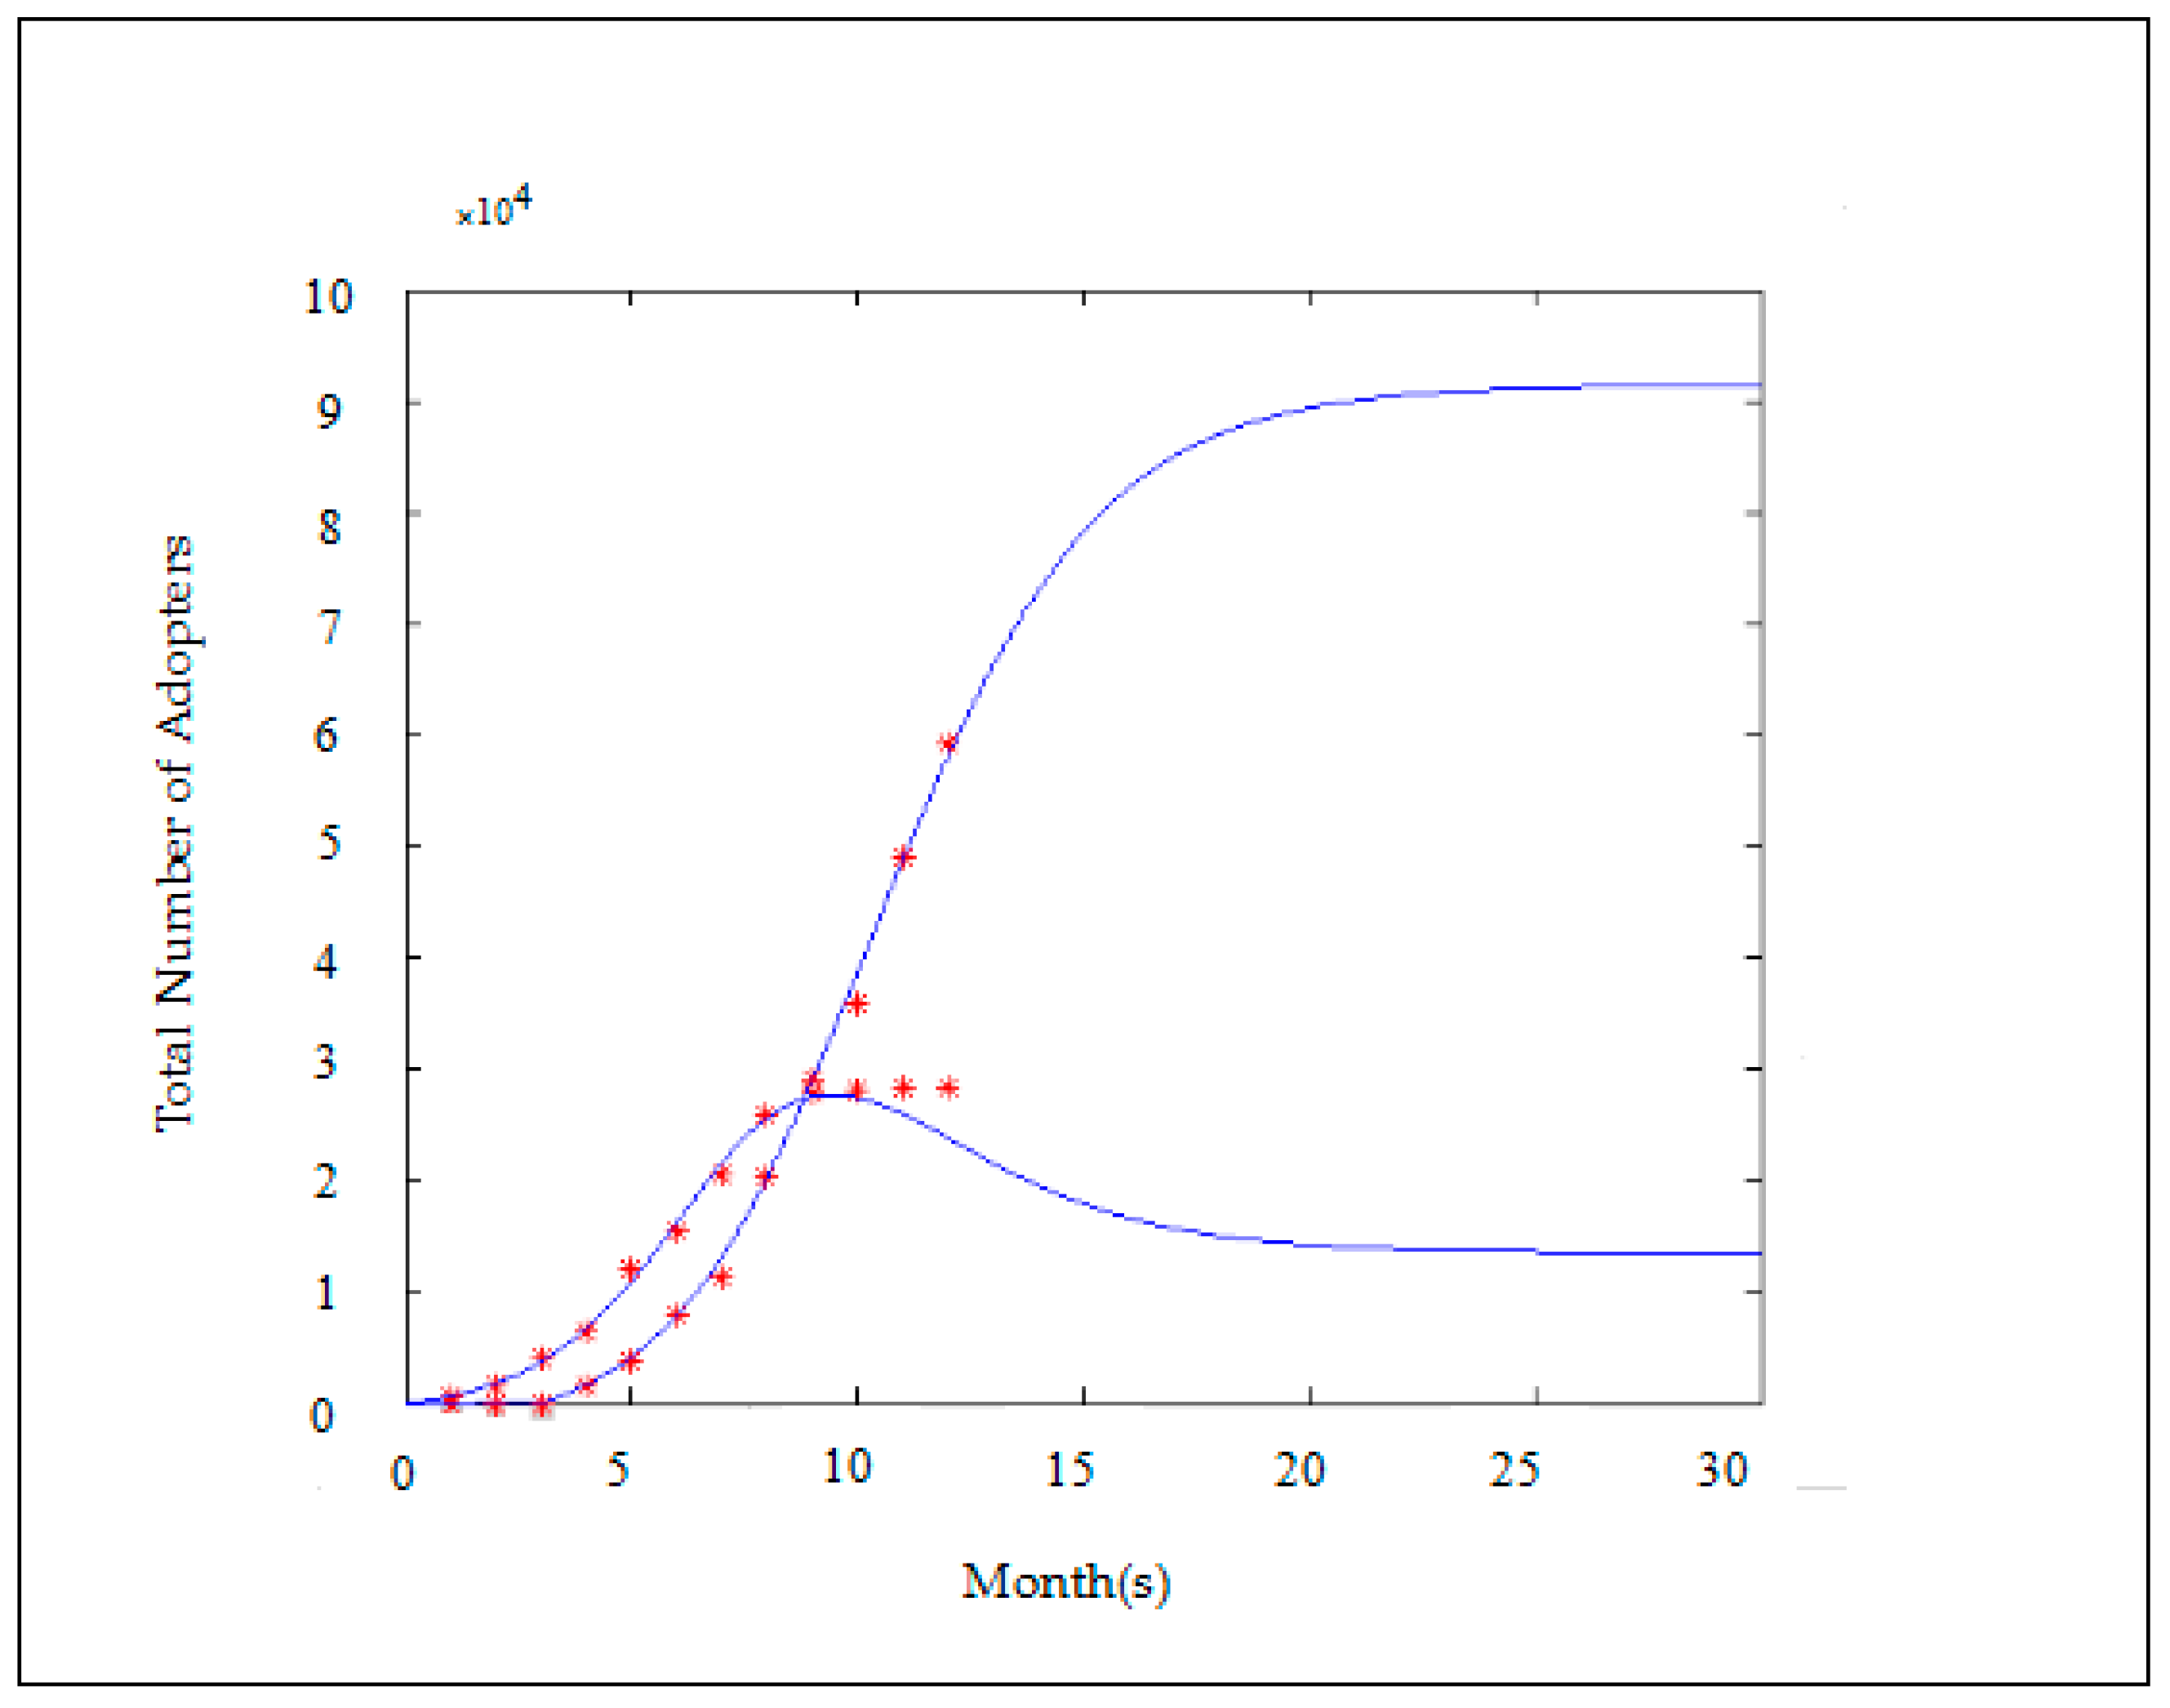
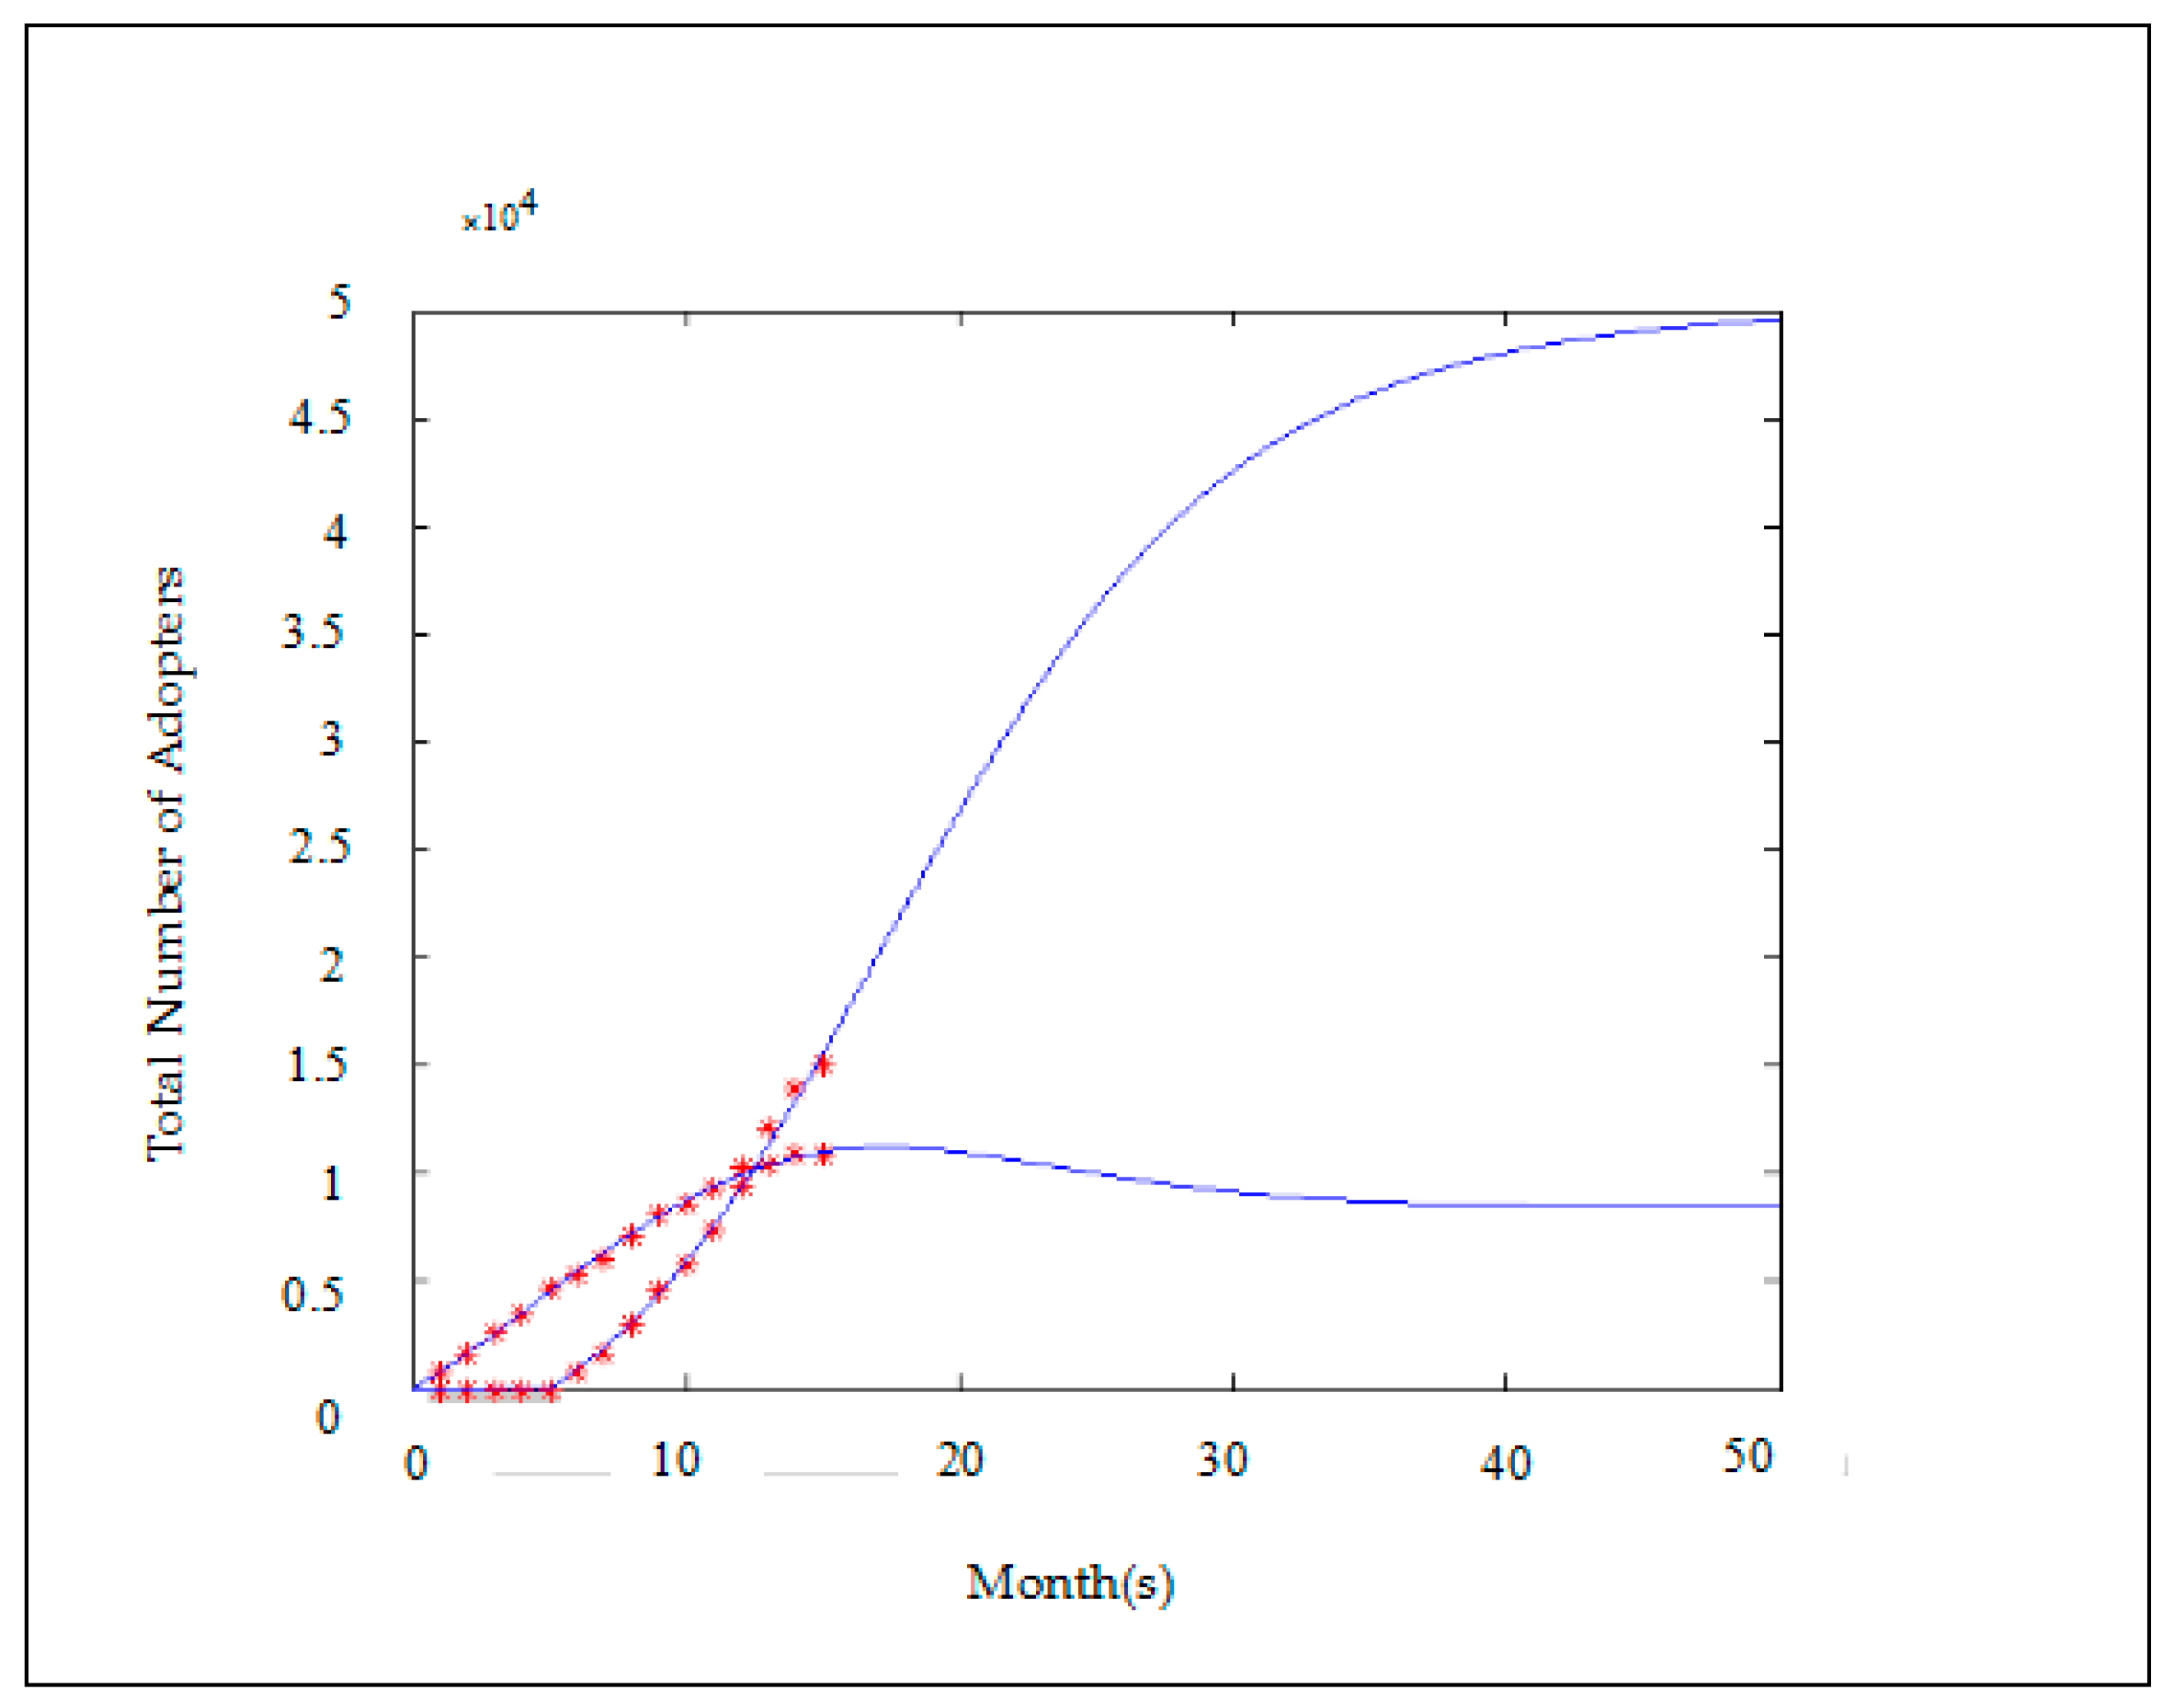
Finally, the total number of adopters for both Product A and Product B is predicted using our proposed model and presented in Figure 4.
Figure 4 shows that the predicted total number of Product A adopters starts to slow down when t > 10 and begins to stabilize at a level. This result implies that Product A will still retain some of the adopters because Product A and Product B are not complete alternative offerings. For product B, when 15 < t < 20, the growth rate begins to slow down. This result indicates that the company should start considering launching new products to the market to increase market share.
4.2. Study 2
In study 2, we collected sales data in March 2018 from a manufacturer that produces and sells professional bicycles. Specifically, we asked an MBA student who worked for the manufacturer as a sales representative for help. Based on our research needs, he provided us with sales data of two types of bicycles (A and B) that had an inheritance relationship. In December 2014, the manufacturer first launched bicycle A (the original product) to the market. In May 2015, it launched another upgraded bicycle B that adopted recycled steels to the market. Thus, bicycle B is considered to be a green product. The sales data was tracked until February 2016 (15 months).
Here we adopt the same approach as we used in study 1 to estimate the consistency between the two products. The results suggest that the average estimated product consistency of A and B in the three aspects (i.e., end use, production and channel of distribution) are as follows: x1 = 9.5, x2 = 9.7 and x3 = 10.
Next, in the first stage of product A diffusion process (0 < t < 5), we use the non-linear least squares to conduct parameter estimation, and the parameters are as follows: m1 = 33,582.4, p1 = 0.0253, q1 = 0.0882, α1 = 0.0023, R2 = 0.920. The results are acceptable. Substitute these to Equation (2) and the diffusion performance of product A in the first stage is estimated as following:
In the second stage (t > t2 = 5), the company sells product A as well as product B. The consistency of the two products is calculated as µ = 0.7456 using Equation (1). Next, we use the two-stage non-linear least squares to conduct parameter estimation for the diffusion performance of products A and B simultaneously in the second stage. The value of p and q of product A are the same with the previous ones and the parameter estimation results for product B are as follows: m2 = 25130.8, p2 = 0.0334, q1 = 0.1321, α1 = 0.0051. The results show that, for product A, the explained variance is 0.992; for product B, the explained variance is 0.962. The model presents good fitness. Substitute these parameters to Equation (2) and (3) and the diffusion performance of products A and B in the second stage are predicted as following:
As shown in Figure 5, the cumulative sales volume of Product A matches the model prediction in general, and p1 < q1, indicating the product diffusion is successful. Consumer resistance played a certain role in hindering the product diffusion, but α1 < p1, and α1 < q1, indicating that the overall impact of consumer resistance on Product A diffusion results is overcome by the product innovation and imitation. When t > 10, sales growth began to slow down, revealing that Product B attracted a large number of Product A adopters. It is predicted that at the beginning of a certain period of time, the total number of Product A adopters that abandoned A and transferred to B is higher than the number of new adopters of Product A. In other words, the total number of Product A adopters will decline. After a period of time, because the relationship between A and B is not completely alternative, Product A adopters will still remain at a certain level.
For Product B, as shown in Figure 6, after the product enters the growing and mature stages, the sales value that our model predicts is very close to the actual value with p2 < q2. Because p2 > p1 and q2 > q1, Product B is superior to Product A considering the company resources investment and the level of consumer acceptance. At the same time, α1 < α2, resistance from the conservative group becomes smaller. This result suggests that Product B is more mature than Product A is. The plot shown in Figure 6 shows that the growth curve of Product B fits well with the front part of the Bass Model and the total growth rate of the Product B adopters that our model predicts does not significantly decline, indicating that there is still room for growth.
Next, to analyze the model accuracy, we use the same method as in study 1 to calculate the error rate between the actual sales value and the model predictions of the two products in two stages. The prediction accuracy of Product A is shown in Table 3:
As shown in Table 3, in the growth stage of Product A, the model prediction accuracy for sales value gradually increased, and the error rate is less than 10% until the 15th months. The model performance is relatively good.
As shown in Table 4, in the early sales stages of Product B, the model prediction accuracy of the sales volume of Product B is moderate: the error rate in the first two months is relatively high (higher than 10%), however, the prediction accuracy is relatively high and stable with the error rate less than 10%.
Finally, the total number of adopters for both Product A and Product B is predicted using our proposed model.
Figure 7 shows that the predicted total number of Product A adopters starts to slow down when t > 16 and begins to stabilize at a level when t = 50. This result implies that Product A will still retain some of the adopters. For product B, as expected, the product life cycle is longer. Specifically, when 30 < t < 40, the growth rate begins to slow down and when t = 50 the total number of adopters is stabilized. This result implies that when 30 < t < 40, the company should launch new products and increase market share by using the power of word of mouth through virtual communities, product trial, etc.
5. Discussions
In this study, we use an improved NB model to examine the green product diffusion process under conditions in which there is a certain level of consumer resistance to new technology and product consistency between the green product and the existing product. Overall, our new proposed model reveals that as the product consistency between the existing product and the new green product increases, the remaining market potential for the existing product will decrease. In comparison, when the two products are highly differential, the existing product will still remain a certain level of market potential even after the introduction of the green product. Although in study 1, there was about 20% error rate of anticipation of product A, the other anticipation rates of product B in study 1 and products A and B in study2 were relatively accurate (no more than 7% error rate). It is notable that the 20% error rate resulted from the overseas market development for product A in study 1. Thus, the sales amount of product A continued to increase in the late diffusion stage. In sum, the empirical results suggest that our model has robust accuracy in predicting the sales performance of the two product offerings.
In addition, our model proposes that consumer resistance to new technology or new product can also impact the diffusion of the green product. Moreover, consumers may have different levels of resistance to different product offerings or innovations based on their perceptions of the easiness of usage [26]. When consumers have a higher level of resistance to a product innovation (e.g., green innovation), the product will have lower peak sales amount and this peak sales point will come later if consumers have a lower level of resistance. For example, when automobile manufacturers, such as Ford, introduces an electronic-powered vehicle model (green product) as an addition to an existing model, consumers will have a relatively higher resistance to this new electronic model because they do not havethe necessary knowledge about the products. As a result, more consumers will choose to stay the older version of the gasoline-powered model, even though the older version may have higher fuel efficiency.
In terms of managerial implications, this results based on this study suggest that managers need to consider the product consistency and consumer resistance to new technology or product change when introducing new green products to the market. First, if the green product and the existing product offerings share many common features and thus have a higher level of consistency, managers should be altered by the decreased market potential of existing products. In comparison, if the green product and the existing product offerings do not share consistent components, managers should be prepared for the continuous market potential for the older product offerings even with the launch of the new green product. Second, if consumers have a higher level of resistance to new technology or innovation, managers should be aware that consumers may not adopt the new green products as early as expected and the overall sales potential for the new green product will be lower than expected.
6. Limitations and Future Research Directions
Given the focus of this study, i.e., introducing consumer resistance and product consistency into the NB model, limitations and opportunities for future research still exist. Specifically, first, this study does not consider consumers’ purchasing preferences and other factors that can potentially influence consumers’ adoption of new green products, i.e., the product diffusion process. It will provide more insights on understanding green product diffusion process by incorporating consumer preferences into the model. Second, this study only examines the diffusion process between the green product and its recent early generation. Future studies can benefit from confirming the robustness of our model by examining the product diffusions across multiple generations. Third, this study does not consider the effects of greenwashing behaviors of the company [27,28]. In reality, some companies would pretend to be “green” to attract consumers, which would also initiate the consumer resistance to their green products. Finally, our study only uses data collected from two companies, which can limit the external validity of the research findings. Future studies can benefit from using a field-experiment approach to naturally examine the robustness of our model.
Author Contributions
Y.C. designed the framework and wrote the manuscript, T.Z. reviewed and edited the paper, Y.C. and T.Z. conducted theempirical analyses.
Funding
This research was funded by the National Social Science Fund of China (grant no. 17XGL014), and the Soft Science Research Plan in Shaanxi Province of China (Grant NO. 2018KRM004),Shaanxi Social Science Fund (Grant NO.13Q108).
Conflicts of Interest
The authors declare no conflict of interest.
References
- Chen, C. Design for the environment: A quality-based model for green product development. Manag. Sci. 2001, 47, 250–263. [Google Scholar] [CrossRef]
- Pujari, D.; Wright, G.; Peattie, K. Green and competitive: Influences on environmental new product development performance. J. Bus. Res. 2003, 56, 657–671. [Google Scholar] [CrossRef]
- Baumann, H.; Boons, F.; Bragd, A. Mapping the green product development field: Engineering, policy and business perspectives. J. Clean. Prod. 2002, 10, 409–425. [Google Scholar] [CrossRef]
- Chang, C.H. The influence of corporate environmental ethics on competitive advantage: The mediation role of green innovation. J. Bus. Ethics 2011, 104, 361–370. [Google Scholar] [CrossRef]
- Chen, Y.S. The driver of green innovation and green image–green core competence. J. Bus. Ethics 2008, 81, 531–543. [Google Scholar] [CrossRef]
- Chen, Y.S.; Lai, S.B.; Wen, C.T. The influence of green innovation performance on corporate advantage in Taiwan. J. Bus. Ethics 2006, 67, 331–339. [Google Scholar] [CrossRef]
- Krishnan, V.; Ramachandran, K. Integrated product architecture and pricing for managing sequential innovation. Manag. Sci. 2011, 57, 2040–2053. [Google Scholar] [CrossRef]
- King, W.R.; He, J. A meta-analysis of the technology acceptance model. Inf. Manag. 2006, 43, 740–755. [Google Scholar] [CrossRef]
- Venkatesh, V. Determinants of perceived ease of use: Integrating control, intrinsic motivation, and emotion into the technology acceptance model. Inf. Syst. Res. 2000, 11, 342–365. [Google Scholar] [CrossRef]
- Norton, J.A.; Bass, F.M. A diffusion theory model of adoption and substitution for successive generations of high-technology products. Manag. Sci. 1987, 33, 1069–1086. [Google Scholar] [CrossRef]
- Liu, R.; Gao, Z.; Yan, G.; Ma, H. Why should we protect the interests of “green food” certified product growers? Evidence from kiwifruit production in China. Sustainability 2018, 10, 4797. [Google Scholar] [CrossRef]
- Chang, T.; Chen, F.; Luan, H.; Chen, Y. Effect of green organizational identity, green shared vision, and organizational citizenship behavior for the environment on green product development performance. Sustainability 2019, 11, 617. [Google Scholar] [CrossRef]
- Bass, F.M. A new product growth for model consumer durables. Manag. Sci. 1969, 15, 215–227. [Google Scholar] [CrossRef]
- Stummer, C.; Kiesling, E.; Günther, M.; Vetschera, R. Innovation diffusion of repeat purchase products in a competitive market: An agent-based simulation approach. Eur. J. Oper. Res. 2015, 245, 157–167. [Google Scholar] [CrossRef]
- Jiang, Z.; Jain, D.C. A generalized Norton–Bass model for multigeneration diffusion. Manag. Sci. 2012, 58, 1887–1897. [Google Scholar] [CrossRef]
- Janssen, M.A.; Jager, W. Stimulating diffusion of green products. J. Evol. Econ. 2002, 12, 283–306. [Google Scholar] [CrossRef]
- Olson, E. Green innovation value chain: A tool for evaluating the diffusion prospects of green products. J. Prod. Innov. Manag. 2013, 30, 782–793. [Google Scholar] [CrossRef]
- Bulte, C. New product diffusion acceleration: Measurement and analysis. Mark. Sci. 2000, 19, 366–380. [Google Scholar] [CrossRef]
- Mufidah, I.; Jiang, B.C.; Lin, S.C.; Chin, J.; Rachmaniati, Y.P.; Persada, S.F. Understanding the consumers’ behavior intention in using green ecolabel product through pro-environmental planned behavior model in developing and developed regions: Lessons learned from Taiwan and Indonesia. Sustainability 2018, 10, 1423. [Google Scholar] [CrossRef]
- Maccioni, L.; Borgianni, Y.; Basso, D. Value perception of green products: An exploratory study combining conscious answers and unconscious behavioral aspects. Sustainability 2019, 11, 1226. [Google Scholar] [CrossRef]
- Erkut, B. Product innovation and market shaping: Bridging the gap with cognitive evolutionary economics. Indraprastha J. Manag. 2016, 4, 3–24. [Google Scholar]
- Erkut, B. The emergence of the ERP software market between product innovation and market shaping. J. Open Innov. Technol. Mark. Complex. 2018, 4, 23. [Google Scholar]
- Myers, D.G. Social Psychology, 9th ed.; McGraw-Hill Companies: New York, NY, USA, 2012. [Google Scholar]
- Ram, S. Successful innovation using strategies to reduce consumer resistance: An empirical test. J. Prod. Innov. Manag. 1989, 6, 20–34. [Google Scholar] [CrossRef]
- Cherrier, H.; Black, I.R.; Lee, M. Intentional non-consumption for sustainability: Consumer resistance and/or anti-consumption? Eur. J. Mark. 2011, 45, 1757–1767. [Google Scholar] [CrossRef]
- Claudy, M.C.; Garcia, R.; O’Driscoll, A. Consumer resistance to innovation—A behavioral reasoning perspective. J. Acad. Mark. Sci. 2015, 43, 528–544. [Google Scholar]
- Aji, H.M.; Sutikno, B. The extended consequence of greenwashing: Perceived consumer skepticism. Int. J. Bus. Inf. 2015, 10, 433–468. [Google Scholar]
- Laufer, W.S. Social accountability and corporate greenwashing. J. Bus. Ethics 2003, 43, 253–261. [Google Scholar] [CrossRef]
Figure 1.
Three Circumstances of Consistency between the Original and New Products.

Figure 2.
Actual and Predicted Value of Product A.

Figure 3.
Actual and Predicted Sales of Product B.

Figure 4.
Predicted Number of Adopters of Product A and B.

Figure 5.
Actual and Predicted Sales of Product A.

Figure 6.
Actual and Predicted Sales of Product B.

Figure 7.
Predicted Number of Adopters of Products A and B.


Table 1.
Prediction Accuracy of Product A.
| Month | Error Rate | Month | Error Rate |
|---|---|---|---|
| 3.11% | 7 | 4.61% | |
| 2 | 4.86% | 8 | −1.88% |
| 3 | −3.03% | 9 | −1.19% |
| 4 | 4.44% | 10 | −3.59% |
| 5 | −9.08% | 11 | −10.27% |
| 6 | 5.54% | 12 | −20.68% |
Table 2.
Prediction Accuracy of Product B.
| Month | Error Rate | Month | Error Rate |
|---|---|---|---|
| 1 | 7 | −6.70% | |
| 2 | 8 | −0.22% | |
| 3 | 9 | 0.14% | |
| 4 | −0.51% | 10 | 7.91% |
| 5 | 8.14% | 11 | −0.73% |
| 6 | 0.38% | 12 | −2.06% |
Table 3.
Prediction Accuracy of Product A.
| Month | Error Rate | Month | Error Rate |
|---|---|---|---|
| 1 | 6.09% | 9 | −1.74% |
| 2 | 0.11% | 10 | 1.43% |
| 3 | −3.11% | 11 | 1.22% |
| 4 | 0.55% | 12 | −3.21% |
| 5 | −3.31% | 13 | 0.27% |
| 6 | 0.78% | 14 | −1.17% |
| 7 | 5.30% | 15 | 1.01% |
| 8 | 0.37% |
Table 4.
Prediction Accuracy of Product B.
| Month | Error Rate | Month | Error Rate |
|---|---|---|---|
| 1 | 9 | −2.90% | |
| 2 | 10 | 2.35% | |
| 3 | 11 | 1.75% | |
| 4 | 12 | −1.04% | |
| 5 | 13 | −6.09% | |
| 6 | 19.59% | 14 | −3.61% |
| 7 | 16.77% | 15 | 3.88% |
| 8 | 1.59% |
© 2019 by the authors. Licensee MDPI, Basel, Switzerland. This article is an open access article distributed under the terms and conditions of the Creative Commons Attribution (CC BY) license (http://creativecommons.org/licenses/by/4.0/).
Share and Cite
MDPI and ACS Style
Chang, Y.; Zhang, T. The Effects of Product Consistency and Consumer Resistance to Innovation on Green Product Diffusion in China. Sustainability 2019, 11, 2702. https://doi.org/10.3390/su11092702
AMA Style
Chang Y, Zhang T. The Effects of Product Consistency and Consumer Resistance to Innovation on Green Product Diffusion in China. Sustainability. 2019; 11(9):2702. https://doi.org/10.3390/su11092702
Chicago/Turabian StyleChang, Yu, and Tao Zhang. 2019. "The Effects of Product Consistency and Consumer Resistance to Innovation on Green Product Diffusion in China" Sustainability 11, no. 9: 2702. https://doi.org/10.3390/su11092702
Note that from the first issue of 2016, this journal uses article numbers instead of page numbers. See further details here.