Urban Planning Policy for Realizing Public Objectives Through Private Development in Seoul

Asian Institute for Energy, Environment & Sustainability, Seoul National University, San 56-1, Sillim-dong, Kwanak-gu, Seoul 08826, Korea
Sustainability 2019, 11(9), 2698; https://doi.org/10.3390/su11092698
Submission received: 1 April 2019
/
Revised: 1 May 2019
/
Accepted: 6 May 2019
/
Published: 12 May 2019
Abstract
:This study aims to examine the relationship between urban development by the private sector and the urban planning incentive policy “FAR (Floor Area Ratio) bonus” and its effects on the city of Seoul in Korea. The results and characteristics of the incentive policy in the development process over the last five years in Seoul are investigated. An in-depth analysis of the mechanism of the floor area ratio incentive was conducted alongside measuring public design elements and the additional floor area compensated by private sectors for public benefit. The outcome of summarizing incentive implementations via quantitative analysis indicated that the policy focused on a narrow scope of target items, resulting in an imbalance in the implementation of public benefits and inflated incentive provisions. These quantitative results, exceeding those in non-special planning districts, misleadingly suggest a significant effectiveness of the incentive policy in generating operative public space. This study argues that the standards for establishing a balance between public and private benefit need a reform toward practical and qualitative impacts, while currently it is evaluated based on mere quantification. In conclusion, it is critical to implement policies that designate necessary public amenities in a selective manner and provide more judicious incentives to achieve a better-balanced planning system.
1. Introduction
The representative effects of the operation of the incentive system are “the realization of public goals for the region” and “improvement of the quality of life of citizens through public facilities.” However, since the public sector has limited resources available to improve urban environments, a movement to actively use the development of the private sector is arising. This is the floor area ratio (FAR) bonus system, which is also called the incentive zoning system. The incentive zoning system is a valuable “win-win” strategy to form high quality urban environments for citizens, without increasing taxes.
The urban planning process can give rise to many conflicts and it becomes challenging to promote and induce a specific goal with public intent on privately owned land, even more so when it needs to be financed by its owner [1]. This is like the old debate in the field of economics regarding whether the economy system needs public intervention [2]. In other words, there has been incessant debate on the issue of whether public intervention in a private development project is an infringement upon “private property rights” or an act of “protection of public interest” [3]. The public sector has strived to strengthen the justification of public intervention in development processes and to institutionalize various methods to synthesize private development and public intents. Such approaches have included regulatory methods and incentive methods [4].
Representative regulation methods include design reviews, which evaluate the effects of architectural projects, and urban planning developments on surrounding communities. Among some of the incentive methods, incentive zoning is the leading method encouraging voluntary actions from developers to create an appropriate urban environment [5,6,7]. Incentive policy is based on providing compensation to the private sector when it contributes to the public sector’s agendas. In other words, it is an exchange between the two different benefits sought by the two distinct sectors [8].
In many studies, limited zoning systems have made houses unaffordable for low-income and middle-class families in the United States. In this respect, each state has introduced mandatory policies that require zoning system reform for production of affordable homes [9]. Bonus zoning is a fee made by negotiated regulations and an important source of public funds. The zoning bonus enables city planners to encourage developers to provide retail aprons, public art, pedestrian access to buildings, day care centers, low-income housing, and other public benefits [10].
In the rapid urban development process recently occurring in Southeast Asia, relevant regulations have been enacted to introduce the bonus zoning or incentive zoning system. In Indonesia, bonus zones, provided to developers in exchange for the provision of public facilities such as arcades, plazas, pedestrian roads, loading and unloading zones, and parking spaces, are being designated. However, detailed mechanisms for the future have not yet been implemented [11].
Therefore, the case of Seoul will provide good preceding data. In Korean urban planning, the bonus for procuring public amenities is termed “FAR-incentive.” In most market-driven economies, such as Seoul, public finance is limited and, hence, to improve the urban environment and build commendable architecture, the current trend is to promote private developers’ voluntary contribution by modulating regulations to a certain extent [12].
Such an incentive system has the disposition to realize the public benefit of urban environment enhancements. Simultaneously, the system also propels development by returning favorable conditions for the private sector’s development projects [13].
Various nations harboring similar urbanization as Korea laud such policy methods as an effective means to secure public facilities without additional financial burden on the public sector. In Korea’s capital city, Seoul, the recent rapidity in the redevelopment processes have primarily relied on private funding via incentive zoning to procure public amenities. However, because this type of incentive zoning permits additional building construction, it tends to produce various concerns, such as overloaded community infrastructure, protruding landscapes due to excessive building mass, and privatized public space for the protection of resident privacy [14].
Therefore, in the process of urban redevelopment, which was concentrated in the early 2000s in Seoul, it is necessary to research the effectiveness of the incentive zoning system as well as to propose potential directions for improvement by analyzing the systematic structure and practical results of policy. In this research, we quantitatively analyze newly constructed public facilities and FAR bonuses and, in addition, conduct a site survey for a qualitative analysis of the public contribution items designated by design guidelines.
2. Materials and Methods
2.1. Background Information: Incentive Policy for Private Development in Seoul
2.1.1. Seoul FAR Relief Policy (Policy for Permitting Additional FAR)
Presently, in Korea, the bonus policy allows “additional construction corresponding to the ratio of land or public benefit items provided.” The bonus policy, also called “relief policy” since it allows mitigation of certain regulations, is perceived as a means to secure public infrastructure as a “public oriented scheme.” In Korea, the incentive policy was first introduced under construction laws in the early 1980s. In the succeeding years, complementary approaches, such as detailed planning and unit planning, were implemented. To award higher density for complying with public-oriented contribution laws and regulations, building coverage, FAR, and diagonal plane control regulations, among others, were modulated as a means of providing bonus for private developers [15,16]. Such strategies were integrated into the District Unit Planning System in the year 2000 and they continue to hold in the current system. The policy for additional FAR in the urban planning system has been recognized as one of the most effective means of realizing the public agenda in the context of urban planning [17].
The FAR-Bonus system in Seoul was derived from the National Land Planning Law statement, according to which “When dedicating a portion of land as area for public amenities, additional attributes may be applied such as increased building site area” [18]. Hence, anyone wishing to build on a given area can increase the building coverage ratio, the floor area ratio, and/or the building height via modulation of relevant regulations, when contribution for public facilities, such as building roadways and parks, is also planned alongside. (Table 1 presents the different modulation approaches for various categories.)
Based on this national law, various cities have adopted similar ordinances that are applicable to each city’s conditions. Seoul follows the Seoul City Urban Planning Ordinance Enforcement to determine Base-FAR, Permitted-FAR, and Maximum-FAR, as shown in Table 2.
The FAR bonus within the District Unit Planning system is distinguished as the following. First, the Base-FAR is a separately prescribed as FAR, designated within the ordinance’s scope of floor to area ratio. Permitted-FAR is determined by the Base-FAR with the addition of the FAR incentive, designated within the district unit plan. Last, the Maximum-FAR is obtained, first, by calculating the ratio of public property within the previously found Permitted-FAR, then adding the Permitted-FAR to this value, multiplied by a factor of 1.3 (the ratio factor) and “α”. This Maximum-FAR is part of a unique concept for cases when a private investor donates land area for public amenities. The FAR calculations are again organized as shown in Table 2.
2.1.2. FAR-Bonus Operating System
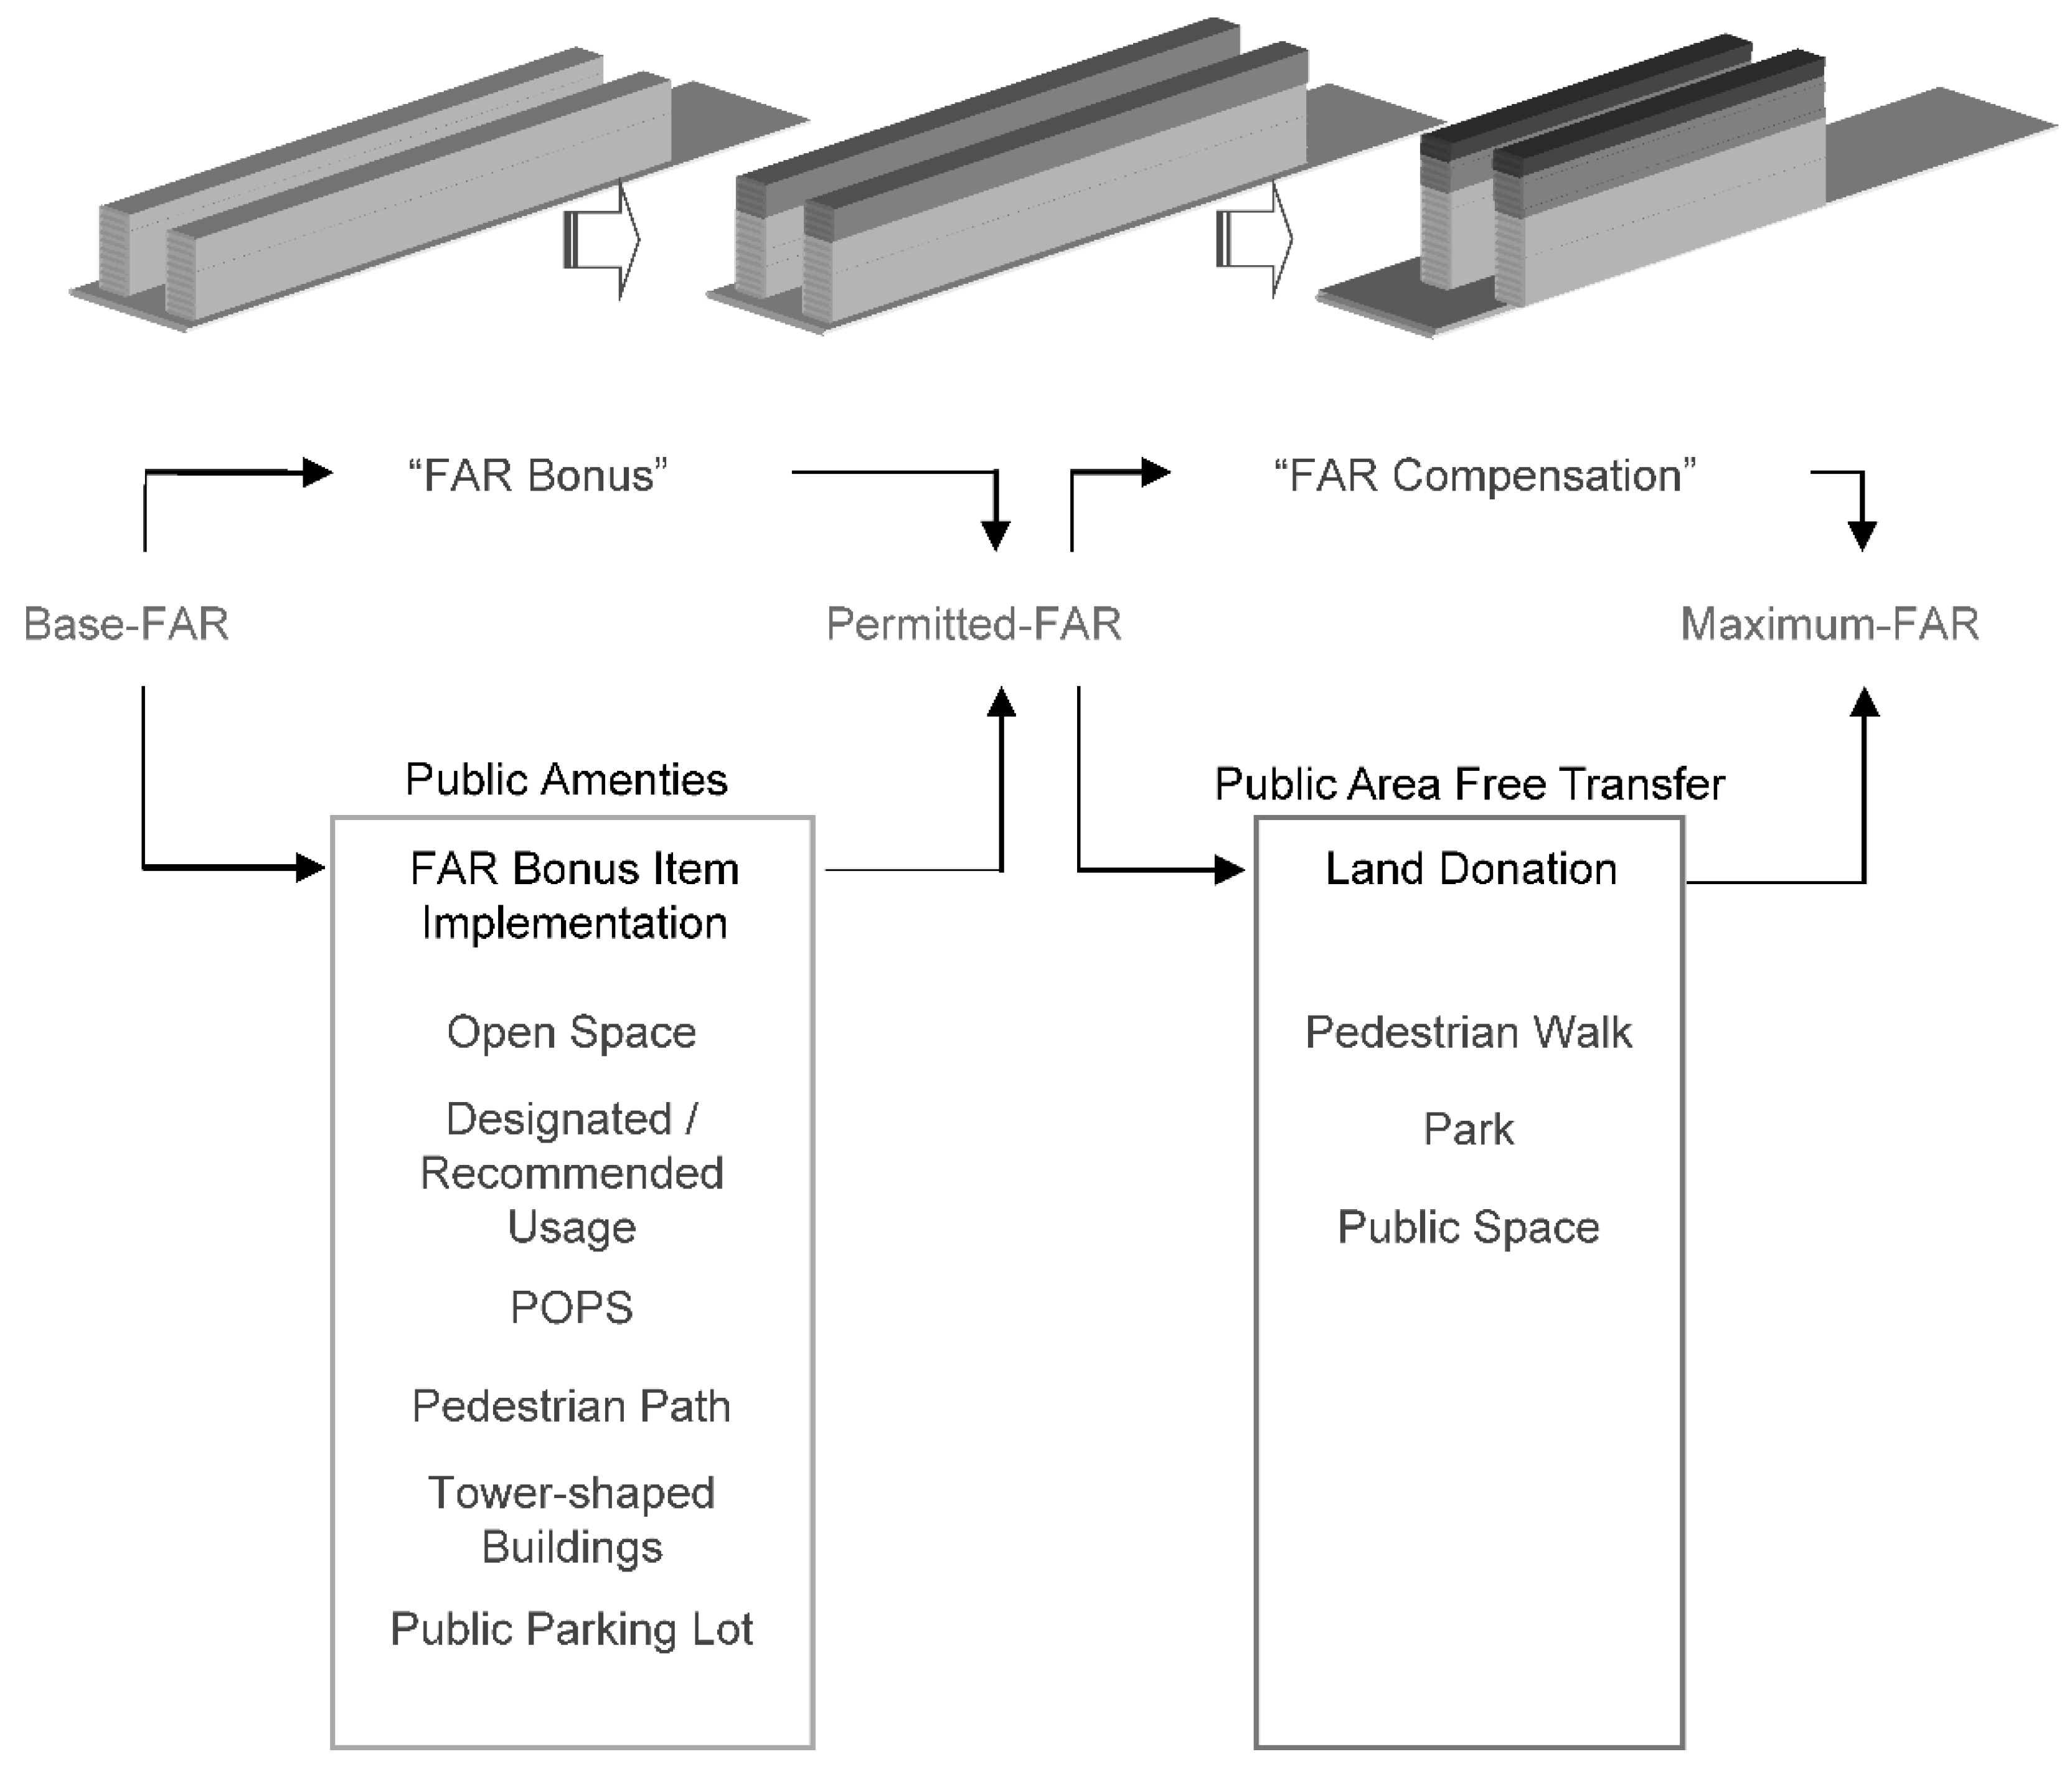
The current FAR bonus system can be distinguished into three major stages, as follows: Base-FAR, Permitted-FAR, and Maximum-FAR. Among the various bonus categories are those regarding development site parcels, building usage, privately owned public space (POPS), etc. According to the given conditions of the subject area, the degree of bonus provision can be distinguished as “regulatory” or “recommended.” When the FAR modulation requisites for POPS, pedestrian path, tower-shaped buildings, and others are fulfilled, incentives are added to the Base-FAR to get the Permitted-FAR and a land donation related FAR-bonus is added when appropriate. Figure 1 presents the FAR incentive scheme, showing public amenities and contribution items.
2.2. Introduction of Incentive Policy in Other Cities
2.2.1. New York
According to the Zoning Handbook of New York, incentive zoning systems can be divided into five types, as follows: (1) “As of right (a bonus is awarded if a comfort element is provided and no permission is necessary)”, a square, arcade bonus; (2) special (purpose) district; (3) special permit system; (4) incentive re-zoning; and (5) incentive variance. All of them are used as effective means of acquiring different types of amenity or achieving the goals of urban design and planning and are designed and applied to ensure the flexibility and differentiation of incentive applications [19]. Detailed information about FAR bonus items applied to the public plaza and arcade in NY are found in Table 3.
2.2.2. Boston, Massachusetts
In Boston, every building used for commercial, industrial, or hotel use, with areas exceeding 100,000 SF, must provide an Affordable Housing fund of $7.87 per additional SF and 10–20% of the money must be used for places near the development site. Housing projects for 10 or more households should include at least 13% of affordable housing construction and many developers must follow zoning variance. As a result, since 1986, Boston has made $81.50 million in commercial building construction, 6000 affordable housing units were constructed, and 568 affordable housing units were constructed in the target area [20]. Table 4 shows the bonus rates by public design elements in Seattle.
2.2.3. Differences in the Operation of Incentive Systems between Seoul and Other Cities
In New York, compared with Seoul, public spaces are classified in more detail. For example, plazas are divided into urban plaza, residential plaza, arcade, covered pedestrian space, sidewalk widening, open air concourse, through block arcade, through block connection, through block galleria, elevated plaza, and sunken plaza. As such, plazas are divided based on their functions, locations, shapes, and configurations. The diverse types and definitions of public spaces enable developers to broaden the choice of the public spaces to be created, give clear functions, and easily establish the direction of management after installation.
In addition, presenting a detailed design can be said to be a characteristic of NY’s guidelines. In the case of public plazas out of the open public lands in New York City, the purpose and time of use are clearly defined so that there are clear standards for ex post facto management. There are separate standards for access for the disabled, the installation of chairs and planting, and the installation of food and beverage service facilities and detailed open public land formation standards are applied, including prohibiting vehicle entrance and garbage disposal to secure qualitative levels.
In addition, New York City applies differentiated bonus standards according to the density of each district. Instead of calculating the bonus in a lump as the ratio to the lot area, as with Seoul, bonus building areas are given in proportion to the area provided.
In the case of Japan, there is a standard for the provision of differential incentives according to the quality of public spaces provided. The premium coefficient implemented in Japan gives differentiated incentives, even to the same open public lands, and can be said to be an administrative means to not only quantitatively secure public spaces, but also to maintain qualitative levels according to the roles and locations of public lands and site conditions. Since diverse premium coefficient values in a range of 0.4–1.0 exist even in the case of public facilities of the same type, the effectiveness of the operation of the system can be said to be high.
2.3. Research Subject and Method
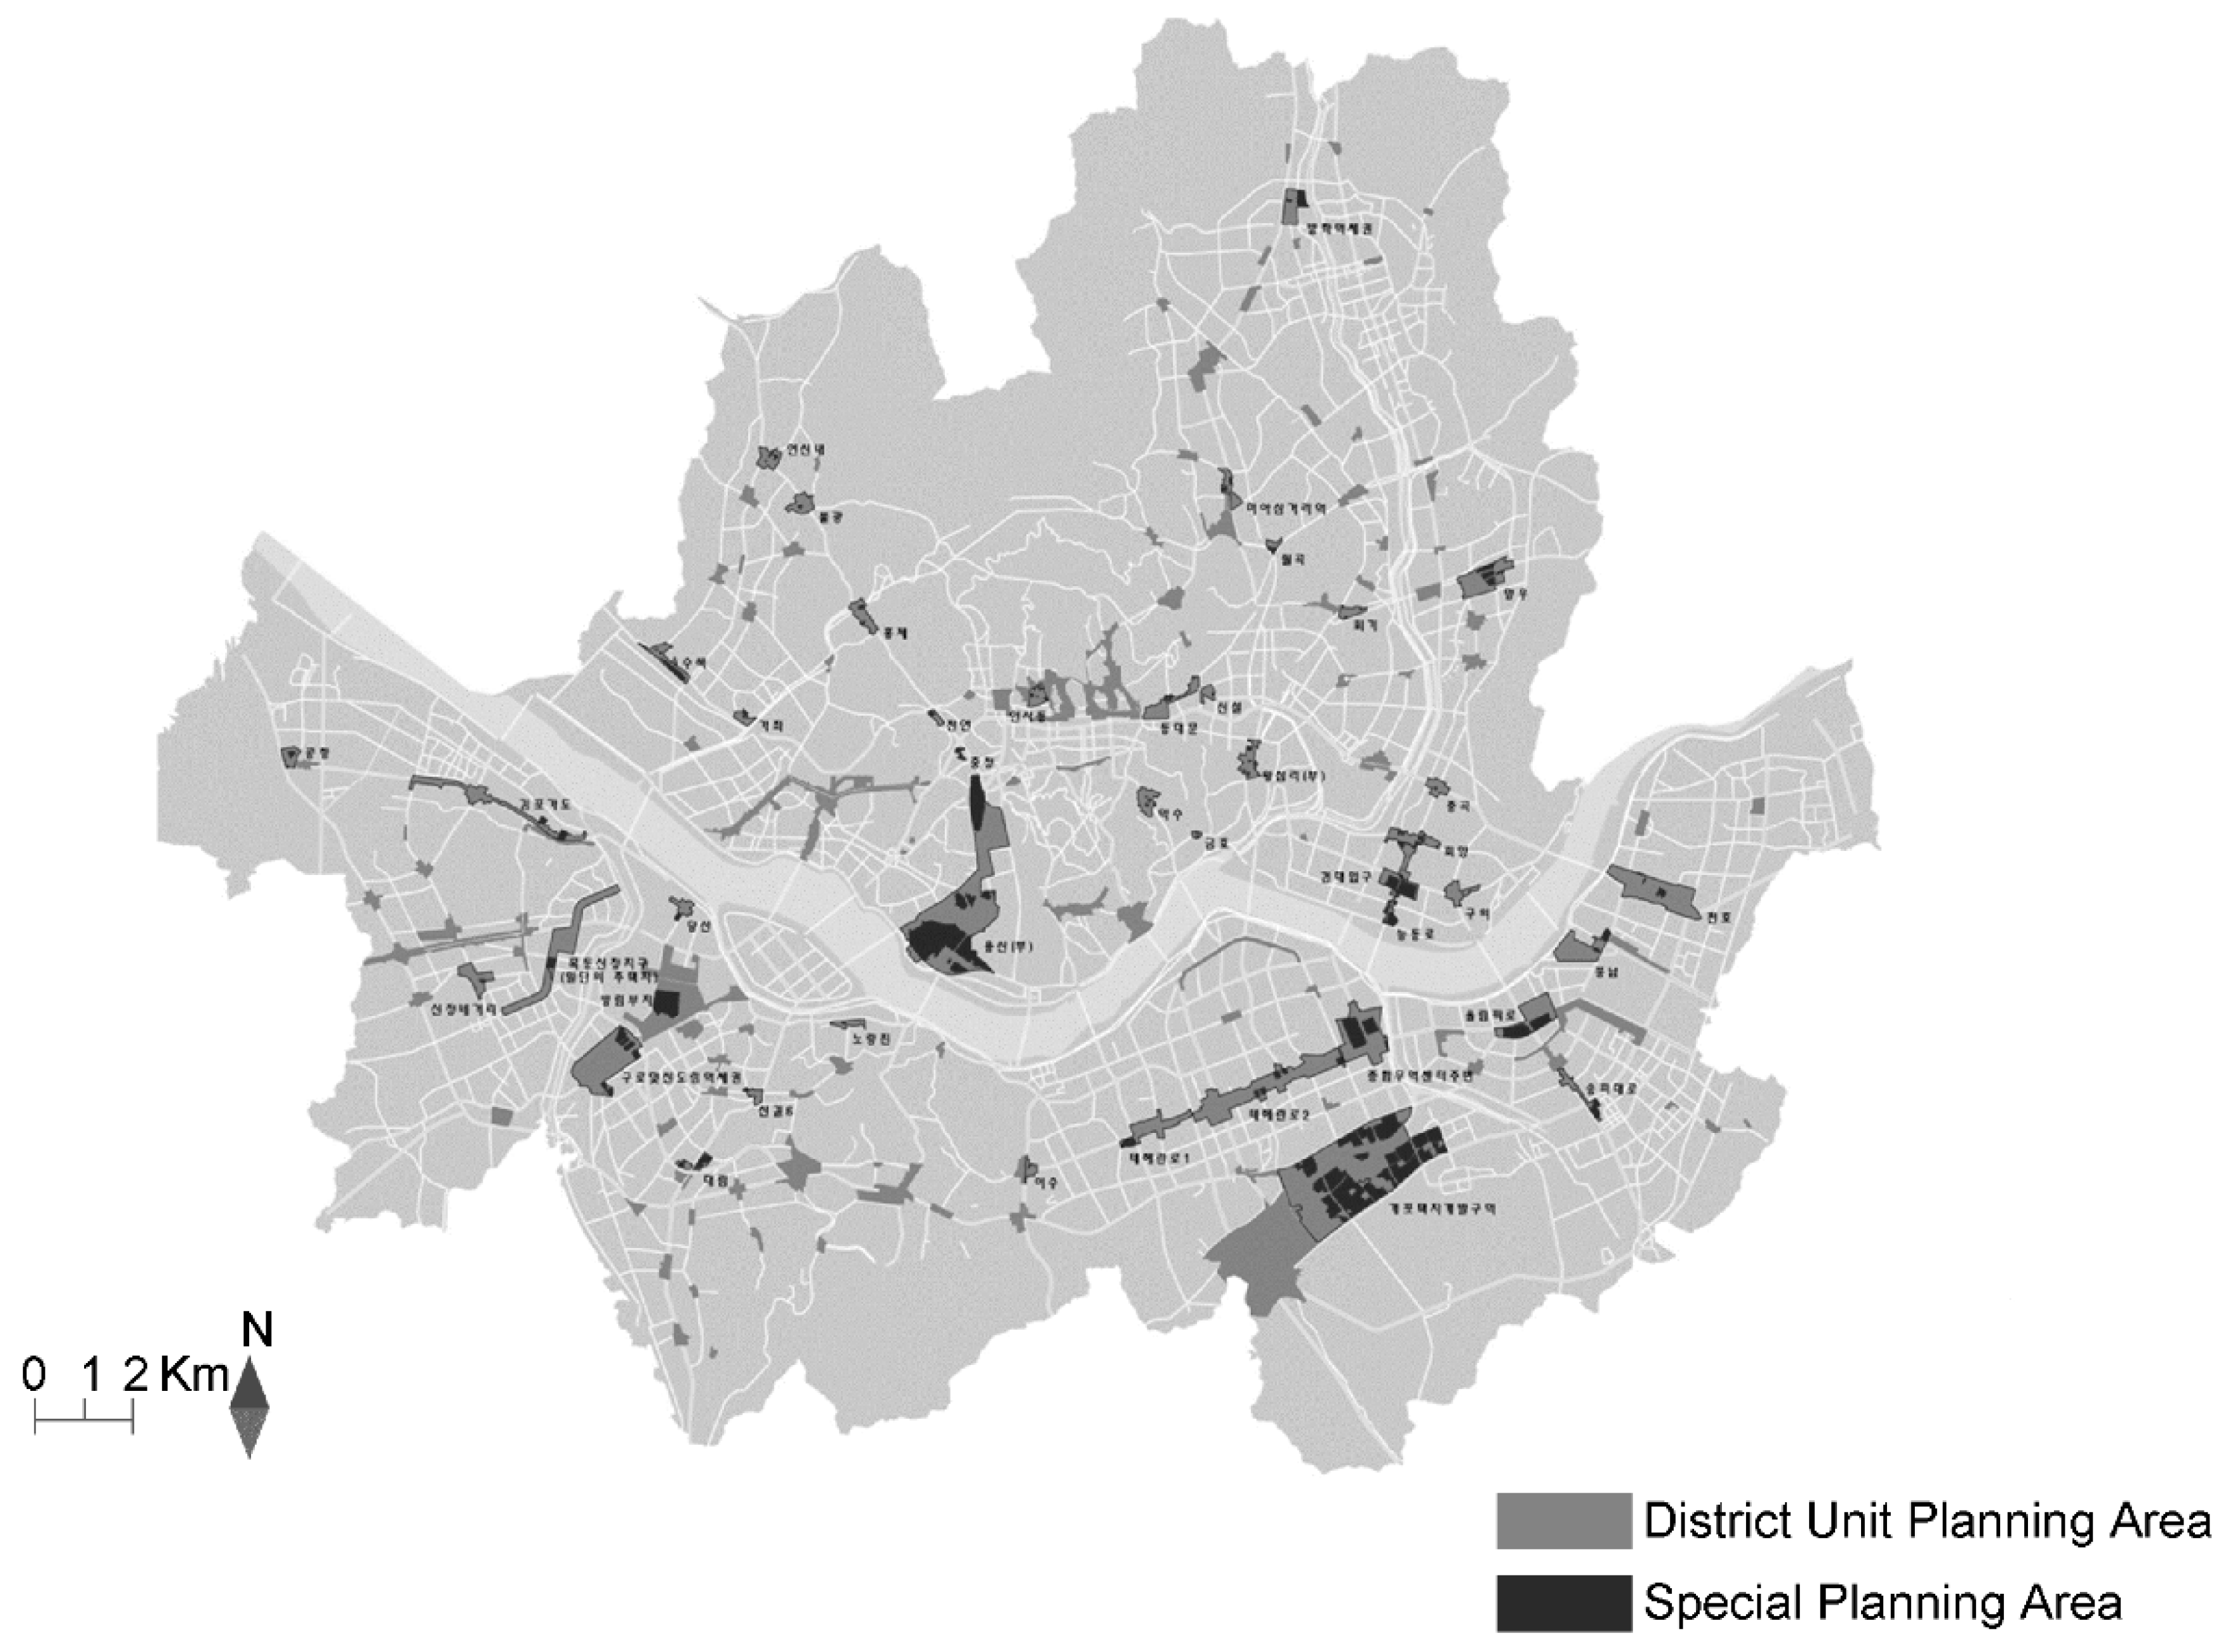
Seoul has the greatest number of district unit plans in Korea. Since 2007, a total of 201 district classifications and 71 detailed development plans have been confirmed. For investigating actual conditions of incentive provisions, this research examined 46 special planning projects (for a total of 1,140,344 m2) that were initiated since 2000, the year when special planning projects were established within District Unit Planning. Figure 2 presents the research subject areas. The dark grey color depicts the distinct planning areas, while the black color depicts the special planning areas, which are the intensive study areas.
The analysis procedure and method are as follows. First, notification statements for detailed planning projects within special planning areas reported in the city bulletin after the year 2000 were selected. Official layouts and maps available from the city archives were retrieved for the study. Any missing content in the archived document was determined by other reference sources, as well as field investigations. Completed buildings were inspected for structural plan and functional composition based on the building management register records. In most cases, bonuses are provided in the form of FAR and, therefore, the research scope was limited to FAR bonuses. To obtain substantial resource materials, the associated coordinators of the study areas were solicited.
This study selected a complete enumeration method instead of a sampling method. A combination of literature reviews and field surveys were conducted to analyze cases of major urban development projects that occurred in Seoul from 2000 to 2010. The statistical processing of the surveyed data was conducted by undergoing a data coding process and carrying out time series analysis, frequency analysis, and comparative analysis using the SPSS Standard Version 12.0.1 package. In addition to the quantitative analysis as such, the design elements were classified by analyzing detailed development plan decision drawings to analyze the characteristics of the plans related to the incentives created in the case area. At the same time, the review books and the results of the reviews applied to the actual construction were analyzed to synthesize the incentive-related arguments in the development process. In this process, secondary literature analysis and field surveys were combined to analyze the qualitative effects of the provision of incentives and whether publicness was realized or not.
3. Results
3.1. Results of the Analysis
3.1.1. Study Area Development Results
Detailed information about FAR bonus items applied to each case can be analyzed and found in Table 5 and Table S1.
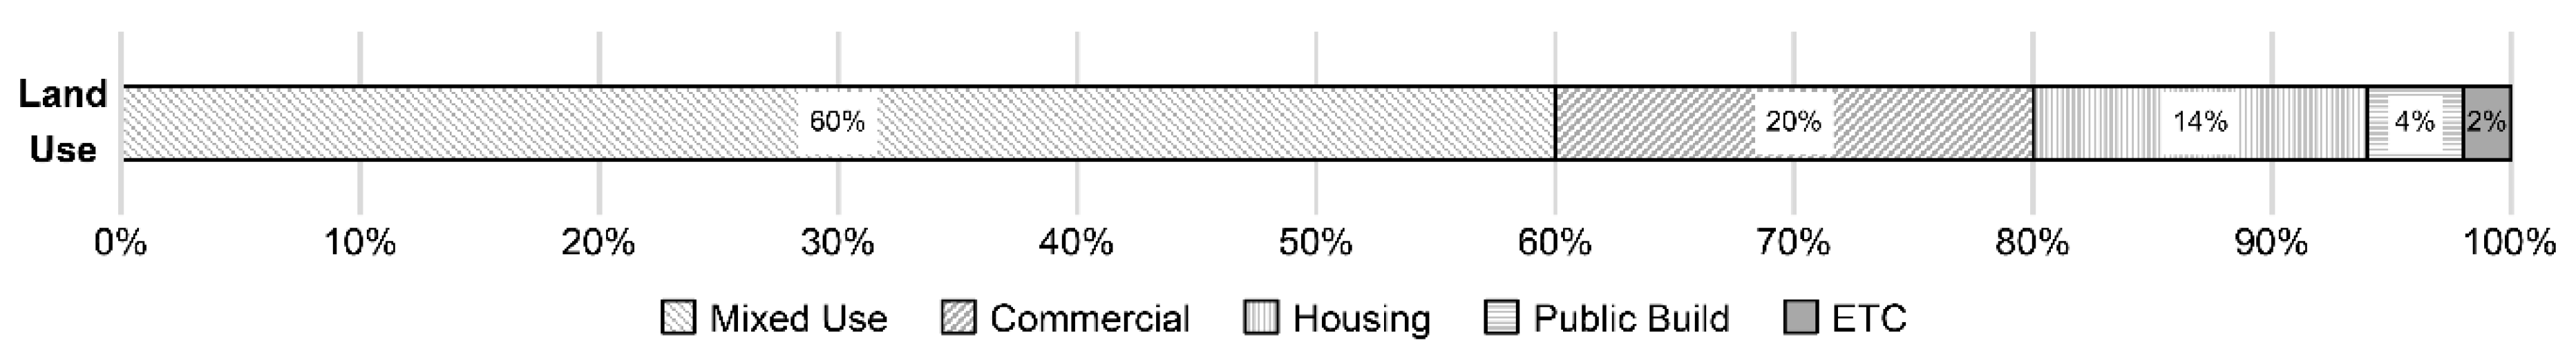
On investigating special planning area, buildings whose construction was completed after the year 2000, 27 out of 51 districts (~53%) were found to be up zoned. Among the 27, three were up zoned in two stages, for instance, from housing to commercial use. Looking at the main uses, it was observed that 31 were mixed-use and 6 were multi-unit housing. Hence, 37 out of 51 were developed as residential use. Furthermore, among the 27 up zoned districts, 23 (~85.2%) were developed as multi-unit housing, implying that developmental emphasis was on residential facilities. Figure 3 shows the current situation of land use. After the development, the use is biased toward the semi-residential complex area.
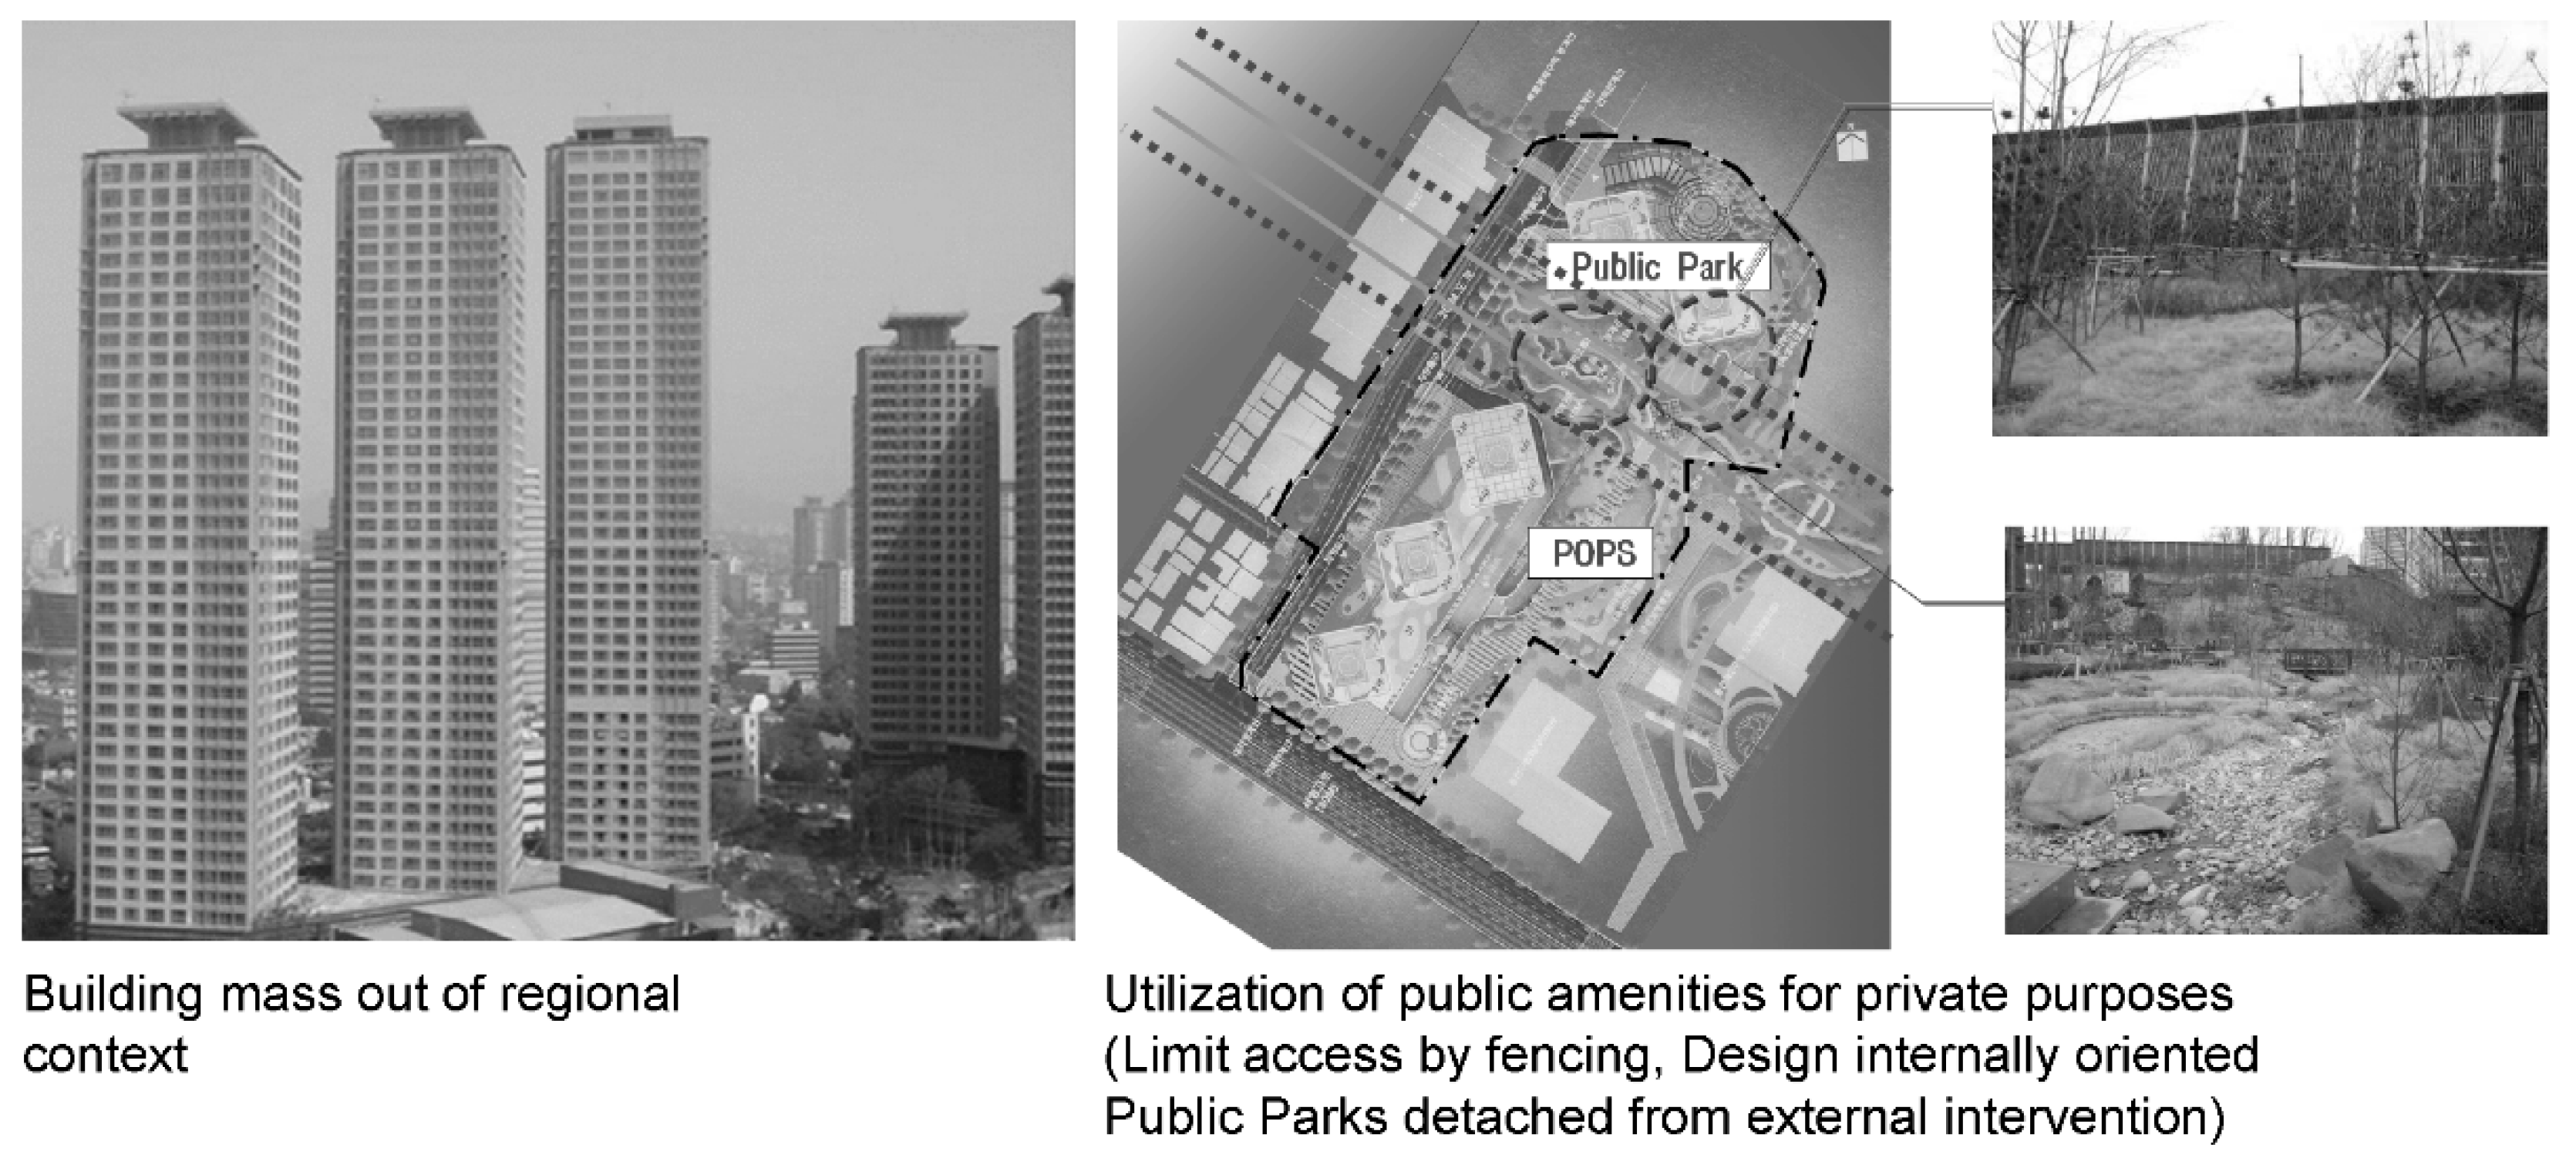
The reason for such emphasis on residential development within special planning districts can be attributed to excessive advantages granted for residential developments and intents of up zoning. At the time of development, the local governments actively supported private development to promote regional development. In that process, the local governments actively utilized the FAR bonus and allowed for changing the existing residential areas into quasi-residential areas. That is, the heads of local governments provided development merits to private business operators and up-regulated use zoning, leading to the dominance of the development of residential complexes. More specifically, Seoul’s regulations allow mixed-use buildings only in semi-residential areas and higher; thereby, private developers can secure a commercially profitable building density. Therefore, special planning areas designated as semi-residential development areas can be regarded as appropriate for pursuing mixed-use building constructions. However, there is evidence of adverse effects. The excessive real-estate development focused on residential-oriented mixed-use buildings resulted in the creation of a building mass that was unsuitable in the regional context, as well as in privatization of public space. Figure 4 presents examples of public facilities secured by private development that is not aligned with the public objectives.
The area of the development projects ranges from 1503 m2 to nearly 148,784 m2, exhibiting wide distribution across the project site scale. However, the most abundant size is less than 20,000 m2 (more than 78% of the project). Furthermore, seven of the project parcels are less than 5000 m2. These were considered difficult to engage for public use and, hence, exploited.
3.1.2. Current Situation of Public Amenities Construction via Private Sector Development
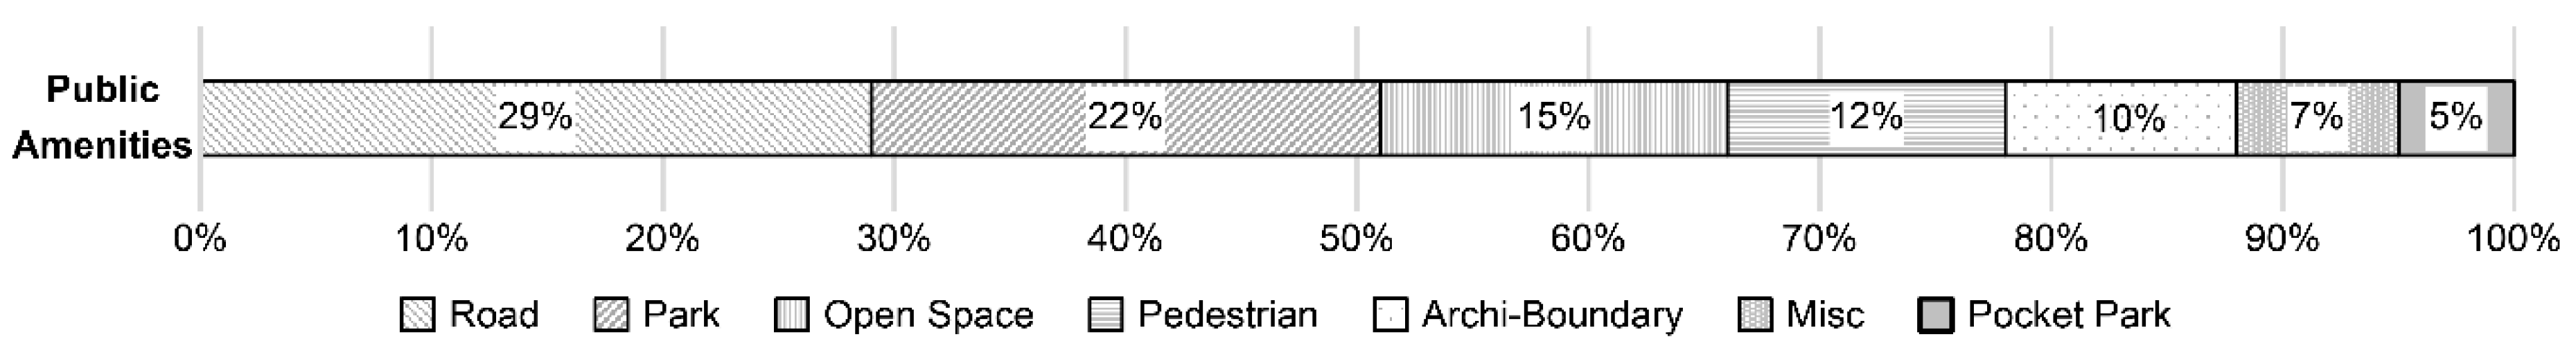
Among the public amenities secured through the FAR bonus, those donated to the public as parks and roadways amount to 144,066 m2 and spaces opened to public without transfer of ownership, such as open public spaces and pocket parks amount to 101,876 m2. Consequently, a total of 245,942 m2 of land was apparently acquired and developed, through special planning districts, as public space. This implies that more than 19% of the total area has been secured as public open space via incentive zoning. Such public facility land acquisition is the most significant benefit to the public by using the FAR bonus system. Figure 5 presents the quantum of public facilities built through incentive zoning technique, an aspect of the urban planning policy. Although it was a private development project, it secured more than 70,000 m2 of urban infrastructure, such as roads, more than 100,000 m2 public parks, such as parks and POPS, and more than 70,000 m2 of public open spaces, such as public walkways.
3.1.3. FAR-Bonus Requisite Implementation Results
Investigation of different types of public facilities receiving bonus and their actual implementation revealed the following. Table 3 summarizes the FAR bonus items approved in 46 case areas. Among the incentive items, the most frequently applied items were the recommended use, the POPS, and the pedestrian path. The highest number of items were applied in cases 1, 3, and 16. The areas with the highest volume rates are cases 1, 22, 33.
The following is a detailed description of the cases with many FAR bonuses. First, in Case 3 (Table S1 provides the exact site names), where the highest number of bonus categories were fulfilled, 300.6% of the FAR bonus was received over 15 separate incentive categories. Case 1 received 333.76% of FAR bonus in 11 different categories, Case 22 received 281% of FAR bonus in over 8 categories, and Case 33 received 333% of FAR Bonus in over 7 categories. The reason for such a high FAR bonus is that there is no selective process based on each region’s necessity. Instead, all the items listed in the indiscriminate guidelines that are procurable by simple installations were fulfilled to drive up the achievement rates. In other words, the result is derived from the current system that solicits selective application of FAR bonus items, in favor of the developer, to obtain the maximum FAR permitted by law.
3.2. Interpretation of the Data
3.2.1. Characteristics of FAR Bonus Categories and Implementation Frequency
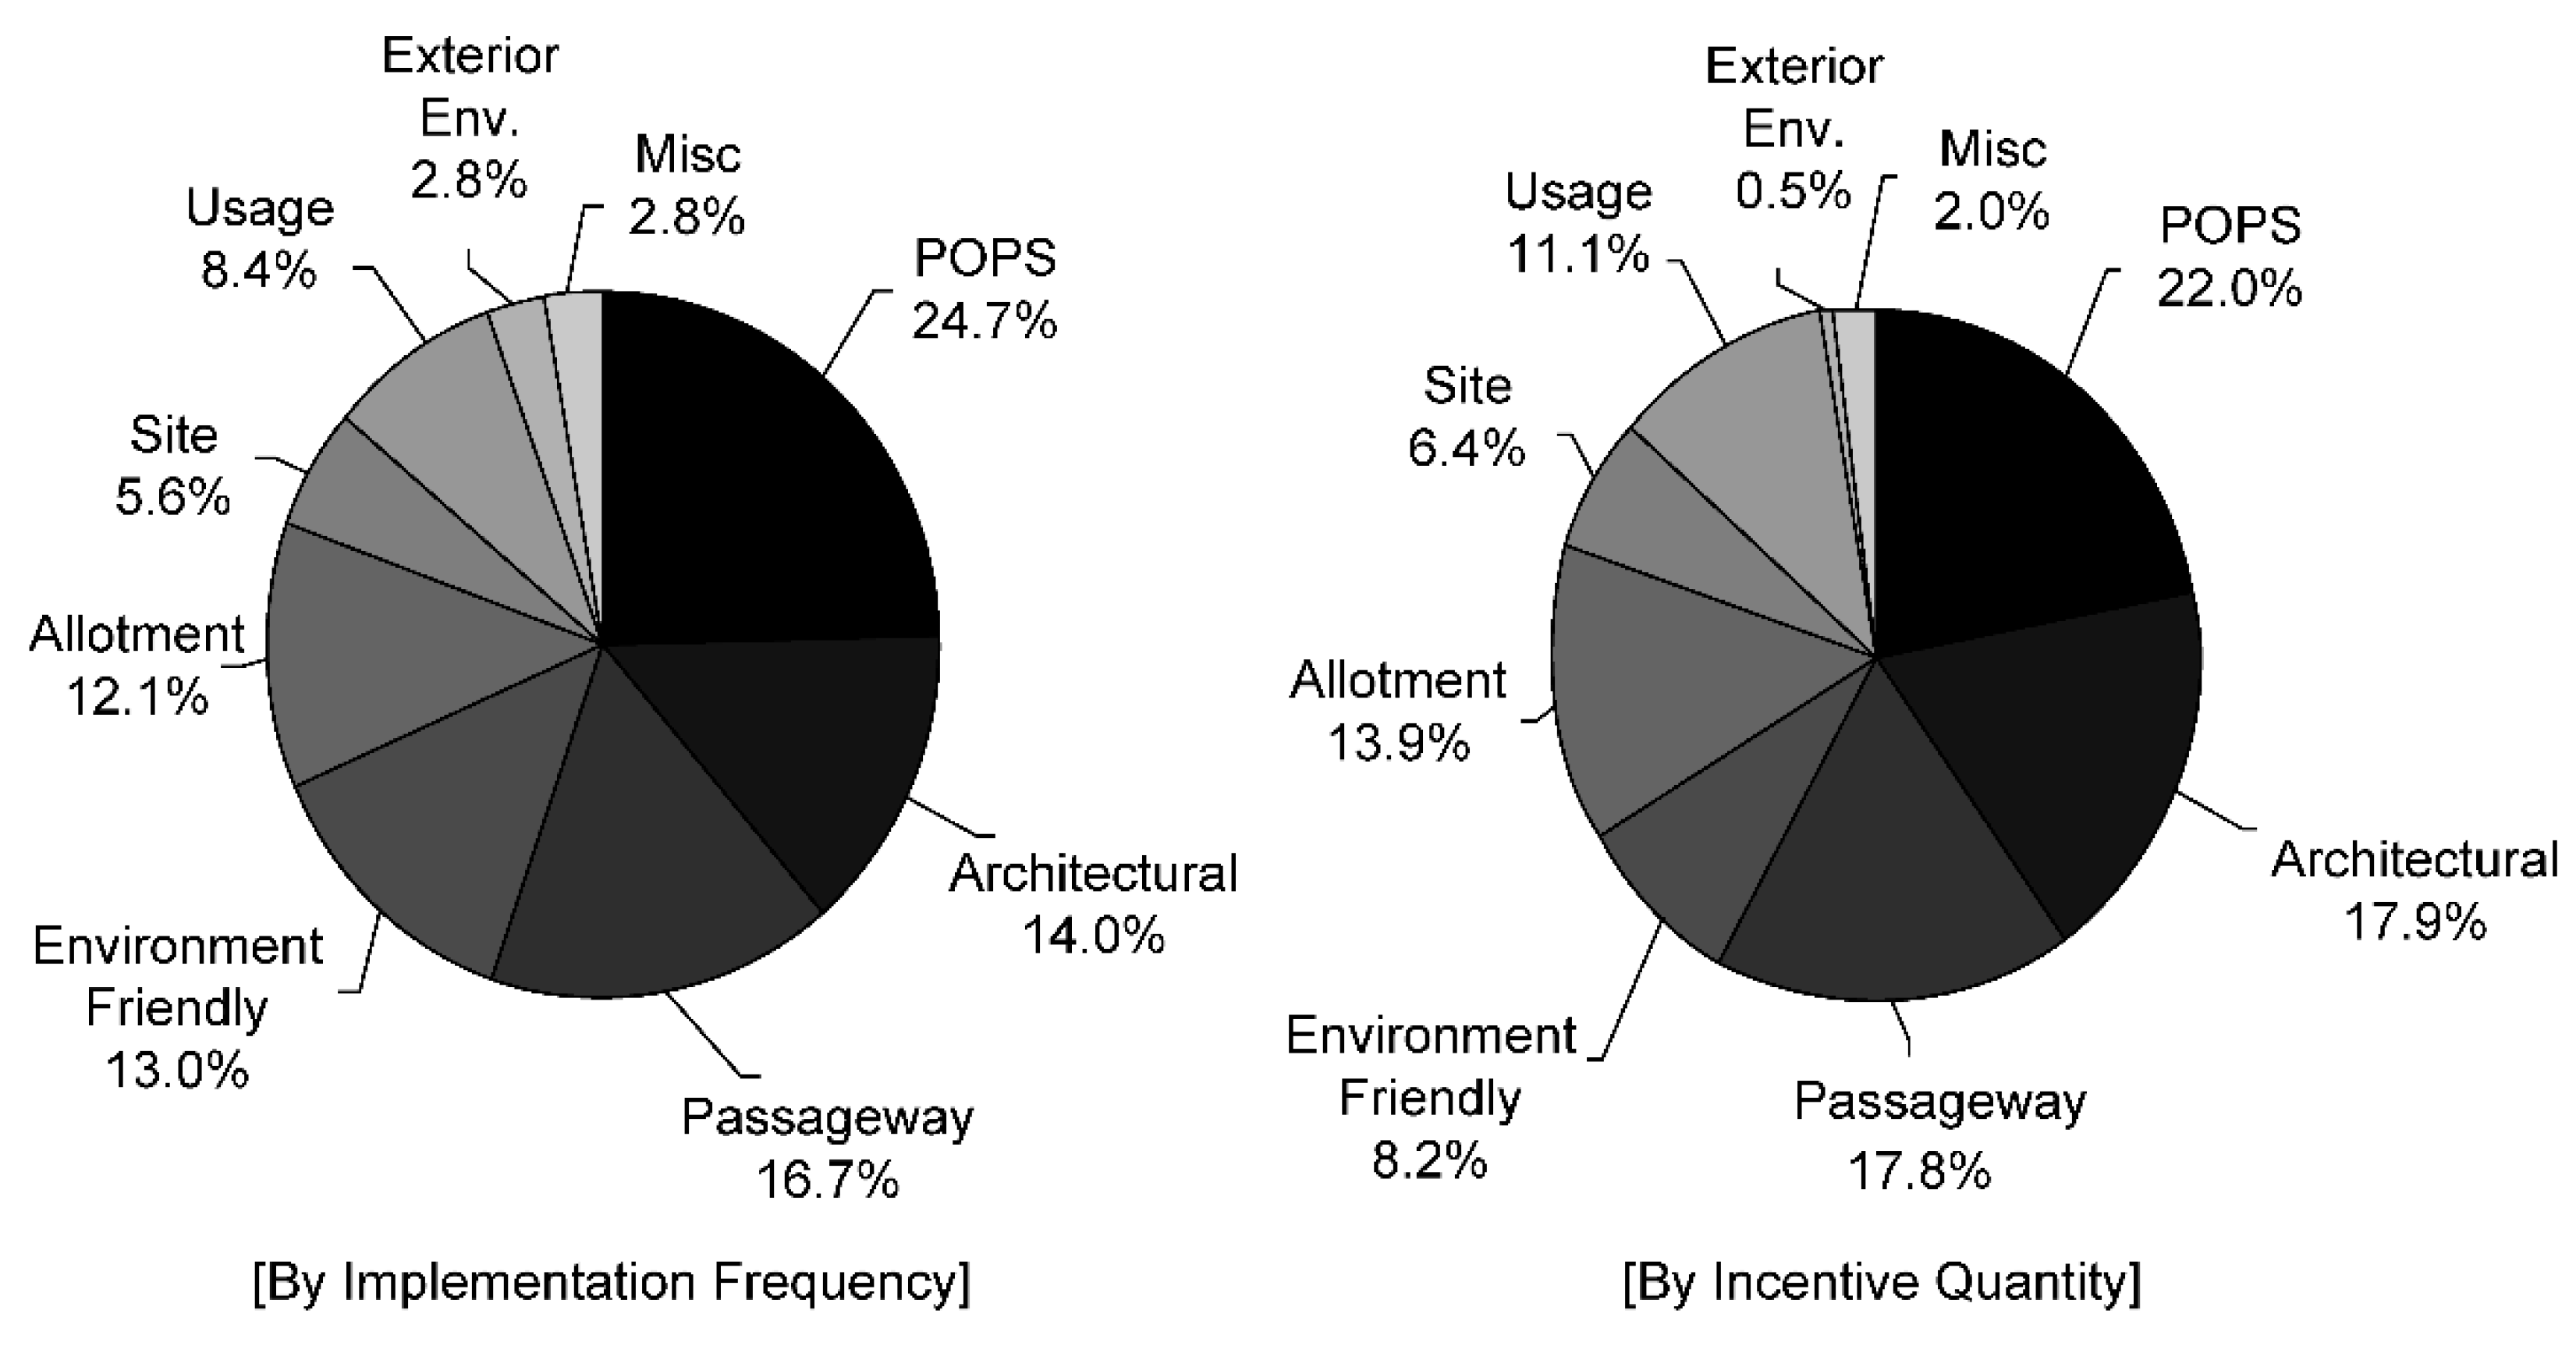
A comprehensive investigation of the FAR bonus categories revealed a total of 215 implementations. Figure 6 shows the implemented incentives by frequency and magnitude of the incentives provided. According to Figure 6, out of the nine plan elements in total, POPS, architecture, and passageways account for at least a half, indicating that they are the public facilities provided the most frequently to receive FAR bonuses. Furthermore, POPS, architectural (tower-shaped building, etc.), and passageway are both high in “implementation frequency” and “incentive quantity.” On the other hand, landscaping and recommended uses have recorded the lowest rates. The detailed characteristics of the items with high or low frequency are as follows.
A compendium of survey results showed that categories with the highest frequencies were those under “POPS”, “Architectural”, and “Pedestrian Path”, constituting a total of 55.3%. Such lopsidedness can be attributed to three main reasons. First, these categories are prerequisites that must be fulfilled as part of the general construction project. Second, they require only minimal additions and adjustments to the standard building codes. Last, considering the associated expenses and the conveniences, they are very favorable to the developers.
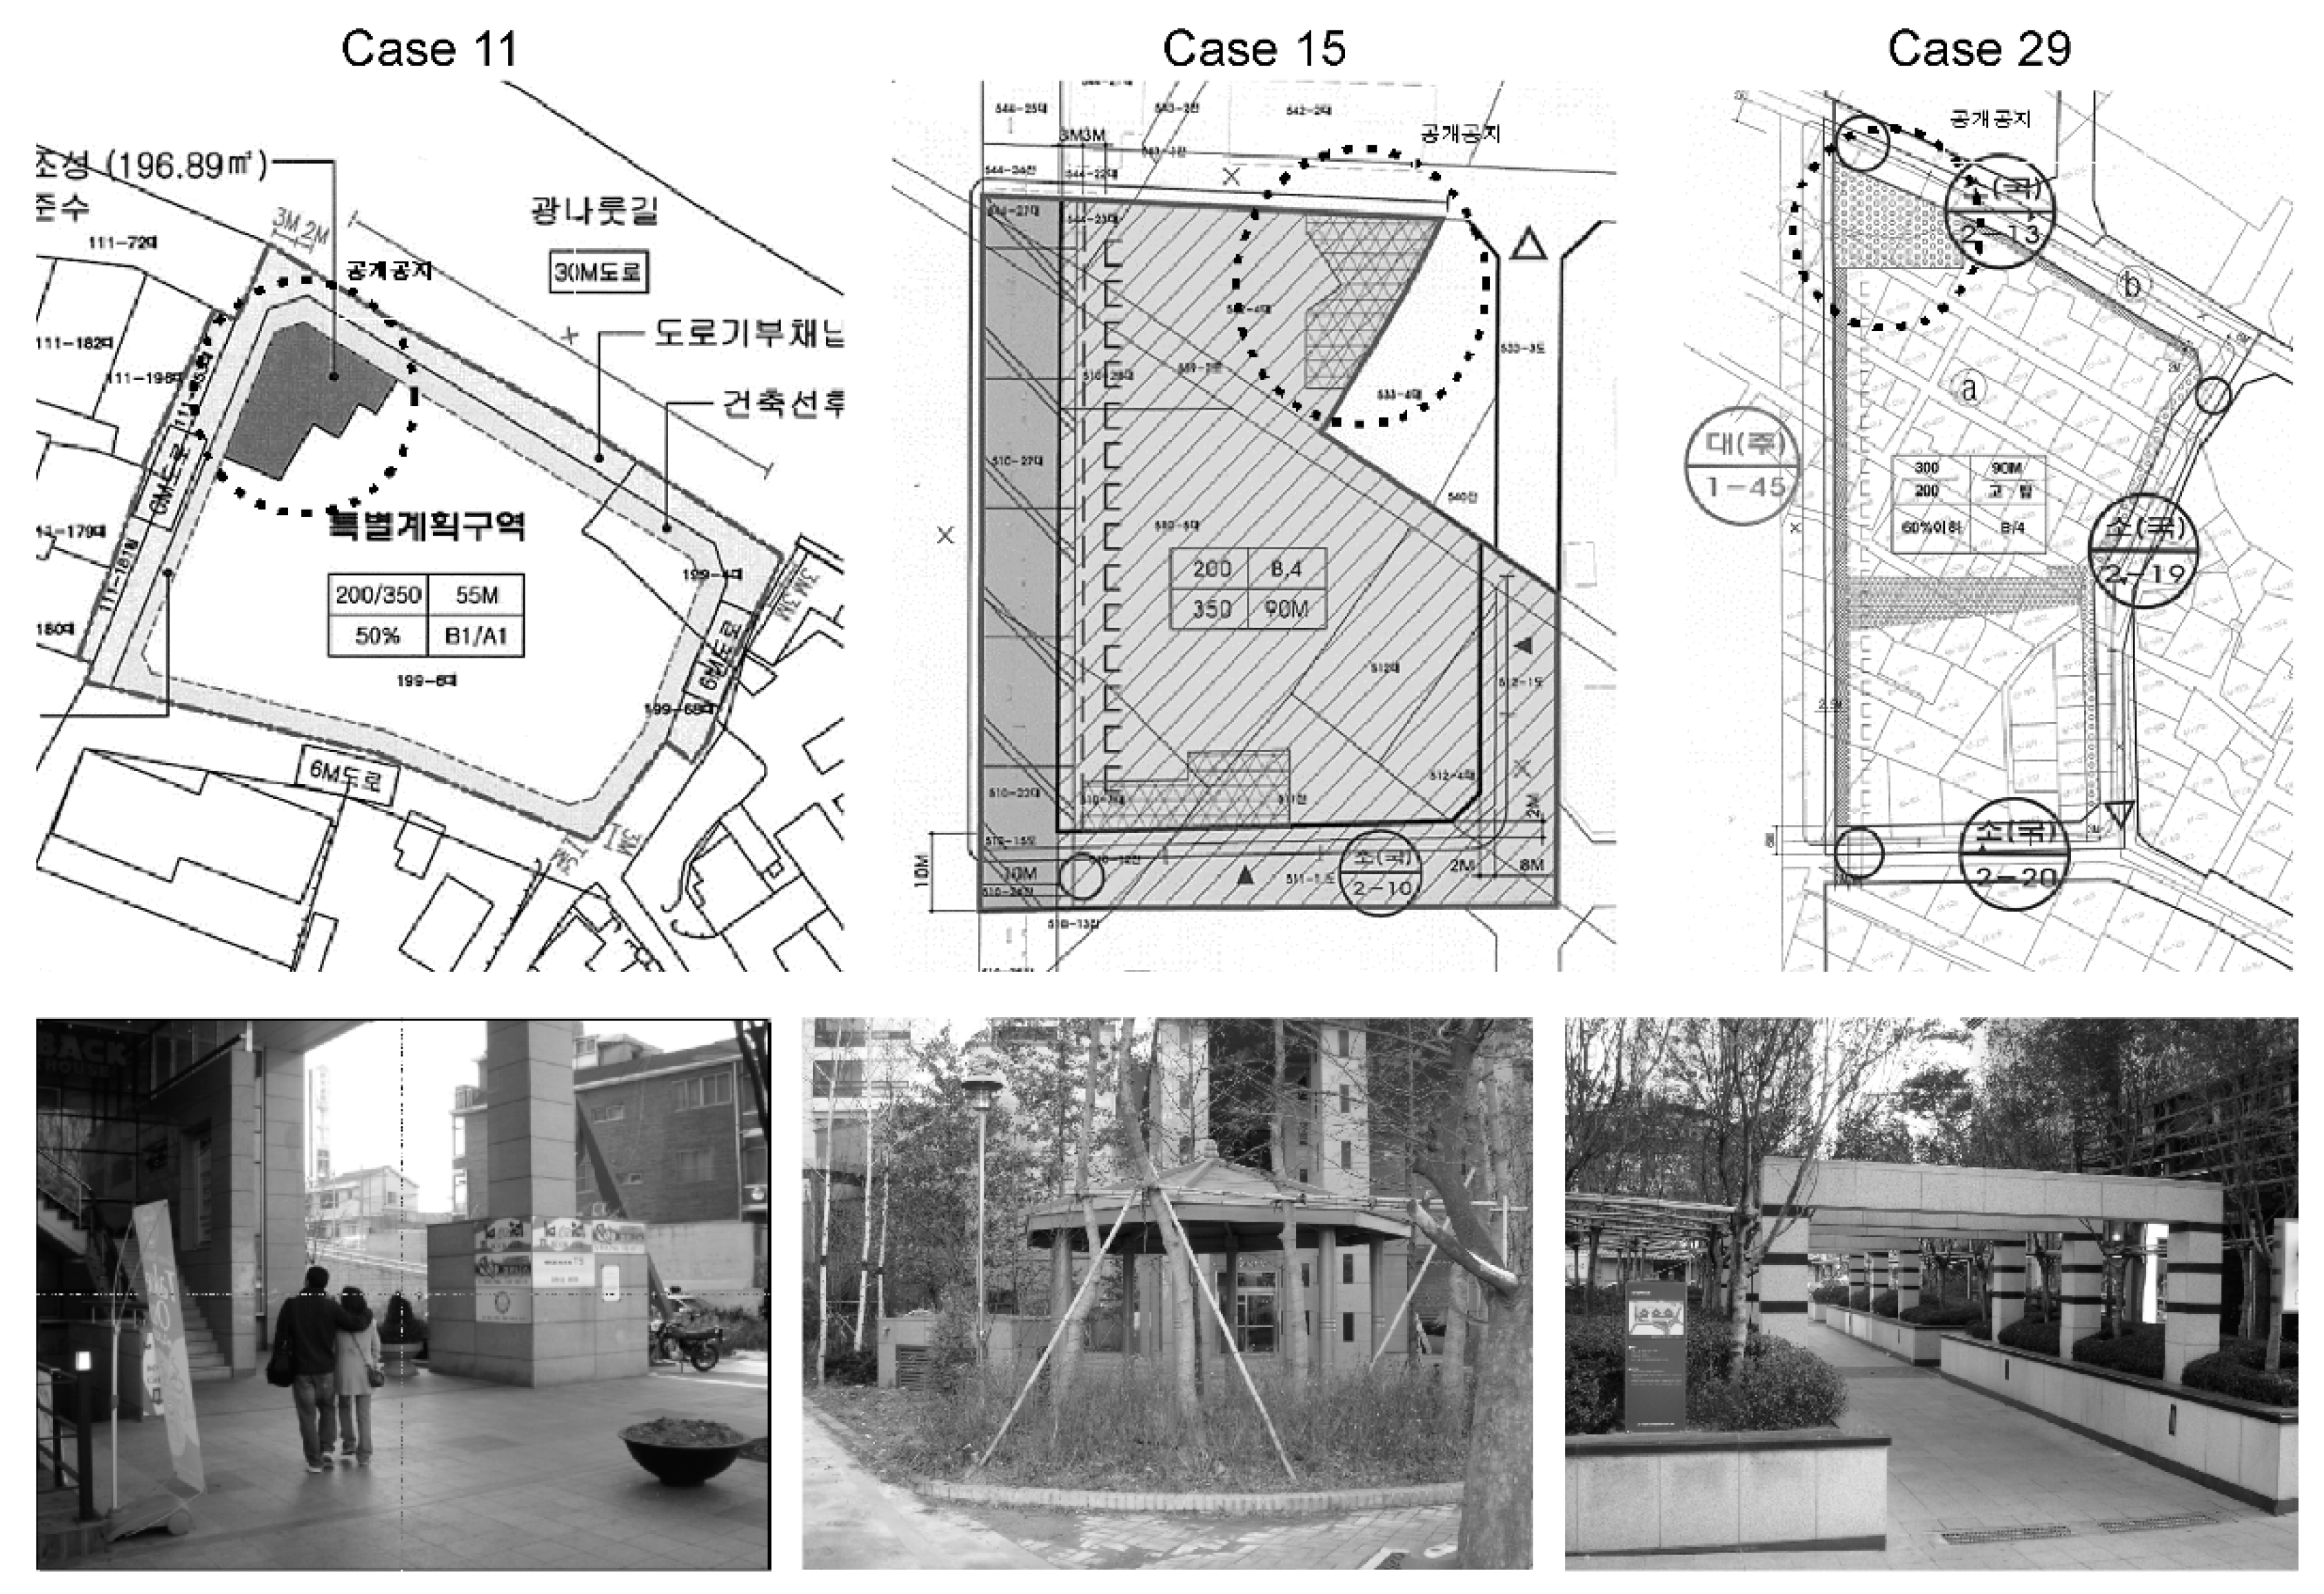
Although the quantitative results suggest development of open space and controlled building mass, the qualitative aspects, as well as actual public benefit impacts, are not fully warranted. As we can observe in Figure 7, Case 11, Case 15, and Case 29 have similarly accomplished incentive items related to the location of open space, receiving a 20% FAR incentive. However, the actual open space in Case 11 is not in harmony with the surrounding urban planning facilities and has been observed to be privatized, thereby eliminating potential public benefit. Cases 15 and 29 were found to have secured a pedestrian path by using architectural boundaries. The passageway was used as a “Path to Walk”, which plays a major role in providing connection to Han River Citizen Park. However, the open space created by a FAR bonus in Case 15 is rather inadequately connected to the “Path to Walk” and provides relatively insufficient public benefit when compared to the nearby Case 29.
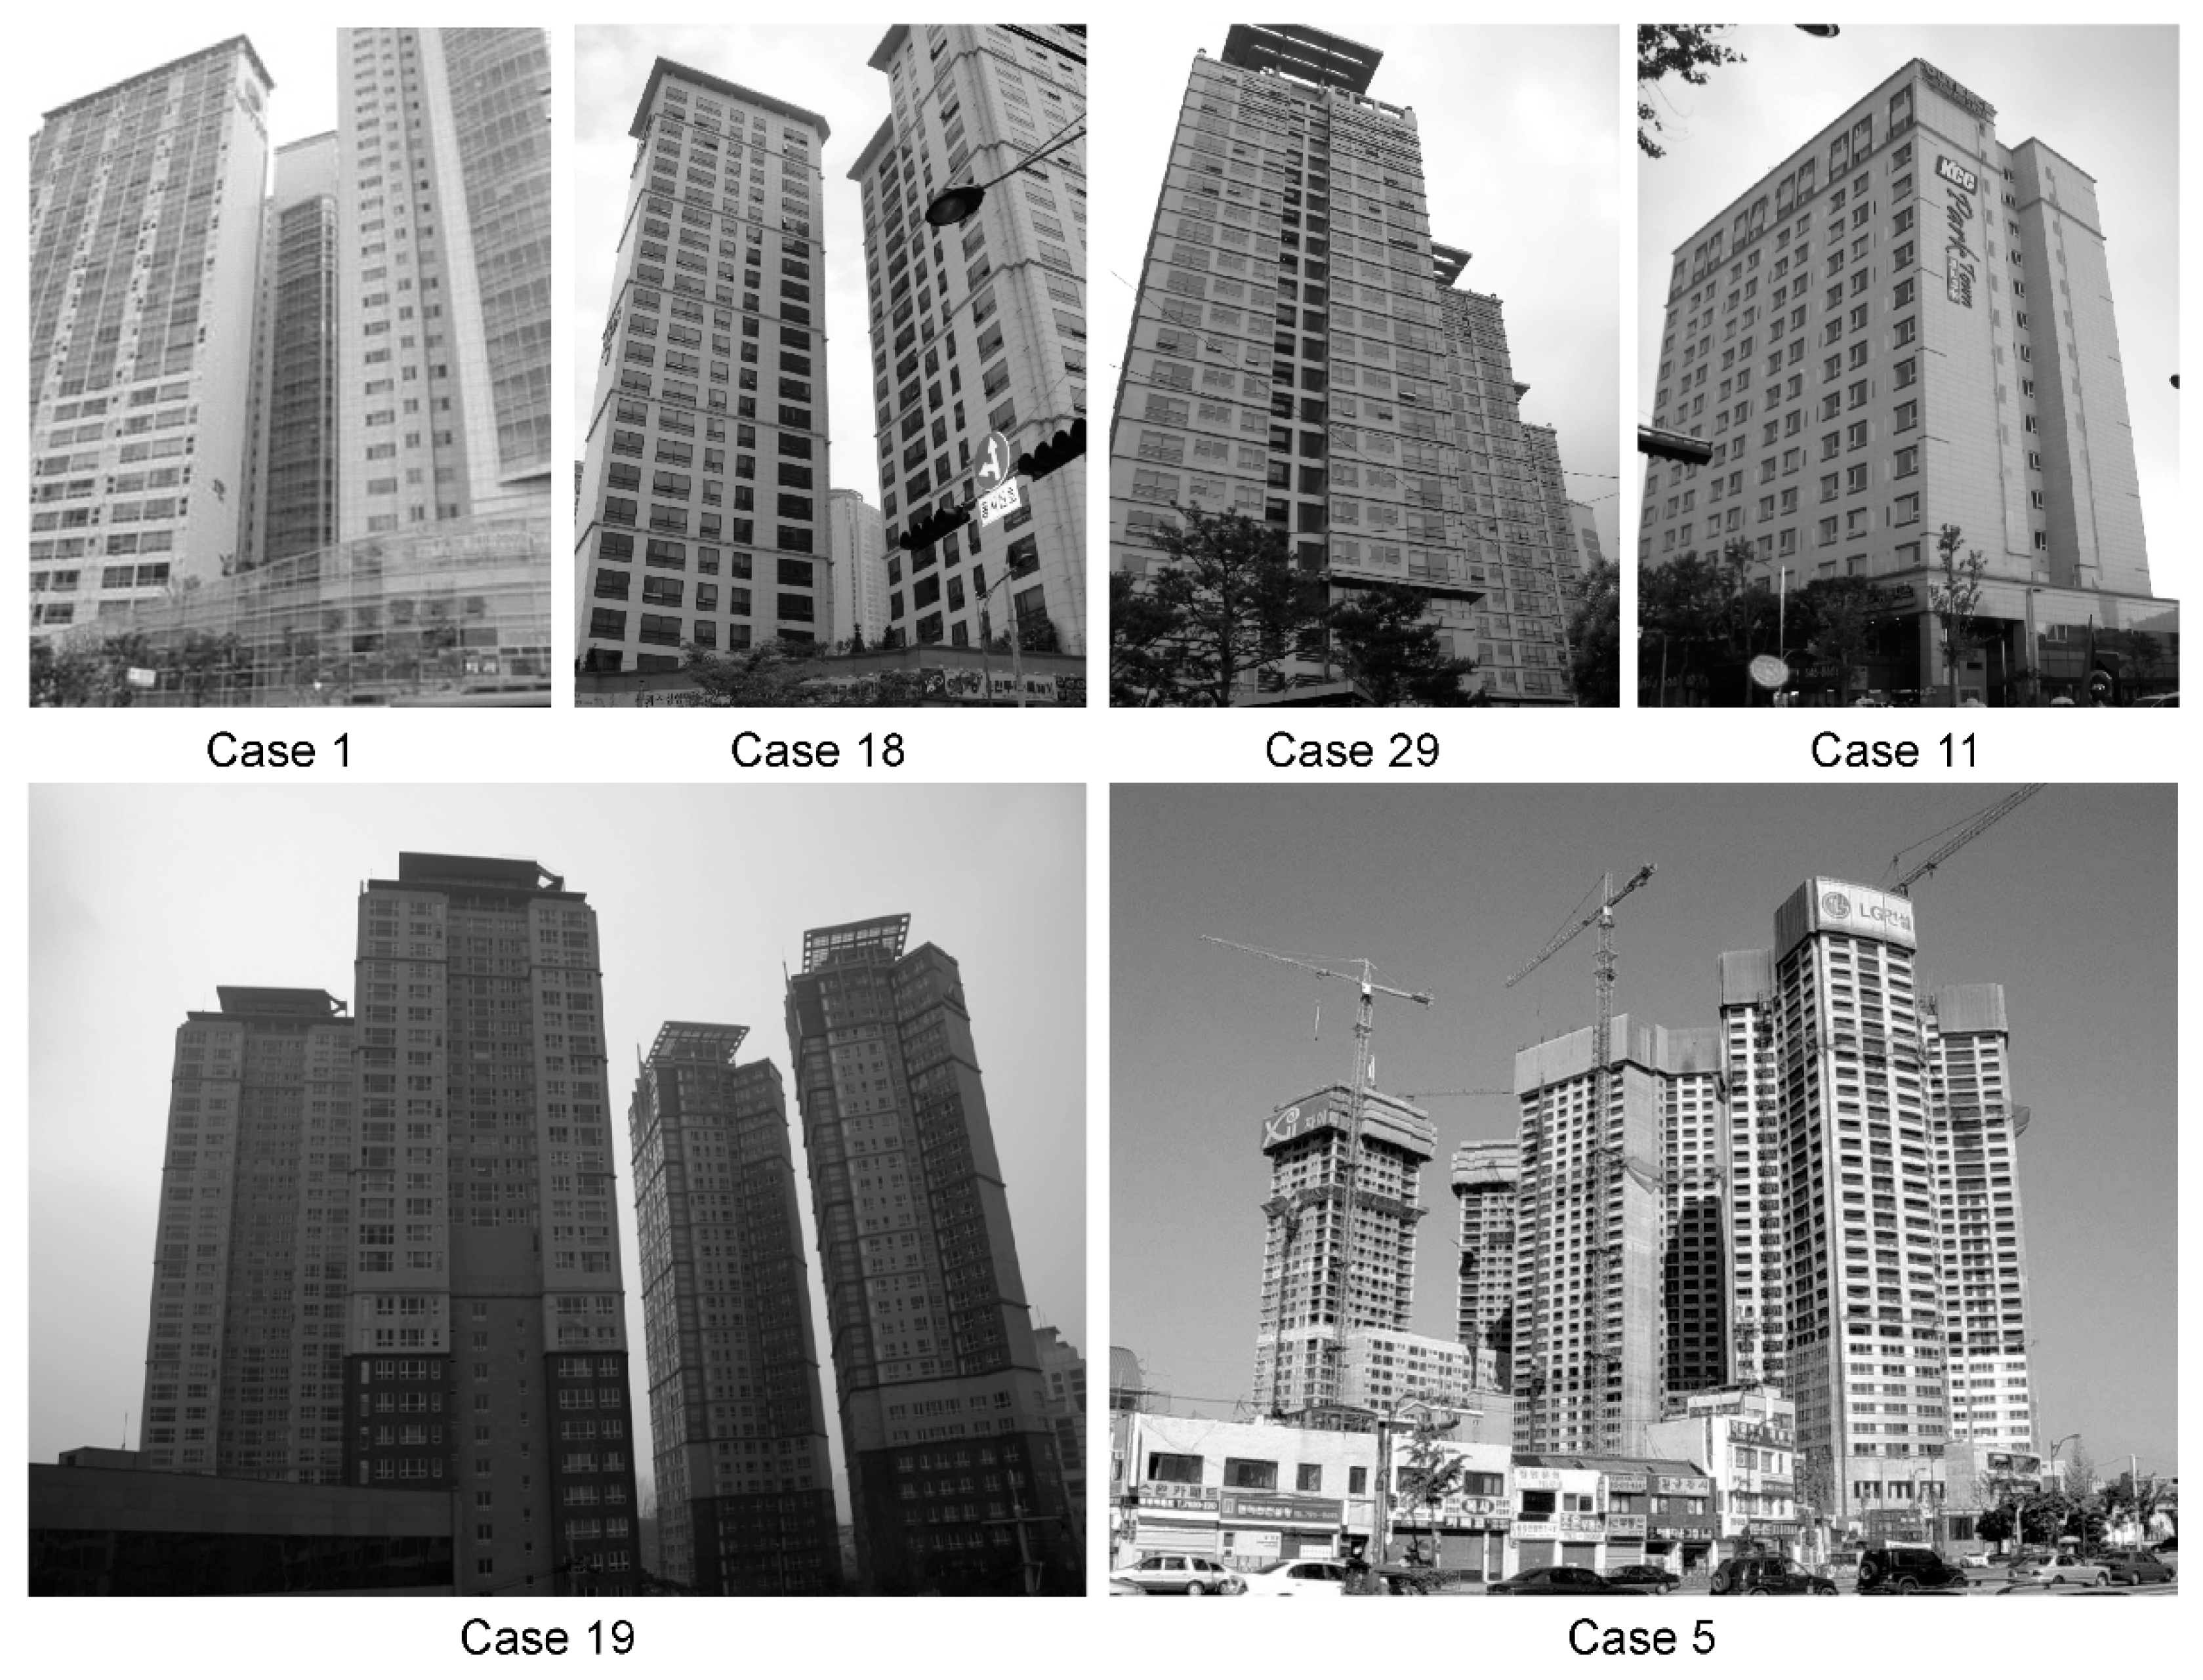
The second most implemented, tower-shaped buildings, received 10%~20% of the FAR bonus when constructed with less than 40% building coverage. Tower-shaped buildings are favourable to the developers because it is possible for them to gain extra FAR bonuses without any additional cost. Moreover, in the current housing market, where the preference is for tower-shaped buildings, developers will strive to fulfil this particular incentive requisite. However, the general standard for tower-shaped buildings only applies to the ratio of the base dimensions and there are no regulations concerning the landscape view and visual corridor. This leads to tower-shaped buildings that are designed in such a way that they obstruct the view badly. Figure 8 shows buildings that received a FAR bonus in the category called tower-shaped building. Although the public objective of these buildings was to secure the Visual Corridor, there was no specific guideline at the local level, resulting in a massive building complex overshadowing the beautiful scenery around. From the planning perspective, because of building coverage regulations, POPS, and tower-shaped buildings are intimately interconnected (when one of the three is planned, the other two naturally follow), the current incentive system overlaps in these categories. In other words, because the open space for tower-shaped buildings is typically first acquired through the stricter building coverage ratio regulation (building coverage ratio less than 40%), providing FAR-bonus for each category is duplicative. In reality, the areas where tower-shaped building incentives were applied, other incentive items under POPS were mostly fulfilled as well (in 15 out of 17 study areas). All four study areas that had received the FAR bonus under building coverage ratio regulation again received a FAR bonus under the POPS category, and in two study areas (Case 1 and Case 37), benefits were gained from overlapping the bonus by qualifying for all three categories. Hence, consolidating POPS acquisition from building coverage ratio regulation (40% qualification) and the tower-shaped construction requisite should be considered in order to apply FAR incentives justifiably. Redundant incentives for tower-shaped buildings not focused on visual corridor preservation or citizens’ convenience should thus be avoided.
Excluding the miscellaneous category, the lowest frequencies of incentive categories implemented were seen in landscape expenses followed by recommended usage. Landscape expenses were observed, in many cases, to overlap with other categories, such as POPS and green roofs. Furthermore, it was only seen in two of the study areas, thereby showing a lack of dispersed implementation. The study areas that did not satisfy the requisites for the recommended building usage category were found to have been planned otherwise, because the designated/recommended usage consisted of non-housing uses, such as public and cultural spaces.
Among the incentive categories in the current system of district unit plan guidelines, parking-related requisites (especially public parking) are difficult to achieve, and therefore, impractical as an incentive category.
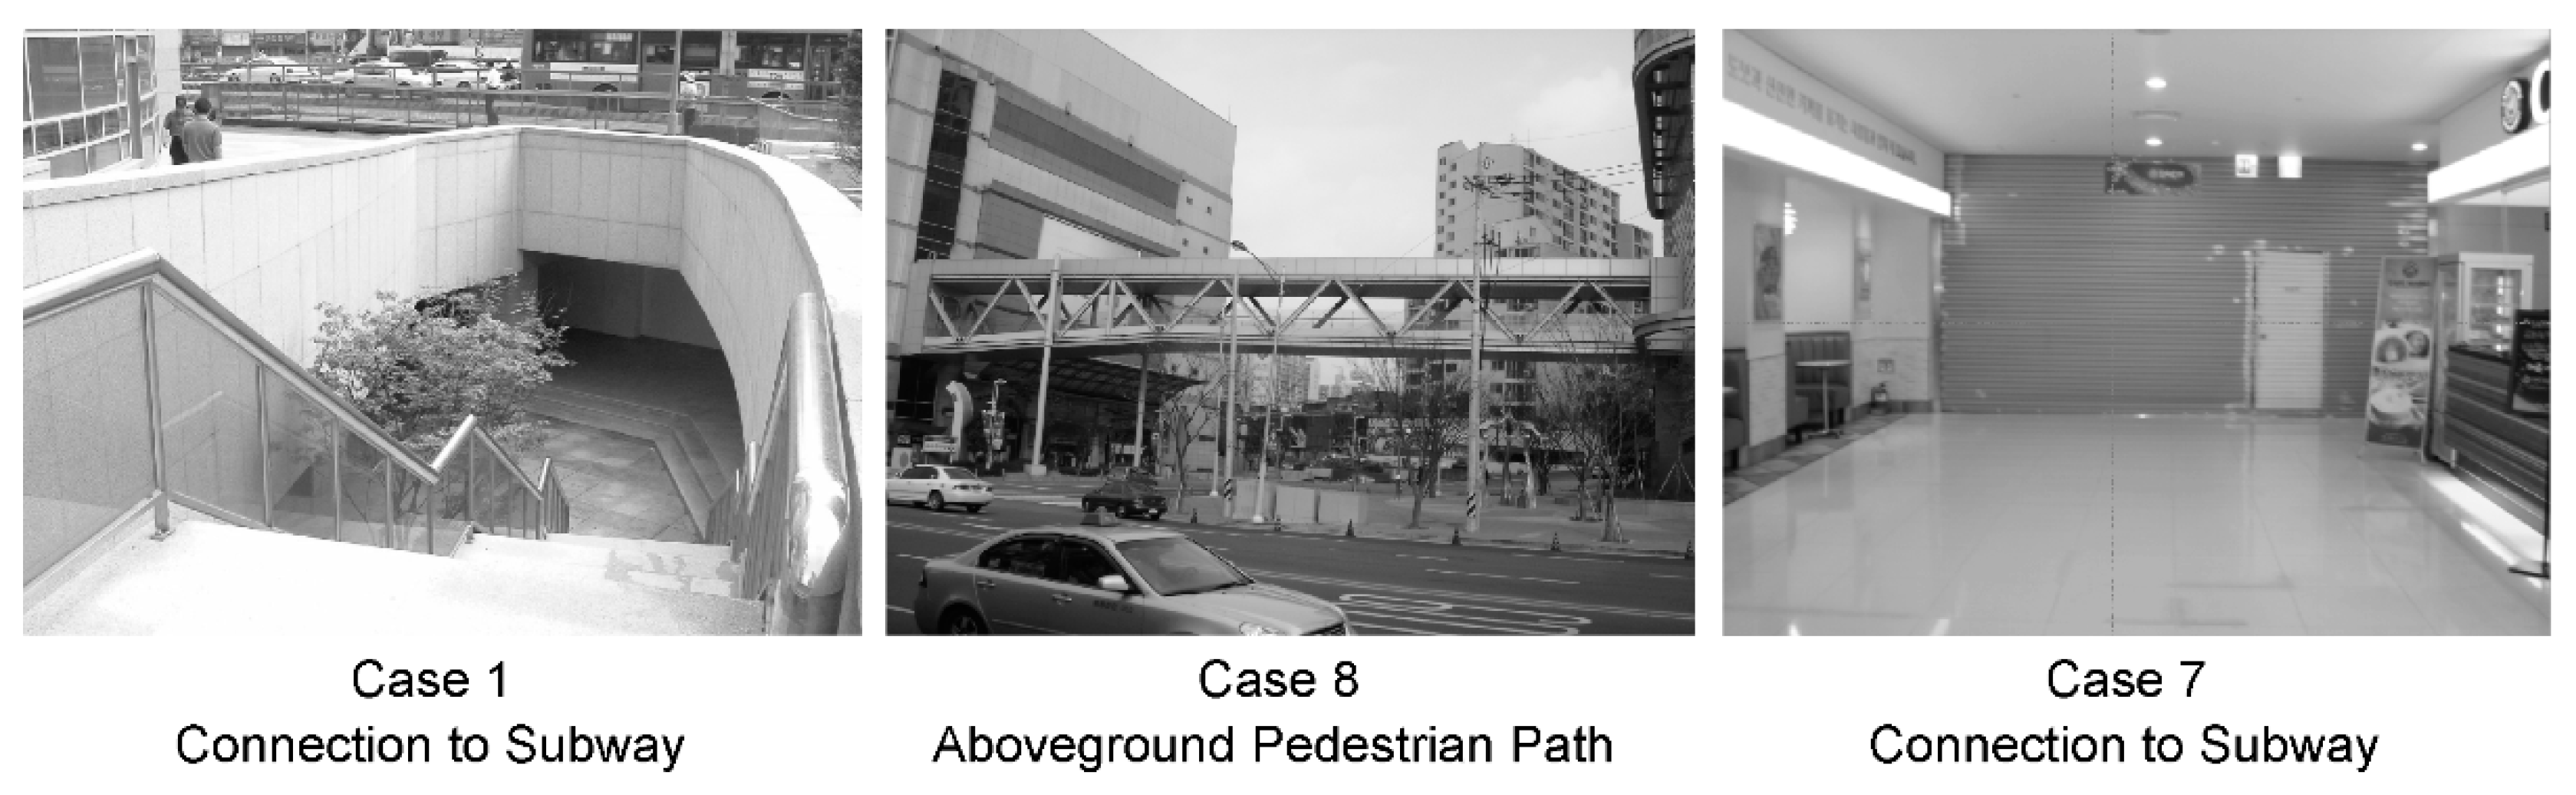
Low frequencies are observed in above/underground passageway. This may be attributed to the limitations imposed according to different regions’ specifications. Areas in the vicinity of transit stations demonstrate this challenge. A pedestrian path connecting directly to a subway station or an aboveground passageway that connects buildings on the upper level via a sky pass produced debatable questions. Public accessibility of such a passageway is uncertain, because most passage decks are constructed to function as a direct connection to the building itself and, hence, its users are almost exclusively limited to the building occupants. Figure 9 shows the existing condition of public walkways. Case 8 is controversial because it functions as a passage directly connected to the commercial building and its public use can be disputed.
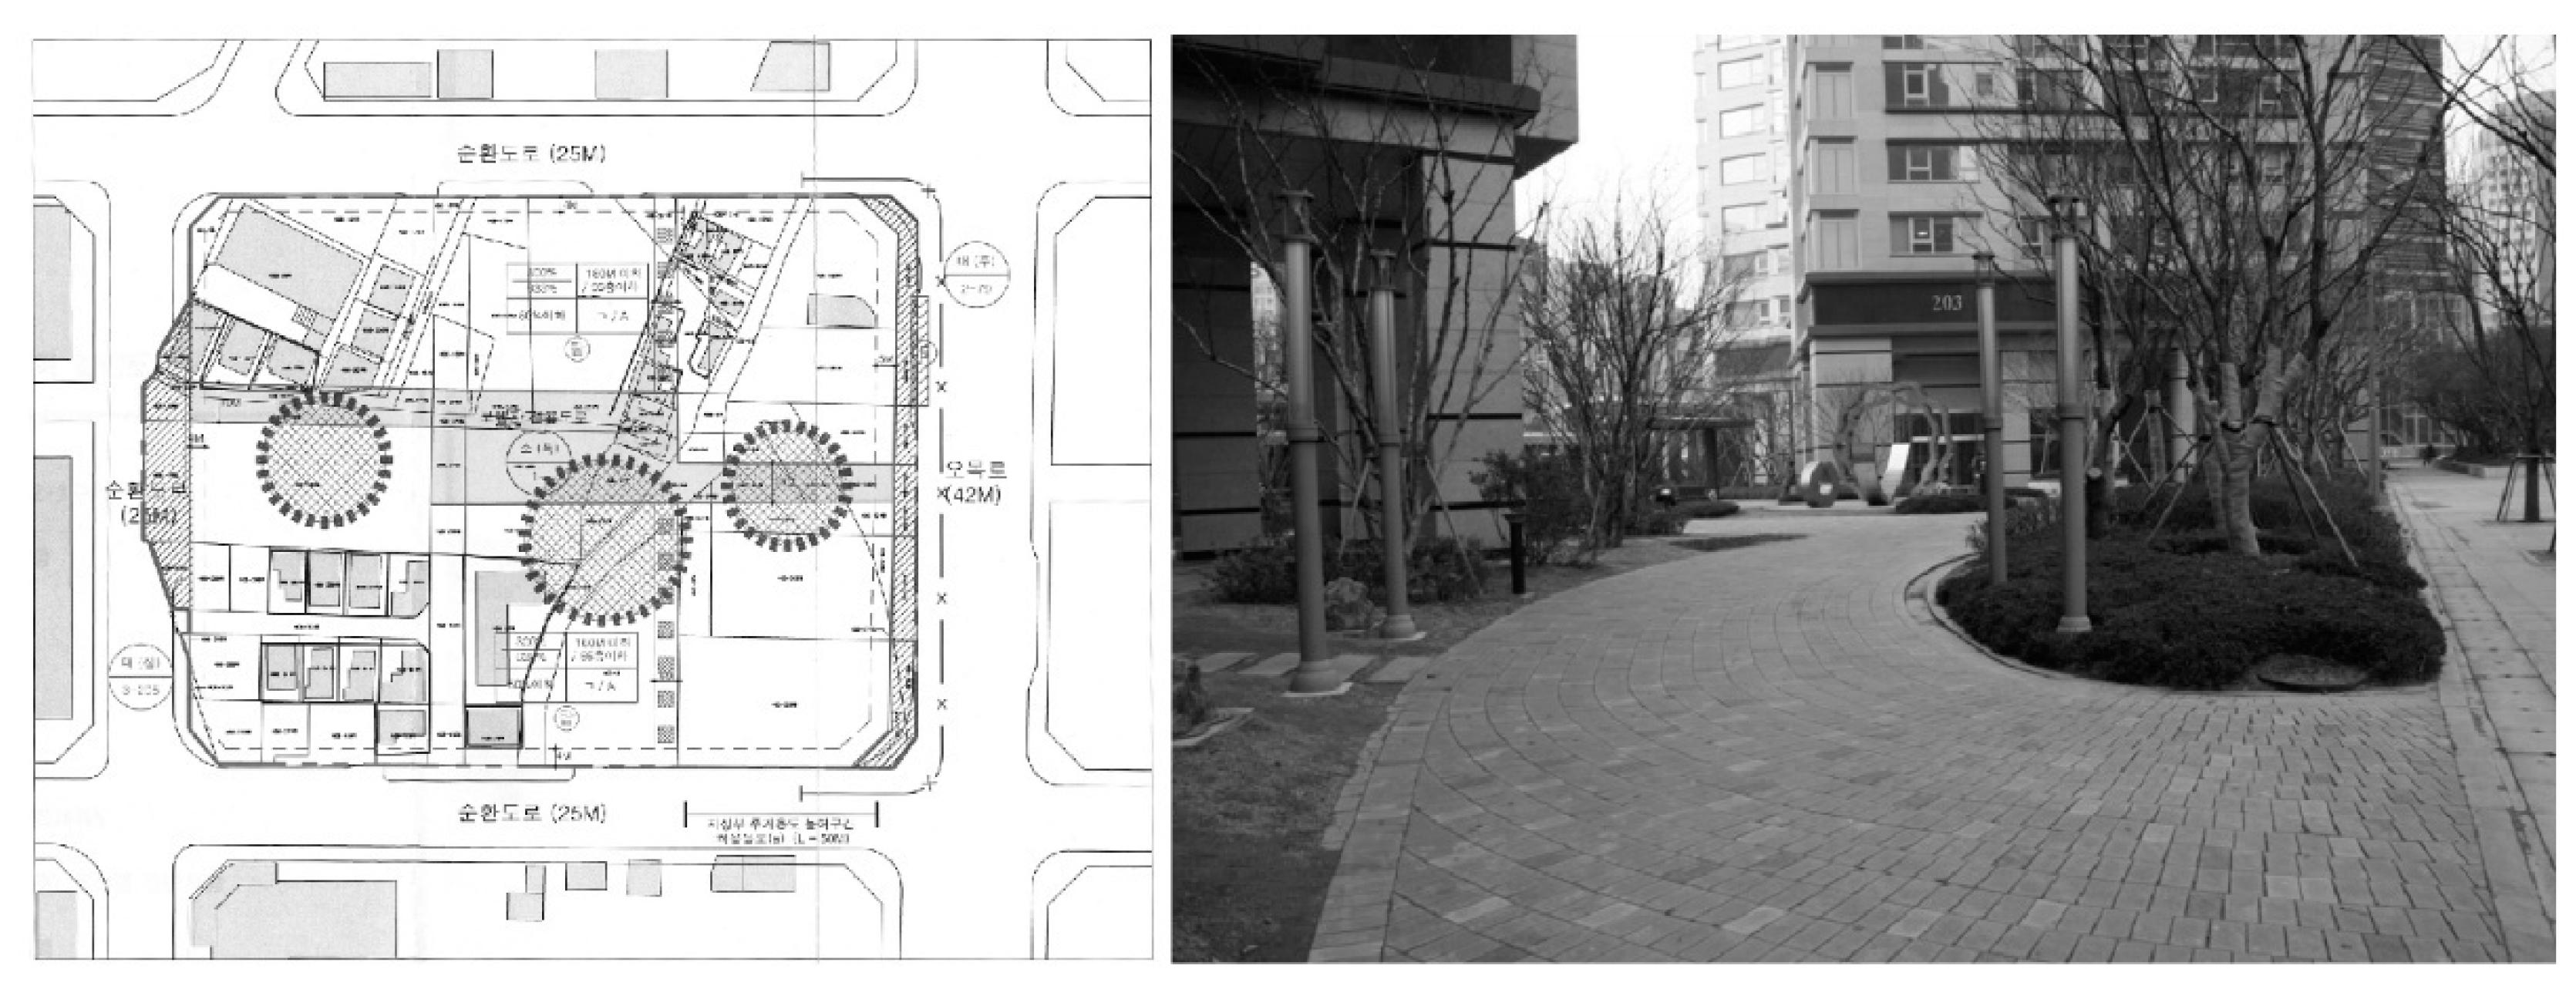
The investigation revealed that the inconsistent volume percentage criterion was also a problem. In Seoul, the criteria for current FAR mitigations are concurrently the absolute and relative standards of the early 2000s. For instance, fulfilling POPS requisites will receive a 10% FAR bonus, as well as a bonus from the construction law, wherein additional surface ratio can be awarded. In addition, similar to Case 15, Case 33 received overlapping FAR bonuses regarding specific POPS placement and again for its surface area. Case 42 also received multiple FAR bonuses for its compliance with lawful POPS and guideline requisites, as well as for developing the surface area. According to the design guideline in Figure 10, the pedestrian road penetrates between buildings, and the location of the POPS is specified as being on the pedestrian path of the road-like circles in dotted lines. Therefore, the developer was given two kinds of incentives, for establishing pedestrian roads and installing pocket parks at designated locations. This is an example of the effect of duplication in the receipt of bonuses.
Consequently, triple the amount of the original FAR bonus at the most has been identified as unwarrantedly granted to identical requisites. This is attributed to the fact that different FAR bonus categories are operated disjointedly in each autonomous district. Furthermore, instead of the original intent of seeking public contribution through the incentive system, the bonuses are used only as a means of maximizing FAR. It can be concluded that FAR mitigation requisites for preserving and promoting public benefits has instead provided inconsistent and unjustified bonuses, without due investigation.
3.3.2. Public Facilities under Conditions Where Publicity Can Be Hardly Realized
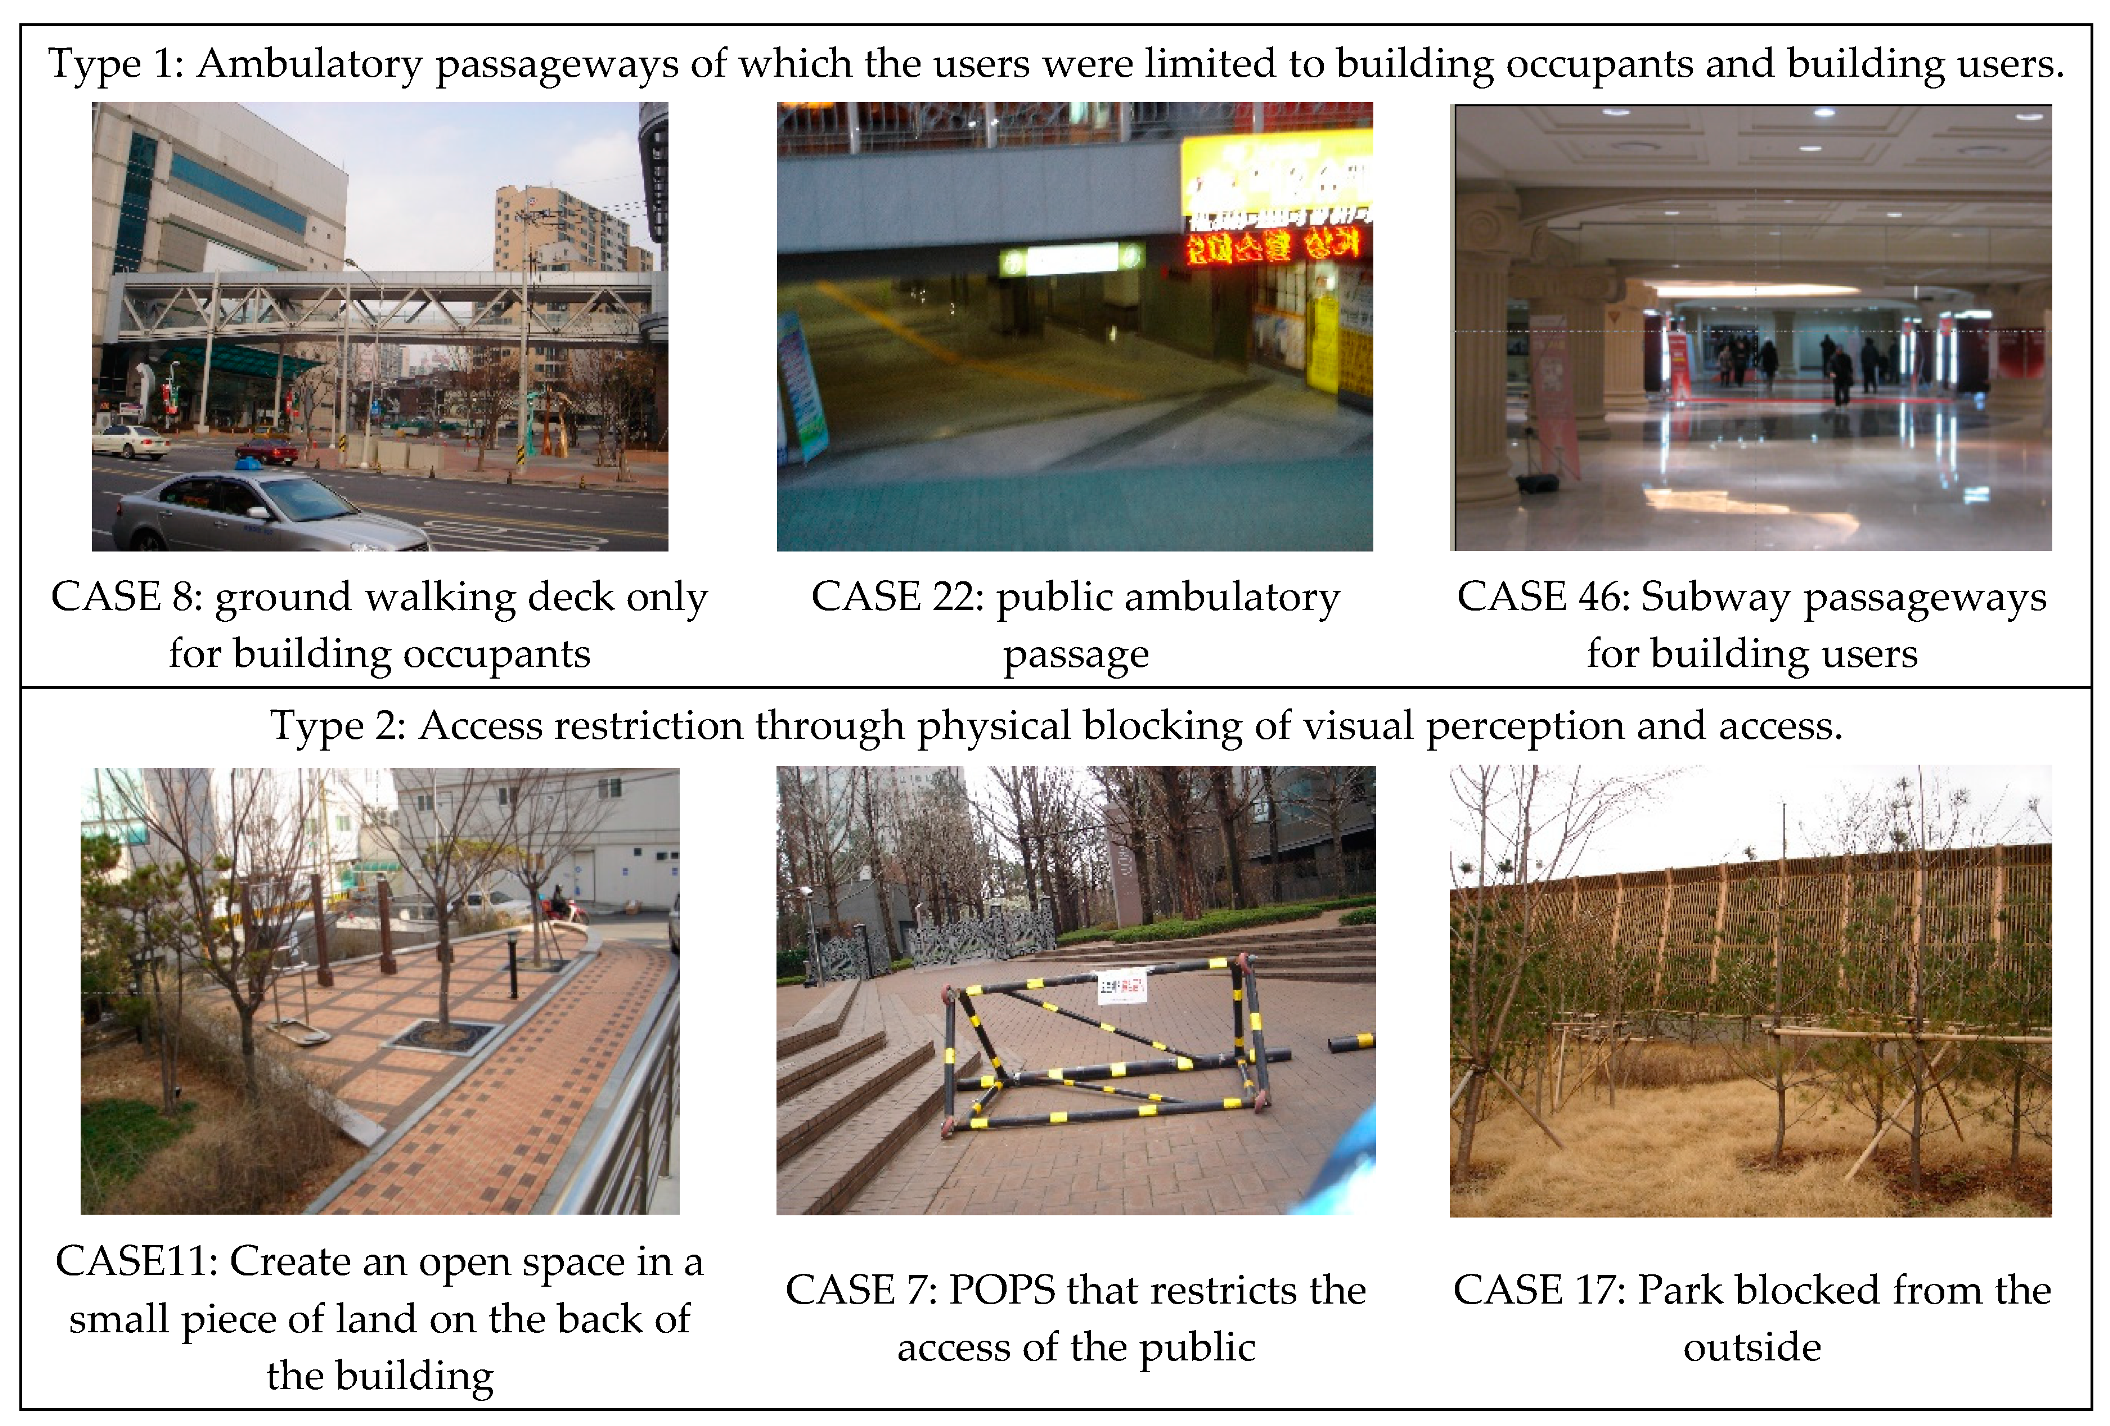
Public facilities that have been installed to receive incentives should serve many individuals, in light of the purpose of the facilities. That is, if there are plan elements or intentions that limit the use, then obstacles have occurred in demonstrating publicness. Therefore, public facilities installed to obtain incentives must meet three conditions, as follows: (1) External users should be included, (2) there should be no visual or physical obstacles, and (3) the facilities satisfy prerequisites for the exhibition of publicness. The relevant resources in the specially planned area were investigated with the three viewpoints, as such, and the representative facilities with conditions that make the exhibition of publicness difficult are classified as shown in Figure 11.
As such, facilities with conditions under which public utility value cannot be exhibited exist in diverse types. Cases in which the location’s publicness is hardly exhibited and the location has only private use occur frequently. Therefore, when judging the publicness, it should be considered that there is no publicity when there is a restriction on the use of facilities by “ordinary citizens”. That is, in the case of public contribution elements, it is desirable not to give a FAR bonus.
4. Discussion
The study results have revealed that urban planning policies achieved public objectives by exploiting opportunities for private development projects through incentive zoning in major areas of Seoul in the early 2000s. Local governments improved their urban environment without taxing the public, while private developers were reimbursed for taking on the burden of establishing infrastructure through volume rate awards.
This kind of “exchange process” is a useful environmental improvement policy in developing countries experiencing rapid urbanization, as like East Asia. The total of 46 areas covered by this study amounts to 1,284,410 m2. About 20% (245,942 m2) of these areas were created as public open space and private operators secured additional building areas of about 882,000 m2. Therefore, incentive zoning has efficiently facilitated the development of city areas in Seoul.
However, there is bias in the incentive implementation categories. In addition, we found the predominance of a severe imbalance in the quantification of the different implementations. The study has shown that, among the 21 incentive categories, POPS, architectural, and pedestrian paths made up more than 55% of the total implementations, since it was convenient to fulfil these requisites and the undemanding installation process was relatively less expensive. Incentive categories with high public usage, such as public parking lots, were difficult to build and, hence, lacked effectiveness as an incentive category. Last, even within the same incentive category, the number of bonuses granted varied between districts, giving rise to issues of equity. Moreover, problems regarding the lack of public benefit were identified in cases where a portion of the public site was exploited for private purposes. Hence, incentive policy operations should strive to improve the policy’s framework toward adequately realizing “public benefit” from the investment commitments made by private developers.
The following implications can be found through this study. To offer solutions to the problems within the incentive bonus system identified by this study, it is first necessary to unify the planning factors that are duplicated during operation. Since POPS and tower-shaped buildings can be synthesized under a single plan, when there is a need to connect with the nearby public amenities, POPS placement should be made first and a relative standard for the provided surface area should be applied. However, extra bonuses should be provided in the cases where visual corridors are implemented using wall boundaries, bearing the advantages of spaciousness of tower-shaped buildings. Second, in evaluating the public benefit contribution, the principal convenience should clearly convey that it is for “unlimited usage by the general public”. In other words, the design elements that enhance the use exclusively for a particular building’s occupants should not be awarded the FAR bonus. For instance, providing FAR bonus for passageways and other convenience installations limited to the use of specific building tenants cannot be appropriate for receiving incentives. Meanwhile, the consistency and integrity of the system should be maintained by providing unified relative standards and criteria.
Ultimately, the existing practices of bonus policy should be improved to offer FAR bonus benefits that reflect practical implementations, contributing significantly to public benefit. Table 6 and Table 7 show the direction of improvement in the FAR bonus categories that are actually being duplicated in practice.
To strengthen the proper function of incentive policies within urban planning processes, explicit and aggressive policies, such as “Development Profit Suppression”, should be subdued. Instead, indirect control measures, such as reducing developers’ expenses when there is public benefit derived from their implementation of effective design elements, should be encouraged.
For qualitative improvement of public spaces, the “area-centered” incentives operated by the Seoul Metropolitan City Government should be improved to give “differential incentives according to qualitative levels”. Rather than the “regulations” intended to obtain defined bonuses, as with current regulations, deriving “voluntary participation” for the creation of public spaces to secure high quality public spaces is a method to achieve the original purpose of the incentive system. The direction of improvement of the incentive system operation that can be identified through this study is summarized by stage of urban development as follows (Table 8).
We investigated the effectiveness of the urban planning system to realize public goals in urban development processes and analyzed the positive and negative effects. However, fundamental research on whether the incentive system has a balance between public and private benefits is more important. For example, quantitative evaluation of public benefits and private benefits by urban development projects should be conducted. Furthermore, the balance between public and private benefits should be determined based on the exchange of practical values, rather than on the current system’s simple “quantify and calculate” process by equation for calculation.
Supplementary Materials
The following are available online at https://www.mdpi.com/2071-1050/11/9/2698/s1, Table S1: Study Area names and corresponding reference names (complementary to Table 5).
Funding
This research received no external funding.
Acknowledgments
The author would like to express sincere thanks to the city of Seoul’s Officials who provided detailed information on the development area in this study.
Conflicts of Interest
The author declares no conflict of interest.
References
- Tang, B.; Tang, R.M.H. Development control, planning incentive and urban redevelopment: Evaluation of a two-tier plot ratio system in Hong Kong. Land Use Policy 1998, 16, 33–43. [Google Scholar] [CrossRef]
- Kang, W.S. Issues and Improvement Proposals Regarding Free Attribution and Transfer for Development Related Infrastructure; Construction & Economy Research Institute of Korea: Seoul, Korea, 2007; pp. 1–31. [Google Scholar]
- Kim, S.Y. A study on the characteristics of incentive schemes for public space provision in urban design districts. Assoc. Archit. Inst. Korea 1999, 15, 144–151. [Google Scholar]
- Jang, J.Y. Research for Improvement within Land Donation Related Incentive Policy Operations. Doctoral Dissertation, University of Seoul, Seoul, Korea, 2005. [Google Scholar]
- Halpern, K. Downtown USA: Urban Design in Nine American Cities; The Architectural Press: London, UK, 1978. [Google Scholar]
- Kayden, J.S. Incentive Zoning in New York City; Lincoln Institute of Land Policy: Cambridge, UK, 1978. [Google Scholar]
- New York City. New York Zoning Resolution; The New York City Department of City Planning: New York, NY, USA, 2007.
- Jung, H.J.; Jang, G.C.; Kim, K.H. A study on the management & effect of incentive zoning in the special planning districts focused on up-zoning area in Seoul. Assoc. Archit. Inst. Korea 2006, 22, 235–244. [Google Scholar]
- Karki, T.K. Mandatory Versus Incentive-Based State Zoning Reform Policies for Affordable Housing in the United States: A Comparative Assessment. Hous. Policy Debate 2015, 25, 234–262. [Google Scholar] [CrossRef]
- Seyfried, W.R. Measuring the Feasibility of a Zoning Bonus. J. Am. Plan. Assoc. 1991, 57, 348–356. [Google Scholar] [CrossRef]
- Hasan, T.S.D.; Zulkaidi, D. Assessment of Potential Locations for Bonus Zoning in Bandung. J. Malays. Inst. Plan. 2018, 16, 231–238. [Google Scholar]
- Lee, S.H.; Lee, J.S. A study of evaluating the effectiveness of the floor area ratio incentive for securing public open space. J. Archit. Inst. Korean Plan. Des. 2016, 32, 47–56. [Google Scholar]
- Klosterman, R.E. A public interest criterion. J. Am. Inst. Plan. 2002, 46, 323–333. [Google Scholar] [CrossRef]
- Sagalyn, L.B. Negotiating for public benefits: The bargaining calculus of public-private development. Urban Stud. 1997, 34, 1955–1970. [Google Scholar] [CrossRef]
- Lee, B.R.; Nam, J. An evaluation of the feasibility of floor area ratio incentive by contributed acceptance system in housing redevelopment projects of Seoul. Seoul Stud. 2013, 14, 61–76. [Google Scholar] [CrossRef]
- Rim, E.Y.; Lee, S.J. The improvement of design inducement incentive on permitted floor area ratio in district detailed plan. Korea Inst. Ecol. Archit. Environ. 2017, 17, 49–57. [Google Scholar]
- Lim, H.J. A Study on Improvement of Special District Policies for Urban Design District in Seoul; Seoul Development Institute: Seoul, Korea, 2004. [Google Scholar]
- Seoul City. Research for Seoul City District Unit Planning Overhaul Plan; Seoul Metropolitan Government: Seoul, Korea, 2002.
- New York City. Inclusionary Zoning NYC; The New York City Department of City Planning: New York, NY, USA, 2003.
- City of Boston Massachusetts. Boston Zoning Code; Boston Redevelopment Authority: Boston, MA, USA, 2018.
Figure 1.
Incentive provision and examples of consequential change in density.

Figure 2.
Subject areas: 46 Special Planning projects comprising 1,140,344 m2 (excludes no bonus areas).
Figure 2.
Subject areas: 46 Special Planning projects comprising 1,140,344 m2 (excludes no bonus areas).

Figure 3.
Classification of subject areas by use after development.

Figure 4.
Negative consequences of bonus implementations.

Figure 5.
Land acquired for different types of public amenities in special planning areas.

Figure 6.
FAR incentive category distribution.

Figure 7.
Open spaces acquired by the FAR incentive system: Location and composition.

Figure 8.
Tower-shaped buildings that have received FAR incentives.

Figure 9.
Above/Underground Pedestrian Path installations.

Figure 10.
Case 33 POPS-related guidelines and development site.

Figure 11.
Situation of installation of facilities with conditions where the exhibition of publicness is difficult.
Figure 11.
Situation of installation of facilities with conditions where the exhibition of publicness is difficult.


Table 1.
Modulation of regulations for public amenities provision.
| Category | Modulation Approach |
|---|---|
| Building Coverage Ratio Modulation | Prescribed building coverage ratio × (1+ Land area for public amenities/Original land area) |
| Floor to Area Ratio Modulation | Prescribed building coverage ratio × (1+1.5 * Ratio factor × (Land area for public amenities/Land area after implementation of public amenities)) |
| Height Modulation | Prescribed building height × ((1+ Land area for public amenities)/Original land area) |
Note: Ratio factor = Ratio of (public amenities land area FAR: commercial land area FAR) when there is disparity between the two.
Table 2.
Seoul City urban planning ordinance: FAR application criteria.
| Category | Base-FAR | Permitted-FAR | Maximum-FAR |
|---|---|---|---|
| Up zoning | Specially designated FAR within the FAR range previous to up zoning | Less than Previous FAR + (Post up zoning FAR–Previous FAR) × 2/3 | Less than Permitted-FAR × (1 + 1.3 × Ratio Factor × α) and the original FAR range or Less than Base-FAR × (1 + 1.3 × Ratio Factor × α) |
| No changes | Specially designated FAR within original FAR range | Less than original FAR range | Less than Permitted-FAR × (1 + 1.3 × Ratio Factor × α) |
| Downzoning | Specially designated FAR within the FAR range after downzoning | Less than Post downzoning FAR | Less than Permitted FAR × (1 + 1.3 × Ratio Factor × α) |
Note: α = Area provided for public amenities/Land area after provision.
Table 3.
New York Commercial Area Urban Plaza, Arcade (as of right) Bonus.
| 33-13. Additional Floor Area Ratio when Installing Public Plaza | 33-14. Additional Floor Area Ratio when Installing Arcade | ||
|---|---|---|---|
| District | Additional area | District | Additional area |
| Commercial facility | Commercial facility | ||
| C5-3, C5-5, C6-6, C6-7, C6-9 | 10 SF | C4-7, C5-2, C5-3, C5-4, C5-5, C6-1A, C6-4, C6-5, C6-6, C6-7, C6-8, C6-9 | 3 SF |
| C4-7, C5-2, C5-4, C6-1A, C6-4, C6-5, C6-8 | 6 SF | C6-1, C6-2, C6-3 | 2 SF |
| C6-1, C6-2, C6-3 | 4 SF | ||
| Community facilities or mixed commercial and community facilities | Community facilities or mixed commercial and community facilities | ||
| C5-3, C5-5, C6-6, C6-7, C6-9 | 10 SF | C1-8, C1-9, C2-7, C2-8, C4-6 C4-7, C5, C6-3, C6-4, C6-5, C6-6, C6-7, C6-8, C6-9 | 3 SF |
| C4-6, C4-7, C5-1, C5-2, C5-4, C6-3, C6-4, C6-5, C6-8 | 6 SF | ||
| C6-1, C6-2 | 4 SF | C6-1, C6-2 | 2 SF |
* Additional area: Bonus area per square foot of square or arcade (Source: New York City (2007), New York Zoning Resolution).
Table 4.
Floor area bonus criteria for Seattle urban residential complex.
| Characteristic Element for Public Interest | Bonus Rate 1 | Maximum Allowable Area |
|---|---|---|
| Welfare services | 4.5 | 5000 SF |
| Movie Theaters | 4.5 | 15,000 SF |
| Retail Stores 2 | 3 | 50% of the floor area ratio in the range not exceeding 15,000 SF |
| Parks in residential area | 3 | 100% floor area ratio 3 |
| Landscape Park 2 | 3 | 100% floor area ratio 3 |
| Hill Terrace 2 | 3 | 6000 SF |
| Sidewalk Widening 2 | 3 | Area required to meet the required sidewalk width |
| Expensive climate change problem preventive measure | 3 | 10 FT width, 75% of the front of the street side |
| Voluntary Building Line Retreat | 3 | 10 FT width, front on the landscape park |
Notes: 1 The ratio of additional SF allowable per SF of the amenity facility provided; 2 Restricted depending on the floor area ratio bonus system; 3 Maximum allowable additional floor space Providing affordable housing through incentive systems is one of the most representative public policies; housing stabilization for middle and low-income people can be pursued through urban development projects. In Denver and Colorado, 10% of affordable housing units should be provided in cases where housing for more than 30 households are developed. Developers can get an additional building area of 10% and a subsidy of $5000–10,000 if they provide affordable housing unit. In addition, they can be exempted from the construction of essential parking lots and be provided with quick processing in the construction permission process. Therefore, they can expect incentives besides the floor area.
Table 5.
FAR bonus categories fulfilled for each study area.
| Reference Name | FAR Bonus Categories | ||||||||||||||||||||
|---|---|---|---|---|---|---|---|---|---|---|---|---|---|---|---|---|---|---|---|---|---|
| Parcel | Use | POPS | Passageway | Allotment | Architecture Related | Environment Friendly | Ext. | ||||||||||||||
| 1 | 2 | 3 | 4 | 5 | 6 | 7 | 8 | 9 | 10 | 11 | 12 | 13 | 14 | 15 | 16 | 17 | 18 | 19 | 20 | 21 | |
| Case 1 | ● | ● | ● | ● | ● | ● | ● | ||||||||||||||
| Case 2 | ● | ● | ● | ||||||||||||||||||
| Case 3 | ● | ● | ● | ● | ● | ● | ● | ● | ● | ● | ● | ● | |||||||||
| Case 4 | ● | ● | ● | ● | ● | ||||||||||||||||
| Case 5 | ● | ● | ● | ||||||||||||||||||
| Case 6 | ● | ● | ● | ● | |||||||||||||||||
| Case 7 | ● | ● | ● | ● | ● | ● | |||||||||||||||
| Case 8 | ● | ● | ● | ● | |||||||||||||||||
| Case 9 | ● | ● | ● | ● | |||||||||||||||||
| Case 10 | ● | ● | ● | ||||||||||||||||||
| Case 11 | ● | ● | ● | ● | ● | ● | ● | ||||||||||||||
| Case 12 | ● | ● | ● | ||||||||||||||||||
| Case 13 | ● | ● | ● | ● | |||||||||||||||||
| Case 14 | ● | ● | ● | ● | |||||||||||||||||
| Case 15 | ● | ● | ● | ● | ● | ● | ● | ● | |||||||||||||
| Case 16 | ● | ● | ● | ● | ● | ● | ● | ● | ● | ||||||||||||
| Case 17 | ● | ● | ● | ● | ● | ||||||||||||||||
| Case 18 | ● | ● | ● | ● | ● | ● | |||||||||||||||
| Case 19 | ● | ● | ● | ● | |||||||||||||||||
| Case 20 | ● | ● | ● | ● | |||||||||||||||||
| Case 21 | ● | ● | |||||||||||||||||||
| Case 22 * | ● | ● | ● | ● | ● | ● | ● | ||||||||||||||
| Case 23 | ● | ● | ● | ||||||||||||||||||
| Case 24 | ● | ● | ● | ● | ● | ● | |||||||||||||||
| Case 25 | ● | ● | ● | ● | ● | ||||||||||||||||
| Case 26 | ● | ● | ● | ● | ● | ||||||||||||||||
| Case 27 | ● | ● | ● | ● | |||||||||||||||||
| Case 28 | ● | ● | ● | ● | |||||||||||||||||
| Case 29 | ● | ● | ● | ● | ● | ● | |||||||||||||||
| Case 30 | |||||||||||||||||||||
| Case 31 | ● | ● | ● | ● | |||||||||||||||||
| Case 32 | ● | ● | ● | ● | |||||||||||||||||
| Case 33 * | ● | ● | ● | ● | ● | ● | |||||||||||||||
| Case 34 | ● | ● | ● | ||||||||||||||||||
| Case 35 | |||||||||||||||||||||
| Case 36 | ● | ● | |||||||||||||||||||
| Case 37 | ● | ● | ● | ● | ● | ● | |||||||||||||||
| Case 38 | ● | ● | ● | ● | |||||||||||||||||
| Case 39 | ● | ● | ● | ● | ● | ||||||||||||||||
| Case 40 | ● | ● | ● | ● | ● | ● | |||||||||||||||
| Case 41 | ● | ● | ● | ● | ● | ||||||||||||||||
| Case 42 | ● | ● | ● | ||||||||||||||||||
| Case 43 | ● | ||||||||||||||||||||
| Case 44 | |||||||||||||||||||||
| Case 45 | ● | ● | ● | ● | ● | ● | |||||||||||||||
| Case 46 | ● | ● | ● | ● | ● | ● | ● | ||||||||||||||
Notes: Shading_ X-axis: Top 3 Study Areas with highest number of bonus implementations; Shading Y-axis: Top 3 Bonus Items with the highest frequencies of implementation; Name of Elements: 1. Joint development, 2. Recommended usage, 3. Privately owned public space (POPS), 4. Pocket Park, 5. Open space, 6. Location of POPS, 7. Public walkway, 8. Subway path, 9. Pedestrian deck, 10. Public path in site, 11. Pedestrian road, 12. Building line, 13. Wall line, 14. Tower type building in the top, 15. Tower type, 16. Building coverage, 17. Lights in night, 18. Water permeability ground, 19: Used water sys, 20. Roof garden, and 21. Landscape.
Table 6.
Recommended suggestion for unified FAR incentive categories.
| FAR Incentive Categories | Unified Plan Elements | |
|---|---|---|
| Privately Owned Public Space (POPS) | POPS, POPS Placement | POPS Placement (Regulatory) POPS Surface Area (Recommended) |
| Architectural | Tower-Shaped, Building Coverage Ratio | POPS Placement (Regulatory) POPS Surface Area (Recommended) |
| Building Placement | Wall Boundaries | Wall Boundaries |
| Architectural | Tower-Shaped Skyscrapers | Wall Boundaries |
| POPS | Building Fronts | Architectural Boundaries |
| Building Placement | Architectural Boundaries | Architectural Boundaries |
Table 7.
Recommended suggestion for unified relative standards of FAR incentive categories.
| Category | Existing Standards | Suggested Unified Relative Standards | |
|---|---|---|---|
| POPS | Abs | Placement: Base-FAR × 0.1 | Base-FAR × (Additional SA/SA) (* Additional SA: 5% of lawful SA) |
| Abs | POPS by law, POPS by guideline Integration | Base-FAR × (Additional SA/SA) (* Additional SA: 5% of lawful SA) | |
| Rel | Base-FAR × (Provisional Area/SA) (× 2) | Base-FAR × (Additional SA/SA) (* Additional SA: 5% of lawful SA) | |
| Architectural Boundaries | Abs | Base-FAR × 0.2 | Base-FAR × Frontal Open Space SA by Architectural Boundaries/SA |
| Rel | (Architectural Boundaries SA/SA) × Base-FAR × 1.8 (× 2.0) (× 3.0) | Base-FAR × Frontal Open Space SA by Architectural Boundaries/SA | |
| Rel | (Developed SA/SA) × Base-FAR | Base-FAR × Frontal Open Space SA by Architectural Boundaries/SA | |
| Designated/Recommended Usage | Abs | Base-FAR × 0.1 (× 0.15) | (Recommended Usage SA /Architectural Gross Area) × Base-FAR × α |
| Rel | (Recommended Usage SA/Architectural Gross Area) × Base-FAR (× 0.2 × 0.3× 0.15) | (Recommended Usage SA /Architectural Gross Area) × Base-FAR × α | |
SA: Surface Area; Abs: Absolute; Rel: Relative.
Table 8.
Suggestion of improvement direction of FAR system operation by stage.
| Division | Direction of System Operation |
|---|---|
| Planning stage | Present concrete goals of the public sector |
| Strengthen the zone designation requirements | |
| Concretize the guidelines for securing qualitative level | |
| Incentive decision stage | Ensure equity with other areas |
| Provide differential incentives | |
| Induce the provision of diverse public facilities | |
| Improve the contributed acceptance system | |
| Management stage after installation | Strengthen the qualitative management of public spaces |
| Regularize management and supervision |
© 2019 by the author. Licensee MDPI, Basel, Switzerland. This article is an open access article distributed under the terms and conditions of the Creative Commons Attribution (CC BY) license (http://creativecommons.org/licenses/by/4.0/).
Share and Cite
MDPI and ACS Style
Jung, H.-j. Urban Planning Policy for Realizing Public Objectives Through Private Development in Seoul. Sustainability 2019, 11, 2698. https://doi.org/10.3390/su11092698
AMA Style
Jung H-j. Urban Planning Policy for Realizing Public Objectives Through Private Development in Seoul. Sustainability. 2019; 11(9):2698. https://doi.org/10.3390/su11092698
Chicago/Turabian StyleJung, Hye-jin. 2019. "Urban Planning Policy for Realizing Public Objectives Through Private Development in Seoul" Sustainability 11, no. 9: 2698. https://doi.org/10.3390/su11092698
Note that from the first issue of 2016, this journal uses article numbers instead of page numbers. See further details here.