Real-Time Early Warning System for Sustainable and Intelligent Plastic Film Manufacturing


1
Division of Computer Science and Engineering, Sunmoon University, 70, Sunmoon-ro 221 beon-gil, Tangjeong-myeon, Asan-si 31460, Korea
2
Graduate School of Information, Yonsei University, 50, Yonsei-ro, Seodaemun-gu, Seoul 03722, Korea
*
Author to whom correspondence should be addressed.
Sustainability 2019, 11(5), 1490; https://doi.org/10.3390/su11051490
Submission received: 1 January 2019
/
Revised: 5 March 2019
/
Accepted: 7 March 2019
/
Published: 12 March 2019
(This article belongs to the Special Issue Sustainable Intelligent Manufacturing Systems)
Abstract
:In this study, real-time preventive measures were formulated for a crusher process that is impossible to automate, due to the impossibility of installing sensors during the production of plastic films, and a real-time early warning system for semi-automated processes subsequently developed. First, the flow of a typical film process was ascertained. Second, a sustainable plan for real-time forecasting in a process that cannot be automated was developed using the semi-automation method flexible structure production control (FSPC). Third, statistical early selection of the process variables that are most probably responsible for failure was performed during data preprocessing. Then, a new, unified dataset was created using the link reordering method to transform the time sequence of the continuous process into one time zone. Fourth, a sustainable prediction algorithm was developed using the association rule method along with traditional statistical techniques, and verified using actual data. Finally, the overall developed logic was applied to new production process data to verify its prediction accuracy. The developed real-time early warning system for semi-automated processes contributes significantly to the smart manufacturing process both theoretically and practically.
1. Introduction
Small and medium-sized manufacturing enterprises have been facing increasingly intense competition, as well as serious internal crises such as rising labor costs, a shortage of manpower, and a weak management base. As the function, quality, and performance of products are improving, and environmental regulations are becoming more stringent, the technical and economic burdens for competitiveness are increasing [1]. Therefore, manufacturing companies are investing heavily in research and product development to ensure their competitiveness and survival. In particular, they are concentrating significant effort on developing technology and support systems by actively applying information technology (IT) to products, processes, and manufacturing systems [2]. In order to maintain competitiveness in the manufacturing industry, an efficient factory operation management, which supports technological superiority through R&D (research and development), and production and manufacturing technology, is more important than in other industries. Manufacturing innovation is converging worldwide with manufacturing technology and information and communication technology (ICT). In Germany, the manufacturing powerhouse is conducting ‘Industry 4.0’ to lead the future manufacturing market. Machine-oriented production, the past paradigm of computer robot production, is evolving into a smart manufacturing industry that is produced through the interconnection of machines, people, and the Internet.
Table 1 shows the statistical method of capturing anomalous signs through preventive maintenance. In this manner, preliminary maintenance can be performed, the life of the equipment can be extended, and replacement and maintenance costs can be reduced. Past maintenance techniques are post-corrective maintenance methods that repair only if damage and a fault occur. However, there has been a growing trend in recent years toward implementing preventive maintenance that can be used to provide necessary maintenance by introducing failure prediction, and prognostics and health management (PHM) technology [3].
In this study, the plastic film process was investigated along with the existing methodology for the management of a production site. In addition, to overcome the shortcomings of the existing methodologies, the smart factory management system was developed based on these experiences, and research on factory automation system construction was examined. Subsequently, a method to improve productivity at the production site by predicting process failure was developed.
The remainder of this paper is organized as follows. Section 2 summarizes the existing theories related to smart factories, and examines the academic requirements for the plastic film industry. Section 3 outlines the film production process and methodology, preprocessing, modeling, and verification. Further, a proposed statistical prediction model based on actual data is presented and its efficacy is verified. Section 4 presents concluding remarks and highlights the theoretical and practical implications of this study.
2. Background
2.1. Plastic Film Industry
The plastic film is a thinly stretched synthetic resin polymer, and is a generic name of a film having a thickness of 100 μm or less. Films thicker than 100 μm are generally referred to as sheets. Film-type packaging materials that can be seen in everyday life are called vinyl or plastic bags, which are abbreviated as PVC (polyvinyl chloride). Other types of films include polyethylene and polypropylene. The final product using film is used in a variety of applications such as raincoats, tablecloths, sacks, packaging, wrapping, waterproofing construction materials, photographic films, and video tapes, all of which are characterized by water resistance, moisture resistance, and infiltration [8]. Methods used to manufacture films include inflation, T-die, and casting methods. The double stretching method is also used to increase the strength of the film or prevent its shrinkage. In particular, T-die is a method of fabricating a product by injecting resin into a preformed film prepared using the thermoforming process. The T-die process is widely used throughout the industry, because it is capable of the mass production of plastic films along with the inflation process, which is the basic thermoforming process, and the casting process, which is a type of injection molding process. Currently, inflation is defined as a process in which a thin film of a polymer is deformed by applying vacuum pressure to form a film layer. Casting is a process in which molten polymer resin is injected into a film layer, and then solidified by heat transfer to form an injection molding. However, a quality deterioration phenomenon such as the tearing and folding of the surface of the film is observed after the end of the process due to the resin injected under high-pressure and high-temperature conditions. Numerous domestic and international studies are underway to alleviate this deterioration [9].
Various studies have been conducted to understand the deformation characteristics of a film. Lee and Turng [10] analyzed the effect of several design parameters on the molding performance of a film during a high-pressure molding process in order to ascertain the characteristics of the plastic film process. Pang, et al. [11] focused on the characteristics of materials fabricated using processes such as drying and grinding, and numerically analyzed the cause of various defects in the film. In the present study, various studies published in the literature were examined to understand the properties of films in a closed mold during casting, softening, and extrusion processes. Ferreira, et al. [12] identified the effect of the product on the temperature control function of the filament during the extrusion process. Owing to the lifetime and thermal conductivity of the extruded filaments, a difference in the flow velocity of the material is generated, resulting in an uneven flow pattern. In addition, non-uniform extrusion may cause the problem of lowering the thickness balance of the product. Pennacchia, et al. [13] revealed the conditions of thickness equalization through experiments of coating or solvent mixture to achieve optimal molding conditions during the molding experiment. In particular, the film shrinks because of the diffusion and evaporation of the solvent during the film formation process. In addition, when a fully cured polyimide film is coated with a solvent, a certain amount of solvent diffuses into the polymer film, causing a swelling phenomenon. This swelling phenomenon proceeds until an equilibrium is established between the solvent and the film. When the swollen film is exposed to a certain minimum temperature in air, or a nitrogen atmosphere, the solvent that has permeated the film evaporates again, resulting in the drying phenomenon. This, indeed, is accompanied by another form of thickness variation. Saul and Gebauer [14] studied product failure due to temperature and pressure conditions during longitudinal and transverse stretching processes. Zucker, et al. [15] proposed conditions to correct the edge crater condition as a cause of film deformation. As demonstrated in previous studies, various approaches have been applied to understand the causes of film deformation during several plastic film processes. However, those studies exclusively analyzed the cause of film deformation in each process, and failed to assess the nature of the material, problems in the process, and the film deformation pattern. By contrast, in this study, the causes of defects in a film were identified considering the step-by-step conditions of all film processes, such as extrusion, casting, coating, softening, cutting, and winding.
2.2. Sensor-Based Smart Factory
Smart factory is a concept derived from Germany’s manufacturing growth strategy and Industry 4.0. In addition, it is the result of the German government’s efforts to reduce the production period of quality goods by as much as possible in order to strengthen the manufacturing competitiveness. The production process prior to the fourth Industrial Revolution was a process of exhausting inventory. In other words, the producer used to sell the product to the wholesale market, and many stocks were accumulated at the stage of distribution when the product was transferred to the final consumer through the retail market. Companies utilized various management techniques to minimize the accumulated inventory. The smart factory solved the inventory problems to a great extent. As the distribution channel was digitized, producers were able to find the optimal production point and retailers could maintain an optimal inventory. That is, production and distribution were connected organically. Custom production is a representative function of smart factory. Through a customized production, a company was able to make the right products for consumers’ needs at the right time, which could significantly reduce the loss of inventory accumulation. The factors of the smart factory can be defined as five characteristics of activity, intelligence, connectivity, agility, and reliability, as shown in Table 2. Various studies on the smart factory that apply this view are presented below [16,17].
One of the key technical factors of the smart factory is to analyze the data in real time by sensing the data and creating patterns. Herrmann, et al. [18] conducted a study on the application of big data analysis to the manufacturing process to build a smart factory in the automobile parts manufacturing process. To implement a smart factory, a manufacturing company must have a sensing platform that is optimized for the automation process and meets the life cycle of the process. In other words, the integrated platform using IoT (Internet of things) and CPS (cyber physical system) technology assures scalability and flexibility in the distribution and sales of the final product. Hwang, et al. [19] argued that the smart factory should focus on differentiating between execution-level business models and implementation elements. In other words, the level of application should be changed according to the level of the target to apply the smart factory technology. It is necessary that the element technology of existing factory engineering such as facilities, automation, distribution, sales, and the fusion platform must integrate with the distribution and sales stage integrally. In addition, the facility and automation stages consider a system based on sensing technology, and the distribution and sales stages should take into consideration the characteristics and habits of the target personnel. Davis, et al. [20] distinguished the following technical components to implement a smart factory. First, there is a need for a sensing technology that detects a changed event through an electrical signal from a device or a machine. Second, a decision structure is needed to control facilities through detected event information. Finally, there is a need for a circulation system that creates new logic through the updated information and restarts the facility. They argued that such an automation system could operate repeatedly in the internal devices of smart factories or in virtual applications in the form of either an interaction pattern or an unstructured mesh. Jiang [21] treated process data originating from continuous production equipment as previously unqualified data, because there was no clear indication of its use. However, it has become available as meaningful information to the manager by recording and sharing the temperature, pressure, and precise position information of the facilities acquired through the smart device, and the recent smart factory-based sensor, communication, and various processing technologies. Through this, it is possible to increase the accuracy of decision-making and lower the inventory rate.
Wang, et al. [22] pointed out the practical limitations of automation for smart factories. This is based on the concept of the flexibility of the CPS facilities. In other words, the flexible structure production control (FSPC) allows more customized relocation through the contact with actual facility resources and digitized resources. Automation has enabled the integration of various sensing devices and facilities to gather information on several variables that were difficult to trace, enabling more precise control and better decision-making. In addition, automation has enabled physical actuators to control the actual movement of production facilities through the use of physical actuators, enabling an effective, more synchronized, and precise operation. However, it is not possible to sense the work process area where manufacturing is difficult or impossible; that is, the mass component assembly process, the precision assembly process, and the multi-process composite assembly process in which the operator’s intervention is inevitable. Even if the sensing data is collected, there are not several ways to interpret it in a complex manner. To solve this problem, the researchers devised a method to change the layout of the production site, assist the operator in the decision-making of the production status dashboard, and minimize the variables caused by the operator in the automation domain. Representative semi-automation systems include Human-in-the-Loop, Fool Proof, and Least Cost Automation (LCA) learning. In this way, the smart factory in the real world can control both automation and manual support systems, as well as increase production flexibility. In other words, it can be considered that the automation support module is performed together with the automation of the process in a complicated manual operation section. This is called FSPC or automation supported collaboration model (ASCM), and researchers have argued that the FSPC can integrate and control the entire plant as a system. Wan, et al. [23] conducted a real-time analysis of operational data and big data obtained from ICT and facility resources fused with attached sensors. To achieve this, the researchers developed an autonomous system after formulating a meaning and utilization plan, and predicted the exact timing of process change. In addition, the researchers pre-performed material inventory, rescheduling, logistics delivery, transport device design, and equipment flexibility inventory for the facility, and attached barcodes and radio frequency identification (RFID) tags to all parts and products to determine the real-time status. As a result, researchers have been able to determine the next task or production stage autonomously, resulting in reduced rejection rates, reduced production cycles, and increased flexibility for changes in products.
As mentioned earlier, in this study, a new modeling technique was developed based on the semi-automatic process FSPC and previous research on early warning systems in automation manufacturing processes based on industry 4.0. Many studies have been conducted and methodologies proposed; however, there has been little research on how to fully recover semi-automatic defects in an actual process. This study developed more practical and concrete sensor-based automation methods, and determined how to compensate for defective parts based on data from automated sections.
2.3. Sustainability on Manufacturing
As the manufacturing sector is driving economic growth worldwide, sustainability should start with a strategy to harmonize economic development with the manufacturing environment. Sustainability has been established academically from the concept of harmony between industry and environment. In the 21st century, it is considered an important national agenda in almost every field. The World Summit on Sustainable Development (WSSD) in Johannesburg in 2002 gave a more general definition of sustainability: specifically, “development that meets the needs of the present without compromising the potential to meet the needs of future generations” [24]. This is not only a concept that encompasses the three components economic, environmental, and social characteristics, but also the concepts of temporal dynamics, spatial composition, and policy inclusiveness. In other words, it is an important evaluation criterion for sustainability to dynamically determine whether it has contributed to the establishment of an appropriate response system for future changes. In addition, it includes the concept that it should be pursued with considerable versatility, rather than be limited to a single business domain. Finally, policy integration implies not only a technical approach but also a consideration of governance and administrative support for soft landing in the industry [25].
In the recent digital manufacturing environment in particular, the importance of creative model design for data is increasing. In the production of film, customized production systems are being replaced with multi-product small quantity production systems. In addition, as data transformation and modification are easy, and variant production systems continue to grow, the value of services to customers can move closer to the realm of production [14]. Therefore, film production under digital manufacturing means that it can bring new paradigms to the traditional manufacturing market through the reduction of investment costs and management risks and the alleviation of entry barriers. This also means that custom manufacturing and easy access to raw materials can reduce energy depletion and waste problems, and that environmental pollution problems due to distribution can also be reduced [9]. Therefore, sustainable awareness growth in the film industry not only serves to improve the cyclical competitiveness of companies, but also positively affects policy support, institutions, regulations, and laws.
3. Design
3.1. Plastic Film Production Process
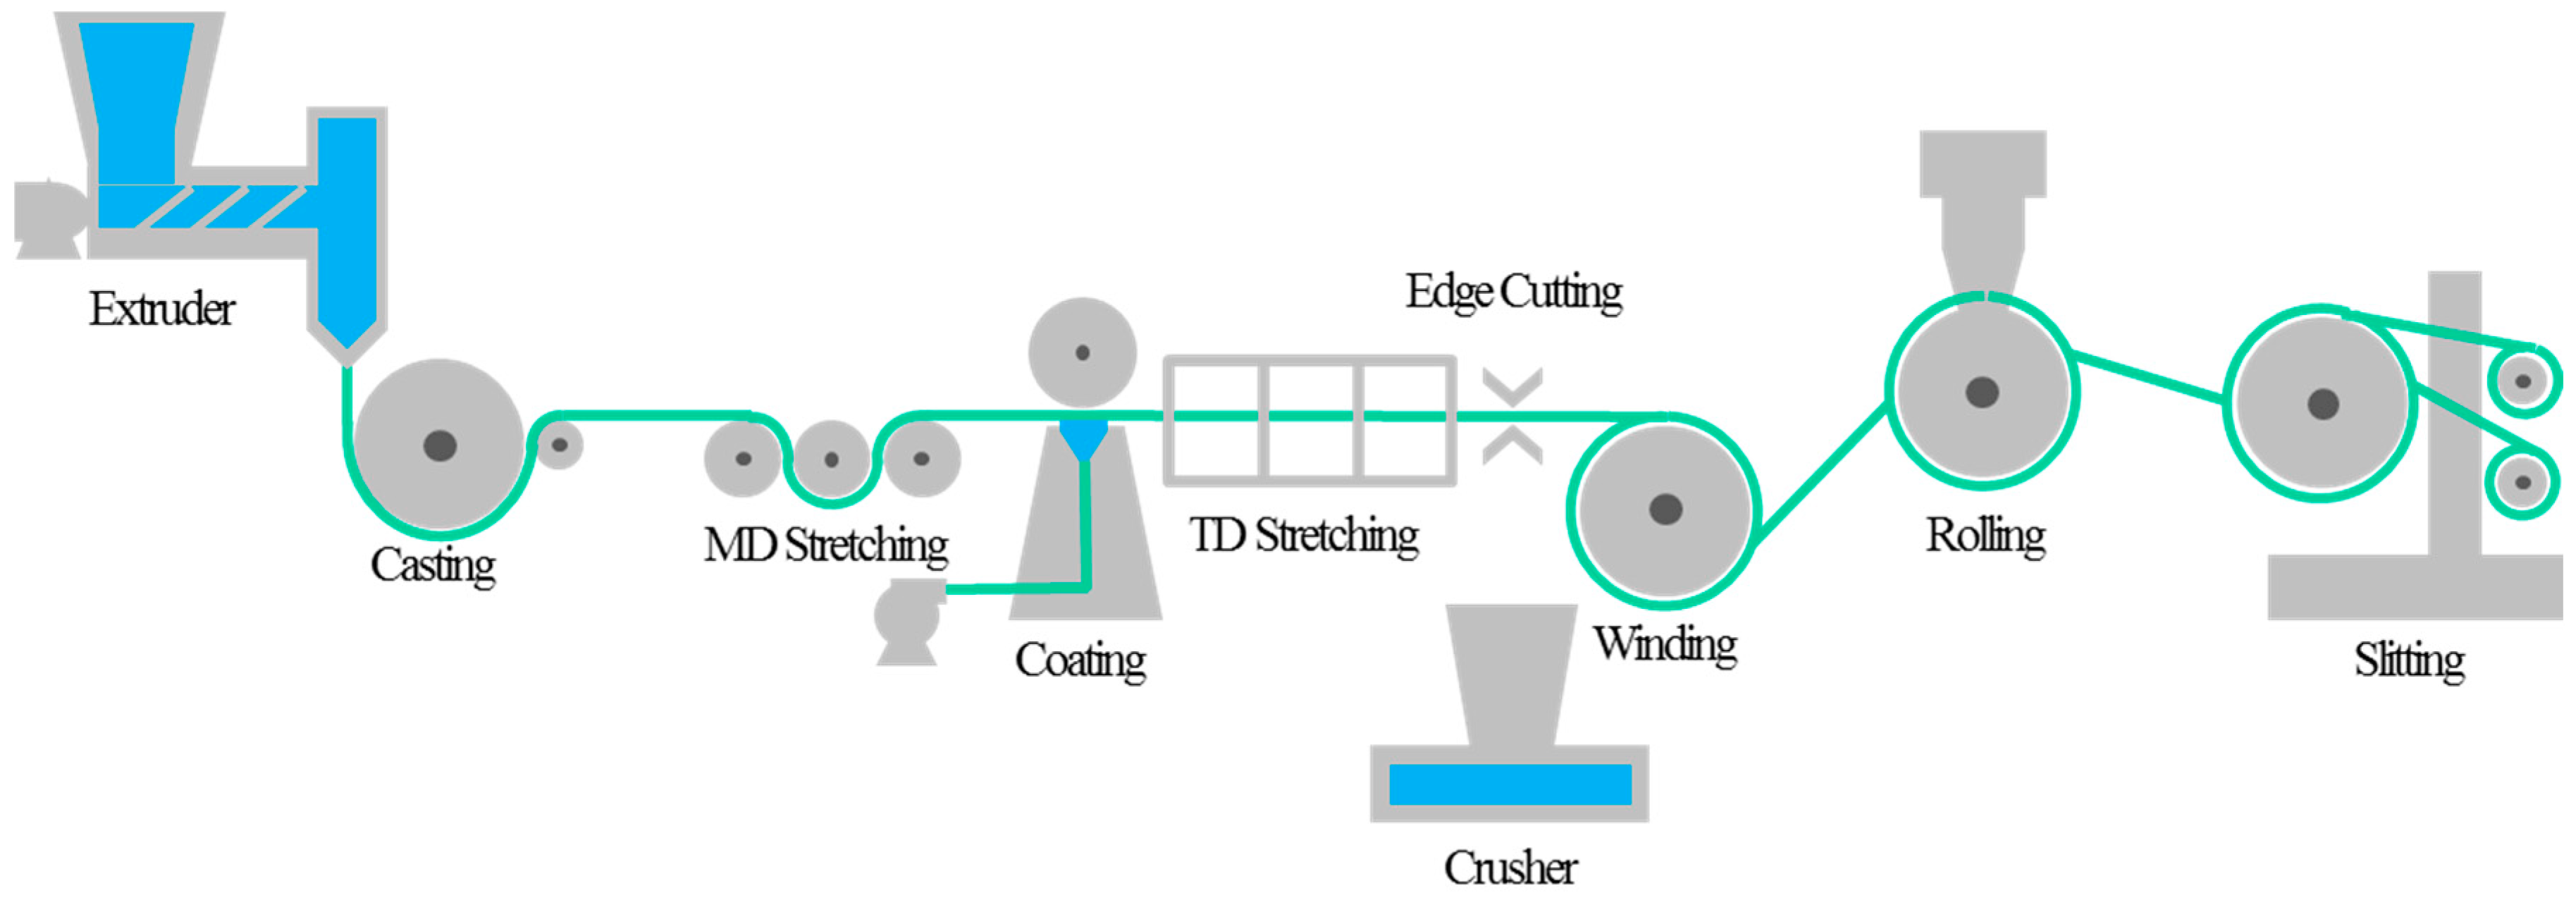
The existing preliminary maintenance process performed by company A, a producer of plastic films, was evaluated to predict any future failure of the equipment through big data and implement the preliminary action. Preprocessing, data tuning, analytical modeling, and predictive power evaluation were conducted based on approximately 16 billion plastic film production datasets for approximately two years from August 2015 to August 2017 as proof of concept (PoC). In particular, there was a great need for a practitioner responsible for the pre-warning system for the crusher process, which is the most frequent obstacle in the production of plastic films. This is because, among all of the stages of the film production process, only the crusher process has no sensors. Typically, a plastic film process consists of drying, grinding, extrusion, casting, machine direction stretching (MDS), coating, transverse direction stretching (TDS), edge cutter, winding, and slitting. TDS occupies the longest section of the continuous process, and injects a constant temperature and pressure for approximately 6 m to increase the width by approximately 5 m. At the end of the TDS process, there is an edge cutter process that cuts approximately 50 cm to 60 cm per side of the grip on both ends to pull the film in the direction of width. During this stage, the cut film flows under the continuous process equipment and is crushed. Figure 1 shows the plastic film production process.
However, there is a problem with the cut film; if it is too thick or less dry, it may not be crushed properly. This would cause the crusher to malfunction. Most crusher failures occur when the toothed blade breaks or the film is bundled. In such a case, all of the continuous processes have to be stopped, resulting in a significant financial blow to the enterprise. One of the major problems in most plastic films is irregularity in thickness. This has been largely solved recently through sensor technology. However, as the crusher process is operated independently of the continuous process equipment and the sensor is not attached to the crusher equipment, the reason for the breakage is not clear.
Thus, the missing part that this study attempts to supplement is not a failed automation system, nor is it a consideration of a passive system with no sensors attached. In fact, it is assumed that all processes are already automated, and that a considerable amount of data is being collected. However, it is virtually impossible to implement 100% automation from start to finish. For processes where data integration is difficult owing to the impossibility of attaching sensors in the middle of the process, the flexible structure production control (FSPC) method, which is the main production method for implementing the Industry 4.0 mentioned above, can be applied. In this way, a means for the automation section to complement the deficit section is provided. This approach is a very specific and innovative method for film production, and can be directly applied in practice. In addition, it can be a very important factor for the sustainability of the film process.
3.2. Methodology
In this study, the FSPC method was applied to determine the cause of failure of the sensorless manual section and the automatic process section through the sensor, respectively. The time to reach the edge cutter process was calculated based on sensing data such as temperature, pressure, and motor speed in each process section. Since time is a function of distance and speed, it was converted through data accumulated in process-specific programmable logic control (PLC).
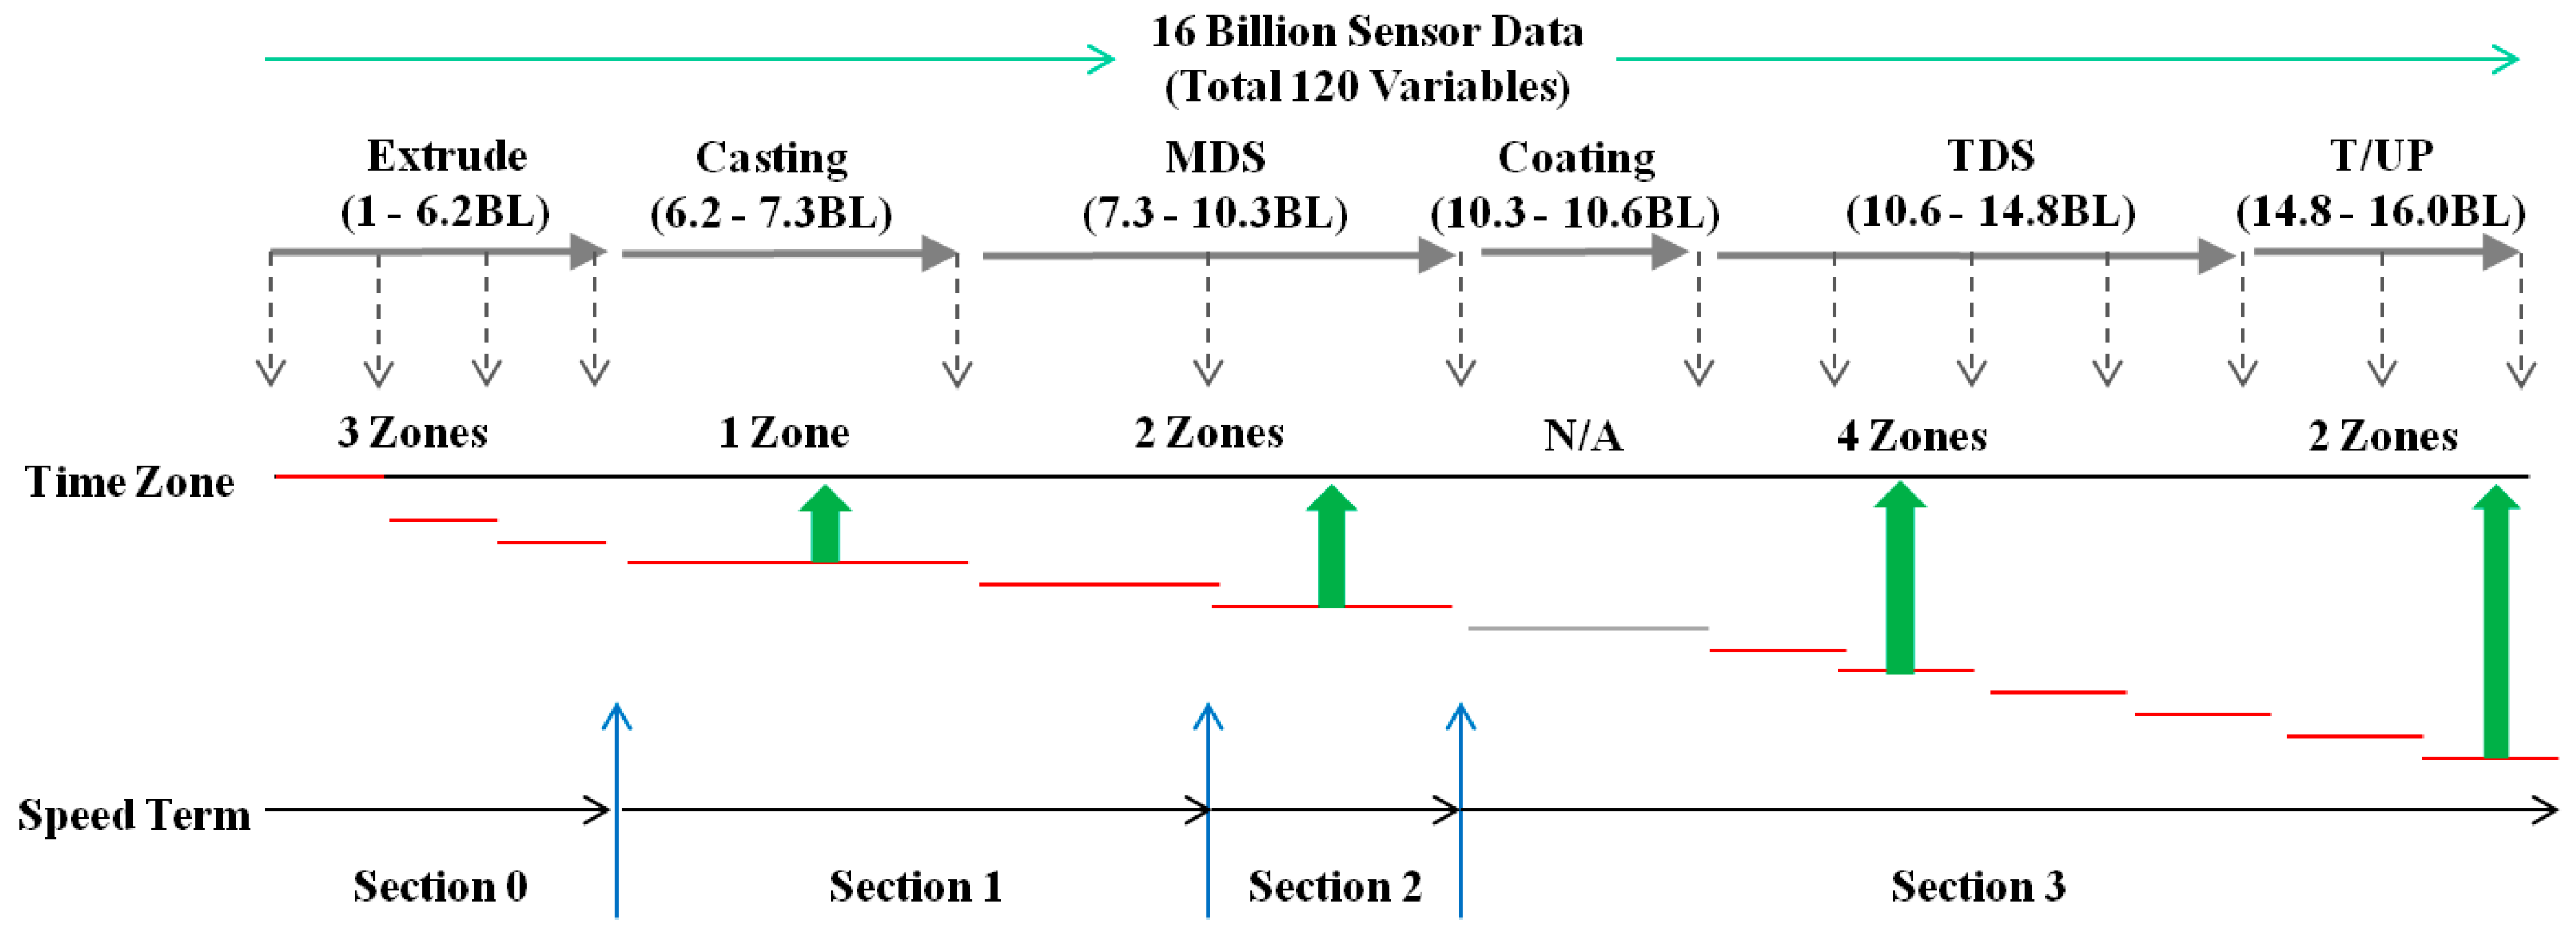
As shown in Figure 2, the process after the extrusion step is divided into three speed sections. The speed increases as the process progresses, and the speed of the take-up/rolling section is greater than that of the casting process, which is the initial speed section. A total of 120 variables and 16 billion datasets were analyzed for each process section, except for the coating section. The time interval for each process was adjusted to accurately reflect the flow of time. Although there are three sections where the speed change occurs in the whole process (approximately 30 min in total), the time correction section was divided into 12 sections for convenience. Further, the exact adjustment time was computed through the speed section of the film type and the total distance of the facility (21 m) to convert the time zone. In addition, each time frame in the time series was shifted upwards based on 12 periods.
We can also use the association rule to select the clusters of tags that can be the biggest factor in process failures. In addition, this allows visually dividing concrete variables that typically have large correlation coefficients. The association rule is another data mining technique that explores hidden patterns in data, and can be considered a method that mines the relationship between events that occur alongside a phenomenon or how a prior event suggests another event [26]. When finding the X→Y type rule between both event X and Y, it shows a correlation in that there is a higher chance that Y will appear when event X appears with a previous attribute. Support and confidence are commonly used as the representative index that quantifies the degree of the association rule, and each index is defined as follows.
Support represents the probability that events X and Y will appear simultaneously. Confidence is a measure of the rate at which a result event occurs when a conditional event occurs. That is, if the confidence is high, it means that more events can occur after the condition event occurs.
3.3. Preprocessing
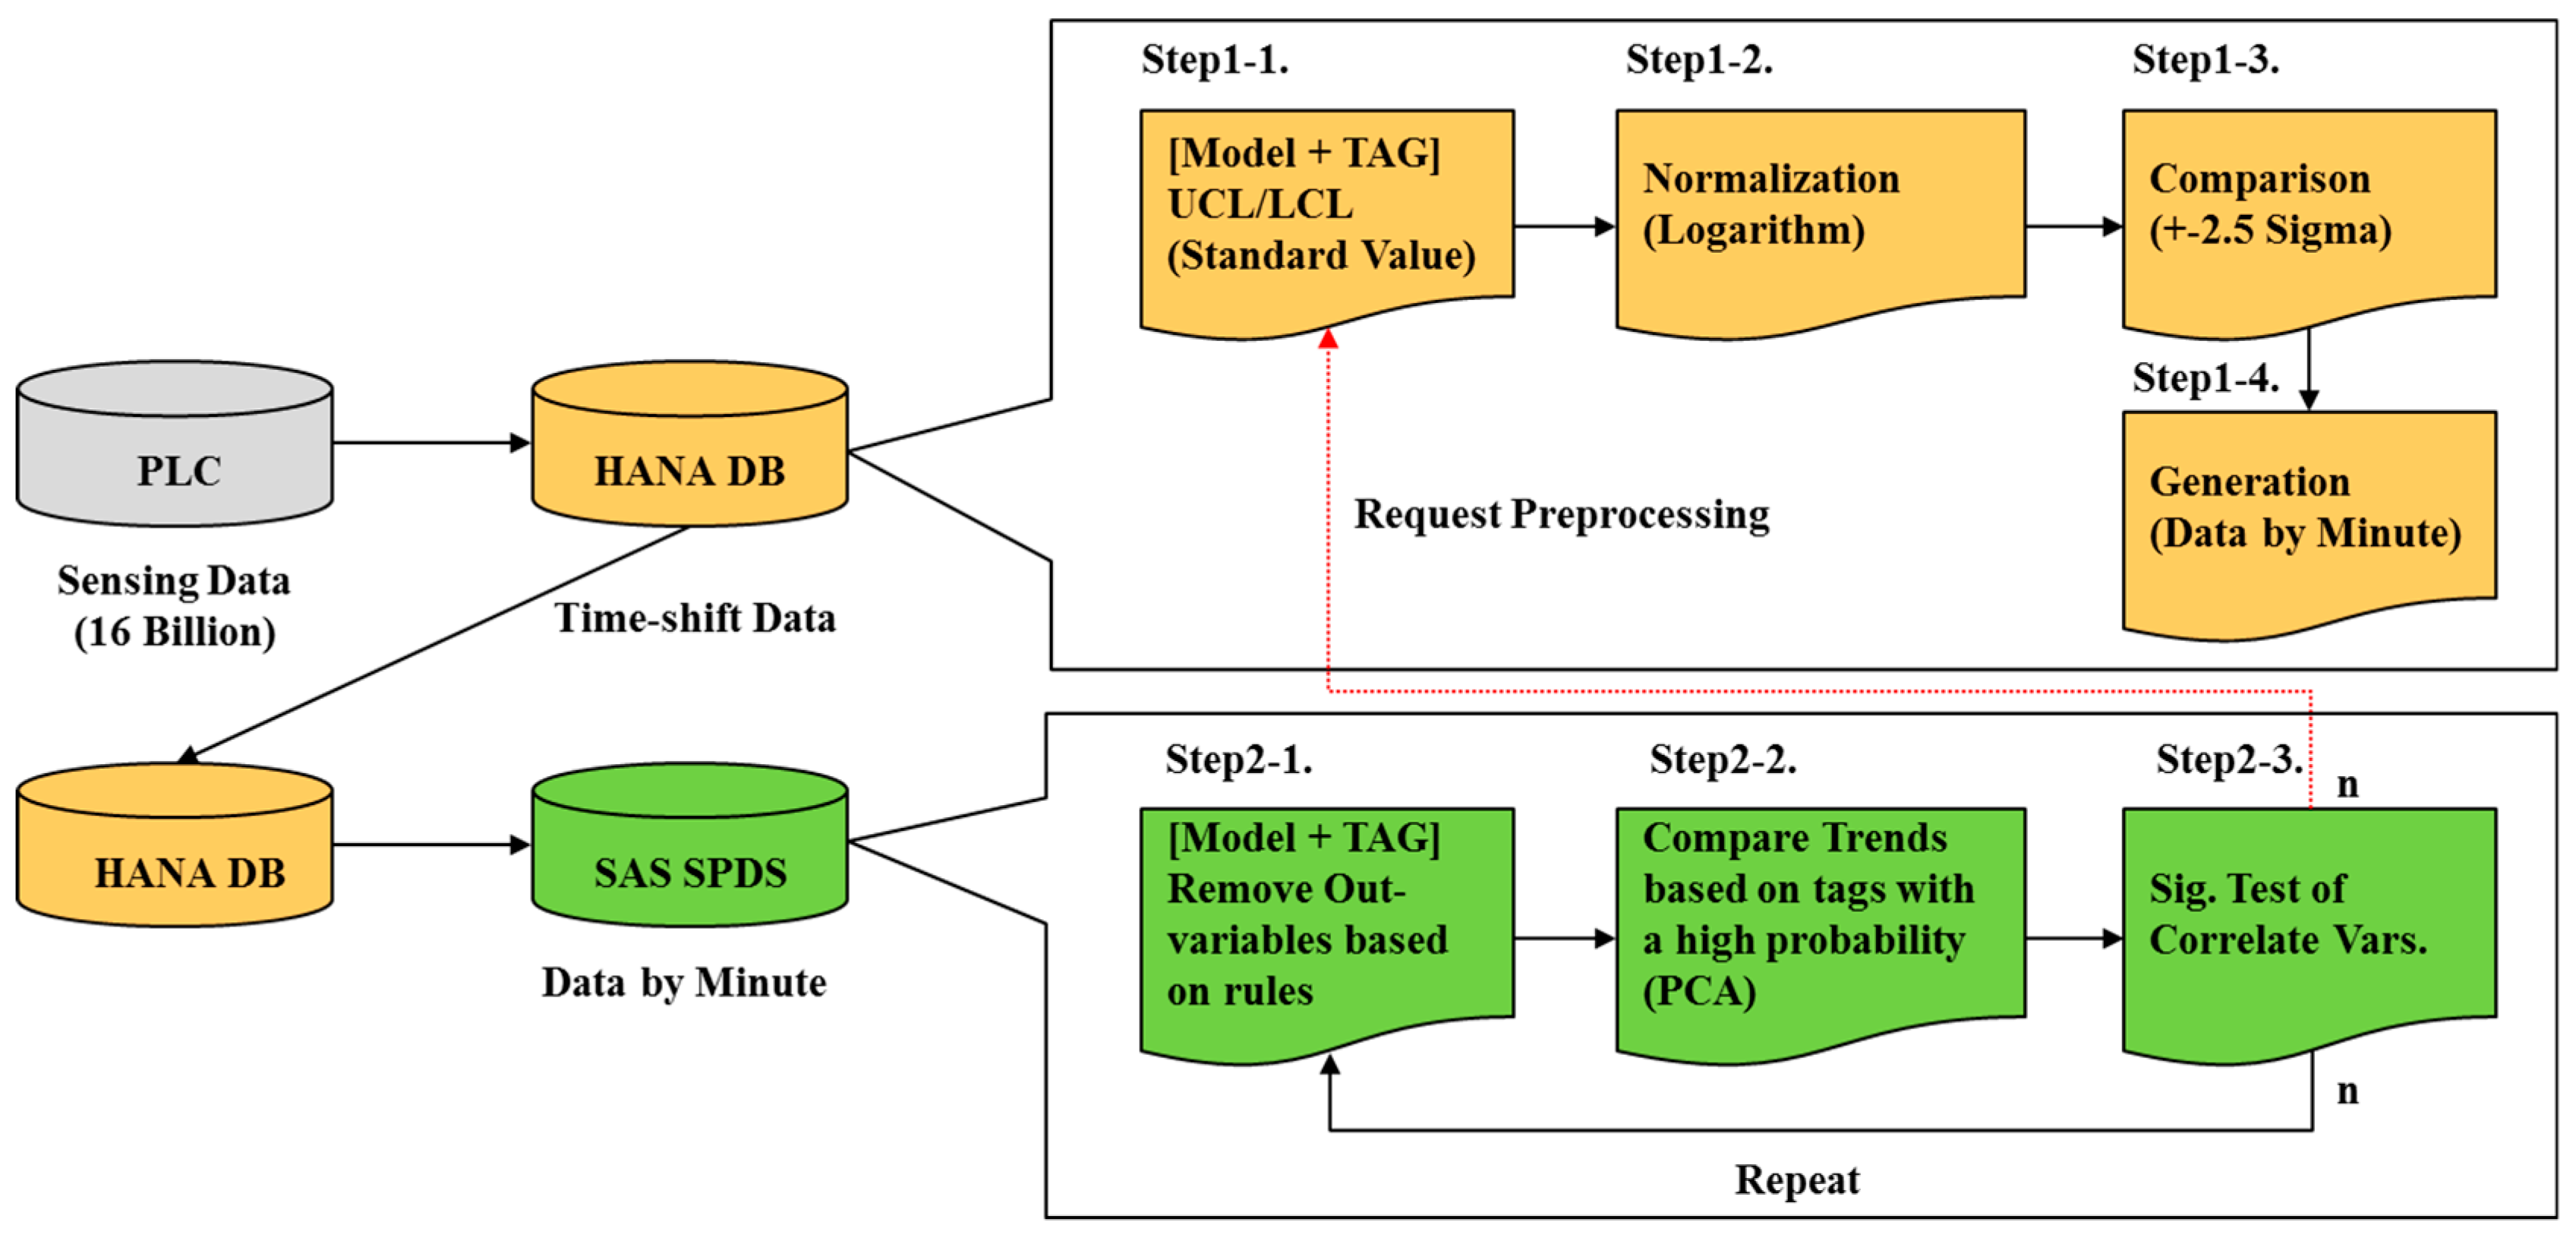
By adjusting the time frame, the data stored in the PLC were processed through the sensor into the basic data of this study. The processed data were transformed into a dataset that was easy to reanalyze. This is because they all had different thicknesses in accordance with the various product models of the plastic film. The following preprocessing was performed to achieve uniform data distribution. First, as virtually all the manufacturing data showed a very stable flow for a considerable period, normalization was applied to stabilize the distribution of each absolute value while converting the existing data from units of seconds into minute-unit data. Second, if 60 s of data were simply processed into a single average value, outliers that appeared momentarily would be difficult to catch. To solve this problem, upper and lower reference points were applied to the sensing data distribution (rule of median 3) [27]. In this case, if all of the values were included in the reference point, the existing average value was used. If any value exceeded the range, the outlier value was used as the representative value of the data per minute. This is a widely employed method for solving the problem of an average occurring when calculating the standardized value [27,28]. Step 1 in Figure 3 demonstrates the process of converting normalized variables from seconds to minutes.
Some of the 120 variables in each process sensor are very similar because of the process characteristics. Statistically, these variables have very high multicollinearity; thus, in some cases, removing these variables results in a more efficient and accurate analysis [29]. This method was used to remove variables, leaving only highly correlated tags, and prepare them for effective analysis.
3.4. Result
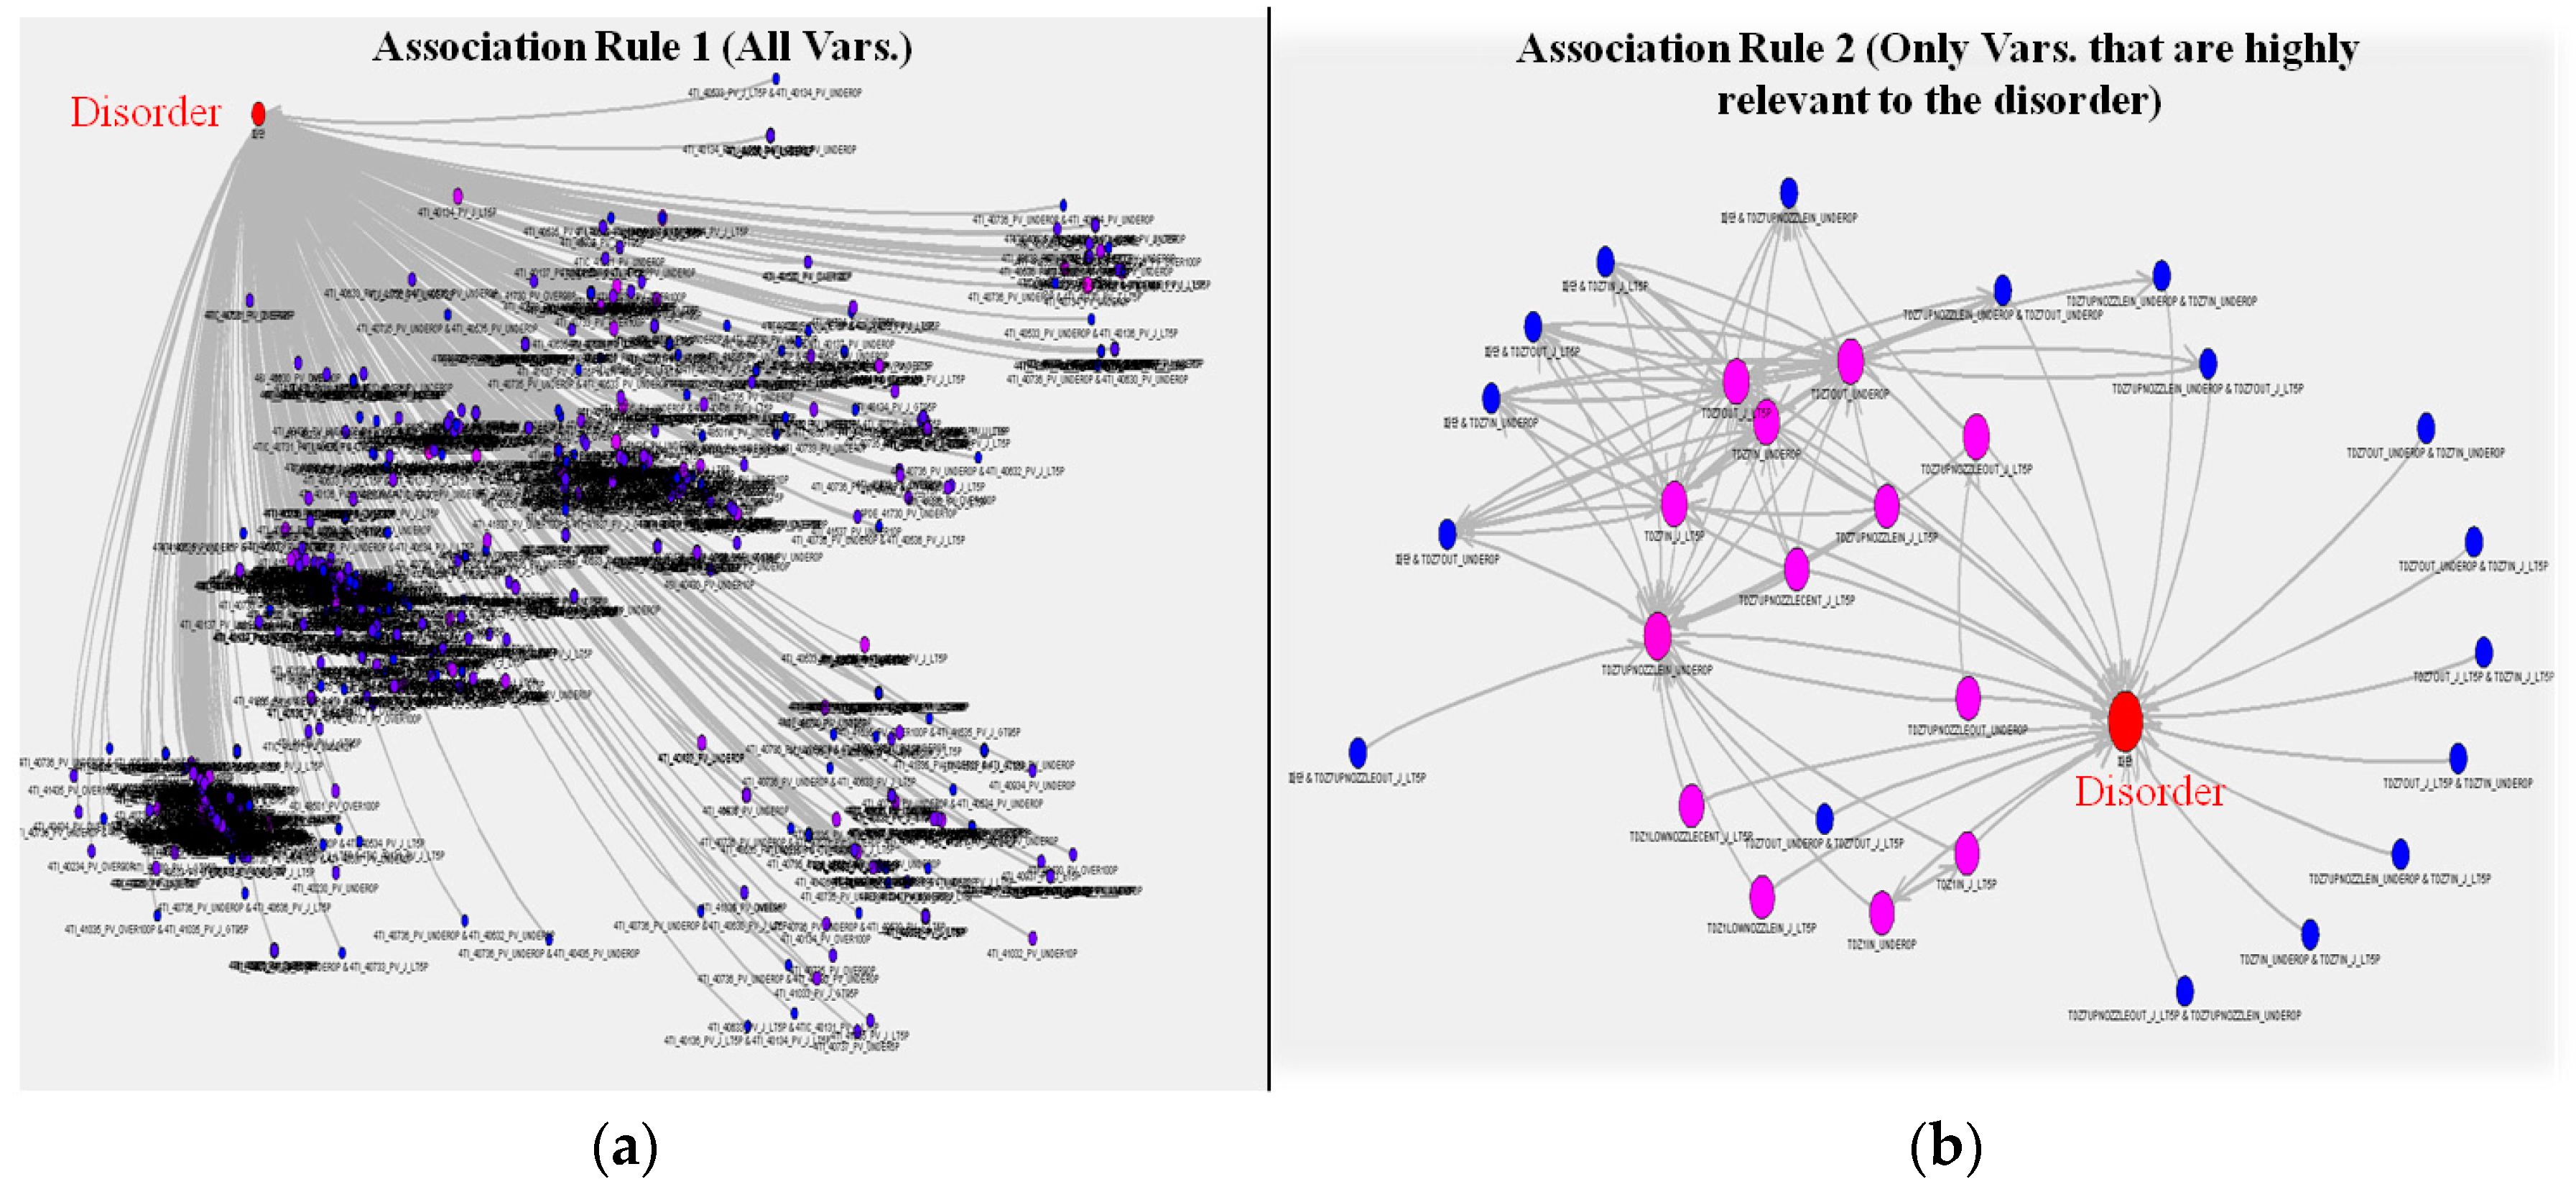
As mentioned earlier, it was not possible to predict the problem that occurred in the crusher itself until the actual event; i.e., failure of the crusher. However, based on the point at which the fracture occurred, the problem could be predicted in advance based on the problems detected by the sensor in the previous steps in the process. The association rule technique was used instead of the existing flow pattern analysis to select the tags and exact time points that could be the major factors accounting for the disorder. As shown in Figure 4a, the association rule diagram of all the variables can be grouped into several variable groups. This could be roughly divided into three fault-related tags: thickness, temperature, and motor speed. The results of the association analysis are shown in Figure 4b. It can be clearly seen that there are three large groups.
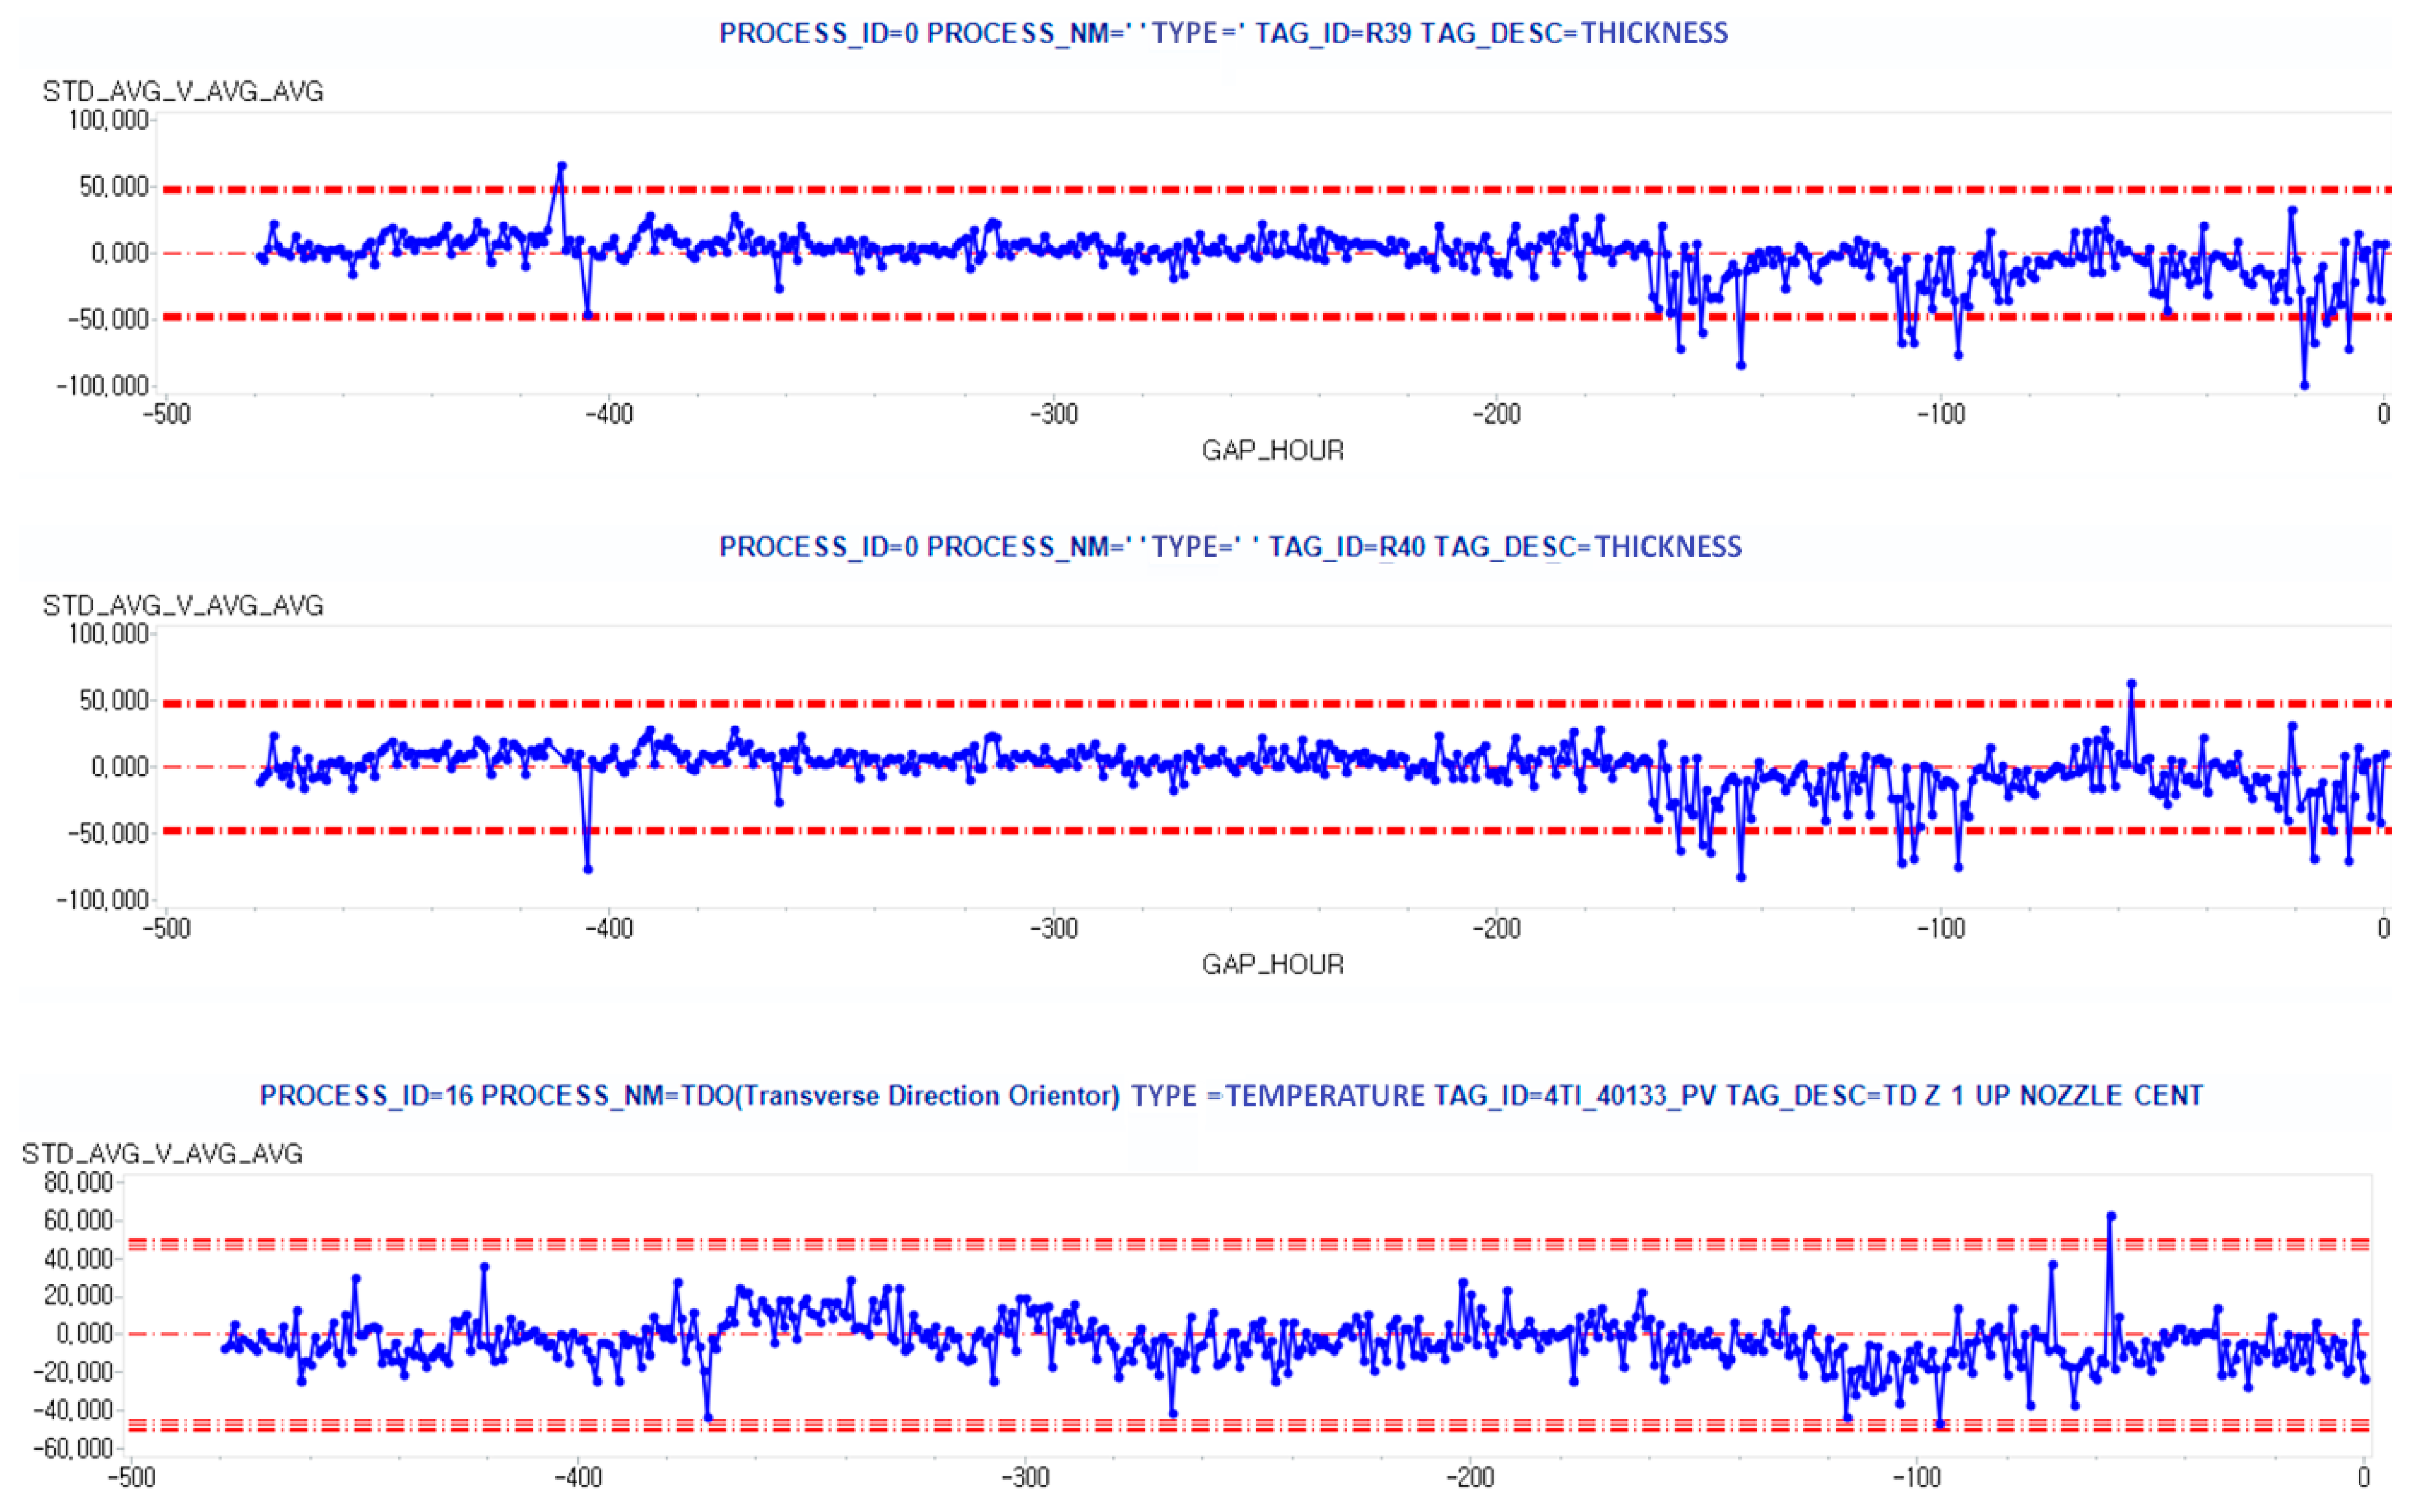
This tendency can be better understood by analyzing the wave that the main variable drew just before the point where the break occurred. Figure 5 shows the change in thickness and temperature immediately before the fracture occurred. In most cases, the wave is very stable; however, when the breaking point is reached, both function values become unstable.
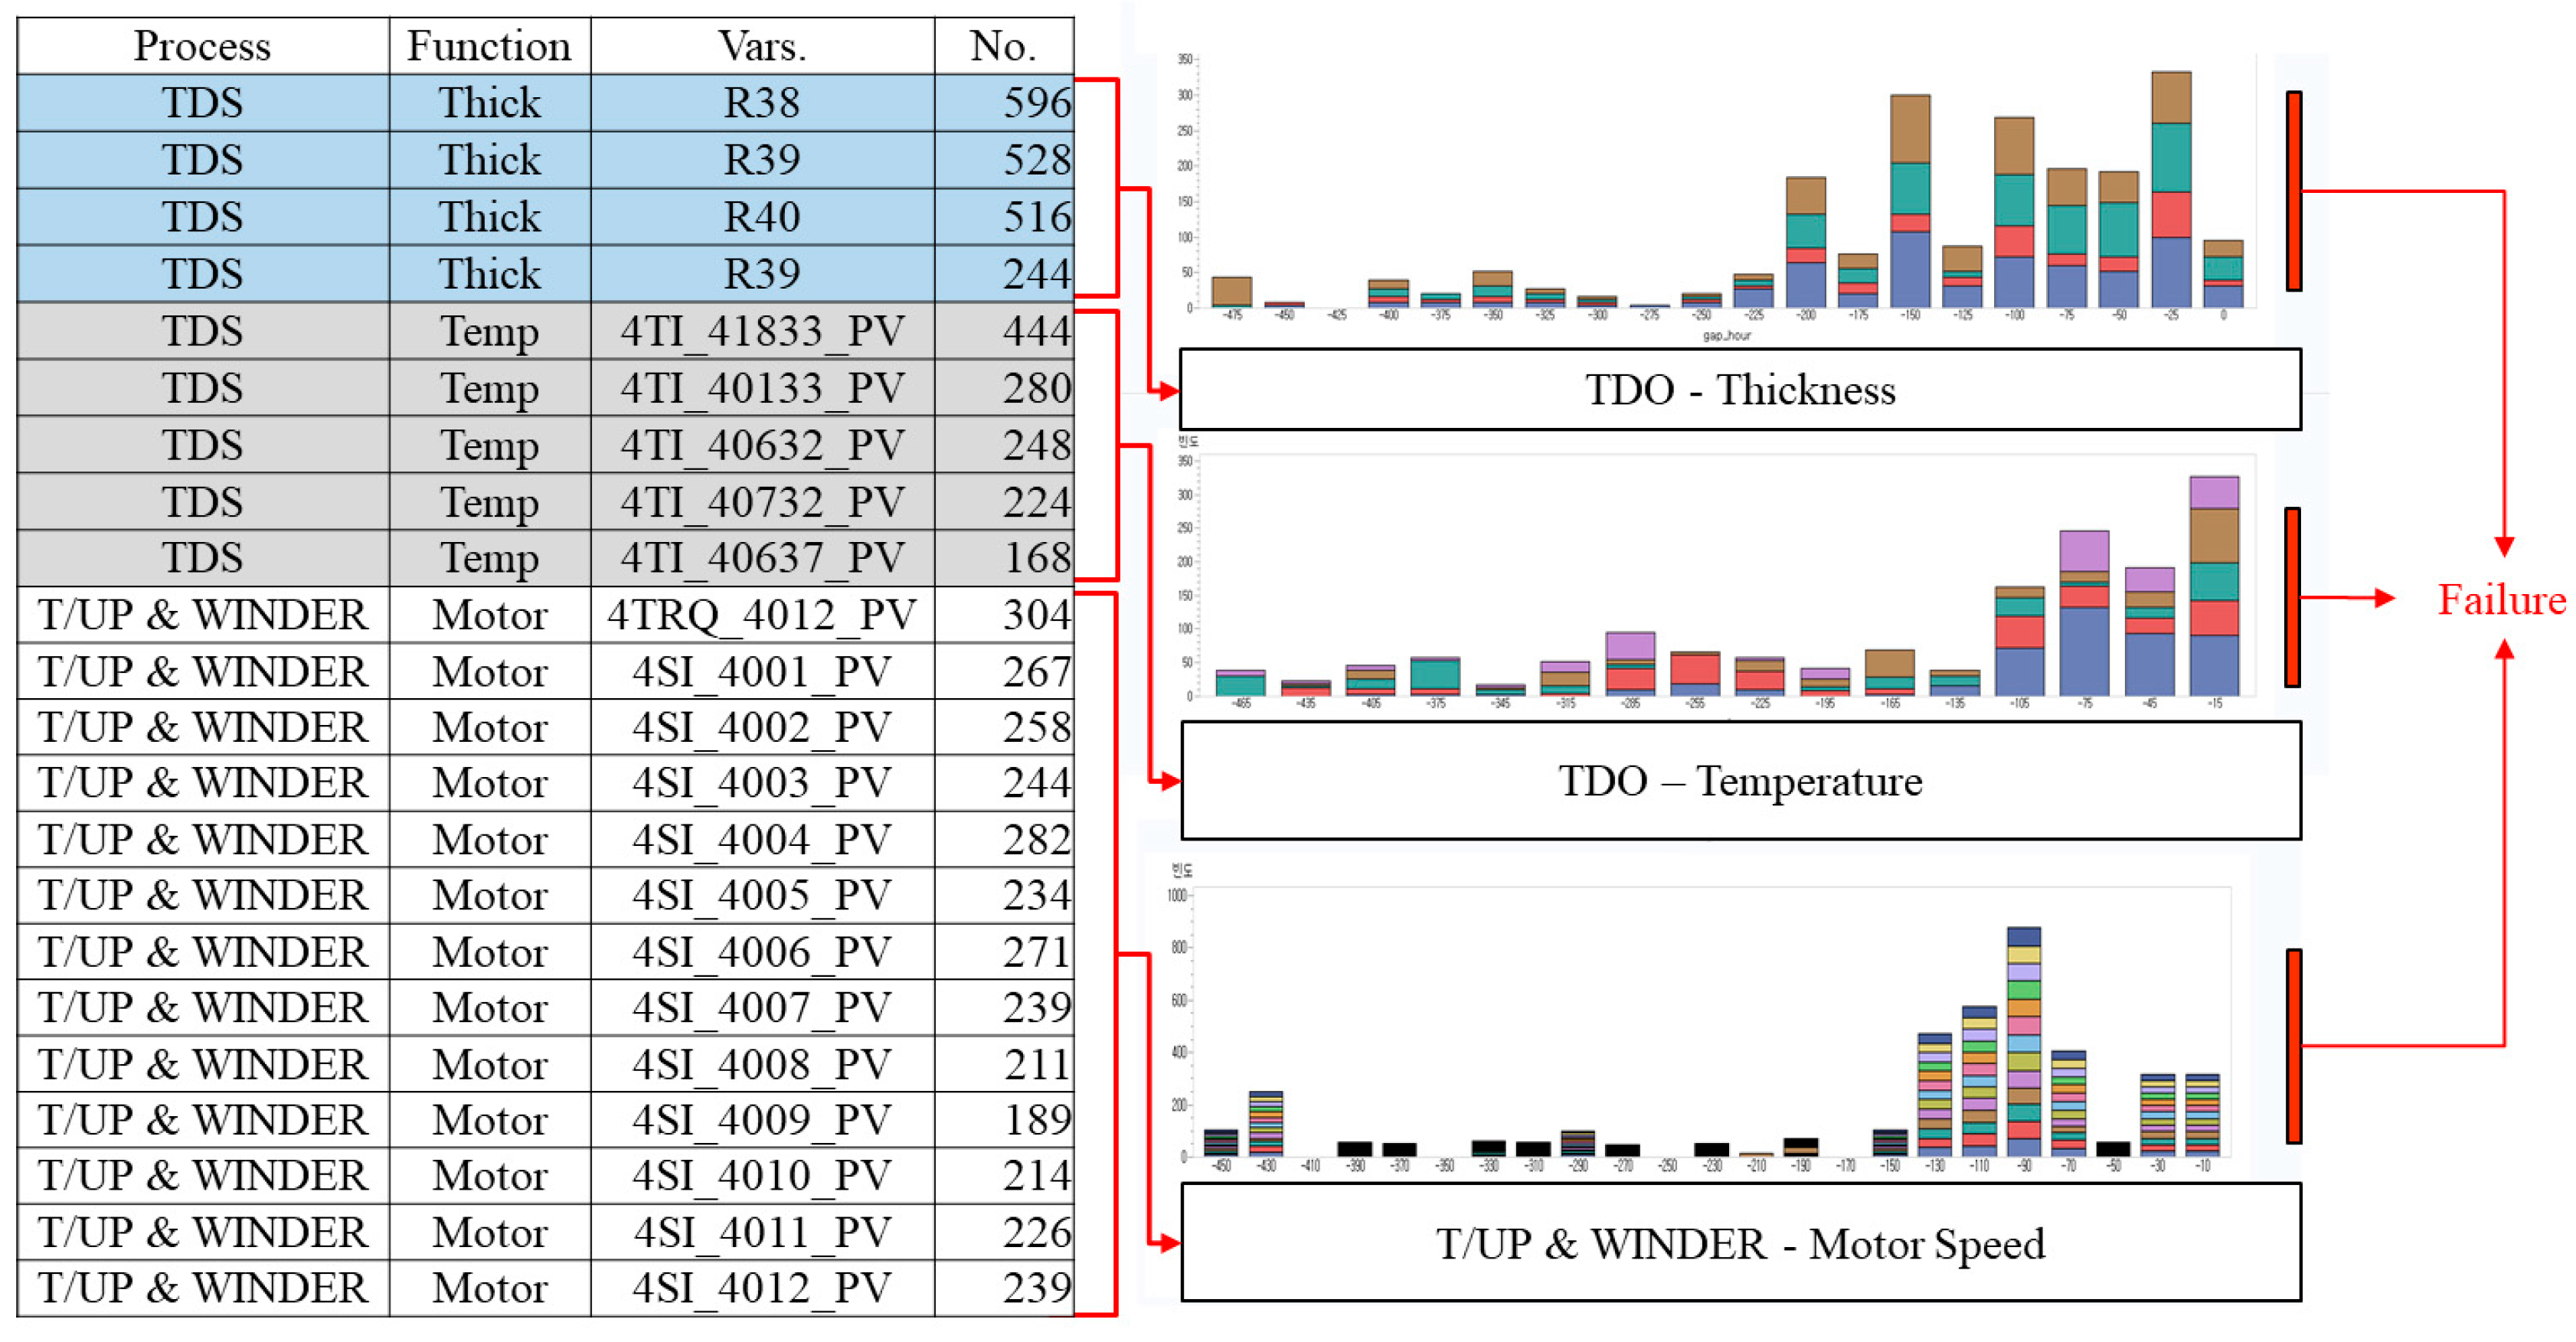
This becomes clearer when the main variable flow is observed over two years, instead of at one point: i.e., just before the complete failure. Figure 6 shows the number of times the value of the main variable deviates from the upper and lower baselines just before the break, and a significant increase in the number of breaks compared to the stable point.
3.5. Validation
To validate the proposed fracture prevention logic, the expected time for the breakage of plastic film data from 21 September 2017 to 5 January 2018 was estimated. During this period, no information about the actual break date was received from the plant manager, and the accuracy was measured by comparing the expected date with the actual date using the proposed predictive model. The date of the first detection of anomalous signs and the expected time of break was recorded using the breakdown prediction model (Table 3). In addition, the date on which the break would actually occur was identified, along with a description of the reason for the prediction, facilitating comparison of the accuracy of the predictive model. A total of four fracture occurrences in 3.5 months of data were predicted using the predictive model. Furthermore, it was confirmed that the actual breaking time and the predicted time were virtually the same. This confirms that the proposed forecasting system is able to take precautions against breakage failure, and shows predictability at least a day or two beforehand. The utility value of the fracture prediction model was verified by providing a basis for an efficient disability response based on the production plan in the field.
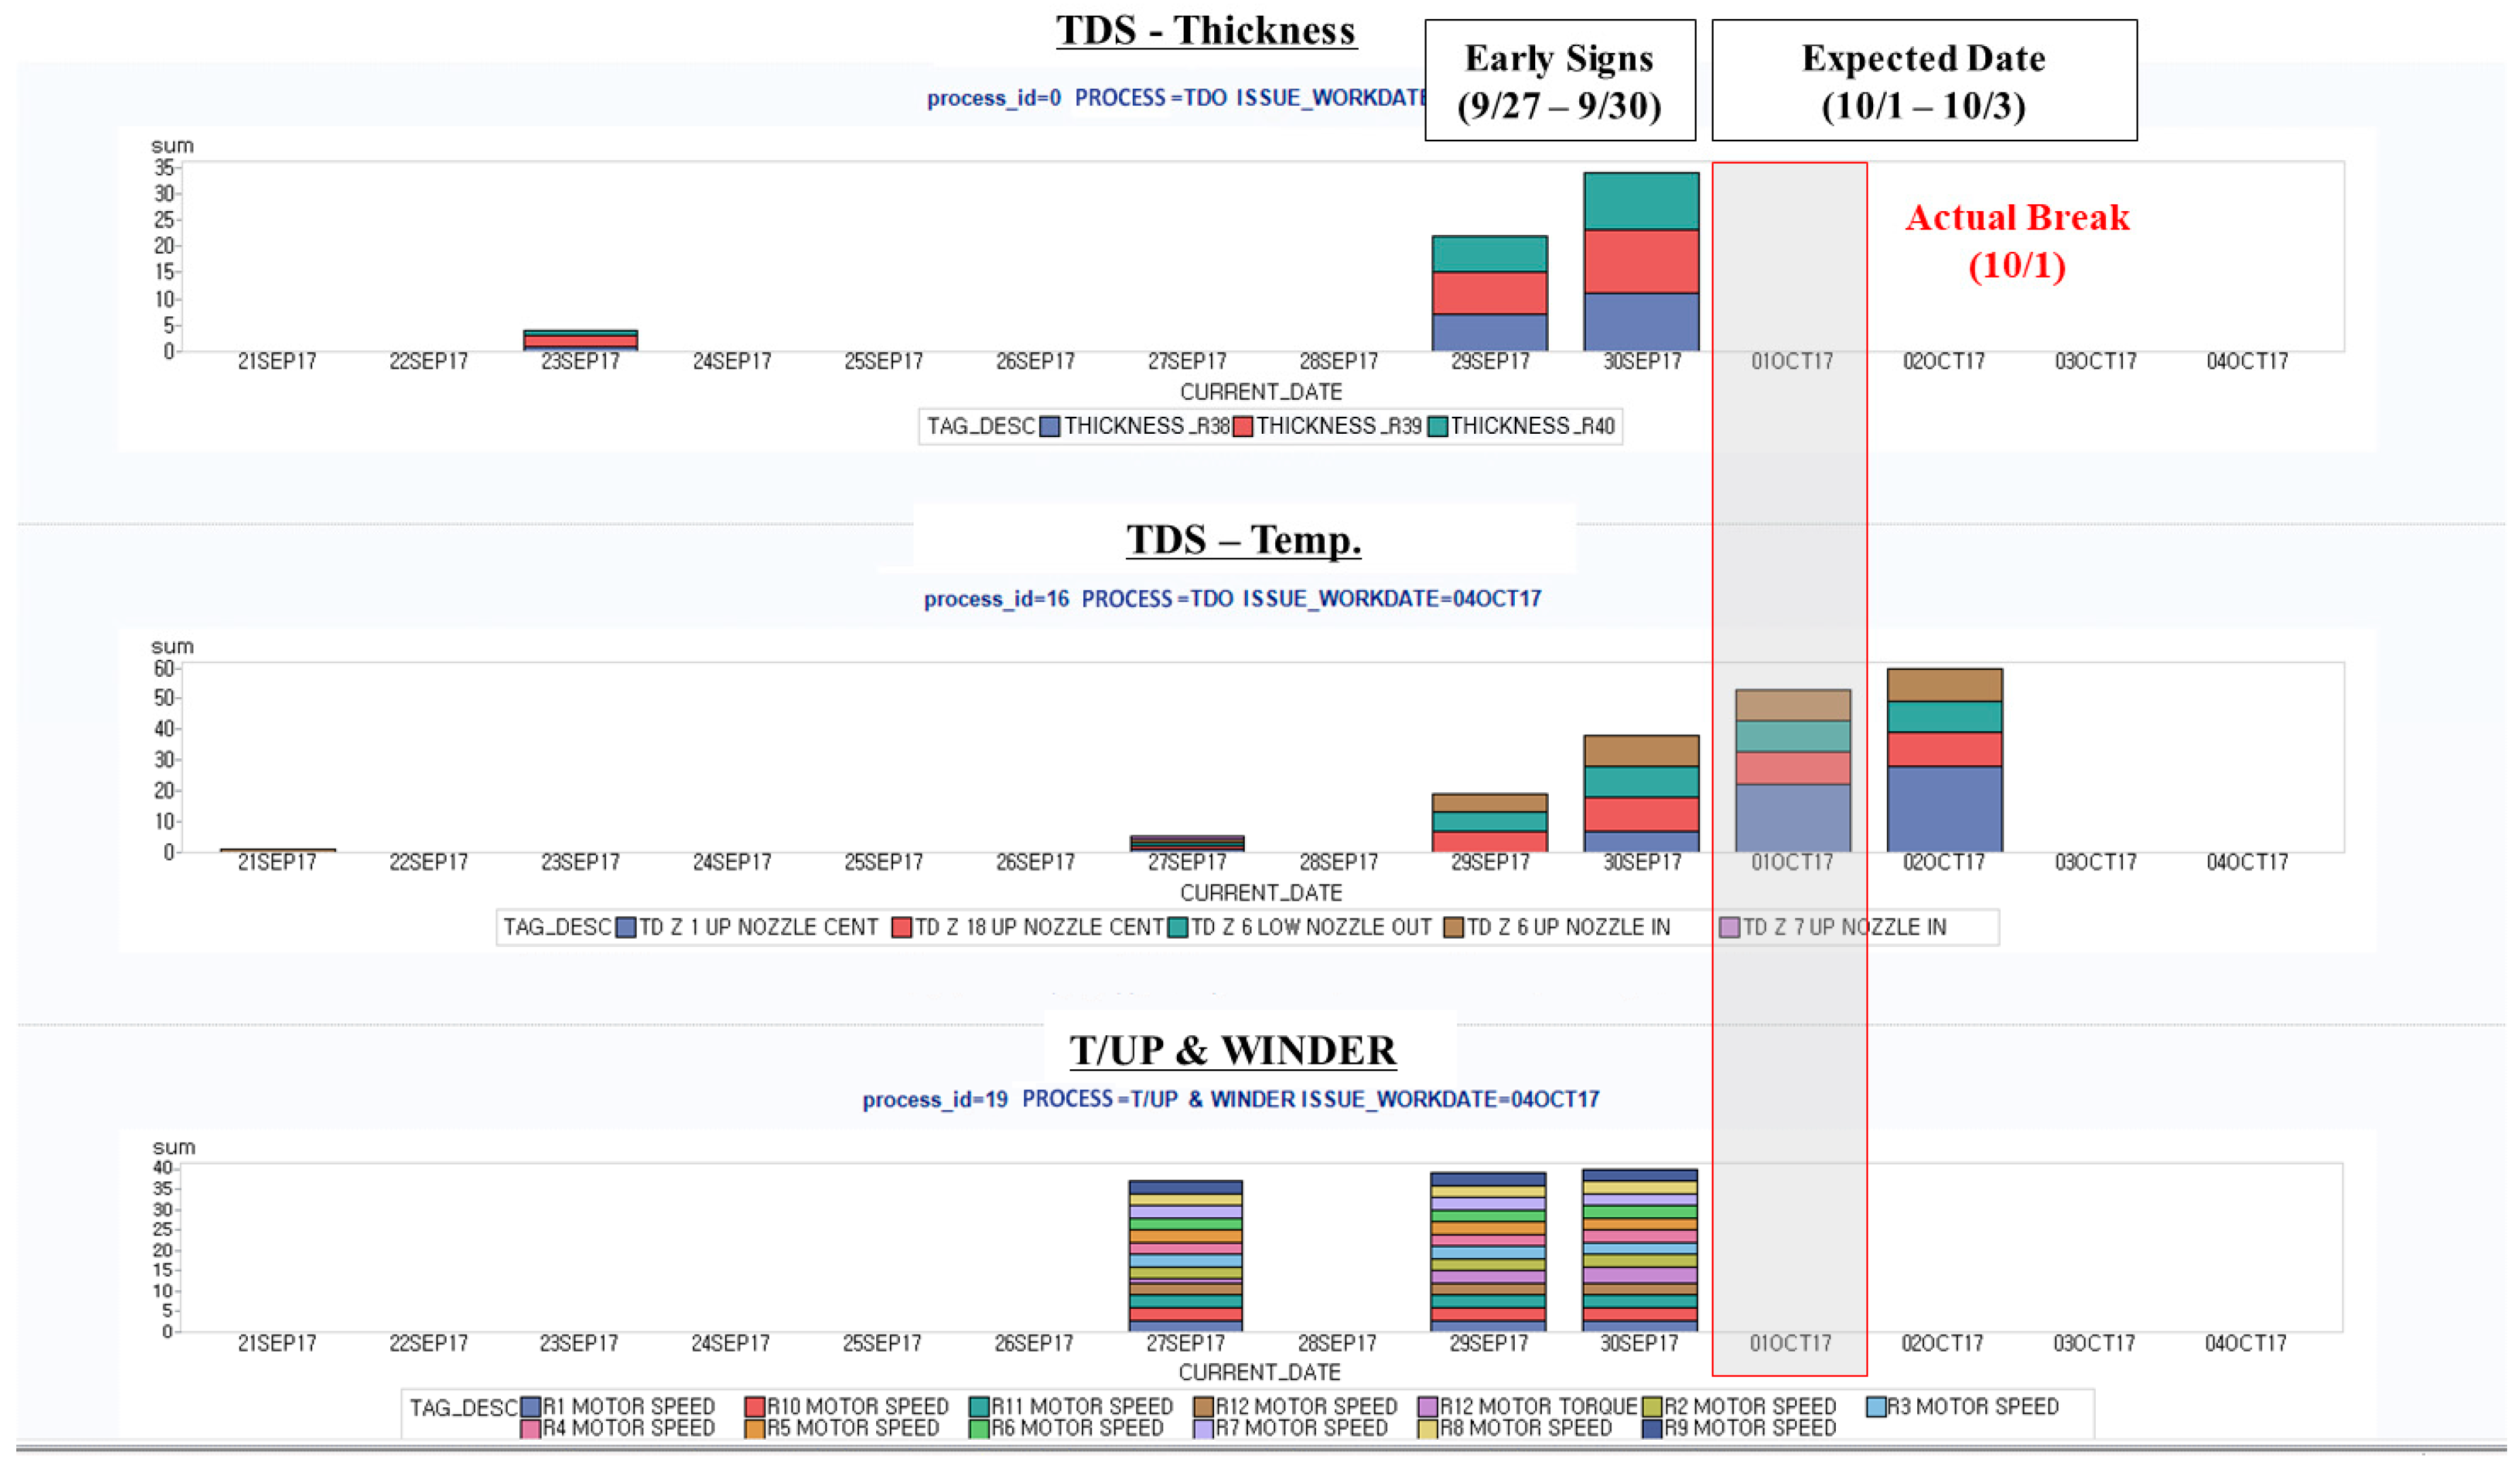
The results of the detailed verification test of the first fracture during a total of four fracture points are illustrated in Figure 7. It was confirmed that the rolling imbalance index in the take-up/winder process, and thickness and equipment temperature in the transverse-type process changed drastically, exceeding the upper and lower limits set in the study. As a result, the breaking of the crusher blade was expected to occur between 30 September and 2 October, and the actual breakage occurred on 1 October.
4. Conclusions
In this study, real-time preventive measures were formulated for a crusher process that is not automated, owing to the impossibility of sensor installation, considering various problems that may occur during the plastic film process. First, the normal flow of the plastic film production process was determined. Second, the semi-automation method and FSPC (or ASCM in situations where automated processes are not possible) were utilized. In addition, a methodology for real-time intelligent maintenance was described and implemented in actual processes. Third, a statistical early selection method for selecting the most probable variables through data preprocessing was proposed, and each process directly related to one time frame was unified through time adjustment. Fourth, a prediction analysis logic was developed and verified using the association rule method and the whole fault information, respectively. Fifth, under the digital manufacturing system, film production confirmed the possibility of bringing a new paradigm to the traditional manufacturing market through a reduction of the investment cost and management risk, and alleviation of entry barriers. Subsequently, the prediction logic was applied to new production process data to measure the prediction accuracy, and the results indeed confirmed a prediction accuracy of nearly 100%.
Furthermore, past theoretical research on plastic film production was first summarized. In addition, a real-time early warning system was developed for special processes that are difficult to automate, and its efficacy was determined. Second, existing research on the sensor-based smart process and future technology were summarized. Third, a real-time early warning system for the semi-automatic process in actual factories was developed by actualizing the above two theories and technologies. Subsequently, through a new modeling method called FSPC, virtually all of the defective parts of the semi-automatic process were identified in real time, thereby improving the sustainability of the manufacturing process.
Substantial challenges were encountered during this research, even though the smart manufacturing process has been demonstrated both theoretically and practically. First, as this was a project-based research based on PoC, it could not be easily applied to other companies’ data, because it can only be applied to a specific type of data. Second, although the research process was checked robustly at the end of the study, there was no comparative study of other methodologies using only the association rule as the analysis methodology. Third, understanding the relationships among the physical properties such as the problem of the raw materials and the combination of the coating liquid with the sensing data based on the process itself is limited. Finally, although it appears to be a fundamental problem of this study, deduction of the semi-automated process through the automatic sensor process is inevitable. In other words, several semi-automatic process zones, which are the so-called gray zones of automation, had to be automated. Thus, several limitations of this study are linked to future research tasks. In the future, the predictive models should be generalized by obtaining more plastic film production process data. In addition, the best model selection method should be applied to the process to create a predictive model using several methodologies, and the model test itself should be programmed to perform flexibly in different situations. Finally, more semi-automated zones, such as coating solution combinations, need to be identified, and techniques to automate them need to be formulated.
Author Contributions
J.K. and H.H. researched related works and designed the project. J.K. collected and analyzed the data. H.H. validated the analysis and provided the corresponding descriptions in the paper.
Funding
This research received no external funding.
Conflicts of Interest
The authors declare no conflict of interest.
References
- Stouraitis, V.; Mior Harun, M.H.; Kyritsis, M. Motivators of SME initial export choice and the European Union regional effect in manufacturing. Int. J. Entrep. Behav. Res. 2017, 23, 35–55. [Google Scholar]
- Grant, D.; Yeo, B. A global perspective on tech investment, financing, and ICT on manufacturing and service industry performance. Int. J. Inf. Manag. 2018, 43, 130–145. [Google Scholar] [CrossRef]
- Wan, J.; Tang, S.; Li, D.; Wang, S.; Liu, C.; Abbas, H.; Vasilakos, A.V. A manufacturing big data solution for active preventive maintenance. IEEE Trans. Ind. Inform. 2017, 13, 2039–2047. [Google Scholar] [CrossRef]
- Kocmanová, A.; Pavláková Dočekalová, M.; Škapa, S.; Smolíková, L. Measuring corporate sustainability and environmental, social, and corporate governance value added. Sustainability 2016, 8, 945. [Google Scholar] [CrossRef]
- Jeon, J.; Sohn, S.Y. Product failure pattern analysis from warranty data using association rule and Weibull regression analysis: A case study. Reliab. Eng. Syst. Saf. 2015, 133, 176–183. [Google Scholar] [CrossRef]
- Li, F.; Zhang, L.; Liu, Y.; Laili, Y.; Tao, F. A clustering network-based approach to service composition in cloud manufacturing. Int. J. Comput. Integr. Manuf. 2017, 30, 1331–1342. [Google Scholar] [CrossRef]
- Meng, Y.; Yang, Y.; Chung, H.; Lee, P.-H.; Shao, C. Enhancing Sustainability and Energy Efficiency in Smart Factories: A Review. Sustainability 2018, 10, 4779. [Google Scholar] [CrossRef]
- Hu, S.-C.; Shiue, A.; Chiu, Y.-S.; Wang, A.; Chen, J. Simplified Heat and Mass Transfer Model for Cross-Flow and Countercurrent Flow Packed Bed Tower Dehumidifiers with a Liquid Desiccant System. Sustainability 2016, 8, 1264. [Google Scholar] [CrossRef]
- Xu, J.; Jiang, X.; Wu, Z. A Sustainable Performance Assessment Framework for Plastic Film Supply Chain Management from a Chinese Perspective. Sustainability 2016, 8, 1042. [Google Scholar] [CrossRef]
- Lee, J.; Turng, L.S. Improving surface quality of microcellular injection molded parts through mold surface temperature manipulation with thin film insulation. Polym. Eng. Sci. 2010, 50, 1281–1289. [Google Scholar]
- Pang, M.; Liu, X.; Liu, K. Effect of wettability on the friction of a laser-textured cemented carbide surface in dilute cutting fluid. Adv. Mech. Eng. 2017, 9. [Google Scholar] [CrossRef]
- Ferreira, A.; Costa, P.; Carvalho, H.; Nóbrega, J.M.; Sencadas, V.; Lanceros-Mendez, S. Extrusion of poly (vinylidene fluoride) filaments: Effect of the processing conditions and conductive inner core on the electroactive phase content and mechanical properties. J. Polym. Res. 2011, 18, 1653–1658. [Google Scholar] [CrossRef]
- Pennacchia, E.; Tiberi, M.; Carbonara, E.; Astiaso Garcia, D.; Cumo, F. Reuse and upcycling of municipal waste for zeb envelope design in European urban areas. Sustainability 2016, 8, 610. [Google Scholar] [CrossRef]
- Saul, C.J.; Gebauer, H. Digital Transformation as an Enabler for Advanced Services in the Sanitation Sector. Sustainability 2018, 10, 752. [Google Scholar] [CrossRef]
- Zucker, R.V.; Kim, G.H.; Carter, W.C.; Thompson, C.V. A model for solid-state dewetting of a fully-faceted thin film. C. R. Phys. 2013, 14, 564–577. [Google Scholar] [CrossRef]
- Chen, B.; Wan, J.; Shu, L.; Li, P.; Mukherjee, M.; Yin, B. Smart Factory of Industry 4.0: Key Technologies, Application Case, and Challenges. IEEE Access 2018, 6, 6505–6519. [Google Scholar] [CrossRef]
- Wan, J.; Chen, B.; Wang, S.; Xia, M.; Li, D.; Liu, C. Fog Computing for Energy-aware Load Balancing and Scheduling in Smart Factory. IEEE Trans. Ind. Inform. 2018, 14, 4548–4556. [Google Scholar] [CrossRef]
- Herrmann, C.; Schmidt, C.; Kurle, D.; Blume, S.; Thiede, S. Sustainability in manufacturing and factories of the future. Int. J. Precis. Eng. Manuf. Green Technol. 2014, 1, 283–292. [Google Scholar] [CrossRef] [Green Version]
- Hwang, G.; Lee, J.; Park, J.; Chang, T.-W. Developing performance measurement system for Internet of Things and smart factory environment. Int. J. Prod. Res. 2017, 55, 2590–2602. [Google Scholar] [CrossRef]
- Davis, J.; Edgar, T.; Porter, J.; Bernaden, J.; Sarli, M. Smart manufacturing, manufacturing intelligence and demand-dynamic performance. Comput. Chem. Eng. 2012, 47, 145–156. [Google Scholar] [CrossRef]
- Jiang, J.-R. An improved cyber-physical systems architecture for Industry 4.0 smart factories. Adv. Mech. Eng. 2018, 10. [Google Scholar] [CrossRef]
- Wang, S.; Wan, J.; Zhang, D.; Li, D.; Zhang, C. Towards smart factory for industry 4.0: A self-organized multi-agent system with big data based feedback and coordination. Comput. Netw. 2016, 101, 158–168. [Google Scholar] [CrossRef]
- Wan, J.; Chen, B.; Imran, M.; Tao, F.; Li, D.; Liu, C.; Ahmad, S. Toward Dynamic Resources Management for IoT-Based Manufacturing. IEEE Commun. Mag. 2018, 56, 52–59. [Google Scholar] [CrossRef]
- Brundtland, G.H. Our common future—Call for action. Environ. Conserv. 1987, 14, 291–294. [Google Scholar] [CrossRef]
- Toni, M.; Renzi, M.F.; Mattia, G. Understanding the link between collaborative economy and sustainable behaviour: An empirical investigation. J. Clean. Prod. 2018, 172, 4467–4477. [Google Scholar] [CrossRef]
- Hwangbo, H.; Kim, J.; Lee, Z.; Kim, S. Store layout optimization using indoor positioning system. Int. J. Distrib. Sens. Netw. 2017, 13. [Google Scholar] [CrossRef]
- Guoqing, W.; Yiping, L.; Dan, W. Bearing fault prediction system design based on SPC. J. Fail. Anal. Prev. 2016, 16, 129–134. [Google Scholar] [CrossRef]
- Azad, M.A.; Osorio, J.G.; Brancazio, D.; Hammersmith, G.; Klee, D.M.; Rapp, K.; Myerson, A. A compact, portable, re-configurable, and automated system for on-demand pharmaceutical tablet manufacturing. Int. J. Pharm. 2018, 539, 157–164. [Google Scholar] [CrossRef]
- Bignardi, A.; El Faro, L.; Torres Júnior, R.; Cardoso, V.; Machado, P.; Albuquerque, L.G. Random regression models using different functions to model test-day milk yield of Brazilian Holstein cows. Genet. Mol. Res. 2011, 10, 3565–3575. [Google Scholar] [CrossRef]
Figure 1.
Plastic film production process.

Figure 2.
Time frame shift.

Figure 3.
Preprocessing.

Figure 4.
Association rule diagram of all variables (a) and results of the association analysis (b).
Figure 4.
Association rule diagram of all variables (a) and results of the association analysis (b).

Figure 5.
Tag failure stream one (at a single point).

Figure 6.
Tag failure stream two (at all points).

Figure 7.
Results of validation test (1 October).


Table 1.
Anomaly detection techniques.
| Technique | Contents | References |
|---|---|---|
| Model-based Logic | Using traditional statistical formats such as probability distribution models | Kocmanová, et al. [4] |
| Association Rule | Finding an abnormal value through the density between objects or rules of association | Jeon and Sohn [5] |
| Clustering Method | Calculating the distance between objects and creating a cluster to detect anomaly | Li, et al. [6] |
| Deep Learning Algorithm | Improving accuracy through continuous learning of its algorithm | Meng, et al. [7] |
Table 2.
Main factors of smart factory.
| Factors | Domain Definition | Practical Application |
|---|---|---|
| Intelligence | Construction of brain system through self-evolution of algorithm |
|
| Connectivity | Quantitative and qualitative expansion of production data |
|
| Activity | Traditional and passive factory performs active response |
|
| Reliability | Stability and continuity of production operation management |
|
| Agility | System performance guarantee as production operation system |
|
Table 3.
Failure forecasting for validation. TDS: transverse direction stretching.
| First Detection | Forecasted Period | Reason for the Forecast | Actual Breaking Date |
|---|---|---|---|
| 27 September | 30 September to 2 October | TDS thickness, temperature, and T/up Winder’s motor speed/torque increased | 1 October |
| 11 October | 15 October to 17 October | Pre-fracture signs of T/up Winder’s motor speed/torque have occurred | 18 October |
| 10 November | 13 November to 16 November | Pre-sign increased in thickness on TDS | 15 November |
| 28 December | 30 December to 2 January | Pre-sign increased in TDS temperature and T/up Winder motor speed/torque | 2 January |
© 2019 by the authors. Licensee MDPI, Basel, Switzerland. This article is an open access article distributed under the terms and conditions of the Creative Commons Attribution (CC BY) license (http://creativecommons.org/licenses/by/4.0/).
Share and Cite
MDPI and ACS Style
Kim, J.; Hwangbo, H. Real-Time Early Warning System for Sustainable and Intelligent Plastic Film Manufacturing. Sustainability 2019, 11, 1490. https://doi.org/10.3390/su11051490
AMA Style
Kim J, Hwangbo H. Real-Time Early Warning System for Sustainable and Intelligent Plastic Film Manufacturing. Sustainability. 2019; 11(5):1490. https://doi.org/10.3390/su11051490
Chicago/Turabian StyleKim, Jonghyuk, and Hyunwoo Hwangbo. 2019. "Real-Time Early Warning System for Sustainable and Intelligent Plastic Film Manufacturing" Sustainability 11, no. 5: 1490. https://doi.org/10.3390/su11051490
Note that from the first issue of 2016, this journal uses article numbers instead of page numbers. See further details here.