A Data-Driven Approach to Development of a Taxonomy Framework for Triple Bottom Line Metrics


1
Human Technology Group, Department of Electromechanical Engineering and Centre for Mechanical and Aerospace Science and Technology, Universidade da Beira Interior, 6201-001 Covilhã, Portugal
2
Department of Computer Science and Cloud Computing Competence Centre, Universidade da Beira Interior, 6201-001 Covilhã, Portugal
3
Human Factors and Ergonomics Group, Department of Supply Chain and Operations Management, School of Engineering, Jönköping University, 55111 Jönköping, Sweden
*
Author to whom correspondence should be addressed.
Sustainability 2019, 11(9), 2717; https://doi.org/10.3390/su11092717
Submission received: 8 February 2019
/
Revised: 12 April 2019
/
Accepted: 7 May 2019
/
Published: 13 May 2019
Abstract
:This paper proposes a data-driven approach to develop a taxonomy in a data structure on list for triple bottom line (TBL) metrics. The approach is built from the authors reflection on the subject and review of the literature about TBL. The envisaged taxonomy framework grid to be developed through this approach will enable existing metrics to be classified, grouped, and standardized, as well as detect the need for further metrics development in uncovered domains and applications. The approach reported aims at developing a taxonomy structure that can be seen as a bi-dimensional table focusing on feature interrogations and characterizing answers, which will be the basis on which the taxonomy can then be developed. The interrogations column is designed as the stack of the TBL metrics features: What type of metric is it (qualitative, quantitative, or hybrid)? What is the level of complexity of the problems where it is used? What standards does it follow? How is the measurement made, and what are the techniques that it uses? In what kinds of problems, subjects, and domains is the metric used? How is the metric validated? What is the method used in its calculation? The column of characterizing answers results from a categorization of the range of types of answers to the feature interrogations. The approach reported in this paper is based on a screening tool that searches and analyzes information both within abstracts and full-text journal papers. The vision for this future taxonomy is that it will enable locating for any specific context, discern what TBL metrics are used in that context or similar contexts, or whether there is a lack of developed metrics. This meta knowledge will enable a conscious decision to be made between creating a new metric or using one of those that already exists. In this latter case, it would also make it possible to choose, among several metrics, the one that is most appropriate to the context at hand. In addition, this future framework will ease new future literature revisions, when these are viewed as updates of this envisaged taxonomy. This would allow creating a dynamic taxonomy for TBL metrics. This paper presents a computational approach to develop such taxonomy, and reports on the initial steps taken in that direction, by creating a taxonomy framework grid with a computational approach.
1. Introduction
In this introductory section, we give an explanation about the objectives of this work, the solution found, and how the paper is structured. The aim of this work began as a study about triple bottom line (TBL) metrics and the approach to building a taxonomy. The aim of such a taxonomy is to be able to navigate among existing metrics, characterized according to several questions:
- Q1-What kind of metric is this?
- Q2-What is the complexity of the problems where the metric is used?
- Q3-What standards does it follow?
- Q4-How are the measurements made, what are the measuring techniques used?
- Q5-In what kind of problems, subjects, and domains is the metric used? Where it is used?
- Q6-How is the metric validated?
- Q7-What are the methods used in its calculation?
The envisaged taxonomy will allow for the metrics to be categorized. In the process of ideation that led us from a review of literature to the approach to building a taxonomy, we were naturally driven by a context of meta-analysis. Within the context of using a TBL metric, this envisaged taxonomy will aid in discerning what metrics are used in similar contexts. This will also allow for conscious choosing of what metric is more appropriate or whether it is better to build a new one. Our intended taxonomy is also set as the kick-start of an updatable framework, for use in systematic reviews, and evolving through meta-analysis techniques. To do that we have developed a set of automatic tools to enable the automation of this procedure as much as possible. The remainder of the paper is structured in three sections: (1) Glass’s approach to meta-analysis, (2) a computational approach to meta-analysis, and (3) discussion of the approach presented to build an envisaged taxonomy for TBL metrics.
2. Glass’s Approach to Meta-Analysis
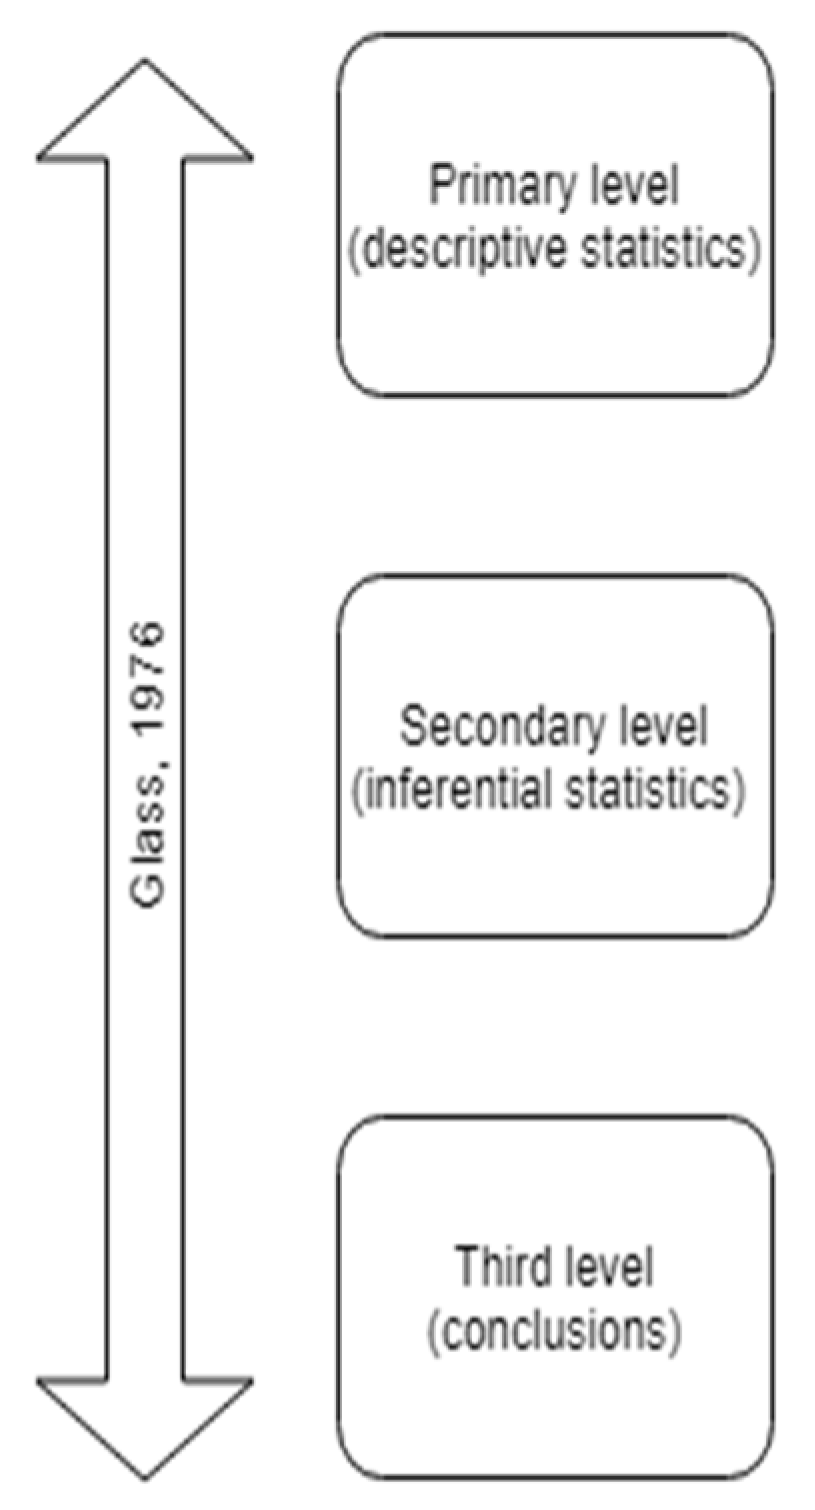
Meta-analysis is the quantitative, scientific synthesis of research results [1]. It is used in two different ways [2]: for summarizing and combining the quantitative results of research or as a method to reach a quantitative effect size [3] based on individual studies. It uses many quantitative approaches and calculation formulas when compiling multiple research findings [4]. The term meta-analysis of research was a term coined by Glass in 1976 in a seminal article [5]. In this paper, he described the process of data analysis in three levels (Figure 1). The primary level is about what is typically imagined as the application of statistical methods. The secondary analysis is called the systematic review and it is about a re-analysis of data for the purpose of answering the original research question with better statistical techniques or answering new questions with old data. The third level is the meta-analysis level. Glass said that this term should be precise and adopted in the spirit of “metamathematics”, “meta-psychology”, and “meta-evaluation”, and that meta-analysis refers to the analysis of analyses. Precising the term, Glass said that he used the term meta-analysis as the statistical analysis of a large collection of analysis results from individual studies for the purpose of integrating the findings.
Indeed, meta-analysis resorts to a set of tools to collect and analyze data. Hence, the meta-analysis approach touches data science areas as descriptive statistics techniques and inferential statistics techniques.
3. A Data Science Approach to Meta-Analysis
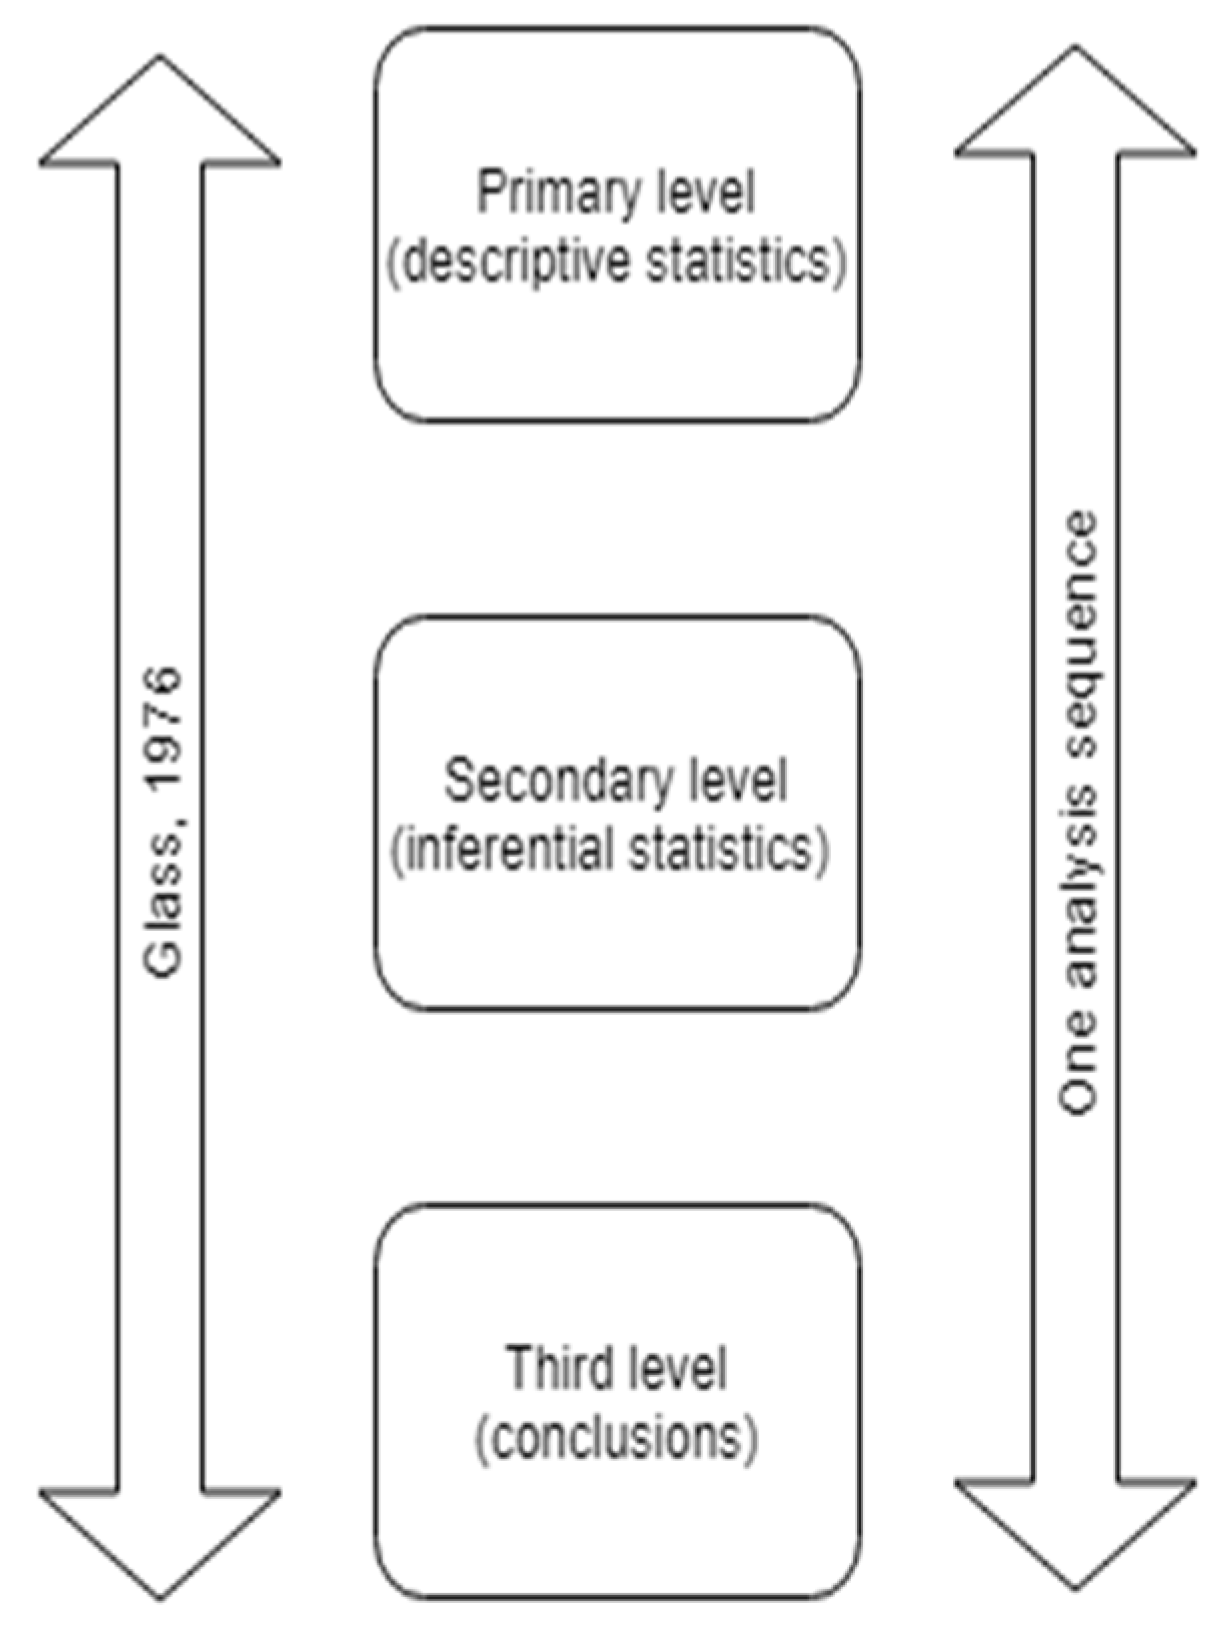
In this section, we describe our approach to the meta-analysis process, and we describe our work in that context. In our point of view, and we are not alone in that [4], the three levels defined by Glass should be worked in an integrated mode. We think that they must work as a unity (primary level, secondary level, third level). We call that unity an analysis sequence (Figure 2).
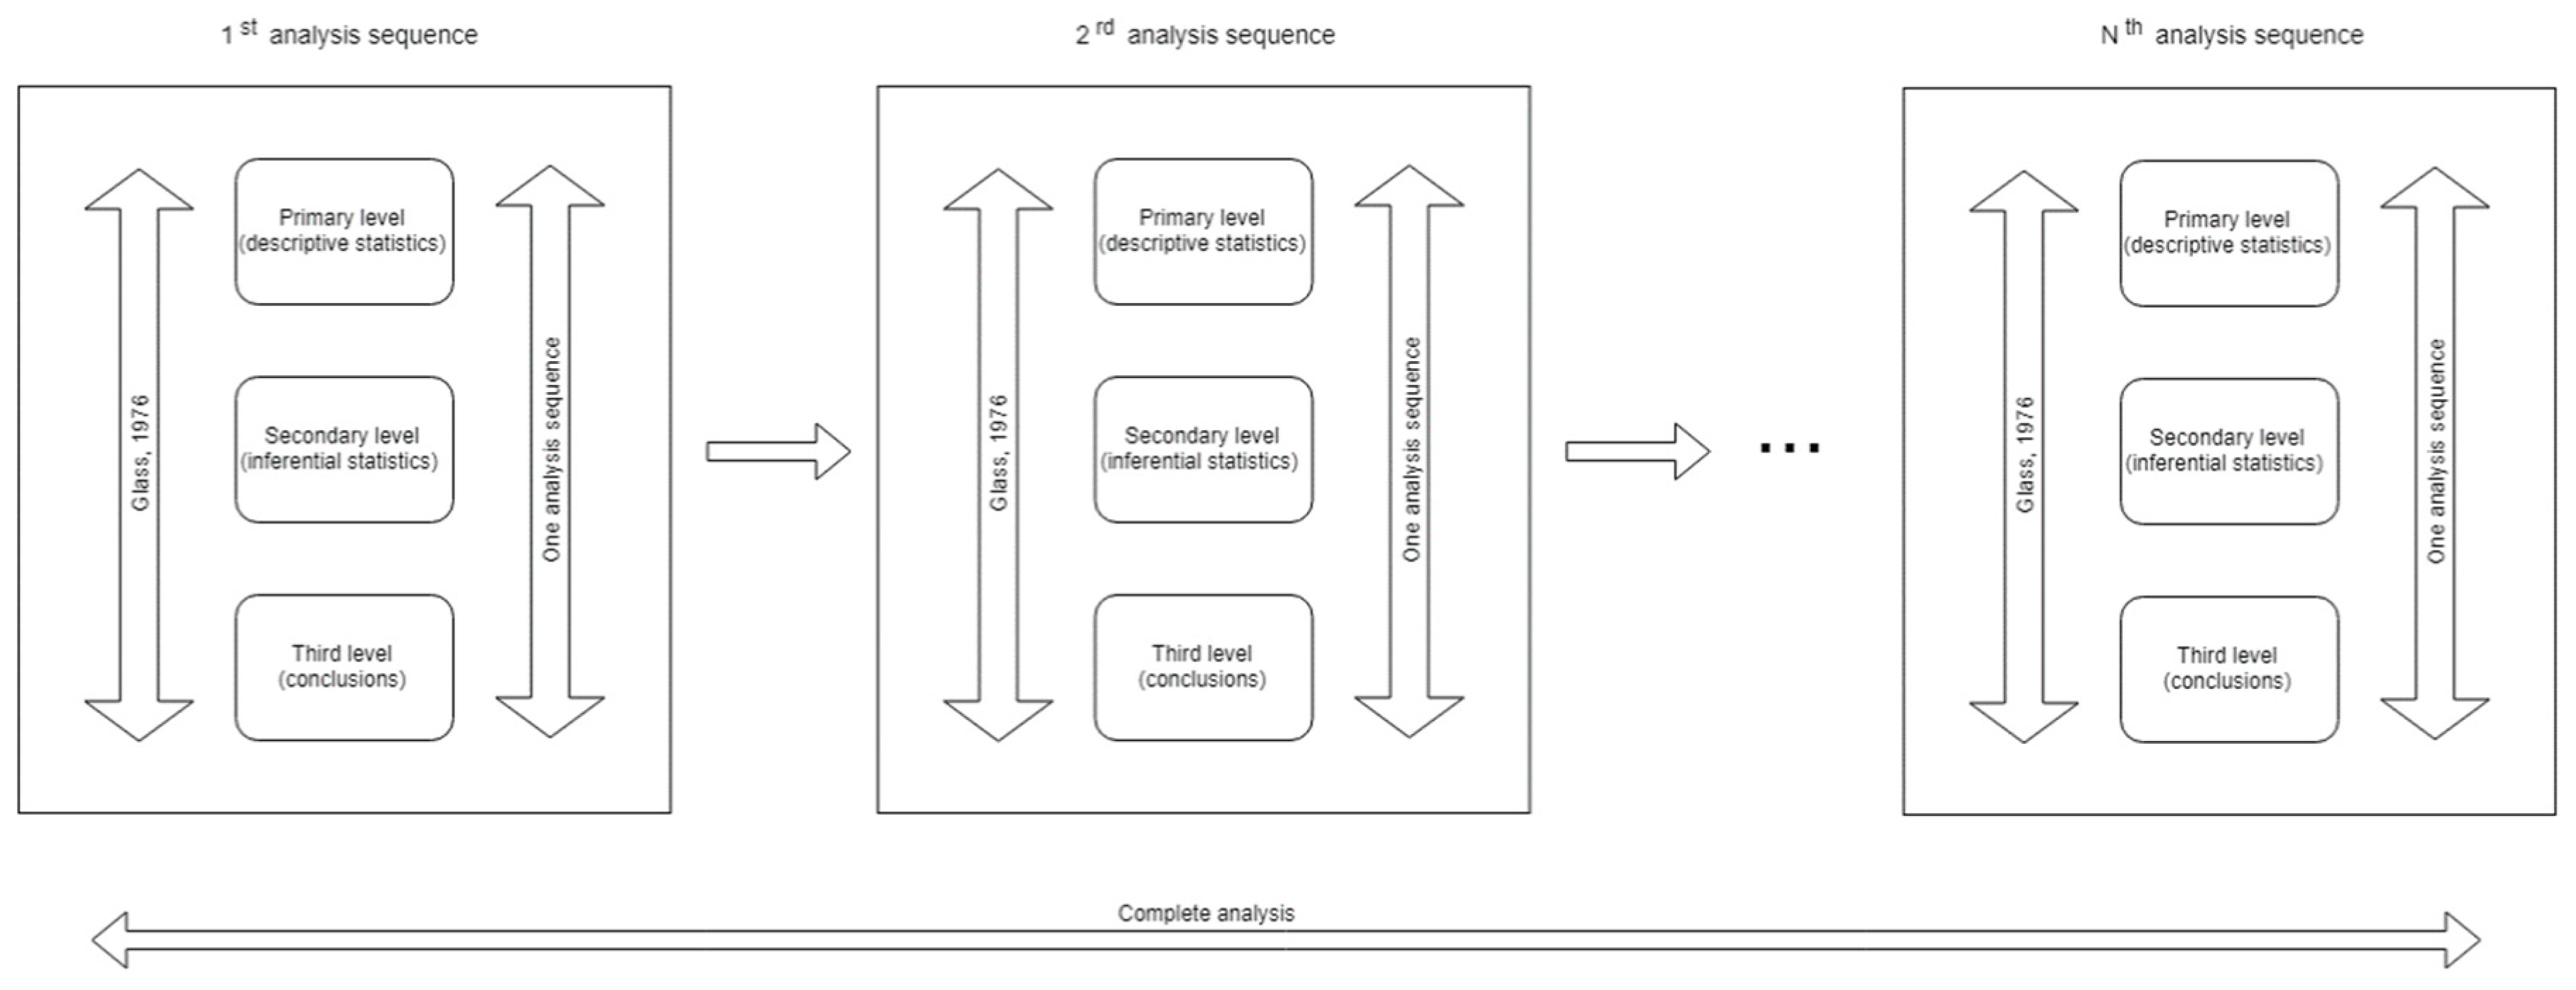
We also think that to do a good meta study oftentimes it is necessary to do several analysis sequences in a finite iterative process with the aim to allow a self-improvement analysis. We consider that we have a complete analysis if we have a finite coherently related analysis sequence.
In the primary level, referred to by Glass, statistical mechanisms should be used such as: hypothesis, inclusion/exclusion criteria, data collection, statistical analysis (meta-analysis), reports. The tonic accent of the analysis here should be based on what is known under the jargon as descriptive statistical techniques. At the secondary level of the systematic review, the mechanisms used must be hypothesis, inclusion/exclusion criteria, data collection (information retrieval and data extraction), statistical analysis (meta-analysis), reports. The tonic accent here is put in the use of tools that perform a quantitative analysis, following a set of procedures defined in the literature, that are beyond the traditional narrative review. These tools produce reports with, or that allow to produce, inferential statistical measures to be analyzed in the third level (Figure 3).
As was previously seen in the mechanisms described in the primary and secondary levels, there are references to the use of meta-analysis. These references should be seen as a result of the new organization of data which arrived from a previous analysis sequence and were produced by the third level of analysis (Figure 4).
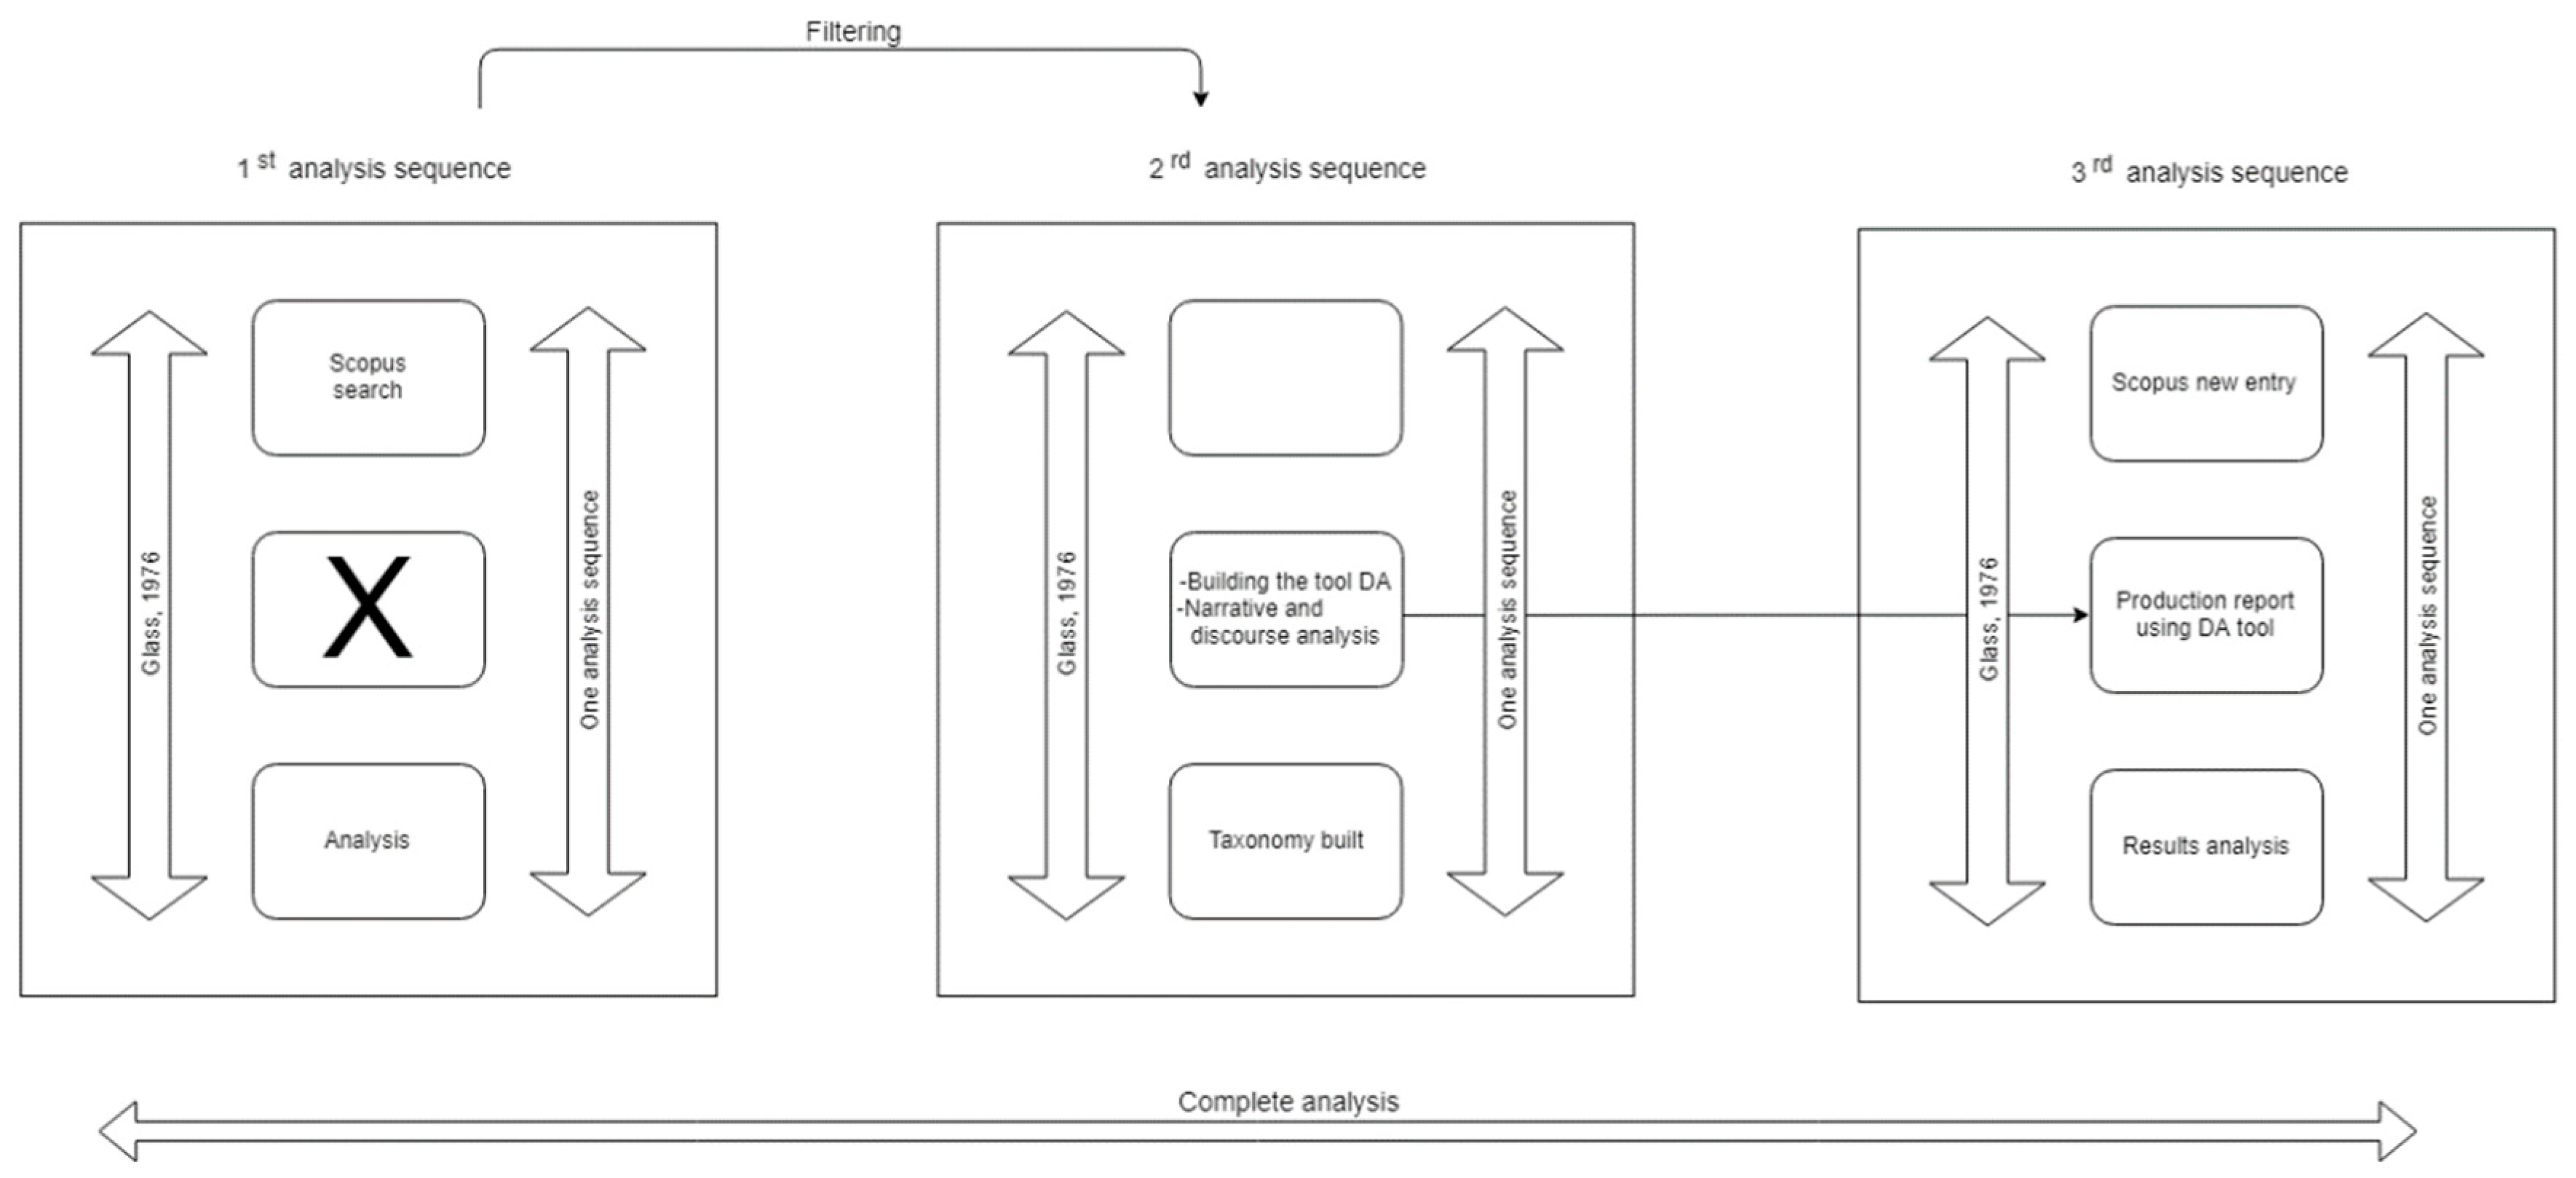
In the study reported in this paper, our complete analysis consists of three analysis sequences. The first analysis sequence is described in Section 3.2. In this analysis we get a historical perspective of the importance of TBL and the areas in relative percentage where the concept has been used in literature. These considerations arise from a selection of literature that is referred in the Scopus bibliographic database. In Scopus, we searched books, articles, etc., where the word “triple bottom line” is present at least in one of the following places: title, keywords, or abstract. In this analysis only the primary and the third level of Glass’s analysis intervened. The primary level of analysis of this analysis sequence resulted from the statistical measures reported from the embedded Scopus analysis tool. The third level arose from the obvious analysis made by us from the data that we had in hand.
For the second analysis sequence, we returned to Scopus to filter the previous search that we did. In this filtration we intended to retrieve literature related to the idea of TBL metrics within the aim of the studies. We searched journal articles from 2012 up to 2018. We considered that this relation can be caught strongly and naturally by the presence, in the title, keywords, or abstract, of the words “sustainability”, “metric*”, “measure*”, “method*”, “methodology*”, or “analys*”; where “*” is an operator used in the Scopus searches that represents a letter or a finite sequence of letters of the alphabet. After the source of the analysis was selected, we analyzed the abstracts for all the papers following a narrative and discursive analysis perspective [6].
Whenever possible, and for each one of the retrieved papers, we essayed if constructs arising from the title, keywords, and abstract enabled us to perceive the answer that it presented to each one of the questions that we defined in the introductory section. We then organized the answers, and the constructs elicited, in clusters. This process revealed to be very effective and led us to conceive of contextualized questions (CQ) to guide the further development of our approach:
- CQ1: To what extent do the applied techniques and methods translate to an accurate perception regarding the real sustainability levels in the analysis?
- CQ2: If the results can be indeed reliable, what typology of results may we expect to obtain and how can they be presented?
Thus, we identified the constructs that serve as possible answers to the guiding introductory for devising an approach to build a taxonomy for TBL metrics. In parallel to this, we developed a software tool to help us engage in a deeper analysis and for use in the third analysis sequence. The aim of the third sequence is to provide validation to the taxonomy approach created. To do this we built a software to help us in this task. This software is a set of analysis tools (DMAT, data meta-analysis tool), that can search for words, or sequences of words, previously chosen by the researcher within the retrieved articles and creates several kinds of reports.
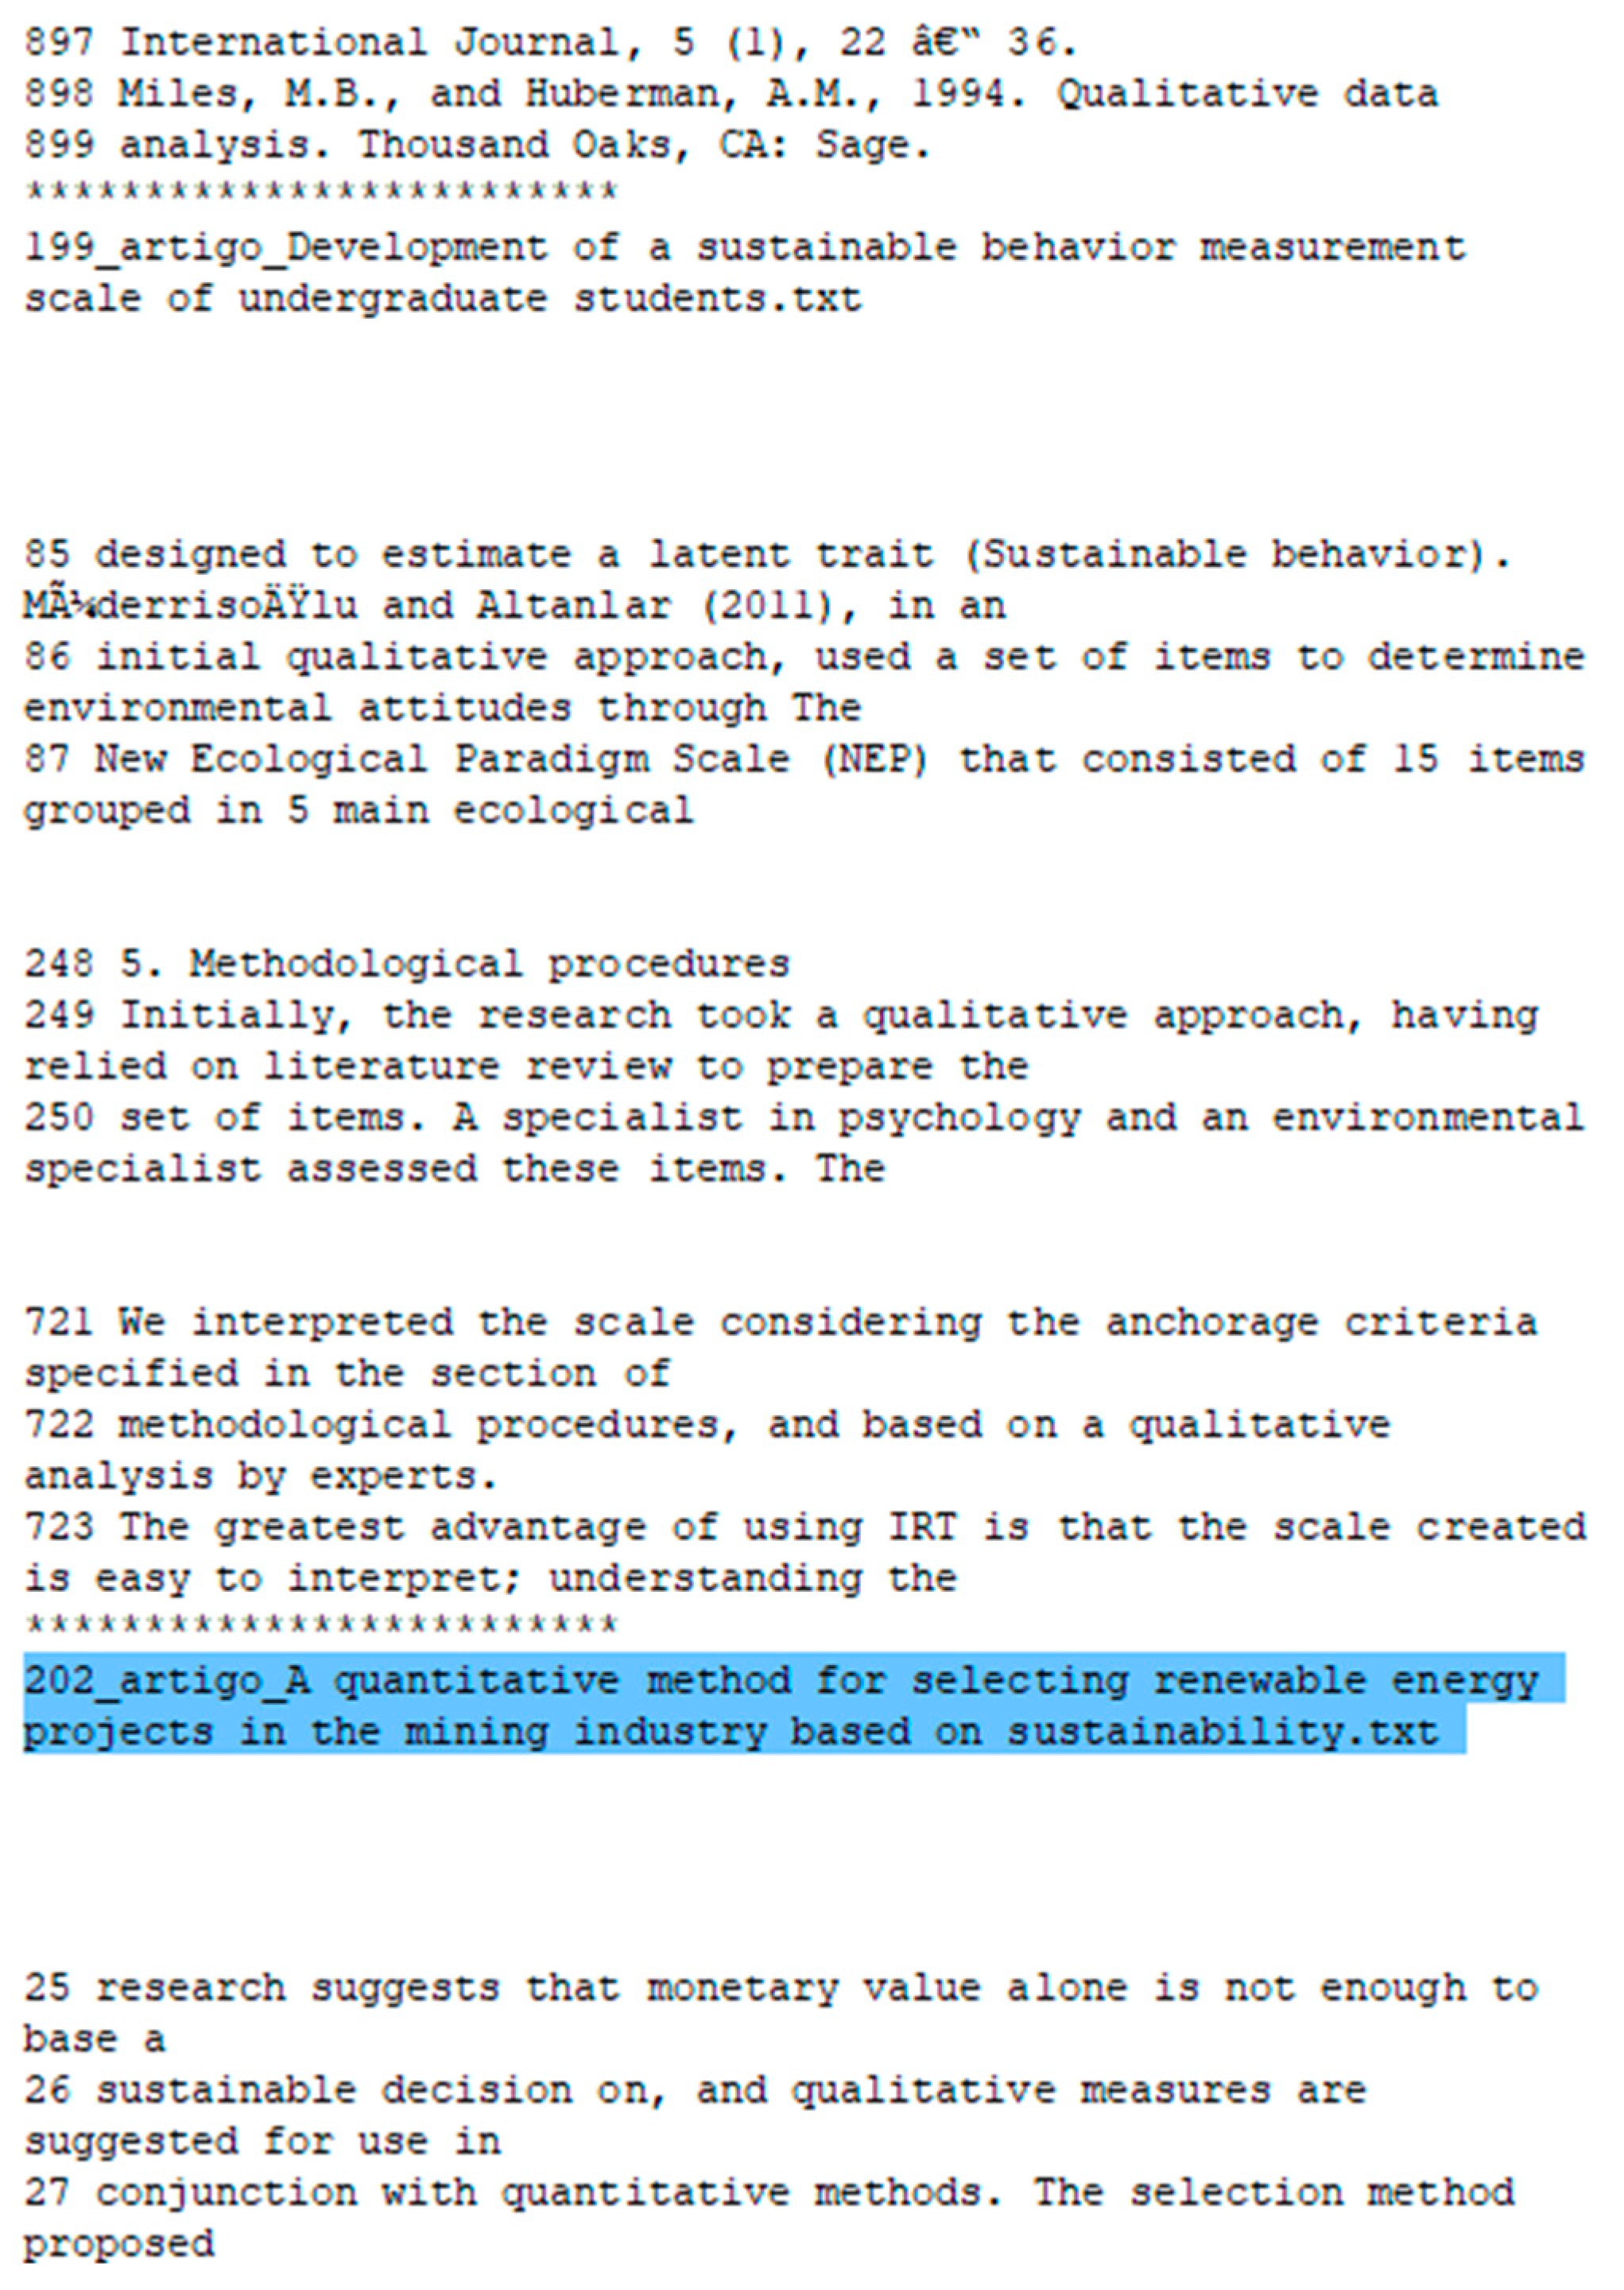
One of those types of reports contains information that is present in each one of the papers about one word or phrase (as a sequence of words) chosen by the researcher. The text of each one of these reports is organized by fragments of text relatives of each one of the articles. In each fragment there appears the name of the article and a sequence of three rows; each row starts with a number and this number is the article row numbered where it appears. The word or the phrase sequence searched appears in the second row. This allows us to analysis the context of appearance of each word or sequence of words, in analysis, for all articles.
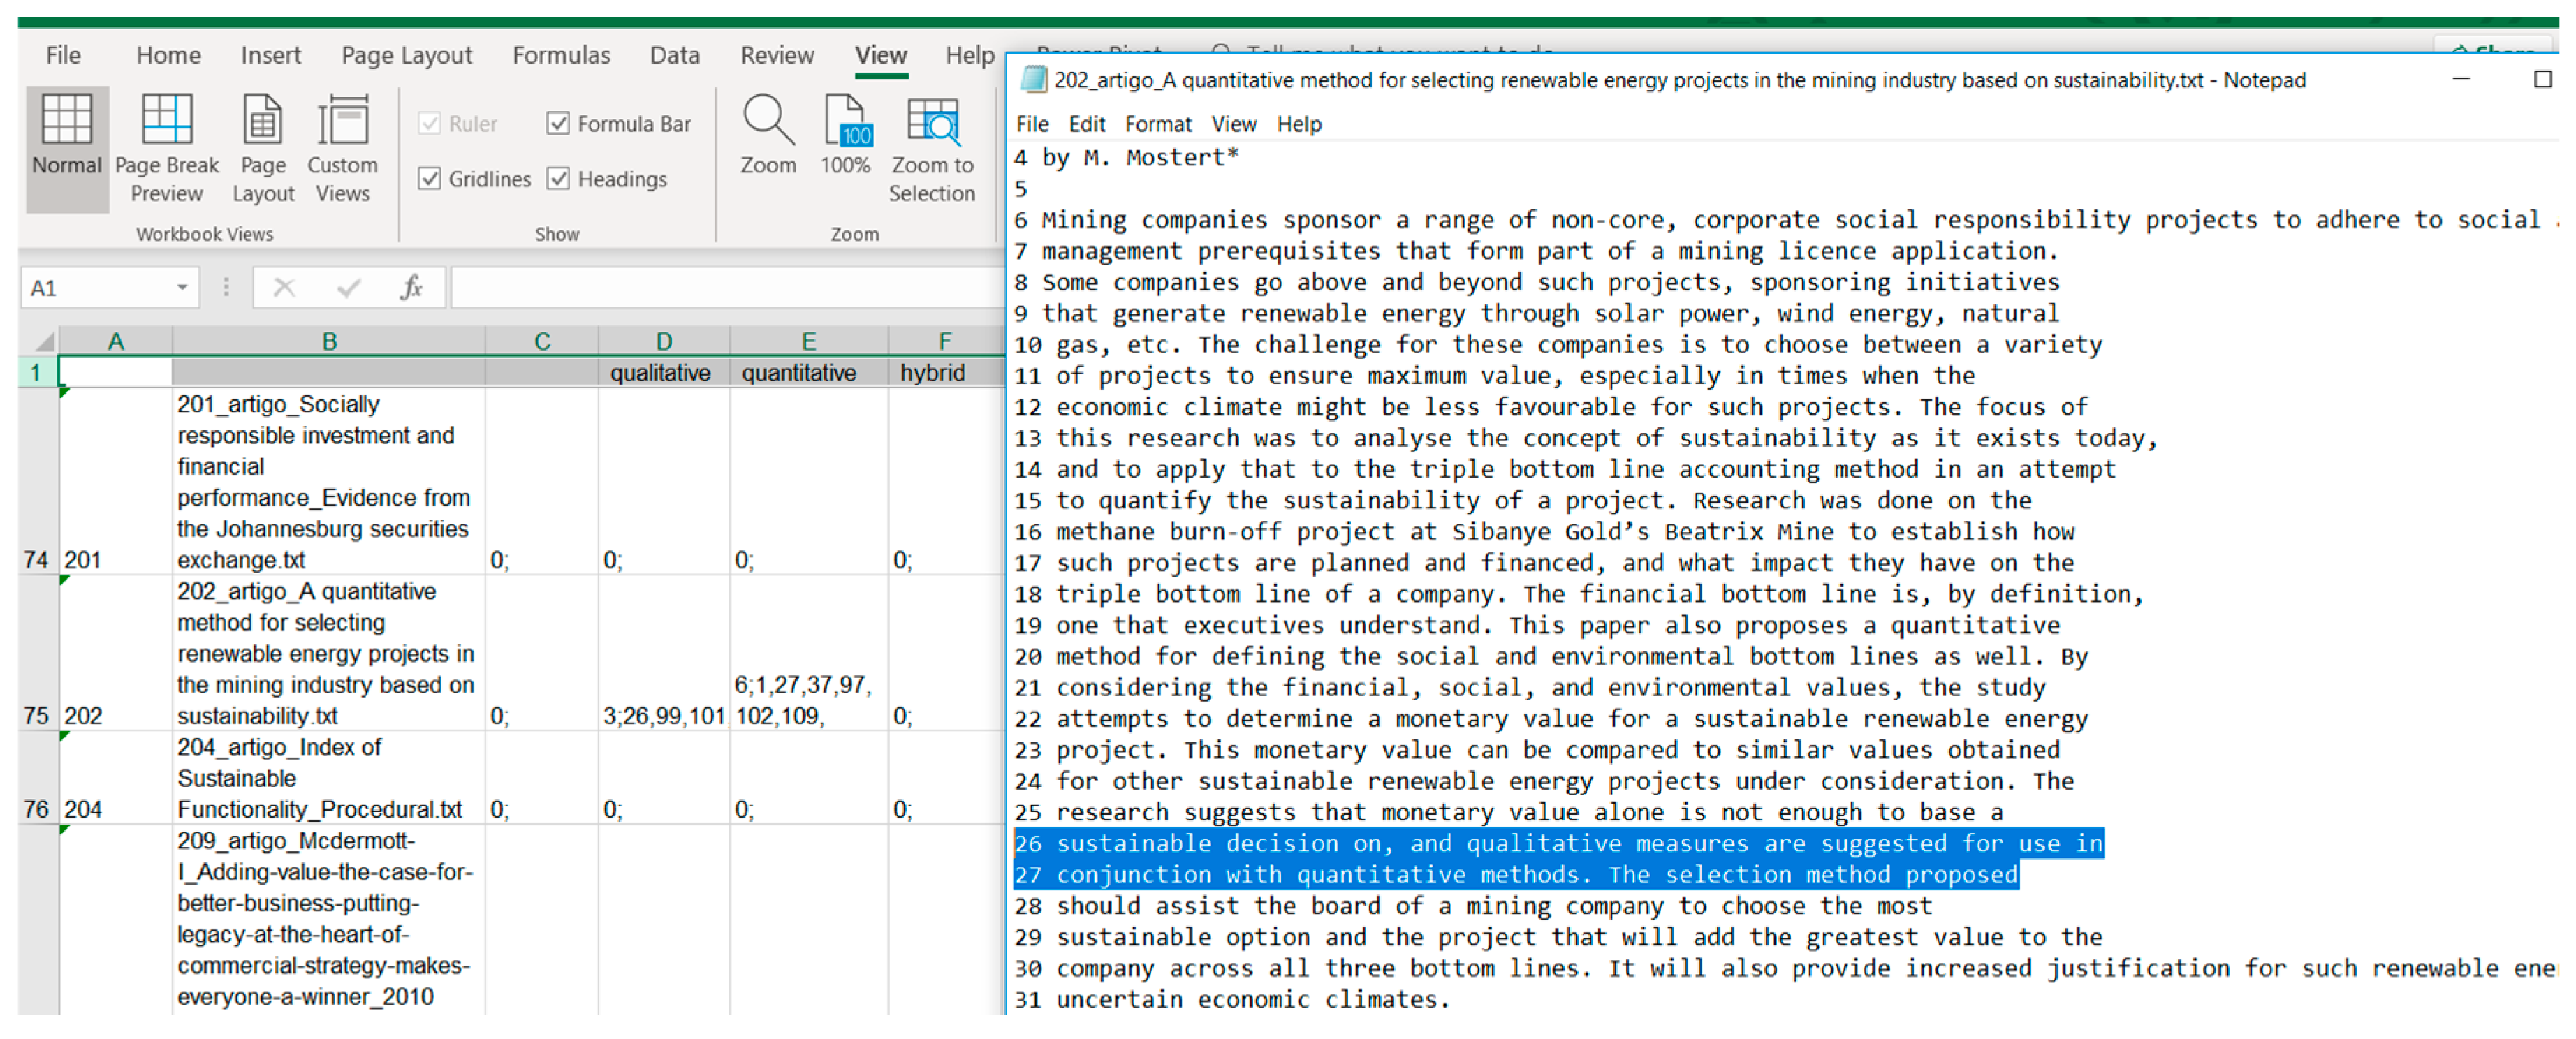
Beyond these reports, the software elaborates two more distinct types of reports corresponding to two distinct spreadsheet files. Both are spreadsheet files that contain a bidimensional table. The articles are displayed in rows and the words sought are displayed in columns. They only differ in the content of the cells. In each one of the cells, cell (row j, column i), for each report only appears the number of times that in the article in row j appears the word at the top of column i. The other report, in cell (row j, column i), shows how many times the word or sequence of words, written on the top of column i, appear in the respective article of row j, and the number of the rows in the article, where the word appears. Initially, before the analysis, the software replaces each one of the articles into a new txt version, where each one of the rows of the article appear numbered.
If you closely examine the picture in Figure 5 you can see that in row 75 of the spreadsheet report column A row numbered 202, corresponds to an analysis of the article labeled 202 [7]. This row to the column quantitative (respectively quantitative) appears with the numbers 3; 26, 99, 101, (respectively, 6; 1, 27, 37, 97, 102, 109). That means that the word quantitative (respectively qualitative) appears three times (respectively six times) and appears in the rows numbered 26, 99, and 101 (respectively 1, 27, 37, 97, 102, 109). This helps us to do a localized analysis, which is a localized reading that after being completed allows us to classify this paper as referred to metrics hybrids and put it as a possible case in the taxonomy.
Beyond the reports referred here and shown in Figure 5 and Figure 6, the DMAT software produced other reports.
The third analyzed sequence was regarded by us as a validation cycle to the taxonomy drawn. So, we go back to the Scopus and look for journal articles from 2012 that contained in the title, in the keywords, or in the abstract, the words “metric *” or “measure*”, and “triple bottom line” (primary level). The articles found were our source of validation. Afterwards we executed the tool of analysis that we developed. The software searched the constructs of the taxonomy created in the second analysis sequence and built the reports. After that, we analyzed the reports (second level). Finally, we discussed the results obtained and we validated the taxonomy structure built. This taxonomy structure must be seen as the kick-start for new literature reviews to the metrics of the TBL, which will be as dynamic and automatic as possible.
3.1. Scopus Search
In this subsection, we describe the search of the literature that we made in Scopus. We used the Scopus database and the mechanisms that this platform has to make a good search. Here we describe the search that was done in Scopus in several analysis sequences. Although we present a unitary description, relative to different description analysis sequences, the searches occurred at different moments of the time.
We began to search the literature that contained in the title, abstract, or keywords, the words “Triple”, “Bottom”, and/or “Line” and we encountered 11,768 documents. Then we filtered these documents through several steps as shown in Table 1.
The last filtrations were obtained from selecting papers with more than 12 citations among the papers searched in step 4. In following, in Arial font, we describe the wording used in the search made in step 4.
(title-abs-key (“Triple” and “Bottom” and “Line”)) and (“Triple Bottom Line”)and (sustainability or metric * or measure * or method * or methodology * or analys *)and (limit-to (pubyear, 2018) or limit-to (pubyear, 2017) or limit-to (pubyear, 2016) or limit-to (pubyear, 2015) or limit-to (pubyear, 2014) or limit-to (pubyear, 2013))and (limit-to (srctype, ”j”)).
After 5 searches, we studied and analyzed the abstracts, and read a set of selected papers. In consequence, we answered the research questions and we built a taxonomy structure to the metrics of the TBL. Disconnected from previous searches and to validate the taxonomy framework created in the second analysis sequence, we made one more search in Scopus using the words “metric *” or “measure *” and “triple bottom line”. Thus, to do this work we did two searches in Scopus and in the first search we had five filtrations.
3.2. First Analysis Sequence. History of the TBL
In this subsection, we describe the first analysis sequence that was done. In this sequence, we begin to make a search in Scopus (Table 1, row 1, 2). After that, we use the Scopus analysis tools to analyze the TBL concept in the historical perspective.
3.2.1. Primary Level
Stanisław Jerzy Lec (1909–1996) was one of the greatest Polish writers of the 20th century, he is known by his aphorisms and is considered one of the best aphorists of the 20th century. One of his aphorisms, “Is it progress if a cannibal is using knife and fork?”, inspired Elkington [8] in the choice of the title of one of his books, “Cannibals with Forks: The Triple Bottom Line of 21st Century Business”. This book is truly a milestone for sustainability.
“The ‘cannibals’ referred to are the business firms in our rapidly evolving capitalist economies, where it is the natural order of things for corporations to devour their competitors. The ‘fork’ that the cannibals can use to progress into a new stage of civilization is the concept of sustainable business, and that is what the book is all about. (…) Cannibals with Forks sets out to enlarge the concept, thus presenting a broad picture of what a social responsibility agenda for business should entail. Business is sustainable when it lives up to the “triple bottom line” of economic prosperity, environmental quality and social justice. The three bottom lines are interrelated, interdependent, and partly in conflict. Delivering against the triple bottom line requires of business a revolution of thinking and acting in no less than seven dimensions (‘thinking in 7D’): markets, values, transparency, life-cycle technology, partnerships, time-perspective and corporate governance” [9].
Despite the term, triple bottom line being coined by Elkington in 1994 [10], sustainability. The TBL concept has since become a generalized mainstream concept pervading and fostering many recent and ongoing discussions centered around sustainability, e.g., [11]. In 1998 Elkington published a milestone book, and from it two milestones papers [8,12]. The book “Cannibals with Forks: The Triple Bottom Line of 21st Century Business” is divided into four parts: sustaining capitalism, seven revolutions, transitions, and toolbox.
Part I “reviews progress to date in the ‘greening’ of capitalism and explores some of the implications of the triple bottom for business. A question asked in this part is whether capitalism it itself sustainable. (…) Elkington sees no ready alternative for capitalism. A sustainability agenda for the world economy in the next century will, realistically, have to be an agenda for a free market economy.” Elkington “… is not pessimistic about capitalism’s potential for sustainability: ‘Companies able to engage their stakeholders with a clear vision of their shared future and, in the process, to outperform their competitors against the triple bottom line will be much better placed to win people’s hearts and minds–along with their money’”.Part II concerns how to think in the seven dimensions referred to in the book. This part gives answers talking about making seven revolutions. The first revolution focuses on the use of market mechanisms, rather than traditional command-and-control measures, to deliver improved performance against sustainability targets. Elkington depicts the sustainability challenge as an unprecedented source of commercial opportunity for competitive companies, through technological innovation and improved eco-efficiency. Those who grab the chance will thrive on the coming wave of sustainability; those who don’t will lose. The second revolution involves values. The worst blind-spot business leaders suffer from is that the business of business is about the creation of economic value, and not about social or ethical values. Societies evolve in the direction of “softer” triple bottom line values; companies misreading this direction of flow risk running aground. Third comes the transparency revolution in our hyper-communicative societies. Companies sustainability performance will increasingly be benchmarked and ranked by external watchers. Companies will face growing pressure for right-to-know legislation and new corporate governance rules. Some companies will respond by using communicative “stealth” technologies, designed to let them slip under society’s “radar”. Others will see the need to integrate triple bottom considerations into their strategies. Life-cycle technology, the fourth revolution, involves a shift from companies focusing on the acceptability of their products at the point of sale to their performance from cradle to grave. Partnerships between business and activist groups are the fifth revolution. To deal with the longer-term problems of sustainability, revolution number six involves time: business’ time perspective will have to evolve from short-term to long-term. Sustainable business requires new definitions of ownership rights in company assets, and in the balance between shareholders and stakeholders. The seventh revolution, therefore, is about corporate governance.Part III pictures the contours of the sustainable corporation and some of the market changes needed to make it a reality. A practical guide to building a sustainable corporation is presented in the form of “thirty-nine steps to sustainability”, specifying each of the seven revolutions in several points.The greatest merit of this book lies in the complexity of the problem constellation addressed, and the way in which the author presents problems, analyzes them, and points to directions where solutions might be found—three revolutions, seven dimensions, thirty-nine steps.The fourth part brings the practical approach of the book another step forward by presenting a “sustainability audit”, although the word “audit” is overpromising. Elkington does not present a set of measuring instruments, built on what already exists in the field of environmental auditing and what is being developed in the field of social and ethical accounting, auditing, and reporting. Brief mention is made to impact assessment and life-cycle assessment methods. The “audit” in this book is in fact a helpful checklist, that summarizes the author’s main points regarding the “seven revolutions” to sustainability, but it adds no information as to what has been said before [9].
3.2.2. Third Level
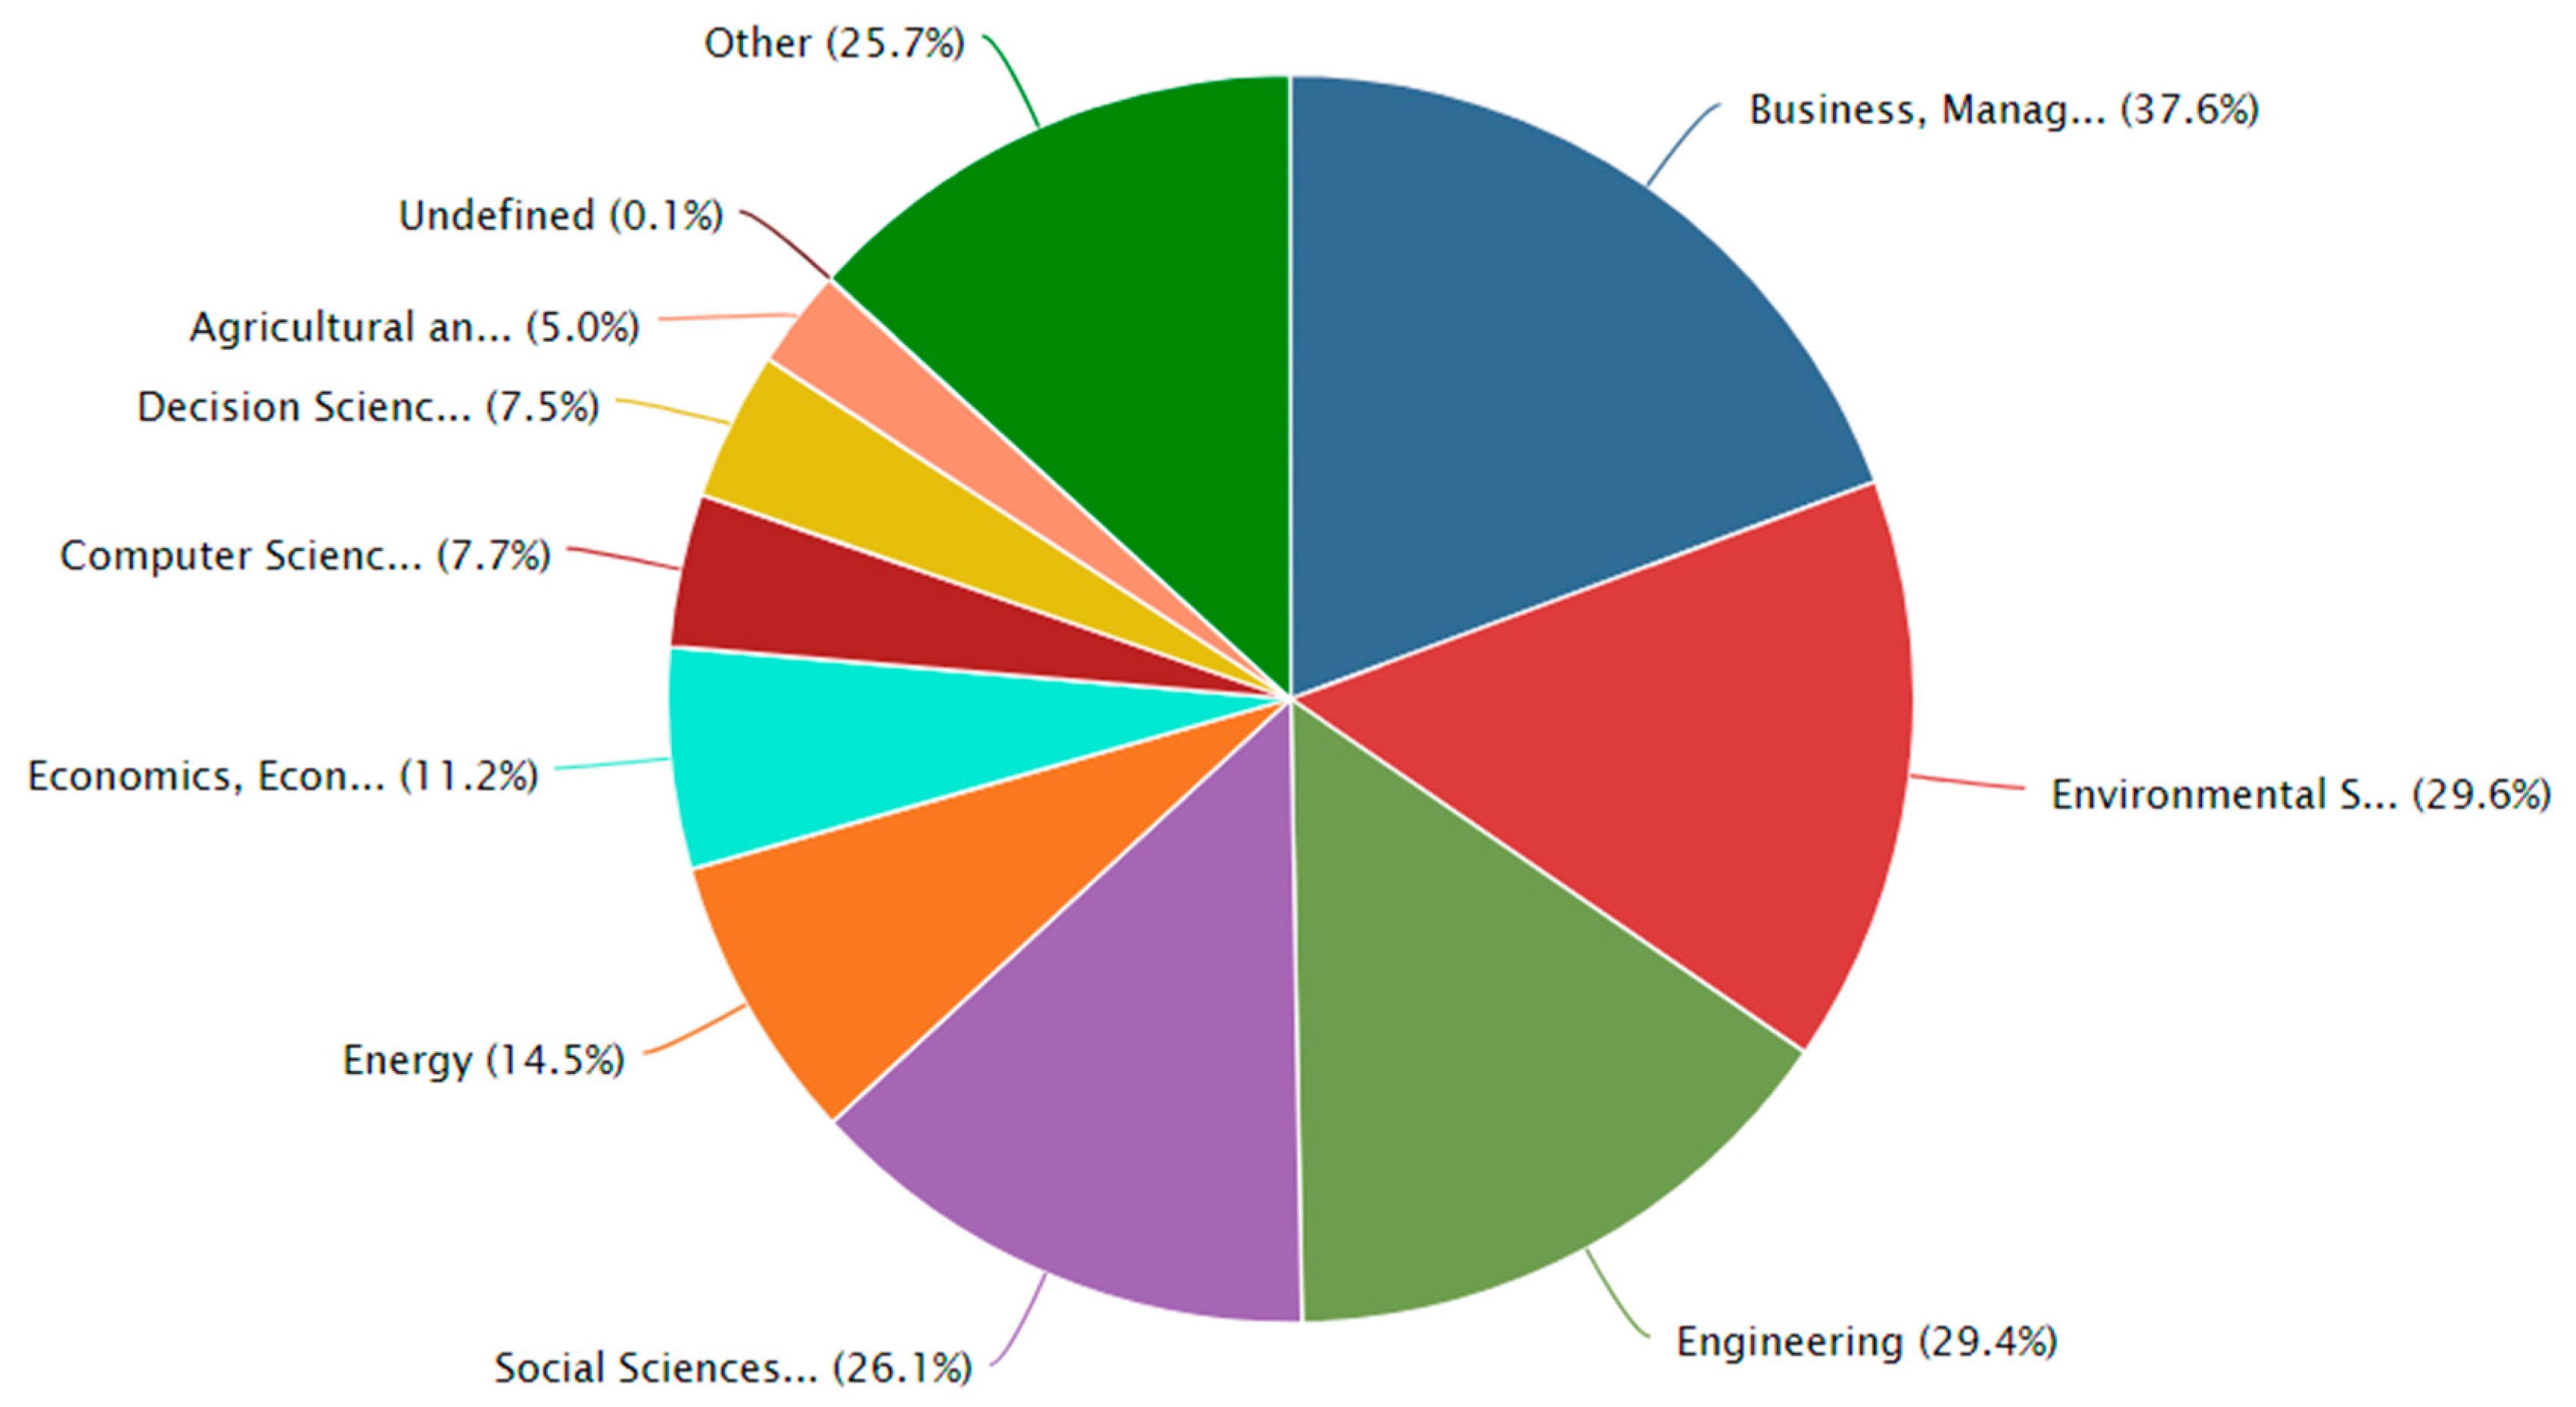
We highlighted four areas that contained more than 25% of the literature: business management and accounting (37.6%), environmental science (29.6%), engineering (29.4%), social science (26.1%). Beyond these areas appear the areas of energy (14.5%), economics, econometrics, and finance (11.6%), computer science (7.7%), decision science (7.5%), and agriculture and biological science (5%).
3.3. Second Analysis Sequence. A Taxonomy Framework to the Metrics of the TBL
3.3.1. Primary Level
In the second analysis sequence we returned to Scopus and we did filtrations (Table 1, row 3, 4, 5) on the results that we got from our first search (Table 1, row 2 and 3). We did three filtrations to the first search. The first filtration was done to get only results between 2013 to 2018, after that we did a new filtration to get only documents that had explicit references to certain words (or their terminations) such as sustainability, metric, measure, method or methodology or analysis. At last, we filtered the documents that had at least 13 citations (Supplementary Materials). The choice for 13 citations as a selector resulted from the analysis between the quantity of documents that we got and the number of citations of each one. We could verify the low percentage of elements with less than 13 citations and thus we considered those documents without relevance.
3.3.2. Secondary and Third Level
In this section, we present the second and the third cycle of analysis that are part of the Glass meta-analysis, relative to the second sequence analysis of our methodology, that we are using to analyze the metrics of the TBL. After we did the filtrations of the comments and got only the documents with at least 13 citations (first level of Glass’s methodology) we read the documents and did a deep analysis of these documents (second level of Glass’s methodology).
The analysis of all the literature selected led us to answer the research questions. These questions and the respective answers drive us in the elaboration of a taxonomy structure to the TBL metrics (Table 3) (third level of Glass’s methodology). The taxonomy framework built is represented in a bidimensional table. The first row is entitled a stack of the TBL and it consists of the research questions. In the columns are the answers to the research questions. Each answer given in a column corresponds to the research question presented at the top of the column.
In the following we give an explanation about the taxonomy framework. The taxonomy structure must be read in the following way. As an example, we give the answer to two questions, Q1 and Q2.
- Q1-What Kind of Metrics Are We Talking about?
- We found three kinds of metrics: qualitative, quantitative, and hybrid.
- Q2-What is the complexity of the problems?
The classification made is a classification of computational complexity. We are aware that this classification is insufficient because we may be faced with types of complexities that are not expressed computationally. This is an issue that we will have to consider in the future. For now, as the first work of this kind, we simplify the approach by restricting it to a computational approach. We are faced with problems of three kinds, P complexity, NP complexity, and we encountered a lot of measures that although they are classifiable computationally its classification is unknown. We consider as unknown complexity all the problems that are not recognized in literature as NP, and that in a simple reading we cannot clearly consider it is a P problem [13].
In the following section we present the third sequence of the analysis sequence. This analysis serves to present a validation of our taxonomy structure.
3.4. Third Analysis Sequence. Validation of the Taxonomy Structure
As a rule, we present this analysis sequence in the context of Glass’s methodology in its three levels of analysis.
3.4.1. Primary Level
In the first level, we returned to Scopus and did a new search. We looked for journal articles from 2012 that contained in the title, keywords or abstract, the words “metric*” or “measure *” and “triple bottom line”. We got a lot of abstracts. We read them, and noticed, that although they contained the words metric and measure, not all the abstracts referred to articles containing descriptions of metrics and measurements. Thus, firstly from this source we got all the possible papers and analyzed them. We selected those that described metrics and measures (Supplementary Materials). Thus, we built a new source to analyze and study that we used as a form of validation for the taxonomy framework. This source is set up of papers and abstracts, that in fact contain descriptions of metrics and measurements. After that we passed to the second level of Glass’s methodology, where we did the data analysis and used the data tool that we developed to help us (DMAT).
3.4.2. Secondary and Third Level
The tool that we built helped us to classify the papers and abstracts, and through this tool it is possible to spread them in the built taxonomy. The tool generated several tables like the table below (Table 4). It indicates whether or not the article contains references to the items that are in the taxonomy structure. To our validation of the taxonomy framework grid built, we completed the information given by the tool with an effective read of the article indicated (Supplementary Materials) and, in addition, we read one or another not indicated by the tool, but on that on our reading of its abstract seemed relevant to the research question in analysis. As an exemplification of the work gotten from the DMAT, we present Table 4 below. In addition, the analysis was completed through reading of the articles and a new table was built (Table 5).
Following we did a short and general reference of the articles presented in Table 4 and also used in Table 5. Each one of them put the accent of their measurement in some particularity. In the opinion of El Akremi et al. [14], despite the growing importance of corporate social responsibility (CSR), current micro-level CSR theory remains under-developed due to a lack of measure of employees’ perceptions of CSR. Thus, they developed and validated a measure and metric that takes this into consideration. Kamenopoulos et al. [15] already have worked on a metric related to the area of decision-making. The metric consists of ponderations that allow a multi-criteria decision analysis (MCDA) combined with the multi-attribute utility theory (MAUT). This mixed was classified by us as a metric that consists of a multi-criteria decision method (MCDM). Lucato et al. [16] presented a way of measuring the sustainability of a manufacturing process and Stoddard et al. [17] were concerned with the definition of sustainability metrics for tourism. Lastly, Tsaur et al. [18] developed a hybrid measurement indicator (quantitative and qualitative) for mega-event legacies based on the triple bottom line principle. They did this to empirically assess the legacy of the 2010 Taipei International Flora Exposition based on the perceptions of Taipei city residents.
For the same articles, we approached the reasons why we presented their classification in the taxonomy, as observed in Table 4. The classifications presented in Table 4 are essentially taken from the DMAT. Article 101 [14] and article 110 [18] appear as quantitative and qualitative metrics. Both present explicit references to quantitative and qualitative words. Among many others, article 101 refers to “… we retained 34 items from the quantitative pilot study to measure five dimensions of CSR construct” and that “… we developed initial content specifications based on (1) a comprehensive review of literature on CSR and stakeholder theory, (2) existing measures of CSR perceptions (…), and (…) qualitative focus groups, from which we gained insights into how employees view the concept of CSR and generated items about their perceptions”. Among many others, article 110 refers to “This study employed both qualitative and quantitative methods” and that “we designed a 36-item event legacy scale, comprising 10 factors of mega-event legacies (…) this 36-item scale represented an exploratory attempt in event legacy measurement” and continue saying that “(…) This research contributes to identifying the measurement indicators for mega-events and measuring the legacy aspect of mega-events from the perceptions of host-city residents (…)”. For all of this we classified them also as a hybrid metric.
Article 101 [14], article 104 [15], and article 10 [17] appear associated with the standard environment management accounting (EMA). This occurs because the terms environment and management appear in contexts that identify the use of the measures given in each one of the articles with collection, analysis, and their use for internal decision making. We identified the referred contextualization on expressions as: in article 101 [14] an “item from the natural environment–oriented CSR dimension loaded relatively highly on the supplier-oriented CSR dimension (0.47), but this result likely reflects our use of Promax rotation”; in article 104 [15], the “integration of sustainable development challenges and opportunities into the decision-making process during the design and/or implementation of multi-disciplinary mining projects is generally not supported by decision support systems (DSS). A new hybrid decision support tool, which features an integrated assessment of sustainable development issues as they apply to mining projects, is hereby proposed”; and in article 10 [17] the “triple bottom line (TBL) is a (…) orientation whereby organizations develop and implement not just a traditional economically sustainable strategy, but also explicitly include environmental and social sustainability strategies”.
Article 110 [18] appears associated in a normal way to the standard city sustainability index (CSI). This association is presented in several parts of the text, for example: “This research contributes by identifying the measurement indicators for mega-events and measuring the legacy aspect of mega-events from the perceptions of host-city residents.”
Lastly, articles 104 [15] and 108 [16] appear associated with the standard environment sustainability index (ESI). This is a consequence of following references, as an example, article 104 [15] “(…) discusses different DSSs that have been proposed in a sustainable development context as applied to the energy sector, the extractive industries and some industrial systems that have an environmental component (…)” and in article 108 [16] “This work proposes a conceptual evaluation of the sustainability of a manufacturing process. A part of the suggested framework is regarded as an index that allows the integration of the three pillars of sustainability into a single measure.”
For each one of the expressions that we left here we can encounter others in each one of these particular articles. This reinforces the belief in our classification and in our taxonomy.
In Table 5 we take the previous classification, essentially automatic classification, that was done in Table 4 and we give them a helping hand. From reading the articles we decided that we should maintain the affirmative automatic classification (the items classify with the number “1”) and that we should extend the affirmative classification to other taxonomy blocks. After reading the articles we consider this extension as only relevant to articles 104 [15] and 108 [16]. These articles must be classified as quantitative metrics because they presented mathematical aggregated formulas as their measures or metrics to the sustainability. Article 10 [17] without mathematical formulation is classified as a qualitative metric. The article does not present a mathematical formulation but presents several indicators of a measure of sustainability. In its words “The paper concludes by presenting the benefits that can accrue to a sustainable tourism development organization through the adoption of a TBL philosophy and the use of a reliable instrument to measure TBL performance.”
After the presentation of Table 4 and Table 5 that allow us to have an idea of the type of help that we received from the tool, we show through an example, how the analysis process continues. The analysis process was continued by answering the contextualized questions. We focus here in answering question CQ3. This process is to be done for each one of the questions in the future.
In the answer to question 3, Q3, we can see for example environmental sustainability index (ESI) (Kumar, 2016, 14). (Kumar, 2016, 14) means Kumar et al. [19] is the author, 2016 is the year the paper was published, and 14 is the row number in the paper where the reference of ESI appears or is a phrase with content that enabled us to classify the paper in the ESI category. In Kumar et al. [19] the phrase referred was “The study followed the concept of the triple bottom line approach for assessing the progress of the case firm on sustainability scale.” (in the abstract, Kumar, 2016, row 14). One of the things that DMAT does is to convert the pdf files in txt files and number all the lines of the paper.
- Q3-What are the standards that they follow?
From our study about the metrics of the TBL we identify explicitly the use of five standards: global reporting initiative (GRI), environment management accounting (EMA) [14,15,17], city sustainability index (CSI), environmental sustainability index (ESI) [15,16,18,19,20] (p. 863)—“The ecological footprint indicators are also considered as a part of the environmental dimension, which have already been used as a measure of environmental sustainability in previous input–output studies …”), financial reporting quality (FRQ) [21]. In our taxonomy framework grid, besides these, we put two more items which we call other and none. Thinking in the use of standards we identified a metric as other when the metric follows at least a procedure that is possible to classify in some way as standardized, but is not one of the five referred to earlier, and none by the exclusion of parts.
4. Discussion and Future Work
Having answered our guiding questions, we built with computational tools a taxonomy framework grid for the TBL metrics. It can be used in the future to classify TBL metrics within this taxonomy structure matrix. To do this work we developed a tool to support our approach to meta-analysis. This is the first version of the taxonomy framework grid. In the future, we intend to do updates to the taxonomy structure matrix.
Manual verification is of great use in the process of meta-analysis. For us it is essential to reduce this through the enrichment of new functionalities to our data analysis tools. We are designing algorithms to implement narrative and discourse analysis [22,23] and simultaneously are preparing our software to perform a deeper analysis. For a deeper analysis to be enabled we are working on the implementation of several known statistical inference algorithms: confidence intervals and hypothesis tests, both parametric and nonparametric. We are also working on the implementation of unsupervised artificial intelligence algorithms, like Self Organized Maps (SOM) and k-nearest, that allow us to discover clusters in data. We want to go forward toward automation of the whole process.
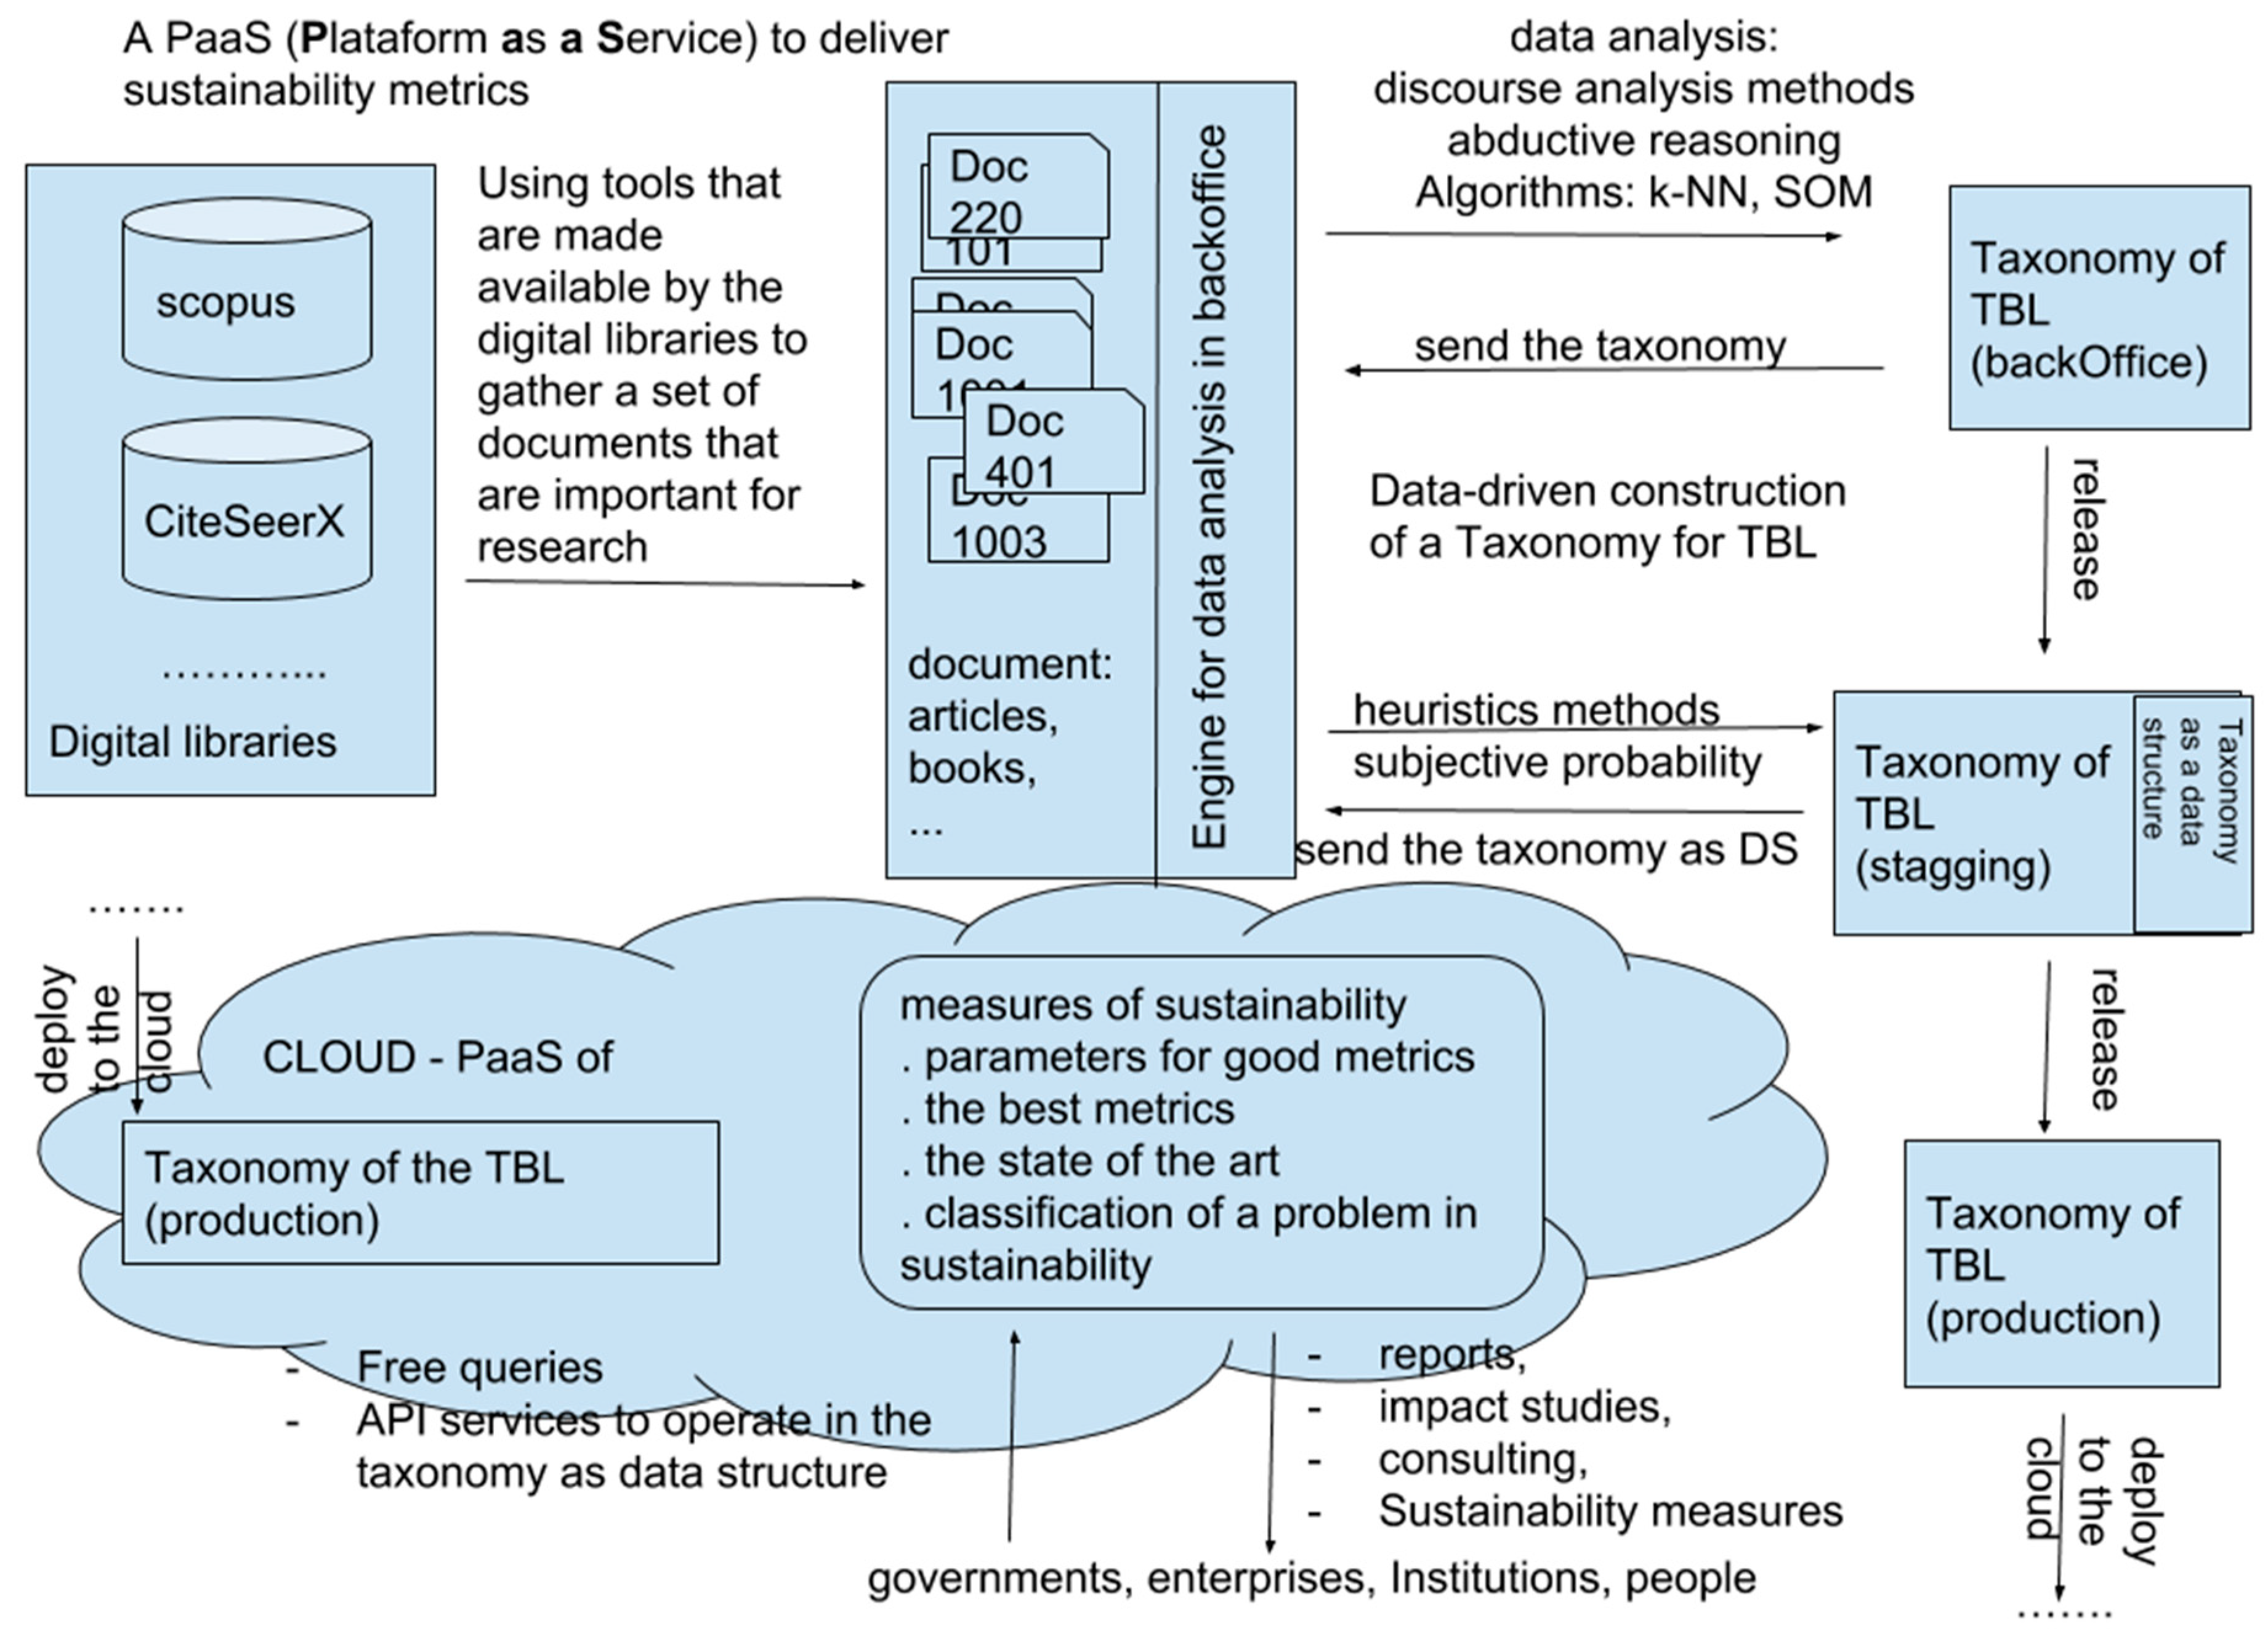
It is our intention that our software works downstream to databases like Scopus to produce automatic updates of the taxonomy framework grid through automatic reviews of the literature of the TBL metrics. Figure 9 is a snapshot of what our future perspective is on this initial work. Our tool is transforming on a back-office engine to automatically generate taxonomies of the TBL to be used as a PaaS in a cloud ecosystem. A data-driven system designed as a service, as exemplified, may become very important to decision-making.
Supplementary Materials
The following are available online at https://www.mdpi.com/2071-1050/11/9/2717/s1, Table S1: Appendix A—List of article search results, Table S2: Appendix B—Bibliographical details for the list in Appendix A.
Author Contributions
Conceptualization, D.A.C.; Data curation, P.A.V.; Funding acquisition, D.A.C.; Methodology, P.A.V., F.L.V. and D.A.C.; Resources, F.L.V.; Software, P.A.V.; Supervision, D.A.C.; Writing—original draft, F.L.V. and P.A.V.; Writing—review & editing, D.A.C.
Funding
The work reported in this paper has been supported in part by project Centro-01-0145-FEDER-000017—EMaDeS—Energy, Materials and Sustainable Development, as well as project Centro-01-0145-FEDER-000019—C4—Cloud Computing Competence Centre, both projects were co-financed by the Portugal 2020 Program (PT 2020), within the Center Regional Operational Program (CENTRO 2020) and the European Union through the European Regional Development Fund (ERDF). The authors extend their acknowledgement to the support for this research achieved through partial funding from Fundação para a Ciência e a Tecnologia through project UID/EMS/00151/2013 C-MAST.
Conflicts of Interest
The authors declare no conflict of interest.
References
- Gurevitch, J.; Koricheva, J.; Nakagawa, S.; Stewart, G. Meta-analysis and the science of research synthesis. Nature 2018, 555, 175. [Google Scholar] [CrossRef] [PubMed]
- Çoğaltay, N.; Karadağ, E. Introduction to meta-analysis. In Leadership and Organizational Outcomes; John Wiley and Sons Ltd.: Hoboken, NJ, USA, 2009; pp. 19–28. [Google Scholar]
- Sullivan, G.M.; Feinn, R. Using effect size—Or why the P value is not enough. J. Grad. Med. Educ. 2012, 4, 279–282. [Google Scholar] [CrossRef] [PubMed]
- Borenstein, M.; Hedges, L.V.; Higgins, J.P.; Rothstein, H.R. Introduction to Meta-Analysis; John Wiley & Sons: Hoboken, NJ, USA, 2009. [Google Scholar]
- Glass, G.V. Primary, secondary, and meta-analysis of research. Educ. Res. 1976, 5, 3–8. [Google Scholar] [CrossRef]
- Riessman, C.K. Narrative Methods for the Human Sciences; Sage: Newcastle upon Tyne, UK, 2008. [Google Scholar]
- Mostert, M. A quantitative method for selecting renewable energy projects in the mining industry based on sustainability. J. South. Afr. Inst. Min. Metall. 2014, 114, 887–898. [Google Scholar]
- Elkington, J. Partnerships from cannibals with forks: The triple bottom line of 21st-century business. Environ. Qual. Manag. 1998, 8, 37–51. [Google Scholar] [CrossRef]
- Jeurissen, R.; Elkington, J. Cannibals with forks: The triple bottom line of 21st century business. J. Bus. Ethics 2000, 23, 229–231. [Google Scholar] [CrossRef]
- Elkington, J. Enter the Triple Bottom Line. In The Triple Bottom Line; Routledge: Abingdon-on-Thames, UK, 2013; pp. 23–38.10k. [Google Scholar]
- Coelho, D.A.; Carrola, T.E.P.; Couvinhas, A.F. Improvement of Certified Artisan Cheese Production through Systemic Analysis—Serra da Estrela PDO. Sustainability 2017, 9, 468. [Google Scholar] [CrossRef]
- Elkington, J. Accounting for the triple bottom line. Meas. Bus. Excel. 1998, 2, 18–22. [Google Scholar] [CrossRef]
- Bovet, D.P.; Crescenzi, P.; Bovet, D. Introduction to the Theory of Complexity; Prentice Hall: London, UK, 1994; p. 69. [Google Scholar]
- El Akremi, A.; Gond, J.P.; Swaen, V.; De Roeck, K.; Igalens, J. How do employees perceive corporate responsibility? Development and validation of a multidimensional corporate stakeholder responsibility scale. J. Manag. 2018, 44, 619–657. [Google Scholar] [CrossRef]
- Kamenopoulos, S.; Agioutantis, Z.; Komnitsas, K. A new hybrid decision support tool for evaluating the sustainability of mining projects. Int. J. Min. Sci. Technol. 2018, 28, 259–265. [Google Scholar] [CrossRef]
- Lucato, W.; Santos, J.; Pacchini, A. Measuring the sustainability of a manufacturing process: A conceptual framework. Sustainability 2017, 10, 81. [Google Scholar] [CrossRef]
- Stoddard, J.E.; Pollard, C.E.; Evans, M.R. The triple bottom line: A framework for sustainable tourism development. Int. J. Hosp. Tour. Adm. 2012, 13, 233–258. [Google Scholar] [CrossRef]
- Tsaur, S.H.; Yen, C.H.; Tu, J.H.; Wang, C.H.; Liang, Y.W. Evaluation of the 2010 Taipei International Flora Exposition from the perceptions of host-city residents: A new framework for mega-event legacies measurement. Leisure Stud. 2017, 36, 65–88. [Google Scholar] [CrossRef]
- Kumar, D.; Rahman, Z. Buyer supplier relationship and supply chain sustainability: Empirical study of indian automobile industry. J. Clean. Prod. 2016, 131, 836–848. [Google Scholar] [CrossRef]
- Onat, N.C.; Kucukvar, M.; Tatari, O. Integrating triple bottom line input-output analysis into life cycle sustainability assessment framework: The case for US buildings. Int. J. Life Cycle Assess. 2014, 19, 1488–1505. [Google Scholar] [CrossRef]
- Martínez-Ferrero, J.; Garcia-Sanchez, I.M.; Cuadrado-Ballesteros, B. Effect of financial reporting quality on sustainability information disclosure. Corp. Soc. Responsib. Environ. Manag. 2015, 22, 45–64. [Google Scholar] [CrossRef]
- Staab, S.; Studer, R. Handbook on Ontologies; Springer Science Business Media: Berlin, Germany, 2010. [Google Scholar]
- Gandomi, A.; Haider, M. Beyond the hype: Big data concepts, methods, and analytics. Int. J. Inf. Manag. 2015, 35, 137–144. [Google Scholar] [CrossRef]
Figure 1.
Glass’s methodology for meta-analysis.

Figure 2.
Glass’s methodology as an analysis sequence.

Figure 3.
Data-driven meta-analysis approach.

Figure 4.
The meta-analysis approach reported in this paper.

Figure 5.
(Left) A report produced by the data meta-analysis tool (DMAT) in the spreadsheet. (Right) The paper labeled 202 in txt with the rows numbered.
Figure 5.
(Left) A report produced by the data meta-analysis tool (DMAT) in the spreadsheet. (Right) The paper labeled 202 in txt with the rows numbered.

Figure 6.
Part of a DMAT report - all the papers where the word “qualitative” also appears.

Figure 7.
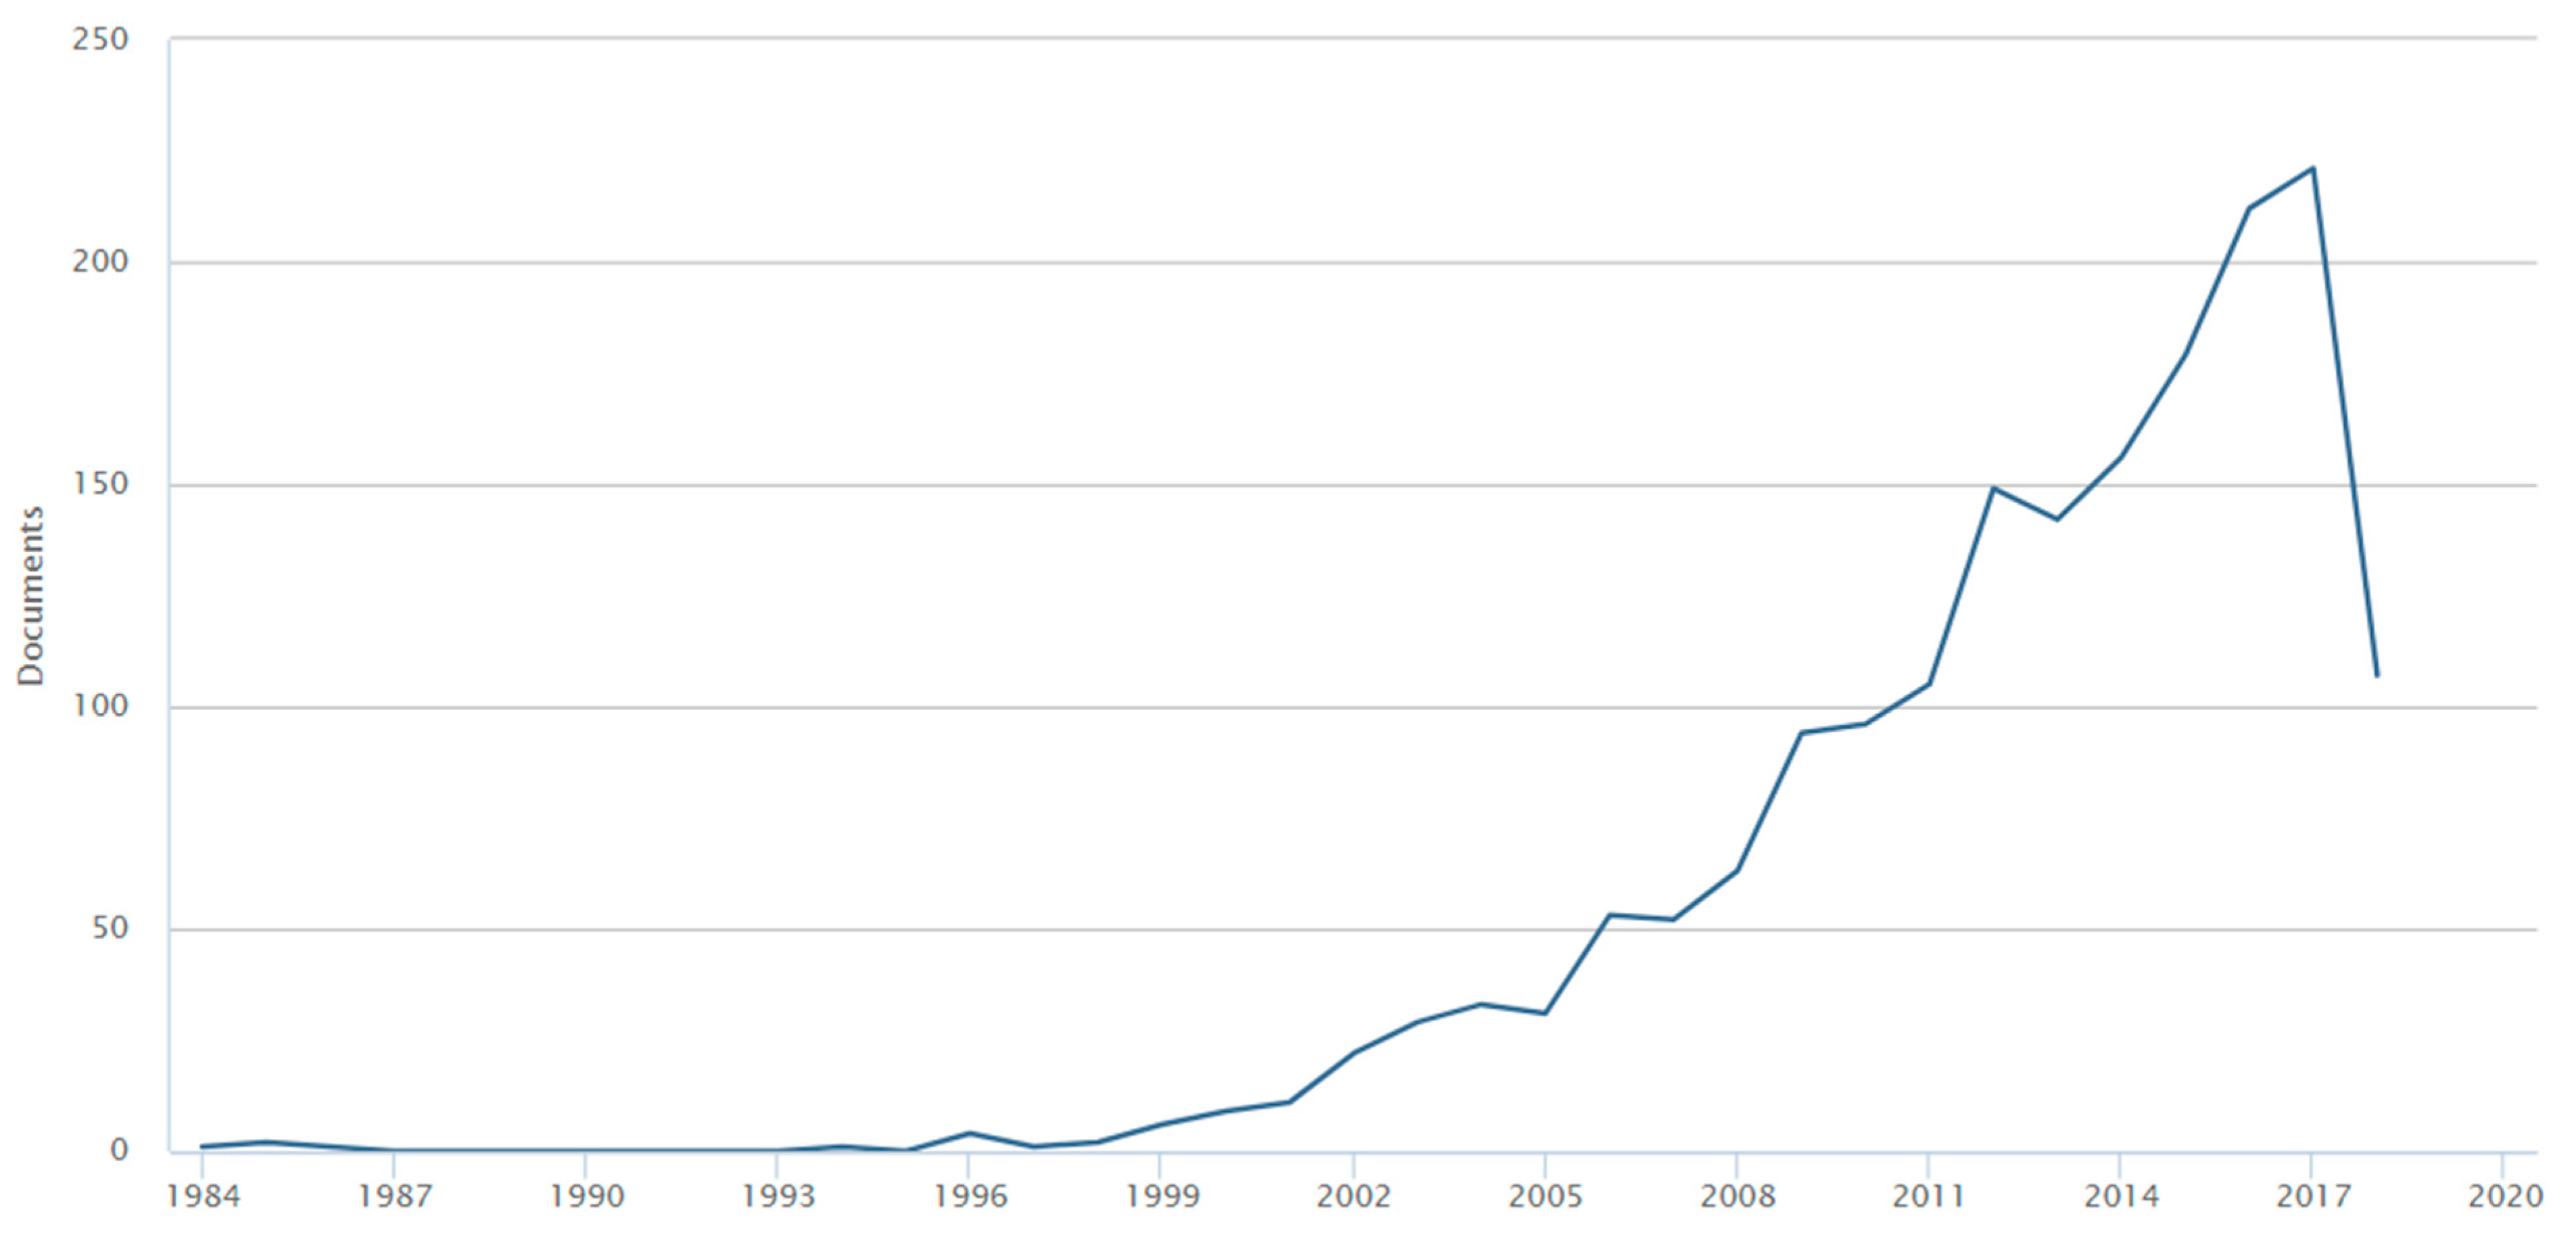
Graphics for the data in Table 2 (from Scopus 26/06/2018).
Figure 7.
Graphics for the data in Table 2 (from Scopus 26/06/2018).

Figure 8.
Triple bottom line (TBL) documents by subject area (≤2018) (Scopus, 26/08/2018).

Figure 9.
Snapshot of intended future development of the study into a platform as a service data-driven approach implementation.
Figure 9.
Snapshot of intended future development of the study into a platform as a service data-driven approach implementation.


Table 1.
Table of searches: first analysis sequence (search, row 1, 2). Second analysis sequence (search, row 3, 4, 5).
Table 1.
Table of searches: first analysis sequence (search, row 1, 2). Second analysis sequence (search, row 3, 4, 5).
| Number of the Searches | Search Word | How Many Documents Were Found |
|---|---|---|
| 1 | title-abs-key (“Triple” and “Bottom” and “Line”) | 11,768 |
| 2 | (title-abs-key (“Triple” and “Bottom” and “Line”)) and (“Triple Bottom Line”) | 9695 |
| 3 | (title-abs-key (“Triple” and “Bottom” and “Line”)) and (“Triple Bottom Line”) and (limit-to(pubyear,2018) or limit-to(pubyear,2017) or limit-to(pubyear,2016) or limit-to(pubyear,2015) or limit-to(pubyear,2014) or limit-to(pubyear,2013)) and (limit-to (srctype, ”j”)) | 677 |
| 4 | (title-abs-key (“Triple” and “Bottom” and “Line”)) and (“Triple Bottom Line”) and (sustainability or metric * or measure * or method * or methodology * or analys *) and (limit-to(pubyear,2018) or limit-to(pubyear,2017) or limit-to(pubyear,2016) or limit-to(pubyear,2015) or limit-to(pubyear,2014) or limit-to(pubyear,2013)) and (limit-to (srctype, ”j”)) | 666 |
| 5 | In the documents found in step 4, we chose those that had a citation number >12 | 117 |
Table 2.
Results (quantity) for the article search in Scopus (TITLE-ABS-KEY (triple AND bottom AND line)) (26/06/2018).
Table 2.
Results (quantity) for the article search in Scopus (TITLE-ABS-KEY (triple AND bottom AND line)) (26/06/2018).
| Year | Quantity of Articles | Year | Quantity of Articles | Year | Quantity of Articles | Year | Quantity of Articles |
|---|---|---|---|---|---|---|---|
| 1984 | 1 | 1994 | 1 | 2004 | 33 | 2014 | 156 |
| 1985 | 2 | 1995 | 0 | 2005 | 31 | 2015 | 179 |
| 1986 | 1 | 1996 | 4 | 2006 | 53 | 2016 | 212 |
| 1987 | 0 | 1997 | 1 | 2007 | 52 | 2017 | 221 |
| 1988 | 0 | 1998 | 2 | 2008 | 63 | June 2018 | 107 |
| 1989 | 0 | 1999 | 6 | 2009 | 94 | ||
| 1990 | 0 | 2000 | 9 | 2010 | 96 | ||
| 1991 | 0 | 2001 | 11 | 2011 | 105 | ||
| 1992 | 0 | 2002 | 22 | 2012 | 149 | ||
| 1993 | 0 | 2003 | 29 | 2013 | 142 |
Table 3.
The taxonomy framework of the TBL.
| Stack of the TBL Metrics | What kind of metrics are we talking about? | What Is the Complexity of the Problems Where the Metrics Are Used? | What Are the Standards Followed? | How Are Measurements Made and What Are the Measuring Techniques Used? | In What Kinds of Problems, Subjects and Areas Are the Metrics Used? Where Are They Used? | How Are the Metrics Validated? | What Are the Methods Used in Their Calculation? |
|---|---|---|---|---|---|---|---|
| Instances of the Stack | Qualitative Metrics Quantitative Metrics Hybrid Metrics | Simple Complexity Unknown NP-problem | Global reporting Initiative (GRI) Environment Management Accounting (EMA) City Sustainability Index (CSI) environment Sustainability Index (ESI) Financial Reporting Quality (FRQ) Other None | Algorithms Analytic network process Basic Formulation Bayesian networks Big Data Constructs, Language Data analytics Decision analytic tools Decision theory Decision tools Fuzzy approach Heuristics Impact studies Input-output analysis Life cycle Management Life cycle Sustainability Linear programming Markov Chain Monte Carlo Method Multi Criteria Decision Method Operational Investigation Predictive analytics Probabilistic models Reviews Statistical methods Stochastic decisions model Structural Equations Modelling approach model Systems dynamics | Automobile industry Management Systems Biofuel industry Manufacturing practices Building Manufacturing tools VSM Business Marketing Closed-Loop Supply Chain (CLSC) Materials manufacturing Collaboration Multinationals Commerce Nanotechnology Competitive advantage Natural capital Construction materials Green purchasing Consumables Planetary challenges Corporate culture Project management Corporate Social Responsibility (CSR) Renewable energy systems (RES) Create value on waste Responsible leadership Eco-efficiency Resource based view (RBV) Eco-innovation Retail Ecological trade-offs Risk management Electronic industry Sustainability start ups Energy, oil, gas, shale gas Tensions in corporations Fashion industry Tourism Fisheries management Trade-offs among social equity, economic return, and conservation Green manufacturing Service-Domain and Logics Gross Domestic Product (GDP) SMEs Health care waste electricity Sustainable cities Hospitality Sustainable Supply Chain Management (SSCM) Impact environment Urban communities Indigenous communities Urban tourismLocal tourism Water urban services Logistic Wind power | Application study Benchmarking Case study Case studiesknowledge None Resource based view Theory Sampling (inference statistic) Theory of Reasoned Action Theory of Planned Behavior | Categorization Numerical methods Normal calculation Statistical methods |
Table 4.
Indicates whether or not each article contains references to the items that are in the taxonomy framework grid (results from the DMAT).
Table 4.
Indicates whether or not each article contains references to the items that are in the taxonomy framework grid (results from the DMAT).
| Article nº | Qualitative | Quantitative | Hybrid | NP-Problem | Environment Management Accounting (EMA) | City Sustainability Index (CSI) | Environment Sustainability Index (ESI) | Financial Reporting Quality (FRI) |
|---|---|---|---|---|---|---|---|---|
| 101 | 1 | 1 | 1 | 0 | 1 | 0 | 0 | 0 |
| 104 | 0 | 0 | 0 | 0 | 1 | 0 | 1 | 0 |
| 108 | 0 | 0 | 0 | 0 | 0 | 0 | 1 | 0 |
| 10 | 0 | 0 | 0 | 0 | 1 | 0 | 0 | 0 |
| 110 | 1 | 1 | 1 | 0 | 0 | 1 | 0 | 0 |
Table 5.
Classification of the articles included in Table 4 on the taxonomy framework grid.
Table 5.
Classification of the articles included in Table 4 on the taxonomy framework grid.
| Article nº | Qualitative | Quantitative | Hybrid | NP-Problem | Environment Management Accounting (EMA) | City Sustainability Index (CSI) | Environment Sustainability Index (ESI) | Financial Reporting Quality (FRI) |
|---|---|---|---|---|---|---|---|---|
| 101 | 1 | 1 | 1 | 0 | 1 | 0 | 0 | 0 |
| 104 | 0 | 1 | 0 | 0 | 1 | 0 | 1 | 0 |
| 108 | 0 | 1 | 0 | 0 | 0 | 0 | 1 | 0 |
| 10 | 1 | 0 | 0 | 0 | 1 | 0 | 0 | 0 |
| 110 | 1 | 1 | 1 | 0 | 0 | 1 | 1 | 0 |
© 2019 by the authors. Licensee MDPI, Basel, Switzerland. This article is an open access article distributed under the terms and conditions of the Creative Commons Attribution (CC BY) license (http://creativecommons.org/licenses/by/4.0/).
Share and Cite
MDPI and ACS Style
Vieira, F.L.; Vieira, P.A.; Coelho, D.A. A Data-Driven Approach to Development of a Taxonomy Framework for Triple Bottom Line Metrics. Sustainability 2019, 11, 2717. https://doi.org/10.3390/su11092717
AMA Style
Vieira FL, Vieira PA, Coelho DA. A Data-Driven Approach to Development of a Taxonomy Framework for Triple Bottom Line Metrics. Sustainability. 2019; 11(9):2717. https://doi.org/10.3390/su11092717
Chicago/Turabian StyleVieira, Fátima L., Paulo A. Vieira, and Denis A. Coelho. 2019. "A Data-Driven Approach to Development of a Taxonomy Framework for Triple Bottom Line Metrics" Sustainability 11, no. 9: 2717. https://doi.org/10.3390/su11092717
Note that from the first issue of 2016, this journal uses article numbers instead of page numbers. See further details here.