Urban Form and Mobility Choices: Informing about Sustainable Travel Alternatives, Carbon Emissions and Energy Use from Transportation in Swedish Neighbourhoods


Urban and regional studies, KTH Royal Institute of Technology, 10044 Stockholm, Sweden
Sustainability 2019, 11(2), 548; https://doi.org/10.3390/su11020548
Submission received: 23 December 2018
/
Revised: 17 January 2019
/
Accepted: 18 January 2019
/
Published: 21 January 2019
(This article belongs to the Special Issue Sustainability in Transportation and the Built Environment)
Abstract
:The lack of mobility choices in many Swedish neighbourhoods and cities designed for automobiles hinders the possibilities to shift towards more sustainable travel alternatives. Urban designers and planners can help with redesigning these neighbourhoods and creating urban forms that encourage walking, cycling and increased use of public transportation if they are informed about the environmental performance and carbon implications of transportation systems in existing and newly planned neighbourhoods. This paper proposes a mobility choices model based on urban form and accessibility factors commonly used in urban planning and design practices. The mobility choices model produces heat maps and visually informs about the integration with walking, cycling, public transportation and private car, modal shares, carbon emissions and transportation energy use. This information can (potentially) trigger urban transformation or redesign to better integrate sustainable travel alternatives in these neighbourhoods and contribute to more sustainable cities. Many houses can have an excellent environmental performance as buildings but they can be located at a distance where it is impossible to walk, cycle or use public transportation. The benefits of energy efficient and carbon neutral home then disappears with extensive travel and commuting by automobile.
1. Introduction
Climate change is a major environmental issue of concern that inspires diverse sustainability initiatives and carbon management practices [1,2,3]. The urban transportation is responsible for roughly one third of all CO2 emissions in the Earth atmosphere [4] making mobility a crucial sustainability challenge in cities. There is no universally accepted definition of sustainable mobility [1,5,6,7,8,9,10] but is a considered as a process to deliver environmentally friendly and energy efficient transportation with help of mobility management, sustainable mobility indicators that capture economic, environmental and social aspects, public participation and envisioning futures [9,10,11].
Many municipalities in Sweden (and in other Nordic countries [12]) tackle the climate change and unsustainable transportation challenge by focusing on curbing carbon emissions and pursuing modal shift towards more walking, cycling and public transportation. During the past decade, it spurred a large number of low-carbon city initiatives [6]. Stockholm and Malmö have even more ambitious environmental goals [13,14] to break the dependence on petroleum and become fossil fuels free within the next 20 years. A major obstacle to achieve sustainable mobility in Sweden is the urban form. Many neighbourhoods, towns and cities, as elsewhere in the developed countries in Europe, North America and Australia, were designed specially to accommodate the private automobile. These urban conurbations of scattered residential suburbs, external shopping malls, office parks interlinked by road hierarchies with the historical downtowns, are dominated by automobile and depend on imports of finite resources of fossil fuels from faraway lands. The lack of mobility choices hinders the modal shift from automobile travel. The public buses are often slow meandering travel alternative to the private car. The fragmentation within the urban regions and the design of streets within neighbourhoods makes impossible to walk or cycle [15]. There is a need to redesign the cities and sprawled neighbourhoods to make walking, cycling and public transportation viable travel alternatives.
Urban designers and planners can help with redesigning neighbourhoods and creating urban forms that encourage walking, cycling and increased use of public transportation if they are aware about the environmental performance and carbon implications of transportation systems in existing and newly planned neighbourhoods. These environmental goals about decreasing carbon emission and modal shift towards sustainable travel alternative do not link to urban planning and design practices. Urban planners usually work with conventional zoning, whereas urban designers prefer Form-Based Codes (FBCs) and urban design guidelines [16,17,18,19,20,21,22]. The factors in these urbanist practices (such as land uses, employment and residential densities, Floor Space Indexes (FSI), Open Space Indexes (OSI), building setbacks, building heights, street widths, parking requirements, etc.) do not match the sustainability mobility indicators in the environmental goals of the Swedish municipalities. To connect urban planning and design practices with sustainable mobility, travel alternatives, transportation energy use and carbon implications, this paper proposes and tests a mobility choices model based on theories of sustainability indicators [8,23,24,25,26,27,28] and studies on the effect of urban form on travel [15,29,30,31,32,33,34,35,36,37,38,39,40,41,42,43,44,45,46,47,48,49,50,51,52,53,54]. The mobility choices model visually informs by showing maps for integration with walking, cycling, public transportation and private car, modal shares, transportation energy use and carbon emissions. It consists of a set of urban form and accessibility factors commonly used in urban planning and design practices as sustainable mobility indicators.
The aim of this research is to communicate sustainable mobility, mobility choices and integration with walking, cycling, public transportation and private automobile with actors and stakeholders in Swedish urban development processes. The sustainable mobility indicators are selected and developed in coordination with Swedish municipality officials and real property developers and they reflect Swedish conceptualization of sustainable mobility and urbanist practices. Furthermore, the indirect aim is to open discussions on institutionalizing Mobility Choices Certificates (MCC) in a broader context of environmental impact and sustainability of buildings. European commission (EC) has established legislation and methodologies to assess energy efficiency and carbon emissions of buildings but not for transportation to and from buildings. Energy Performance Certificates (EPCs) are mandatory for almost all buildings larger than a single-family residence in the European Union (EU). Many houses can have excellent EPCs but they can be located at a distance where it is impossible to walk, cycle or use public transportation. The benefits of energy efficient home then disappears with extensive traveling and commuting by automobile.
The following section describes the theoretical framework/background behind the mobility choices model.
2. Theoretical Framework/Background
This section discusses concepts and theories analysing urban forms and forecasting modal shares. The first subsection presents research on the effect of urban form on modal shares and inversely on forecasting modal shares based on urban form factors. The second subsection links urban form, environmental perception and mobility choices to position urban form and accessibility factors as environmental preconditions to travel. The third subsection discusses sustainable indicators as theoretical background to structure urban form and accessibility factors in the mobility choices model. The fourth section presents a theory to forecast modal shares based on sustainable mobility indicators (urban form and accessibility factors) as environmental preconditions to travel.
2.1. Analysing Urban Forms and Forecasting Modal Shares Based on Urban Form Factors
There is an extensive literature [15,29,30,31,32,33,34,35,36,37,38,39,40,41,42,43,44,45,46,47,48,49,50,51,52,53,54] on the potential to influence travel behaviour by changes in the urban form [36]. In the studies on urban form and travel behaviour, land use refers to development patterns, physical design, design features, density, levels of jobs-housing balance, mix of land uses and demographic characteristics [29,30]. The land use is usually described by a set of D-variables: Density, Diversity and Design [34]; Distance to transit and Destination accessibility [48]; Demand management and Demographics [36]. In most land use-travel studies, a travel variable is regressed on explanatory variables that include measures of land use and personal characteristics of the travellers. Geographic Information Systems (GIS) are used to construct detailed land use measures at specific locations. This locational data is usually paired with individual travel diaries to test the hypothesis that individual travel is influenced by land use. All of the land use or D-variables are typically measured using census data or data that derives from GIS and incorporated in a general Formula (1) for effect of urban form on travel behaviour [51].
- Tx Travel variable for individual x (e.g., modal share, number of annual journeys)
- α Intercept
- Px Variables describing personal characteristics of individual x
- βx Parameter showing the effect of personal characteristics on Tx
- LUl Variables describing land use factors (e.g., density)
- λl Parameters showing the effect of urban form factors on Tx
- ε Error term
Inversely, transportation professionals use land uses or density of development (usually as number of jobs and residents) to predict trip generation [55,56,57]. The trip generation models are based on empirical research on travel patterns from specific land uses. The “Trip Generation Manual” [56] compiles and continuously updates the empirical knowledge on the effect of hundreds of land uses. The D-variables are also used to estimate trip generation rates [55,56,57]. The generic Formula (2) for trip generation models is:
- NLUi Number of annual journey generated by land use i
- trLUi Trip generation rate for land use type i in respect to quantity
- qLUi Quantity (number of residents or jobs or size of floor space) for land use type i
Instead of land uses, the mobility choices model uses a set of urban form and accessibility factors for travel forecasting that are structured based on environmental perception and cognitive understanding of cities. The following subsection presents the theoretical framework for travel behaviour that derives from environmental psychology.
2.2. Environmental Perception of Urban Form and Travel Behaviour
Economists argue that individuals make trade-offs between costs in money, time, comfort, convenience and so forth for every journey. To estimate mode choices they conventionally use utility-based discrete mode choice models [58,59,60,61]. Urban form factors influence travel costs by concentrating destinations closer or by changing the time that is needed to travel, thus increasing prices of driving. The probability to drive in dense urban environments would be lower because the costs of time spend in travel would be higher. This high costs would reflect on decreasing number of journeys by private automobile [31,35,51]. Psychologists understand (travel) behaviour as a consequence of personal characteristics and environmental perception [62]. Personal characteristics include a set of personality traits, ego, habits, preferences, attitudes, commitments and so forth [63,64]. Environmental perception means interpreting sensory information from the physical and social surroundings and the emotional responses they provoke. Affordances show what the environments offer to the observer either for good or ill [65].
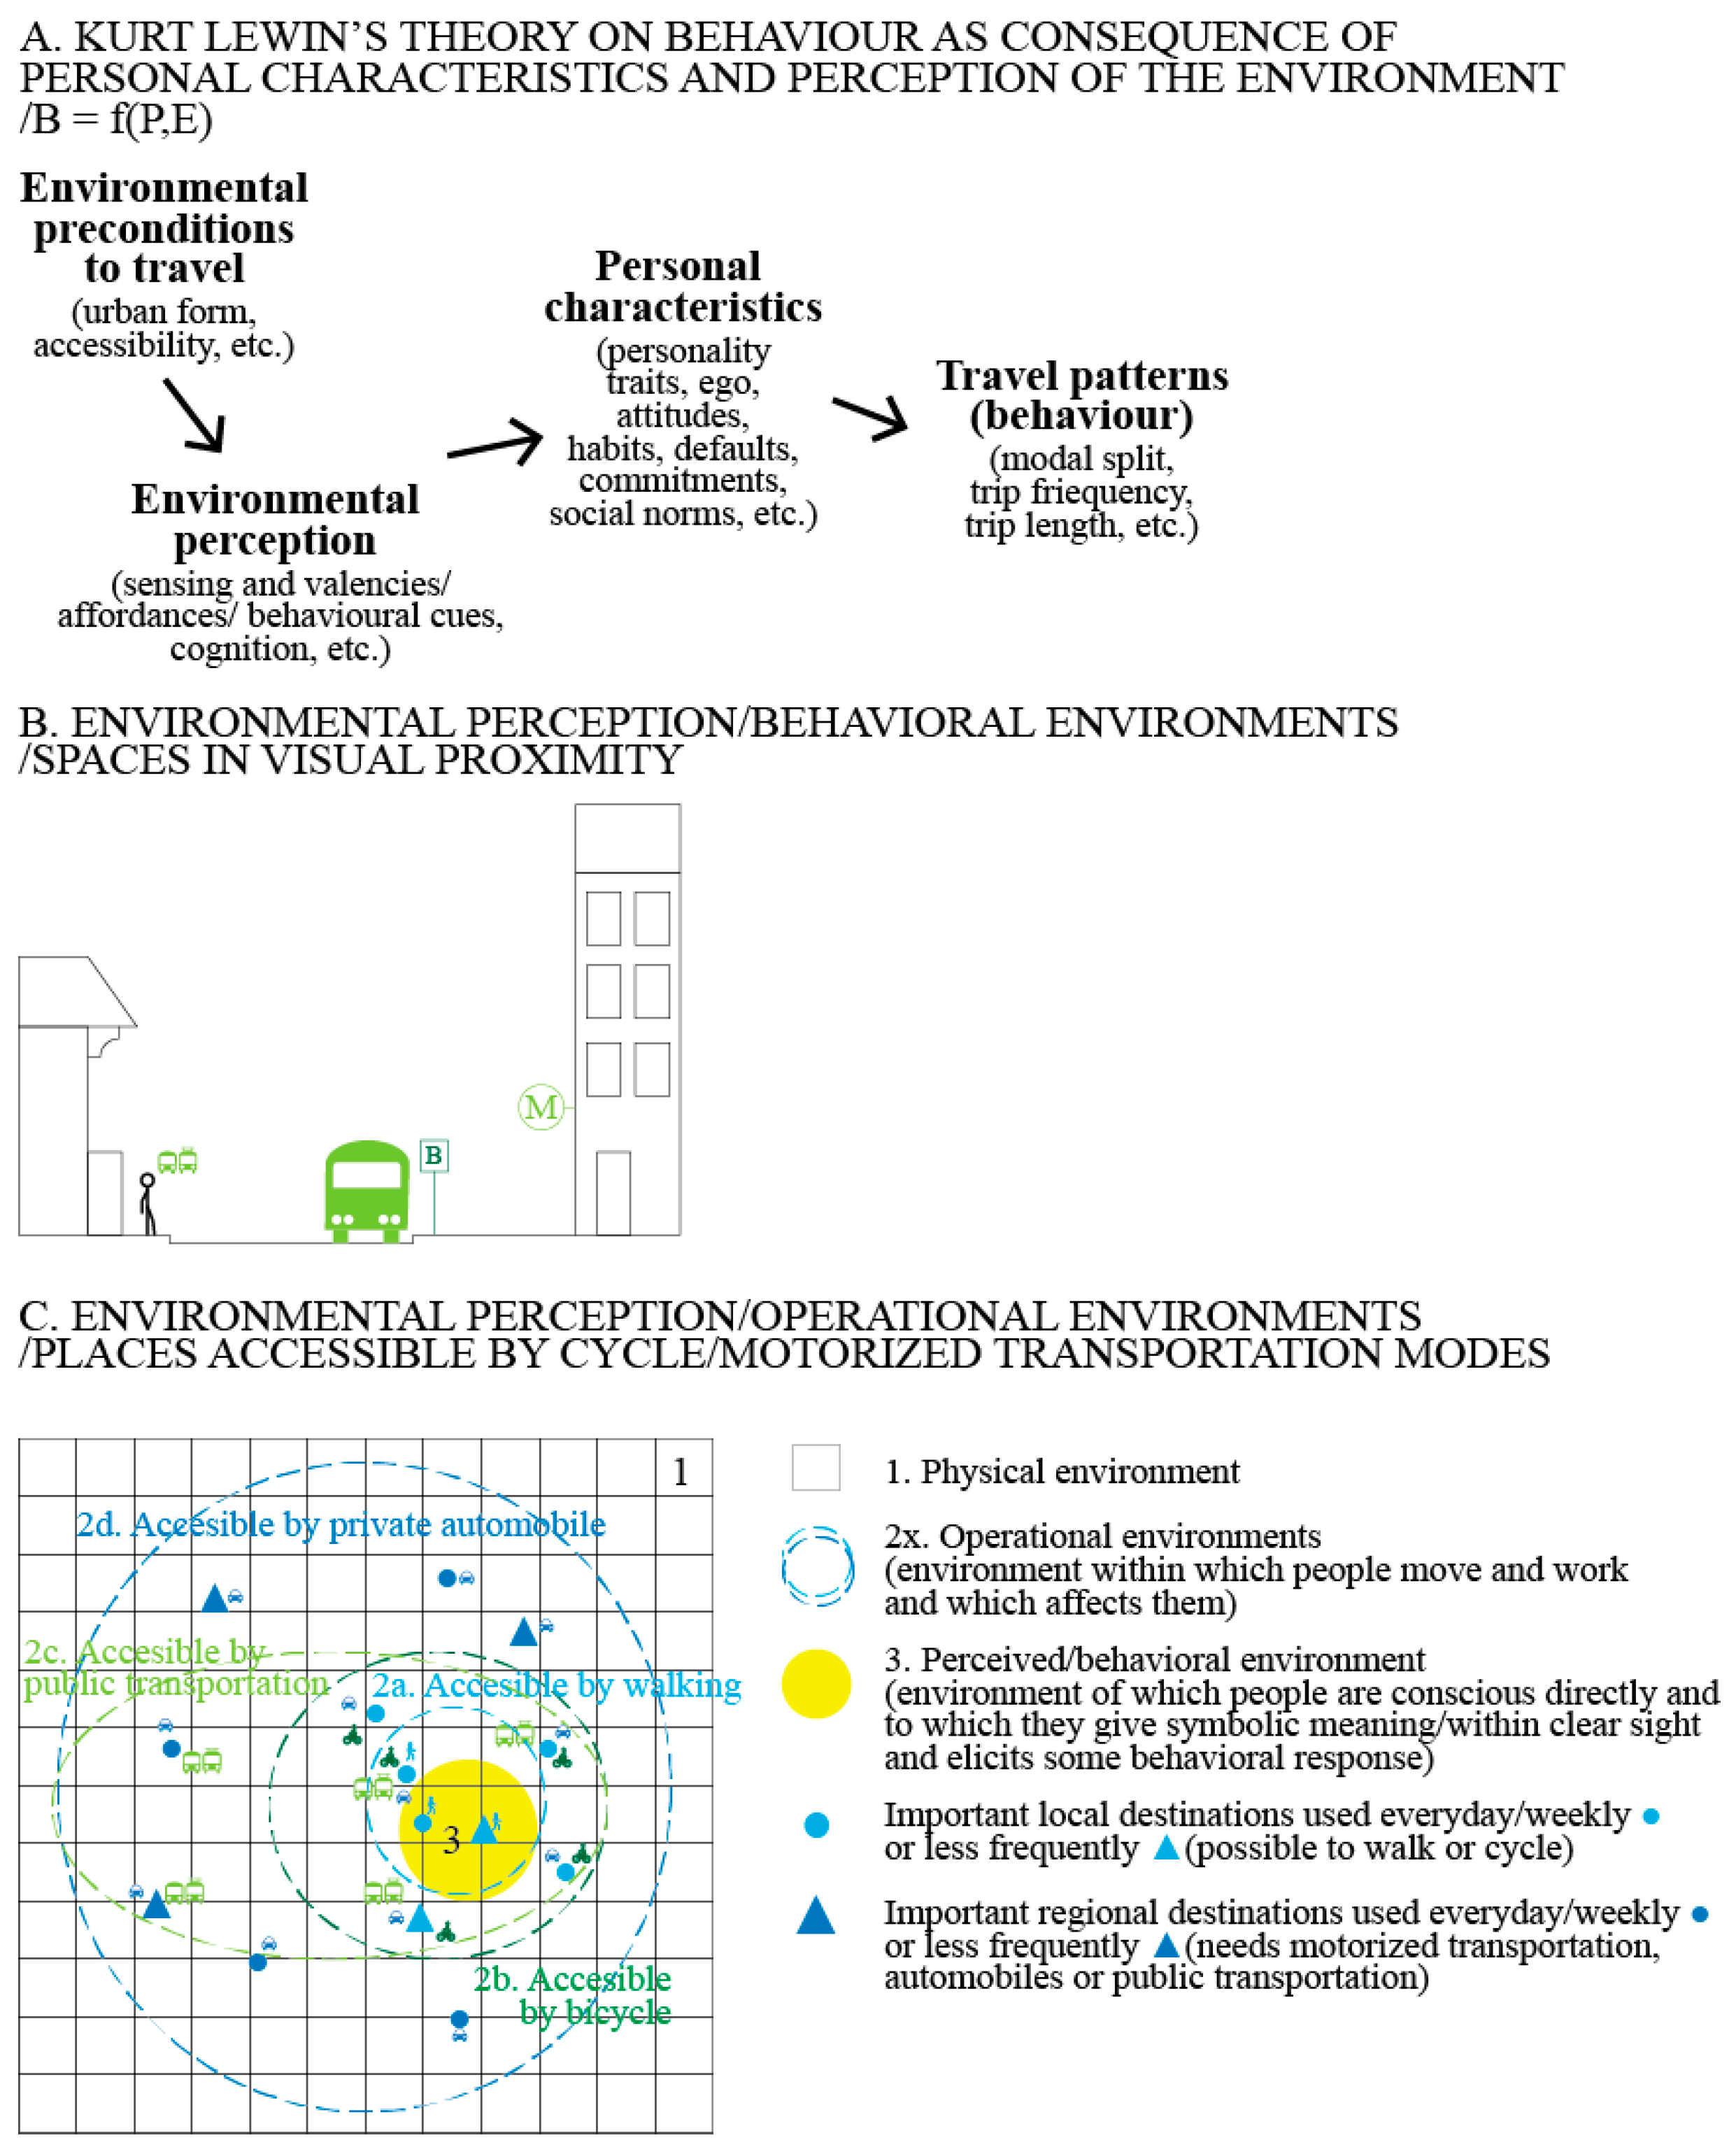
Environmental perception structures environmental precondition to travel as affordances, a set of urban form and accessibility factors (Figure 1A). Environmental psychologists recognize layers of nested environments in physical space [66]. The operational environment defines the space where people move and work. Perceptual environment is the space of which people are conscious directly and to which they give symbolic meaning. In the behavioural environment, people are not only aware but it also elicits some behavioural response [67]. Affordances exist within perceptual modalities (perceptual/behavioural environments) and cognitive understanding of urban regions (operational environments). Vision dominates perceptual modalities and the space within clear visual acuity is roughly 100–200 m [65,68]. Benches, bus stops, subway exits, kiosks, sidewalks and so forth within 100–200 m are affordances in a range of visual perception. Figure 1B illustrates an individual considering probability to drive, walk, cycle or use public transportation influenced by affordances in visual proximity (subway exits lead to the underground train, bus 7 that stops here goes to downtown, there is no parking available near that building, etc.). The urban elements within visual proximity (perceptual/behavioural environments) can prioritize some transportation modes and hinder others. A parking lot would obscure a bus stop and that will effect travel behaviour. The presence of bike lanes or bus stops in visual proximity would always remind individuals about more sustainable travel alternatives to the private automobile. Locations are understood and organized as cognitive maps (operational environments). The operational environments are often represented as cartograms (e.g., subway maps tor transit passengers) or as destinations within isochrones showing accessibility ranges for different transportation modes (Figure 1C).
The following subsection discusses sustainable indicators as a method to structure urban form and accessibility factors (as embedded affordances) in a composite system indicator. The composite system indicators shows preconditions to travel with different transportation modes at scales of environmental perception (visual proximity) and cognitive understanding of destinations in a walking range (neighbourhood scale) and regional connectivity (access by motorized transportation).
2.3. Sustainable (Mobility) Indicators and Certification Systems for Buildings
There is an extensive body of literature on sustainable indicators and application of indicators in urban planning too [8,23,24,25,26,27,28]. The indicators inform about trends in society, economy and the environment. Specific indicators focus on particular parameters (e.g., modal share of cycling), whereas system indicators that show general trends (e.g., total carbon emissions by transportation per capita). Indicator reports and composite indicators consist of many parameters (e.g., mobility plans that include modal shares, carbon emissions per capita, satisfaction with public transportation, etc.) [23]. The methodology of composite indicators is based on grouping and weighing factors, criteria and parameters into a system indicator. The generic formula is:
- I Indicator for criteria/factors/parameters
- wi Weight for criterion/factor/parameter i
- ci Criterion/factor/parameter i
The composite indicators commonly find application in environmental assessments and certification systems of buildings such as Leadership in Energy and Environmental Design (LEED), Building Research Establishment Environmental Assessment Methodology (BREEAM). The environmental certification systems for buildings emerged during the early 1990s and expanded their scope to include neighbourhoods in the last decade [69,70,71,72]. The certification systems can be regarded as environmental management tools aimed at continuous improvement of urban development practices. They use a complex predefined set of criteria and indicators. The criteria are then aggregated, sometimes involving a weighting, in order to provide a communicable certificate, label and/or grade. The certificate works as a means for benchmarking and marketing how sustainable a specific urban development is [72]. The theoretical framework of grouping and weighing sustainable indicators and certification systems for buildings can be used to develop composite measures showing embedded affordances in urban forms as preconditions to travel by particular transportation modes.
Based upon the conceptual framework in Figure 1 and the theory of sustainable indicators, the following subsection presents a theory to forecast modal shares based on preconditions to travel at scales of visual proximity and access to destinations in a local neighbourhood or urban region.
2.4. Forecasting Modal Shares and Mobility Class Bias
The theories of environmental perception and sustainable (mobility) indicators can be used to forecast modal shares. Each particular transportation mode has a combination of urban form and accessibility factors, environmental preconditions to travel, that supports its mobility. The environmental preconditions to travel are elements of the urban form (density, building heights, building orientation, street widths, design of sidewalks, bike lanes, bus stops, access to different locations, etc.) that can be grouped and weighed with the methodology of composite system indicators to show integration with particular transportation modes such as walking, cycling, public transportation and private car. The presence of bike lanes at closer distances boosts cycling in cities [73,74,75,76]. This applies also for walking and proximity to retail and shopping [77]. Parking is crucial urban form factor for integration with private automobile. It is impossible to drive to a location that has no parking spaces. Empirical research on walking distances show the number of generated passengers within 100–200 m is almost double than within 300–400 m for bus and tram stops on streets [78,79]. The combined effect of several D-variables (high density, mix of uses, physical design to support walking, distance to transit) is assumed to have a profound effect on walking and public transportation [37]. This corresponds to other research in European countries especially in North Europe [38,43,44,45,46]. The empirical evidence in the travel surveys in Sweden over the last decades shows consistently that the modal share of automobile and average trip length roughly halves for residents living in downtowns even in the small towns. The decrease in automobile travel produces increased shares of walking and cycling.
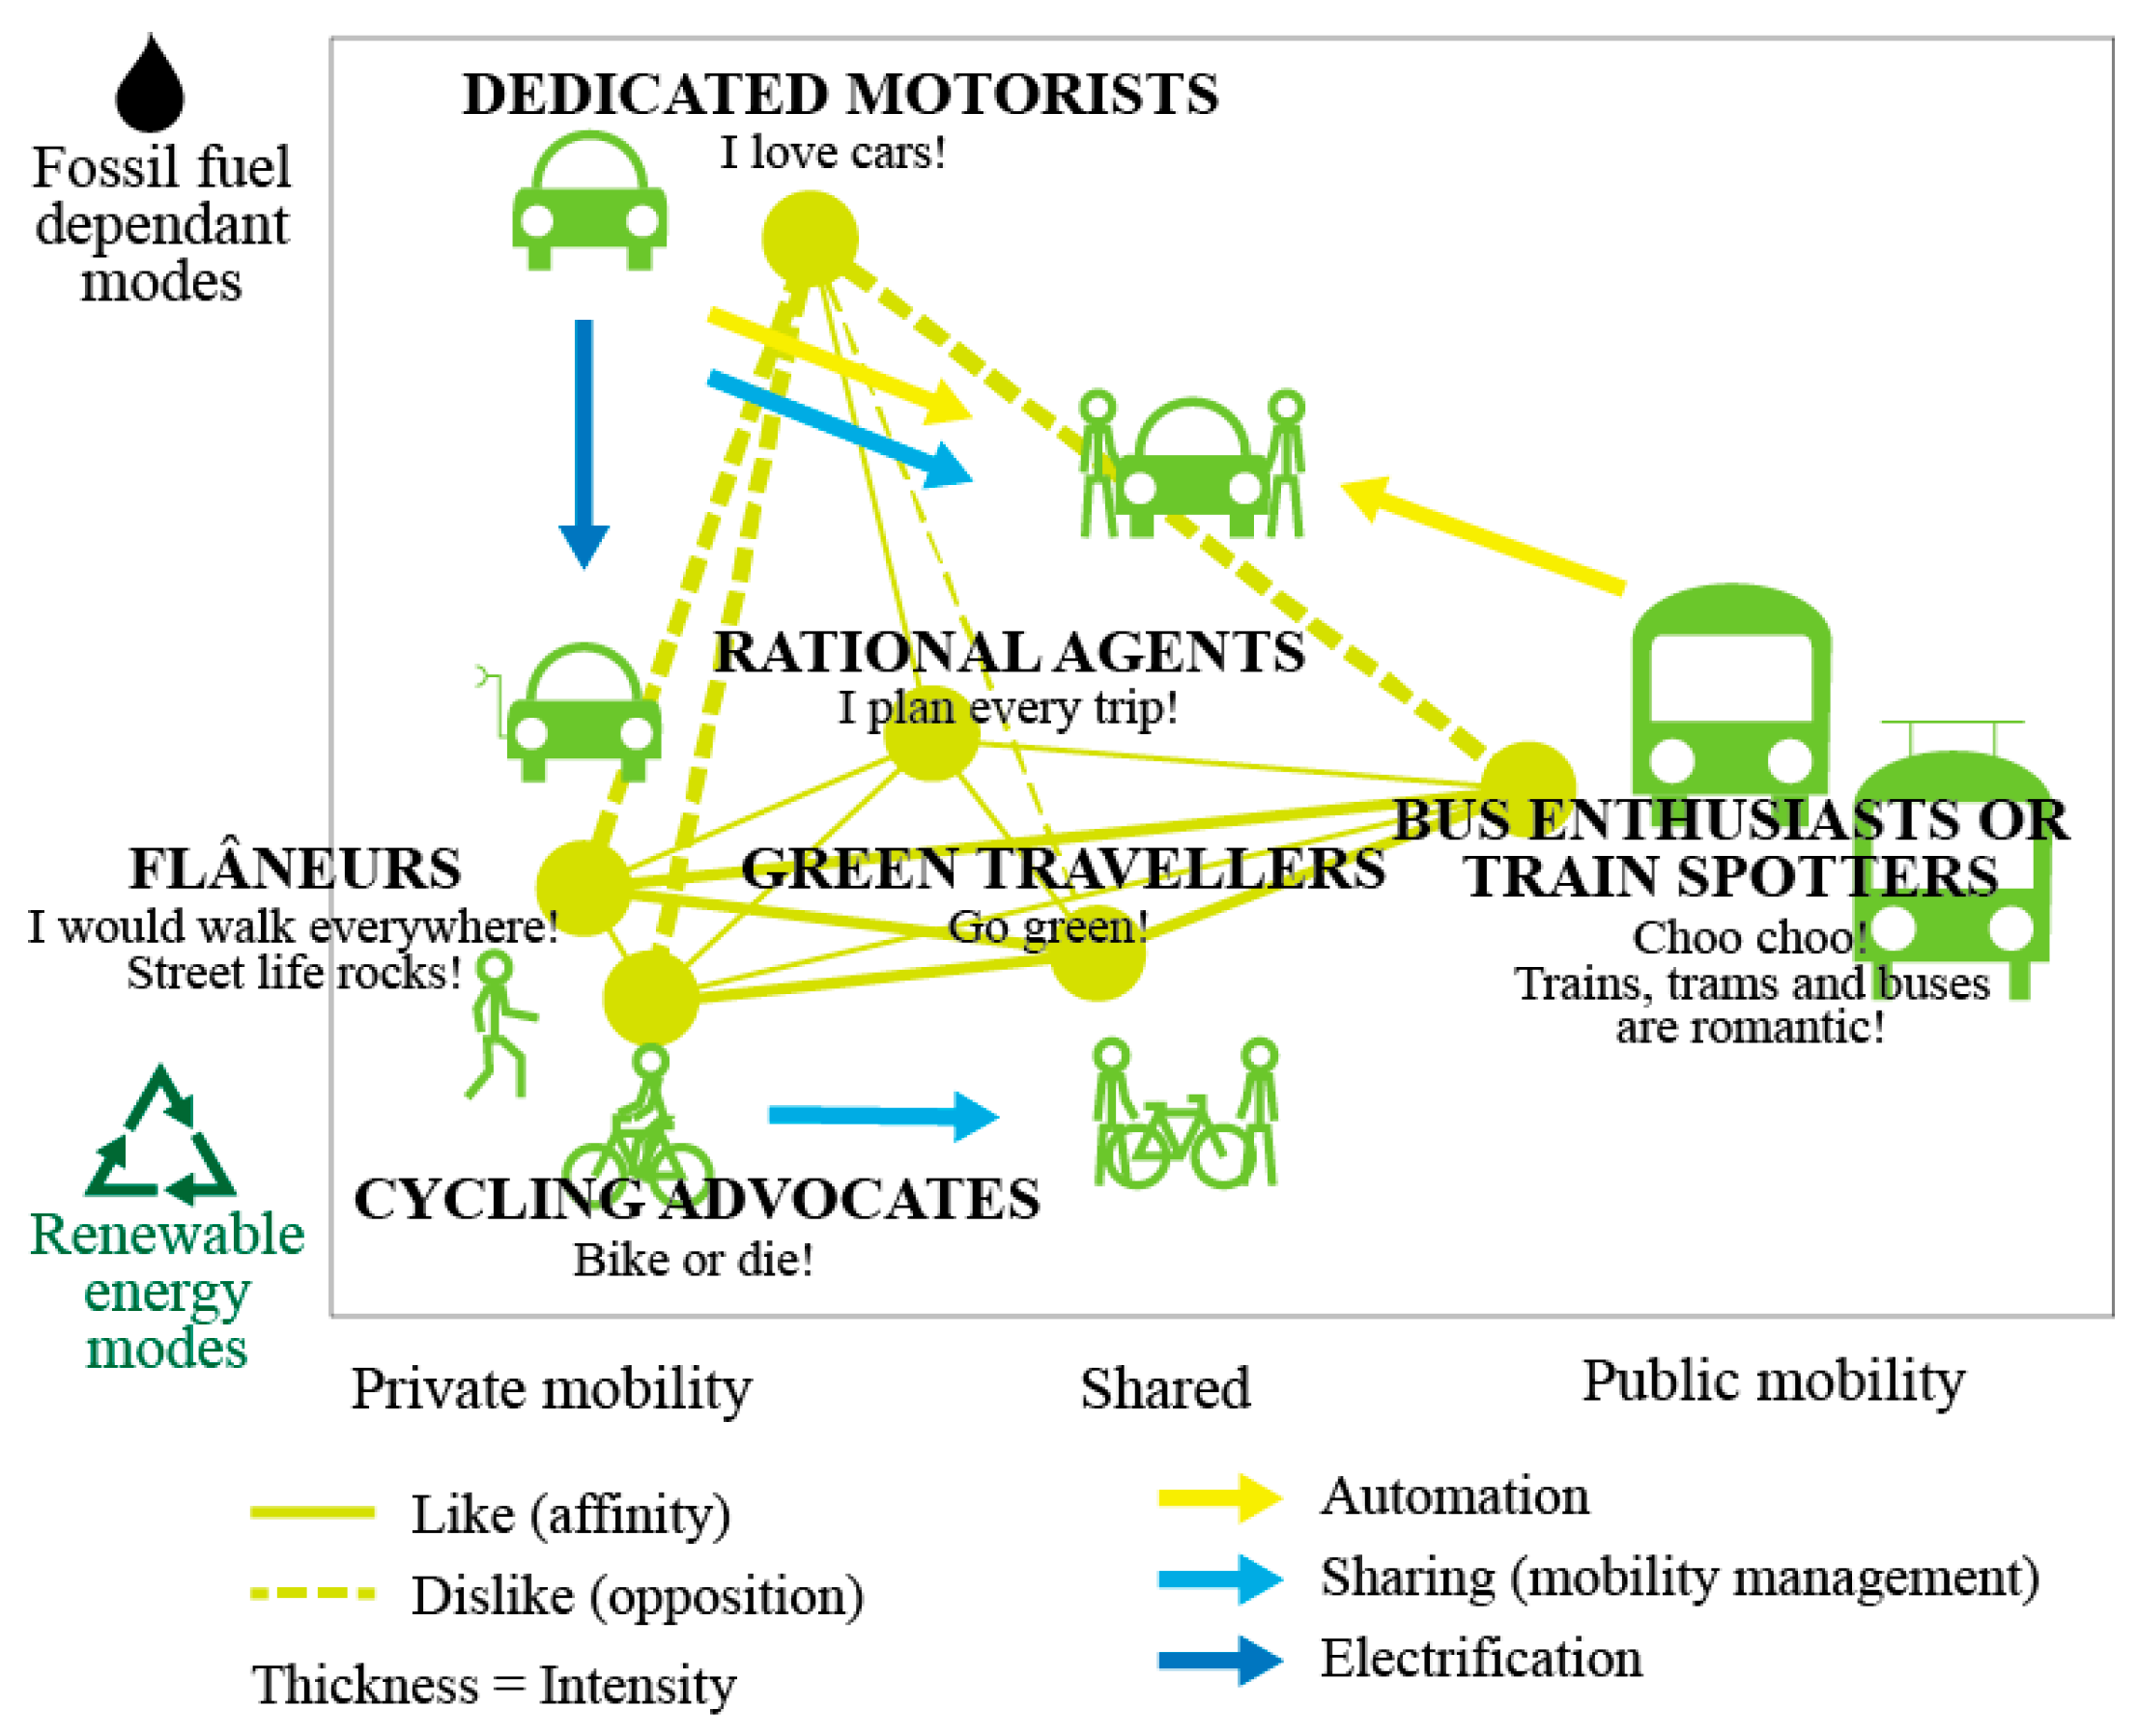
By structuring the urban form and accessibility factors for each particular transportation modes it is possible to forecast modal shares as competition between walking, cycling, public transportation and private automobile. The forecasts for modal shares would be approximated, because they are based only on environmental preconditions to travel. Travel behaviour directly depends on the personal characteristics (see Figure 1A). The actual modal split is formed by individual preferences of travellers (in reality market segments or mobility classes [80,81]) and environmental preconditions to travel (affected by urban form and accessibility factors that support or hinder these mobilities). To show this bias of approximation, this paper analyses how different individuals (as representatives of mobility cultures) would perceive the travel alternatives in the urban forms. The term mobility class (deriving from conceptualization of social class [82]) defines groups of individuals with strong preferences to specific transportation modes (irrational car addicts, cycling advocates, green travellers and so forth in References [80,81]). Flâneurs favour walking, cycling advocates love bikes, bus enthusiasts and train spotters prefer transit and dedicated motorists drive everywhere. Green travellers prefer walking, cycling and public transportation before private car and rational agents have equal preference to all transportation modes. In reality, the individuals are not always dedicated to one transportation mode but they are partly flâneurs, part cyclists, part motorists, part transit nerds, etc.
Each city has a market segmentation of mobilities classes [80,81] that would skew the modal shares forecast towards the socially preferred transportation mode despite integration with other transportation modes. The car-oriented society would neglect preconditions to travel by transit or walking and cycling. Strong public mobility cultures would boost the use of public transportation despite sometimes poor integration of transit stops. Figure 2 shows the interaction of the mobility classes on a background that illustrates new trends of electrification, automation and sharing.
The following section describes the methodology to forecast mobility choices as a modal split between walking, cycling, public transportation and private automobile based on a set of urban form and accessibility factors as preconditions to travel and a method to analyse how different mobility classes would perceive the urban form as mobility choices.
3. Methodology
This section presents methodologies to forecast modal shares by embedded affordances in urban forms and evaluate how different mobility classes would perceive the mobility choices embedded in urban forms.
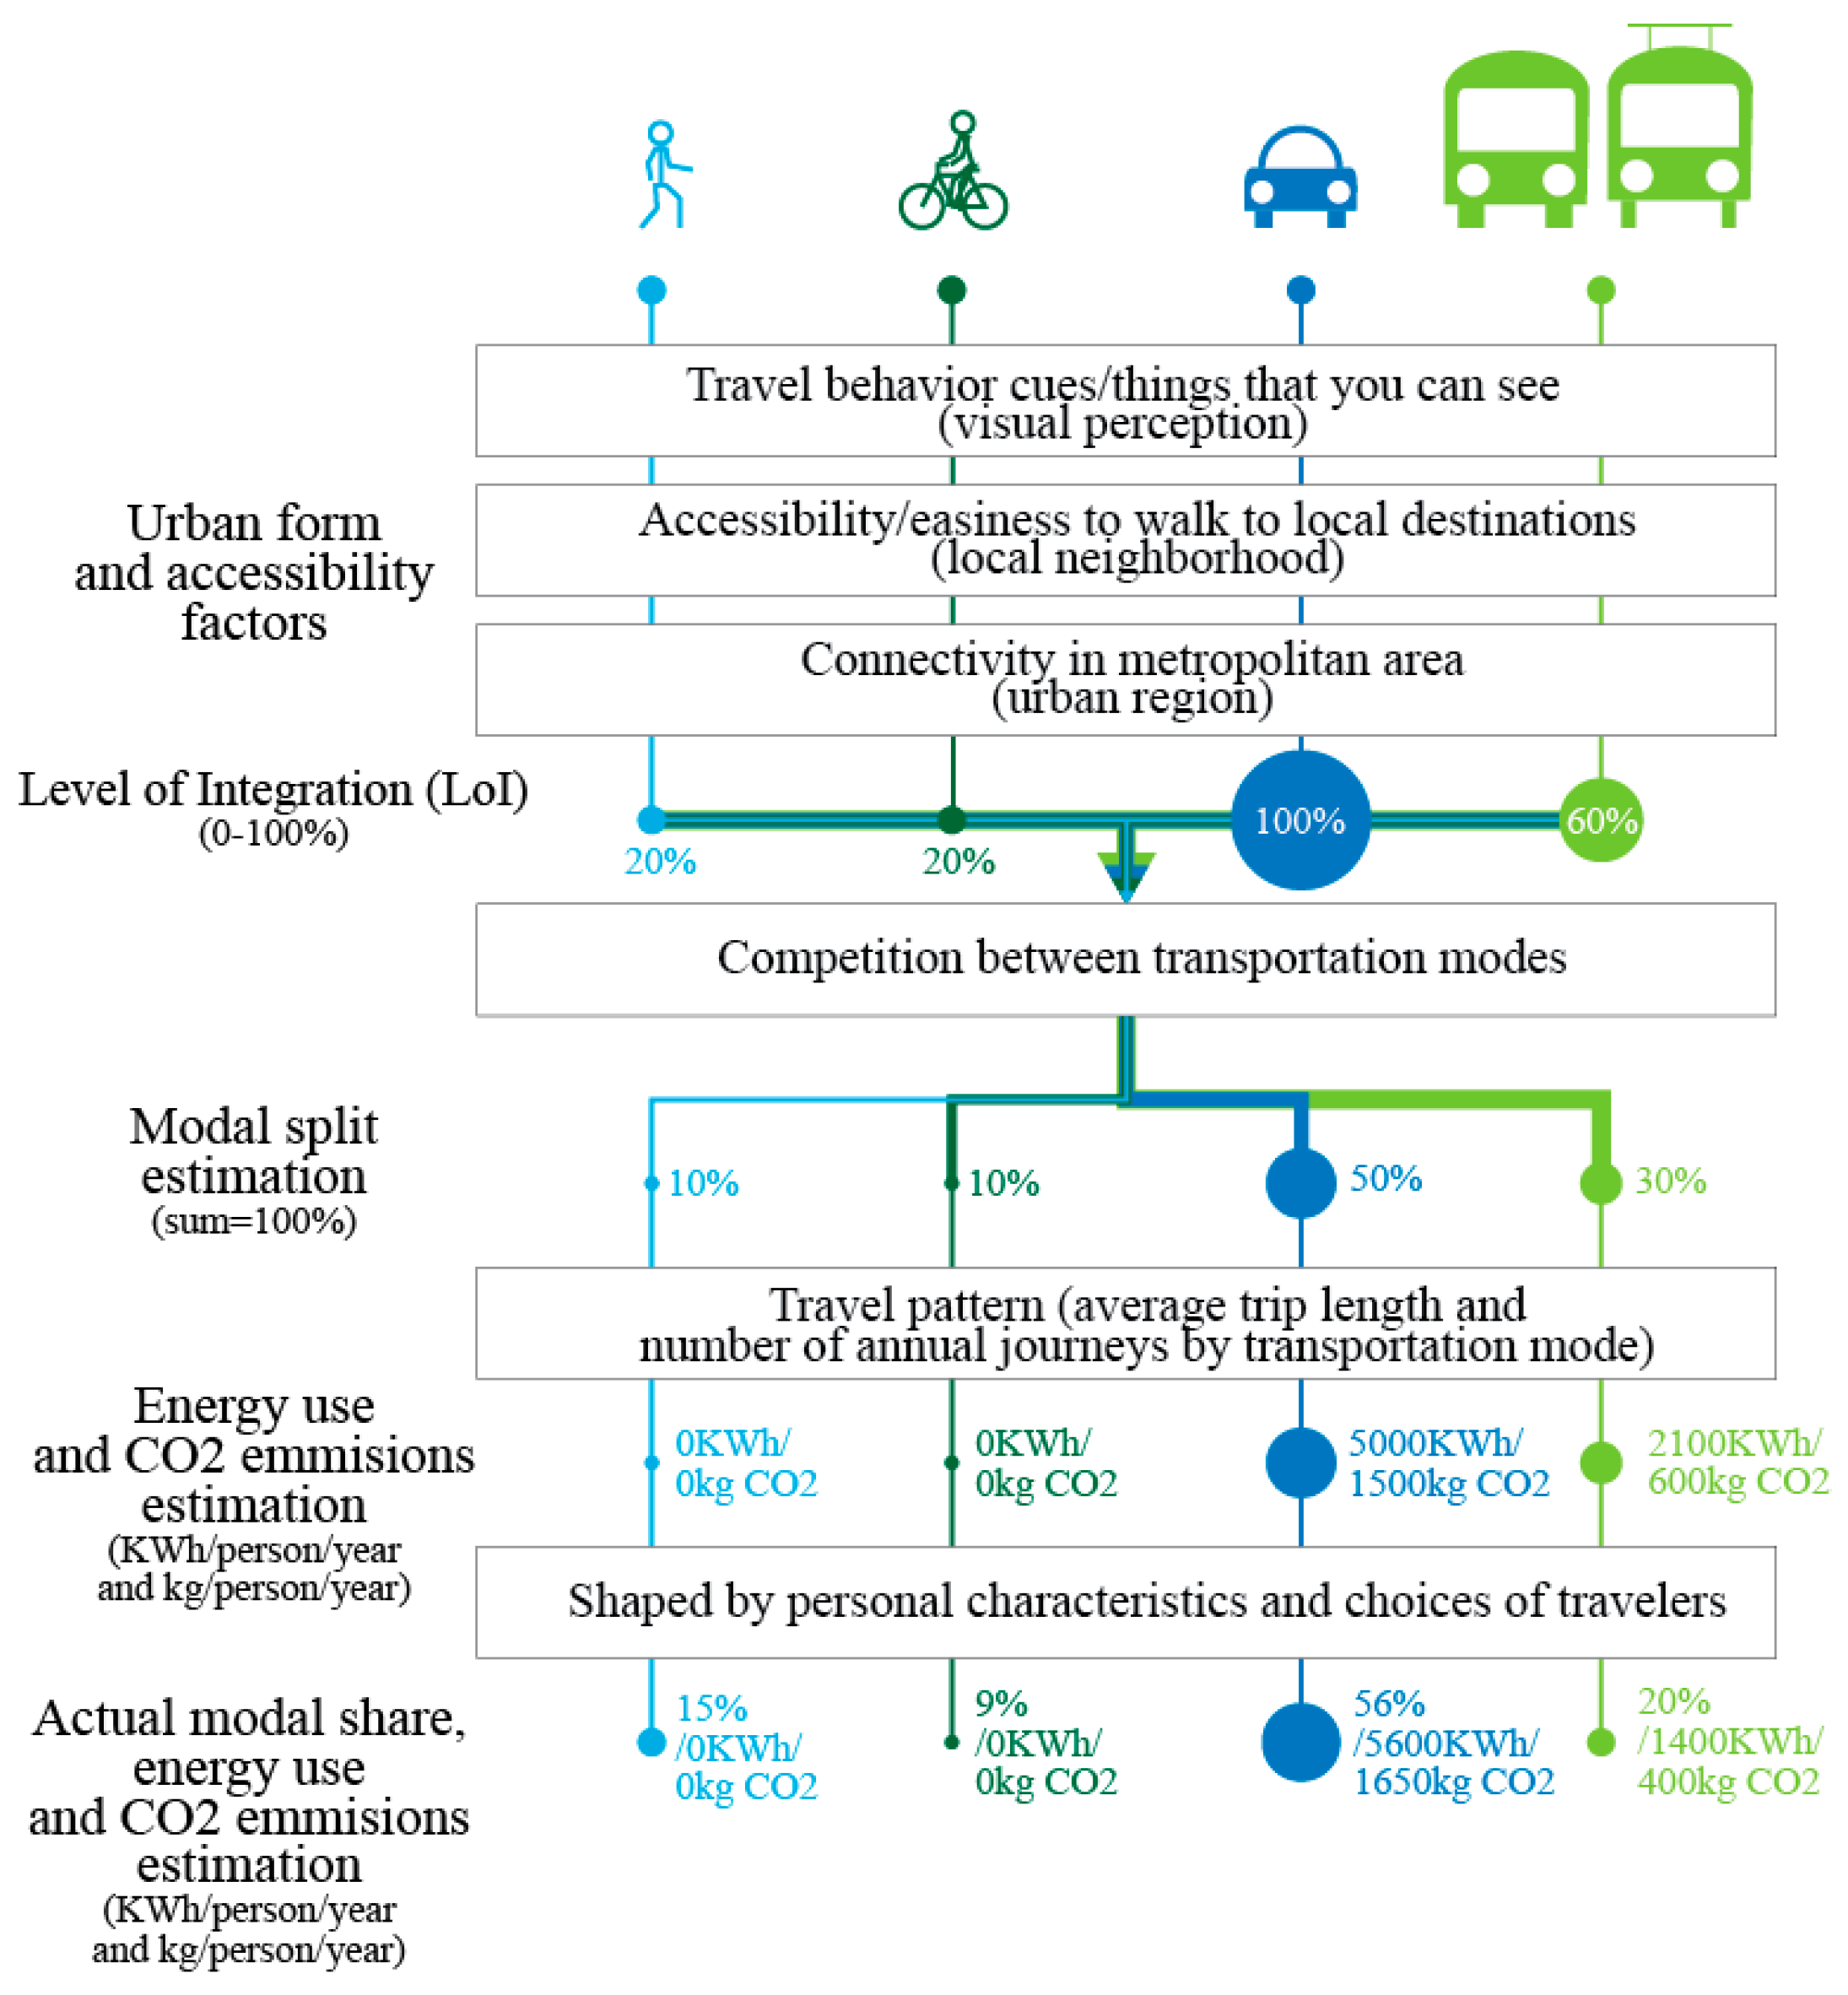
Figure 3 shows the steps in the method of forecasting modal shares, energy use and CO2 emissions. Walking, cycling, private car and public transportation need a set of urban form and accessibility factors that supports travel by these particular transportation modes. Based on the trip generation models (Formula (2) in theoretical framework/background), the model uses composite variable Level of Integration (LoI) that combines and weighs urban form and accessibility factors according to the Formula (1) for composite sustainability indicators. These factors are grouped by the conceptual framework for environmental perception and cognition in Figure 1. The LoIs for the particular transportation modes measure preconditions to travel and they vary in complexity. A private automobile needs parking space at the destination and a quick access to an expressway. These two crucial factors give 100% integration. Walking, cycling and public transportation require a very complex combination of urban form and accessibility factors. The integration with public transportation include more than ten weighed factors (including the factors for walking). Based on the LoIs for the transportation modes (0–100%) as precondition to travel, the modal choices model calculates modal shares proportionally. Better preconditions to travel with particular transportation modes means better integration with the buildings and that would arguably result in higher modal shares for that transportation mode. The modal share estimation would be approximated because travel behaviour depends on personal characteristics but it would reflect preconditions to travel embedded in the urban forms.
Table 1 lists the most important factors (physical elements of urban form and accessibility factors) on a scale of visual perception, local accessibility and regional connectivity that comprise the LoIs for walking, cycling, public transportation and private car. If all factors are fulfilled the LoI is at 100%. That means complete integration with that particular mode. The weighing between factors in the LoIs (Table 1) is done accordingly to the 9-point scale commonly used for Multi-Criteria Evaluation (MCE) in GIS. Since the model uses only the most important factors, only the top four values in the 9-point scale are used: 9 for extremely, 7 for very much, 5 for moderately and 3 for slightly important for integration with that particular transportation mode. The weighing derive from empirical research on the effect of urban form (D-variables) on travel [15,29,30,31,32,33,34,35,36,37,38,39,40,41,42,43,44,45,46,47,48,49,50,51,52,53,54,73,74,75,76,77,78,79] and LEED. The rating procedure in LEED-ND [83] includes a set of weighted urban form and accessibility factors that are related to transportation and location (including factors that concern walkability). The proportion between scales in the weighing is 10–40% for visual perception (visible behavioural cues in street space), 0–40% for local neighbourhood accessibility and 30–40% for regional scale.
Table 2 shows detailed methodology to calculate the values for each factors. The methods for the LOIs originate from the research on walkability and D-variables [29,33,34,36,37,48], Walk Score (http://www.walkscore.com/) methodology for assessing cycling and public transportation and LEED-ND [83] for walkability. Slope is an important factor in Bike Score, whereas the Transit Score is calculated in respect to weekly departures and type of transit service (not only as Distance to transit).
In the first step of the method, the urban form and accessibility factors indicators are surveyed, measures, analysed and geocoded in GIS according to the methods presented in Table 2. The LoIs for the transportation modes are calculated by the sustainability indicator Formula (3):
- LoIm Level of integration (0–100) for transportation mode m
- wUFAi Weights for urban form or accessibility factor I (see Table 1)
- UFAi Urban form or accessibility factor i
In the second step, the competition between the transportation modes is calculated as proportion of the LoI for a specific mode in respect to the sum of the LoIs for all modes. This produces a forecast of modal shares based on LoIs. The formula is:
- Sm Modal share for transportation mode m (in percentage)
- LoIm Level of integration (0–100) for transportation mode m
- LoIN Level of integration (sum for all transportation modes N)
The estimation of modal shares for the particular transportation modes allows to calculate the aggregated number of annual journeys by different transportation modes by multiplying the modal share with 1000. The argument for 1000 annual journeys as mobility constant discussed in Reference [84] is shown in Swedish statistics (Table 3). The formula to calculate the aggregated number of annual journeys is:
- Nm Number of annual journeys for transportation mode m
- Sm Modal share for transportation mode m (in percentage)
Based on the forecast of number of annual journeys, the energy use is calculated by using average travelled distances for a journey with private automobile or public bus from national travel survey in Sweden and energy efficiency estimated by fuel efficiency for Swedish gasoline and diesel mix [85]. Average consumption of fuel is 8 litres of gasoline for a private car (average load of 1.3 persons/journey) and 40 litres of diesel for a public bus (average load of 10 persons/journey). An average journey by a public bus (from Table 3) is 15 km with fuel use of 7 kWh /km, whereas a journey by private car averages 17.9 km and consumes 10 kWh /km.
- Et Energy use from transportation in KWh/person/year
- Nm Number of annual personal journeys by transportation modes m
- lm Average travelled distances for a journey for transportation modes m
- em Energy efficiency (KWh/km) for transportation mode m
The CO2 emissions are calculated by using average values for Swedish gasoline (2.75 kg/L) and diesel mix (2.78 kg/L) for average travelled distance:
- CEt CO2 emissions from transportation in t CO2/person/year
- Nm Number of annual personal journeys by transportation modes m
- lm Average travelled distances for a journey for transportation modes m
- cm CO2 efficiency (kg/km) for transportation mode m
The concept of LoI aims to group different urban form and accessibility factors that will influence individual behaviour. The mobility choices model takes a perspective of a rational agent. It looks at the competition of the modes without considering travel preferences (illustrated as mobility classes on Figure 2). To show the perspectives of how different individuals would interpret mobility choices as urban form affordances, Mobility Class Score analyses the most radical cases of mobility classes. The Mobility Class Score illustrates how would a radical flâneur, cycling advocate, bus enthusiast or train spotter, green traveller, rational agent and dedicated motorist would perceive the neighbourhood as a set of mobility choices from 0 (worst) to 100 (best). Based on the estimations of the LoIs in Formula (5) that show integration with different transportation modes overall Mobility Class Score (for a specific mobility class) is calculated as:
- MCSmc Mobility Class Score for a mobility class c
- LoIm Level of integration for transportation modes m
- wMCSm Weight for specific transportation mode m for mobility class c
The weight for specific transportation mode m for mobility class c are estimated arbitrary but by taking a role of a radical flâneur, cycling advocate, bus enthusiast or train spotter. A radical flâneur would be terrified of motorists and would be wary of passing cyclists. The dedicated motorists would not like to drive in urban environments crowded with pedestrian and cyclists. To calculate the weights, each typical mobility class receives a weight based on 9-point scale: 1) like extremely (9); 2) like very much (7); 3) like moderately (5); 4) like slightly (3); 5) neither like nor dislike (1); 6) dislike slightly (1/3); 7) dislike moderately (1/5); 8) dislike very much (1/7); and 9) dislike extremely (1/9). The weight factor is calculated when the weights for different factors are summed for each row and divided with the weight of the transportation mode. The sum for flâneurs is 9.778 = 9 + 1/3 + 1/3 + 1/9 and the weight 0.92 = 9/9.778. Table 4 shows weights for the typical mobility classes. When a flâneur looks for affordances in the urban form, the predominant focus would be on factors that support walkability (such as commercial storefronts, small city blocks with many pedestrian crossings, etc.) and not on availability of cycling infrastructures, parking places, etc.
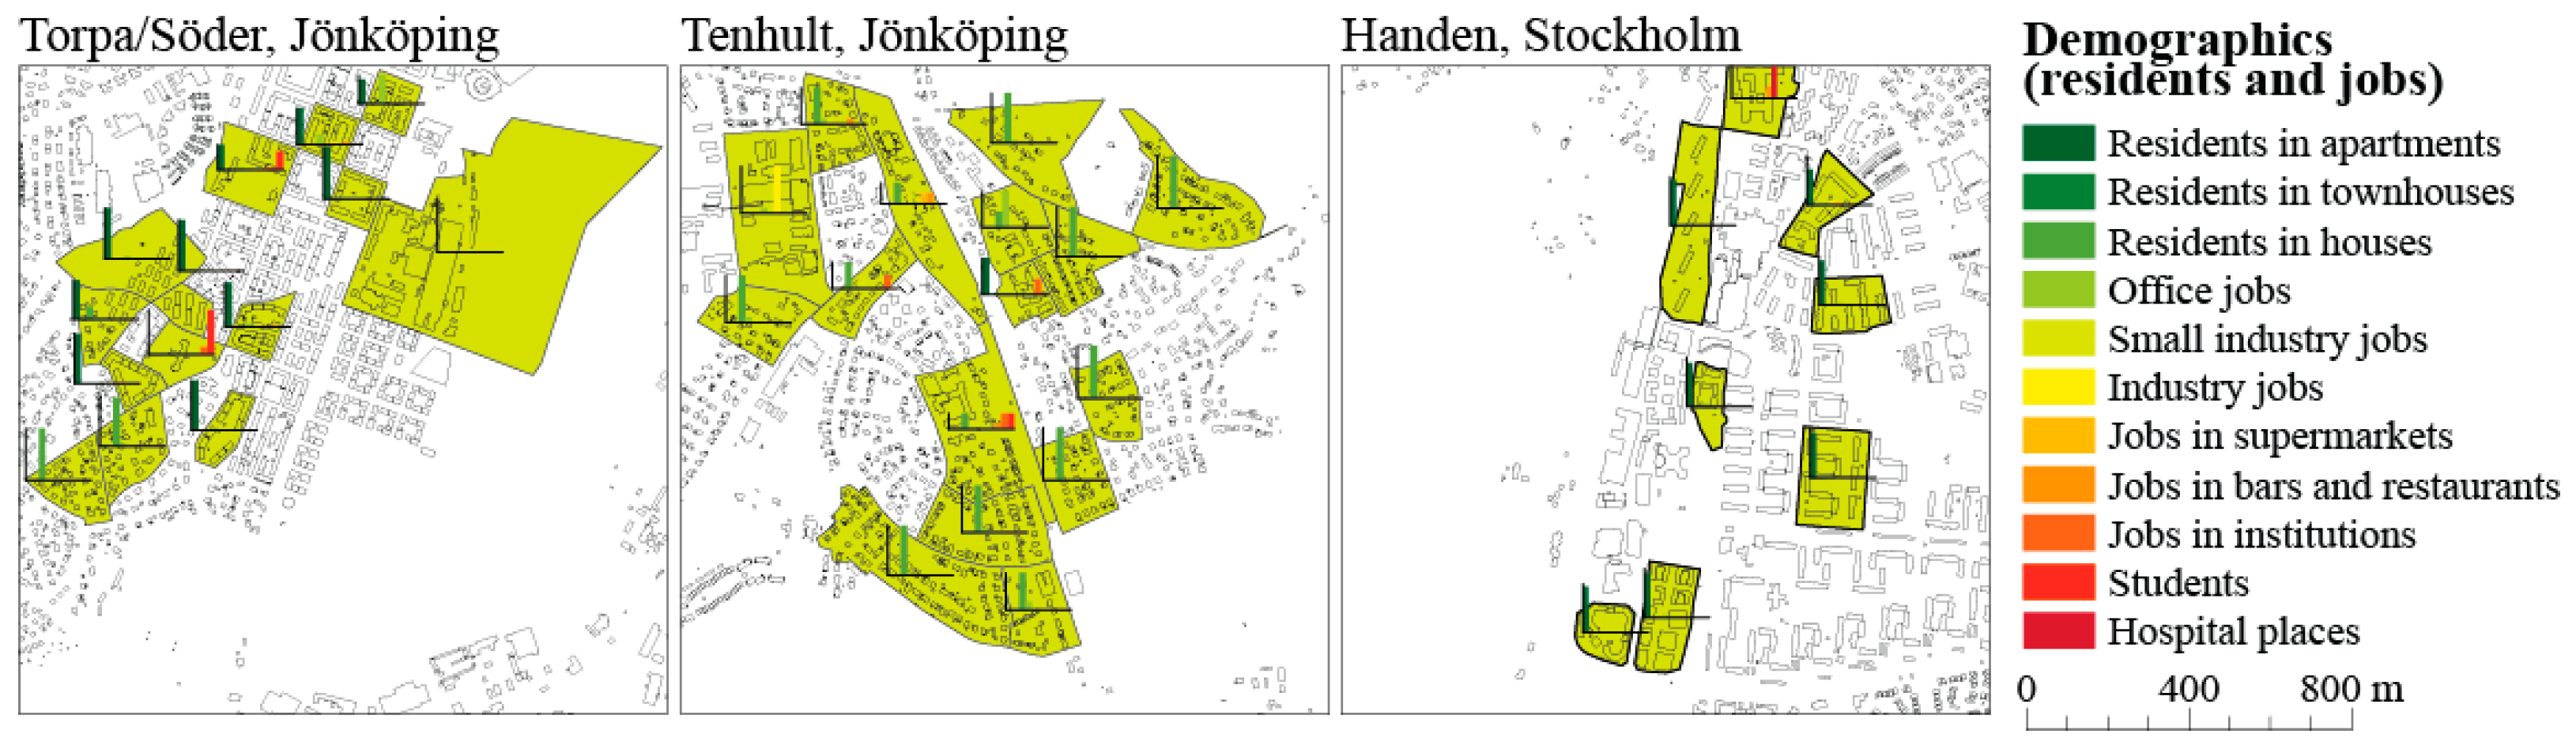
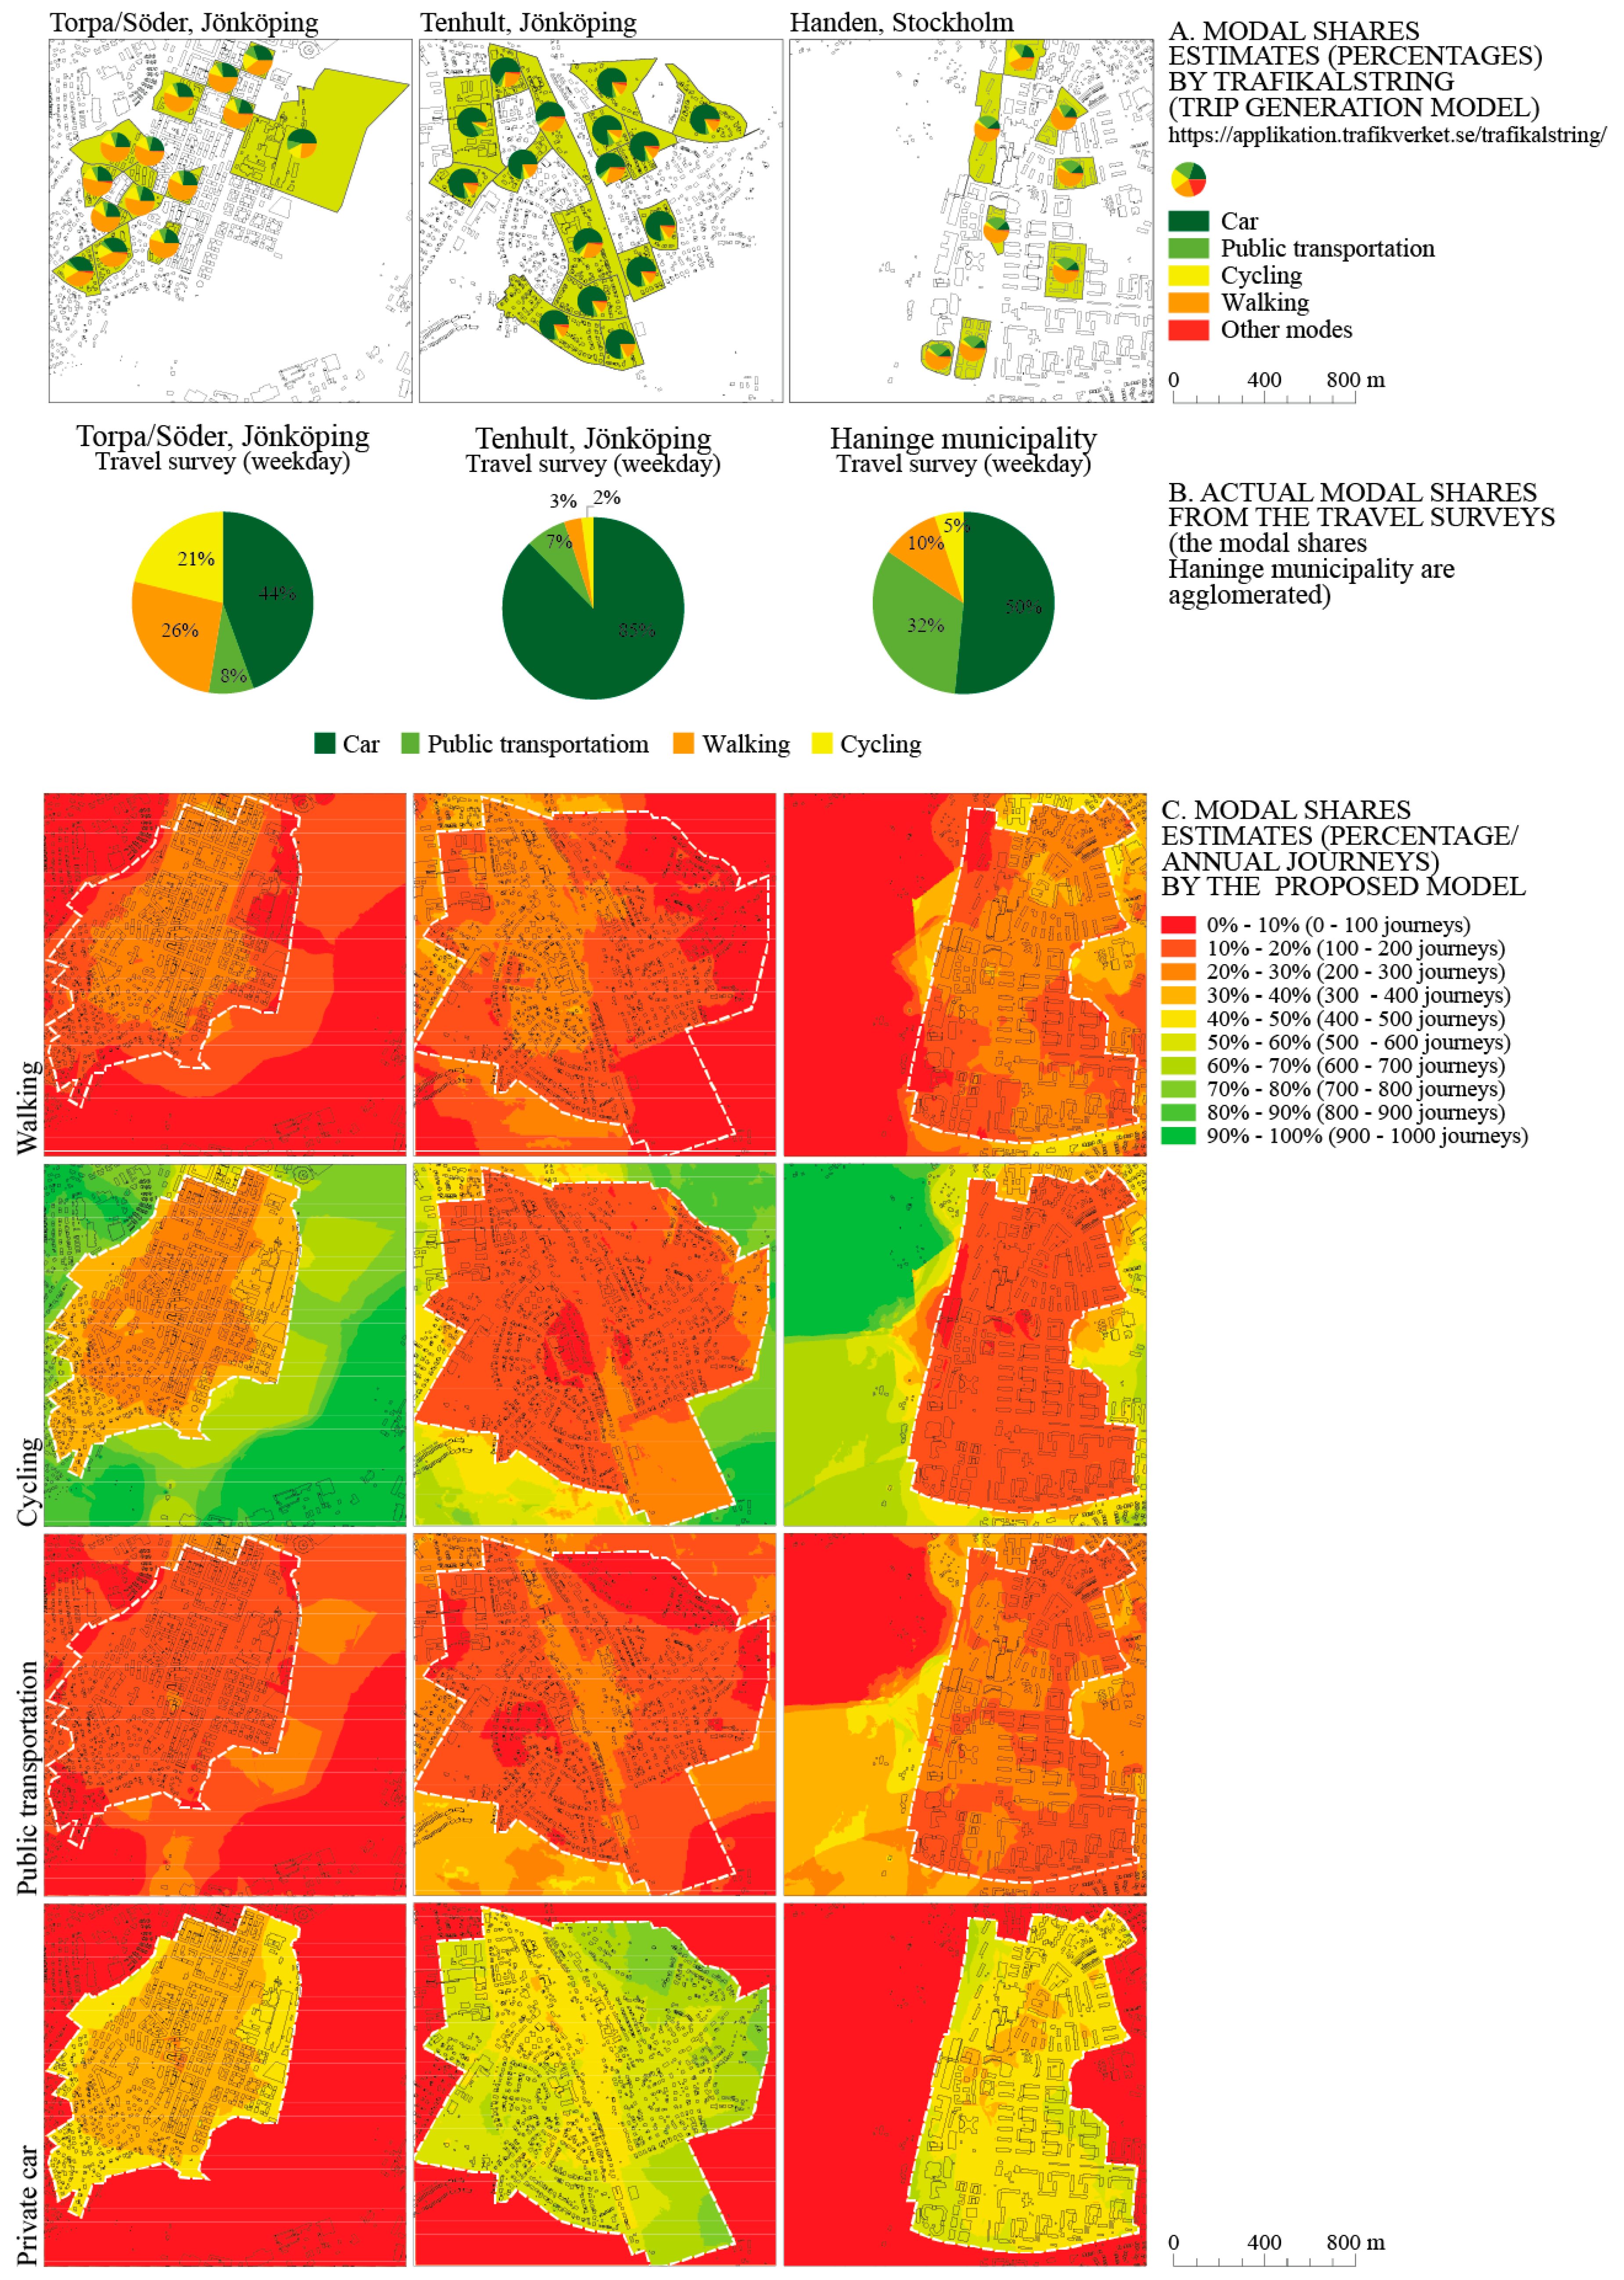
Additionally the modal share estimations of the model are compared with actual modal shares from municipal travel surveys [86,87] and estimations from the online travel forecasting model Trafikalstring by Trafikverket, Swedish Transportation Administration (see https://applikation.trafikverket.se/trafikalstring/). Trafikalstring is an online tool developed by the Swedish consultancy company Trivector. It estimates trip generation rates (number of journeys generated daily in the neighbourhood and modal shares) by considering types of residences and jobs and factors such as accessibility by walking, cycling, public transportation and private car. The modal splits are calculated by manual input of the demographic profiles, land use and local and regional accessibility factors in the web application. The demographic profile derives from actual statistics and includes variations of 100 residences or jobs representative for that specific city blocks. The results are encoded and visualized in GIS. Pie chart diagrams show the modal split (as preferred by Swedish Transportation Administration). Figure 4 shows bar charts for types of residents and jobs used as input in the web application.
The following chapter tests the mobility choices model in three neighbourhoods in Jönköping and Stockholm and presents the results.
4. Testing the Mobility Choices Model Jönköping and Stockholm
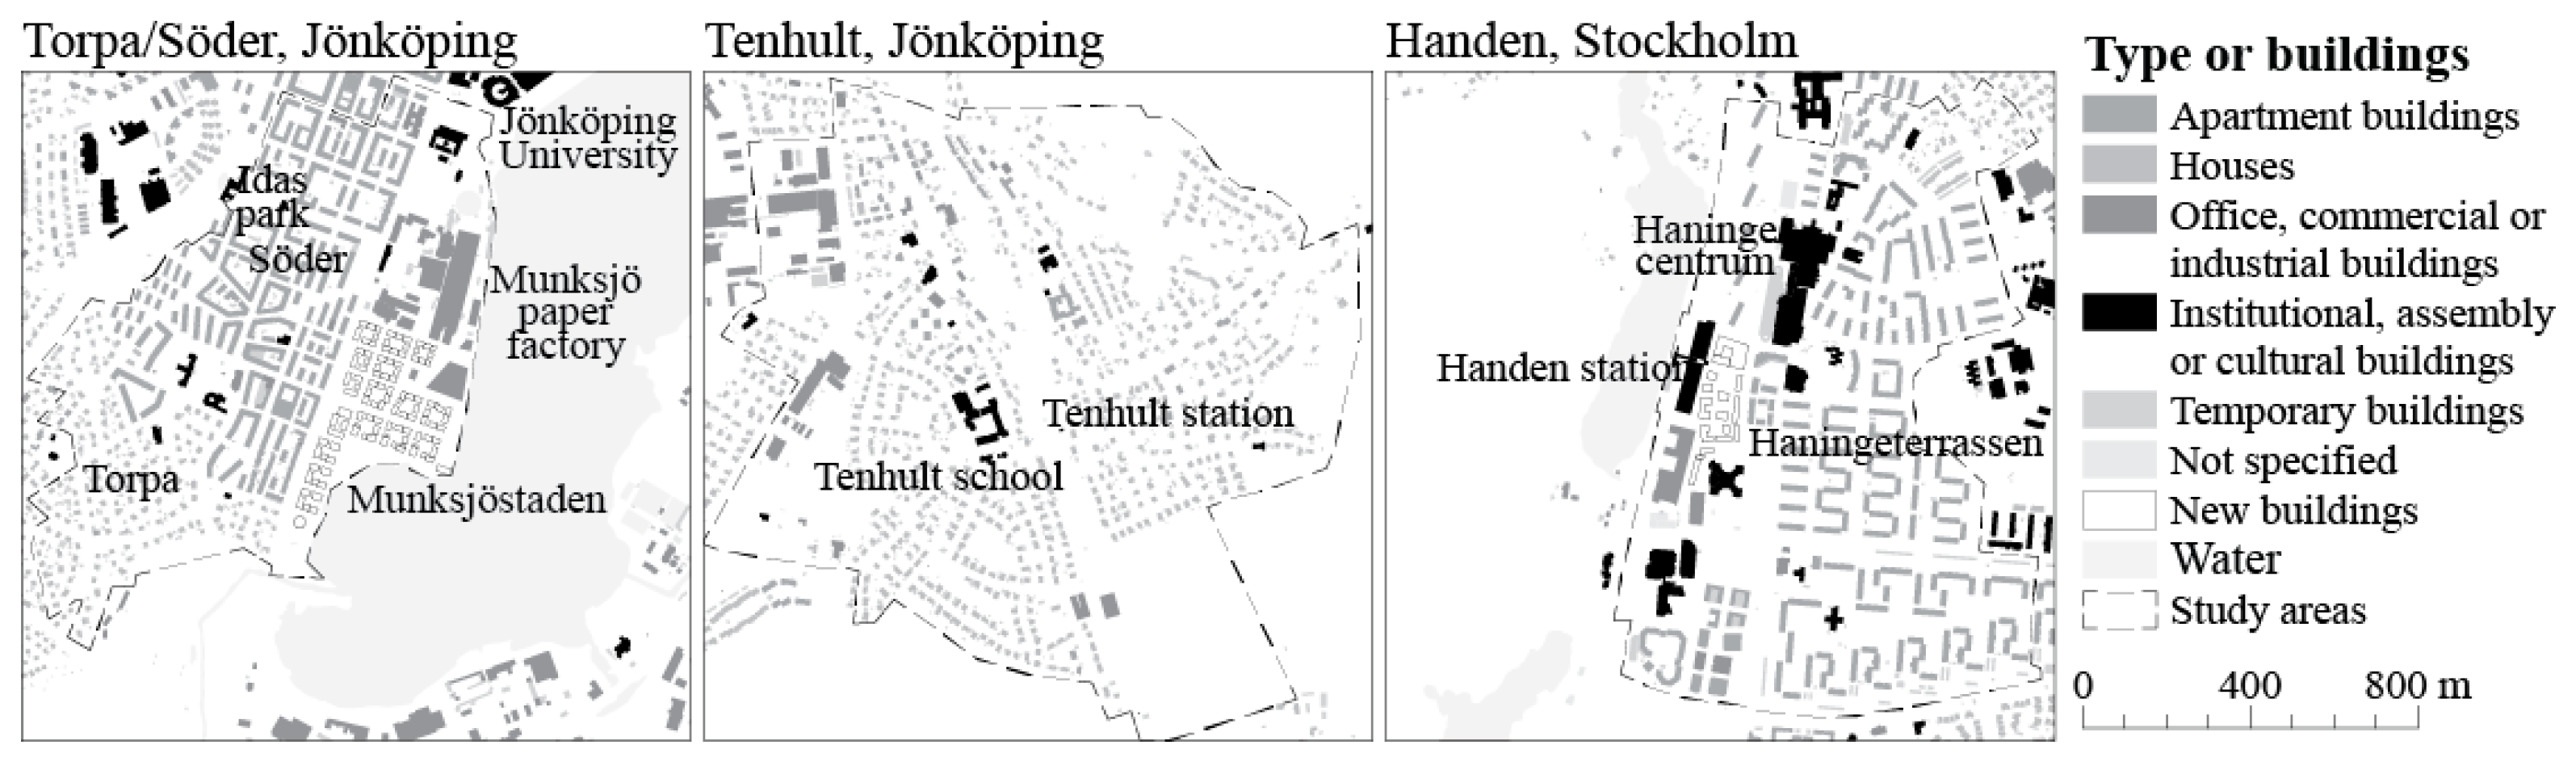
Three neighbourhoods in Haninge, Stockholm and Jönköping, are selected to test the mobility choices model (Figure 5). Haninge, a municipality with roughly 90,000 inhabitants, is a southern suburb of Stockholm, the capital and largest city in Sweden with approximately 2.2 million people living in its metropolitan area. Jönköping is a middle-sized city in southern Sweden with more than 130,000 inhabitants living in the municipality and 350,000 in the region. Torpa/Söder is part of the southern part of the downtown of Jönköping. Jönköping Söder has a typical downtown of a middle-sized Swedish city with shops and services, parks (Idas park) and squares (Torpaplan). Jönköping University is nearby too. Torpa is a predominantly residential neighbourhood adjacent to Jönköping Söder. Munksjöstaden is a new development project, a sustainable city extension of the southern downtown. Tenhult is a residential suburb roughly 15 km from the downtown of Jönköping. It is a development around a central railway station with suburban trains to Jönköping. The neighbourhood centre that consists of supermarkets, several churches and shops is located on the periphery of the neighbourhood but close to the regional road. Haninge is a typical suburban neighbourhood development project from the 1960–70s with local shopping mall (Haninge Centrum, subsequently upgraded under 1980s) and additional commercial and institutional buildings (library, municipality headquarters, etc.) around commuter rail station. The suburban neighbourhood centre is surrounded by residential multifamily apartment buildings. Haningeterrassen is an infill project close to Handen station (commuter rail) similar as Munksjöstaden.
5. Results of the Analysis
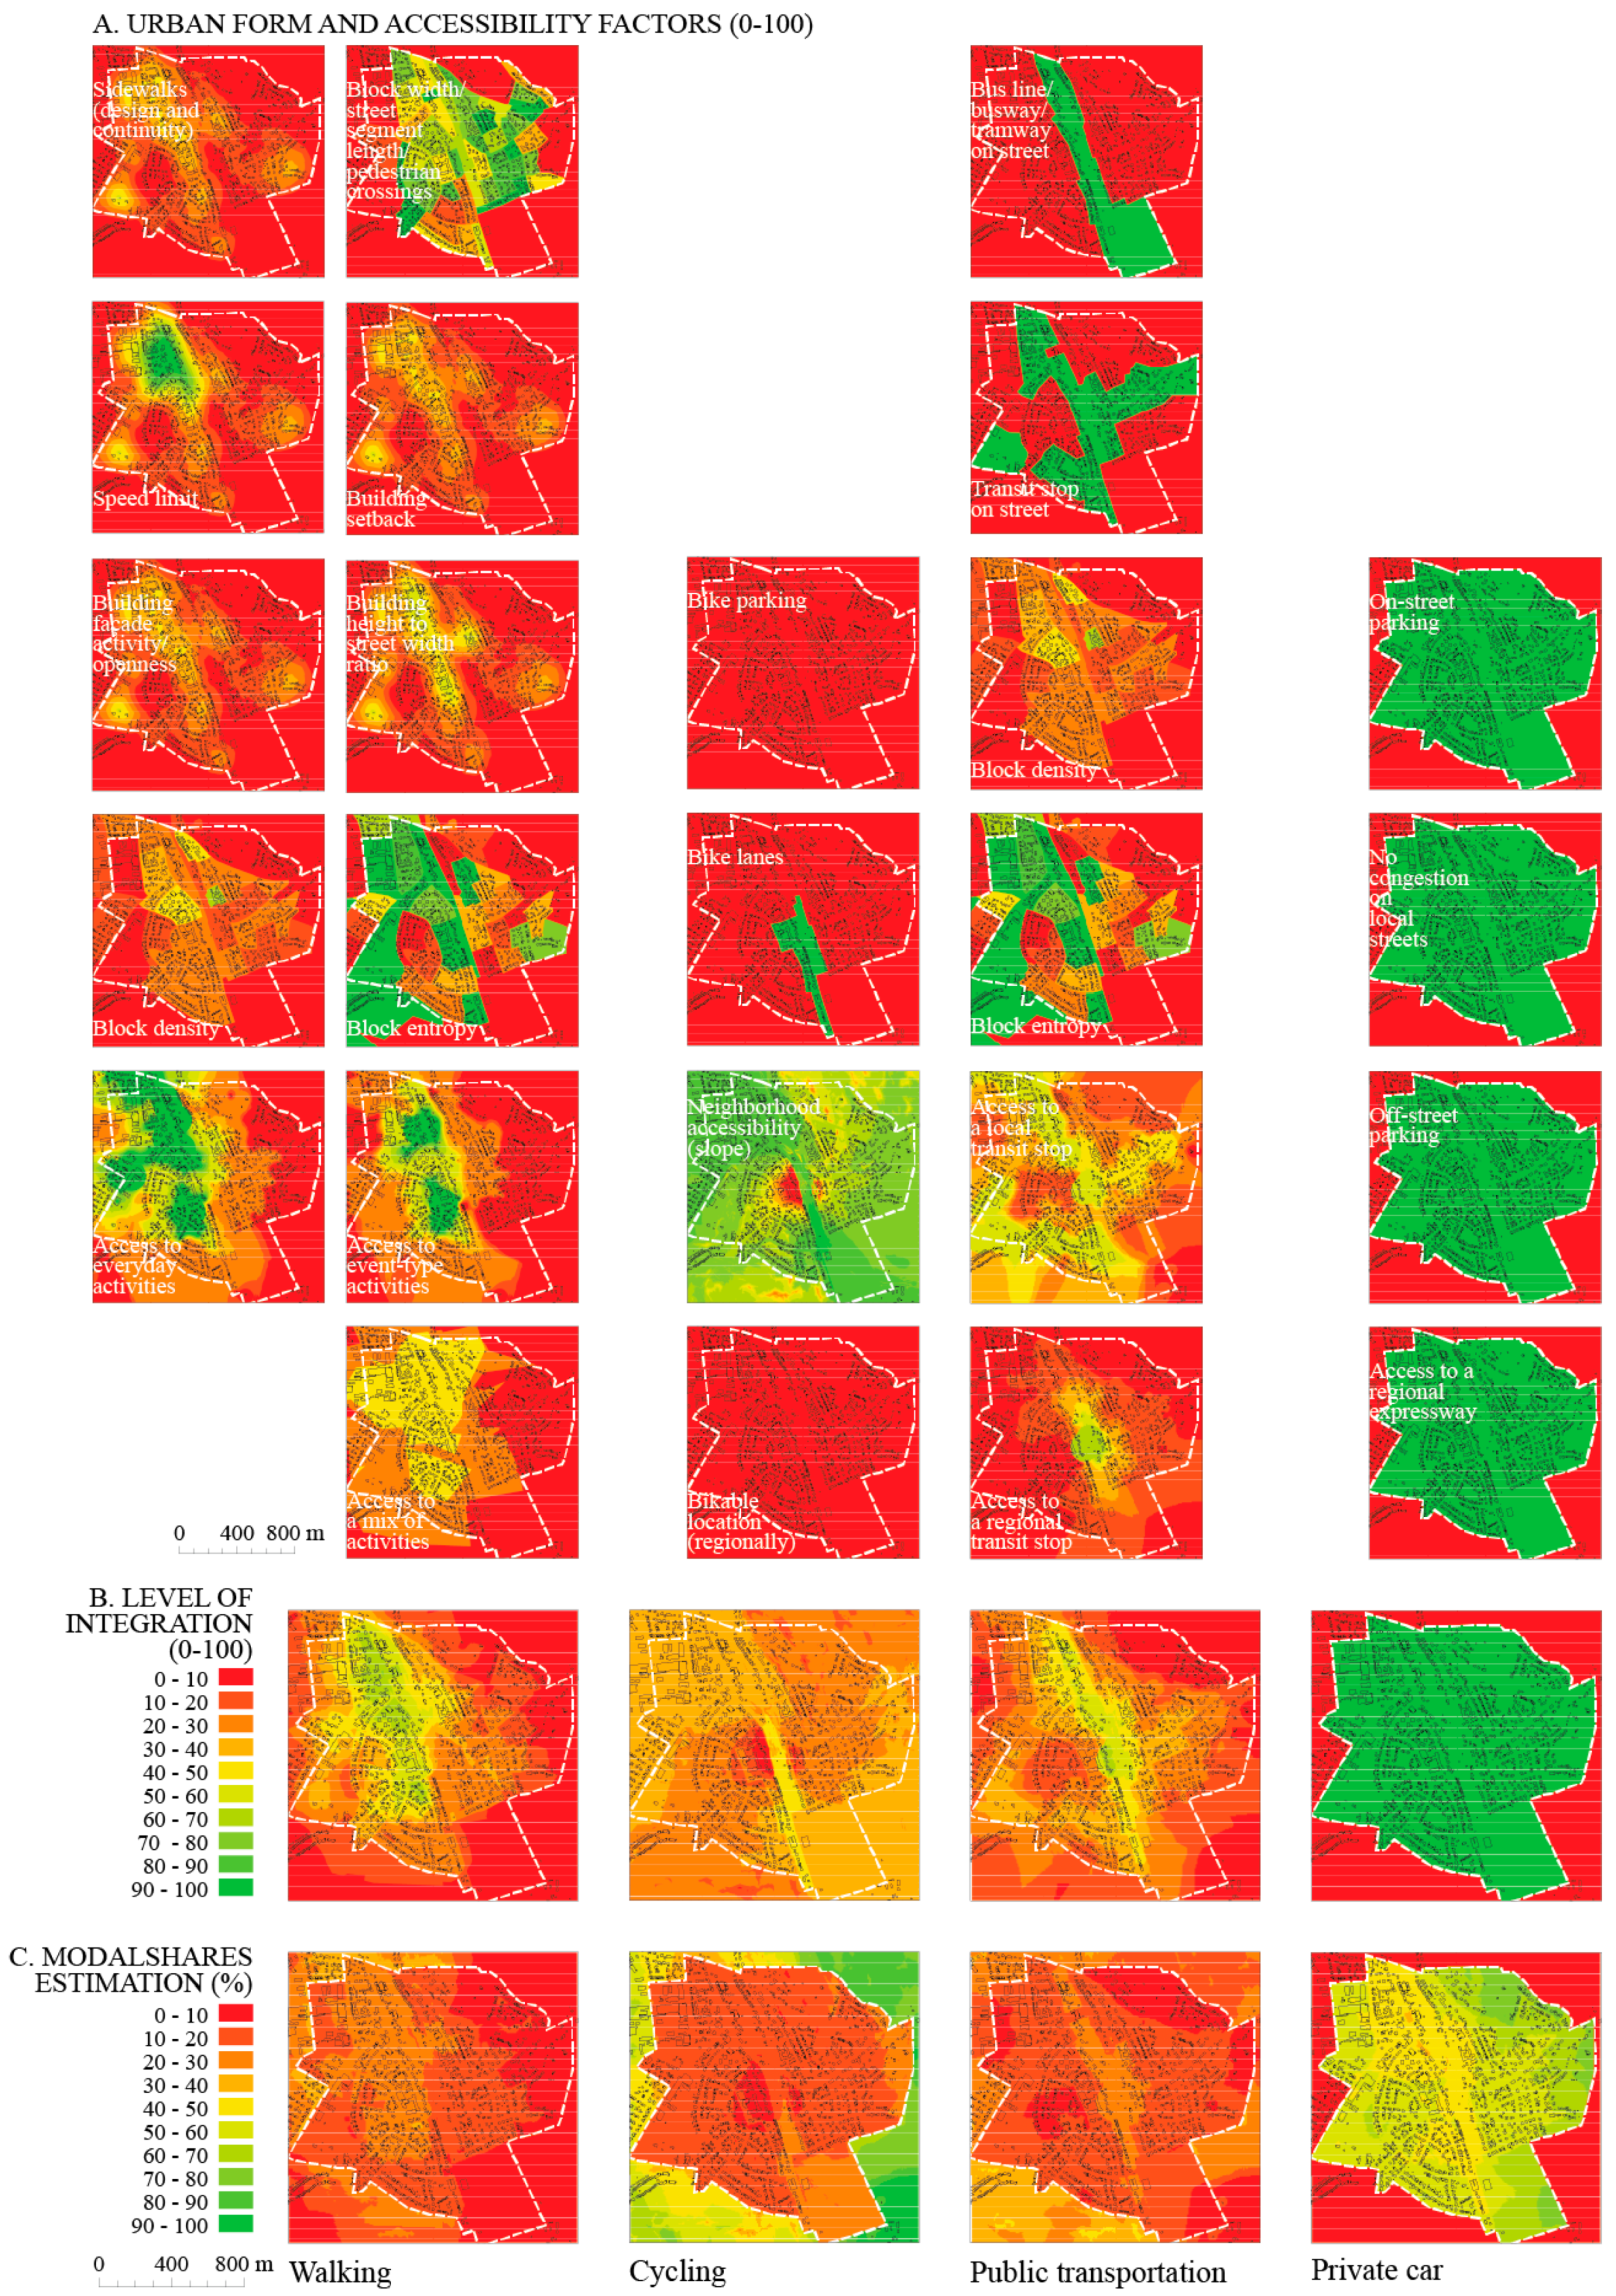
Figure 6 illustrates modal share estimates by online travel forecasting model (Figure 6A), actual modal shares collected by travel surveys (Figure 6B) and forecasts by the mobility choices model (Figure 6C). The Appendix includes detailed results for the specific urban form and accessibility factors, heat maps of the LoIs and resulting modal shares (Figure A1, Figure A2 and Figure A3).
Trafikalstring calculates the modal shares for places (zones) based on the number and type of residents, jobs and so forth within the zone (Figure 4) and uses pie charts to represent modal shares for different parts of the neighbourhoods (Figure 6A). The mobility choices models use heat maps to show modal shares distributed around the neighbourhood (Figure 6C). Green means better and red worse on the heat maps. This allows identifying parts of the neighbourhoods (red spots) with poor integration with walking, cycling and public transportation.
The comparison with the actual modal shares of the travel survey (Figure 6B) shows that the results of the modal split estimation by the mobility choices model (Figure 6C) is within some reasonable margin of error (similar to Trafikalstring). These errors are common for this kind of travel forecasting models based on urban form and accessibility factors. The mobility choices model underestimates automobile share in Tenhult and walking in Torpa/Söder. The resultant maps of the LoIs in the Appendix illustrate green hot spots for walking and public transportation. The mobility choices model also identifies steep slopes and terrain depressions where it is difficult to bike. It shows that drivers will not have any problems in the studied neighbourhoods due to abundant parking and access to regional roads and expressways. The maps of the LoIs also highlights the bus corridors and regional transit nodes in Tenhult and Hanninge that are highly integrated with public transportation.
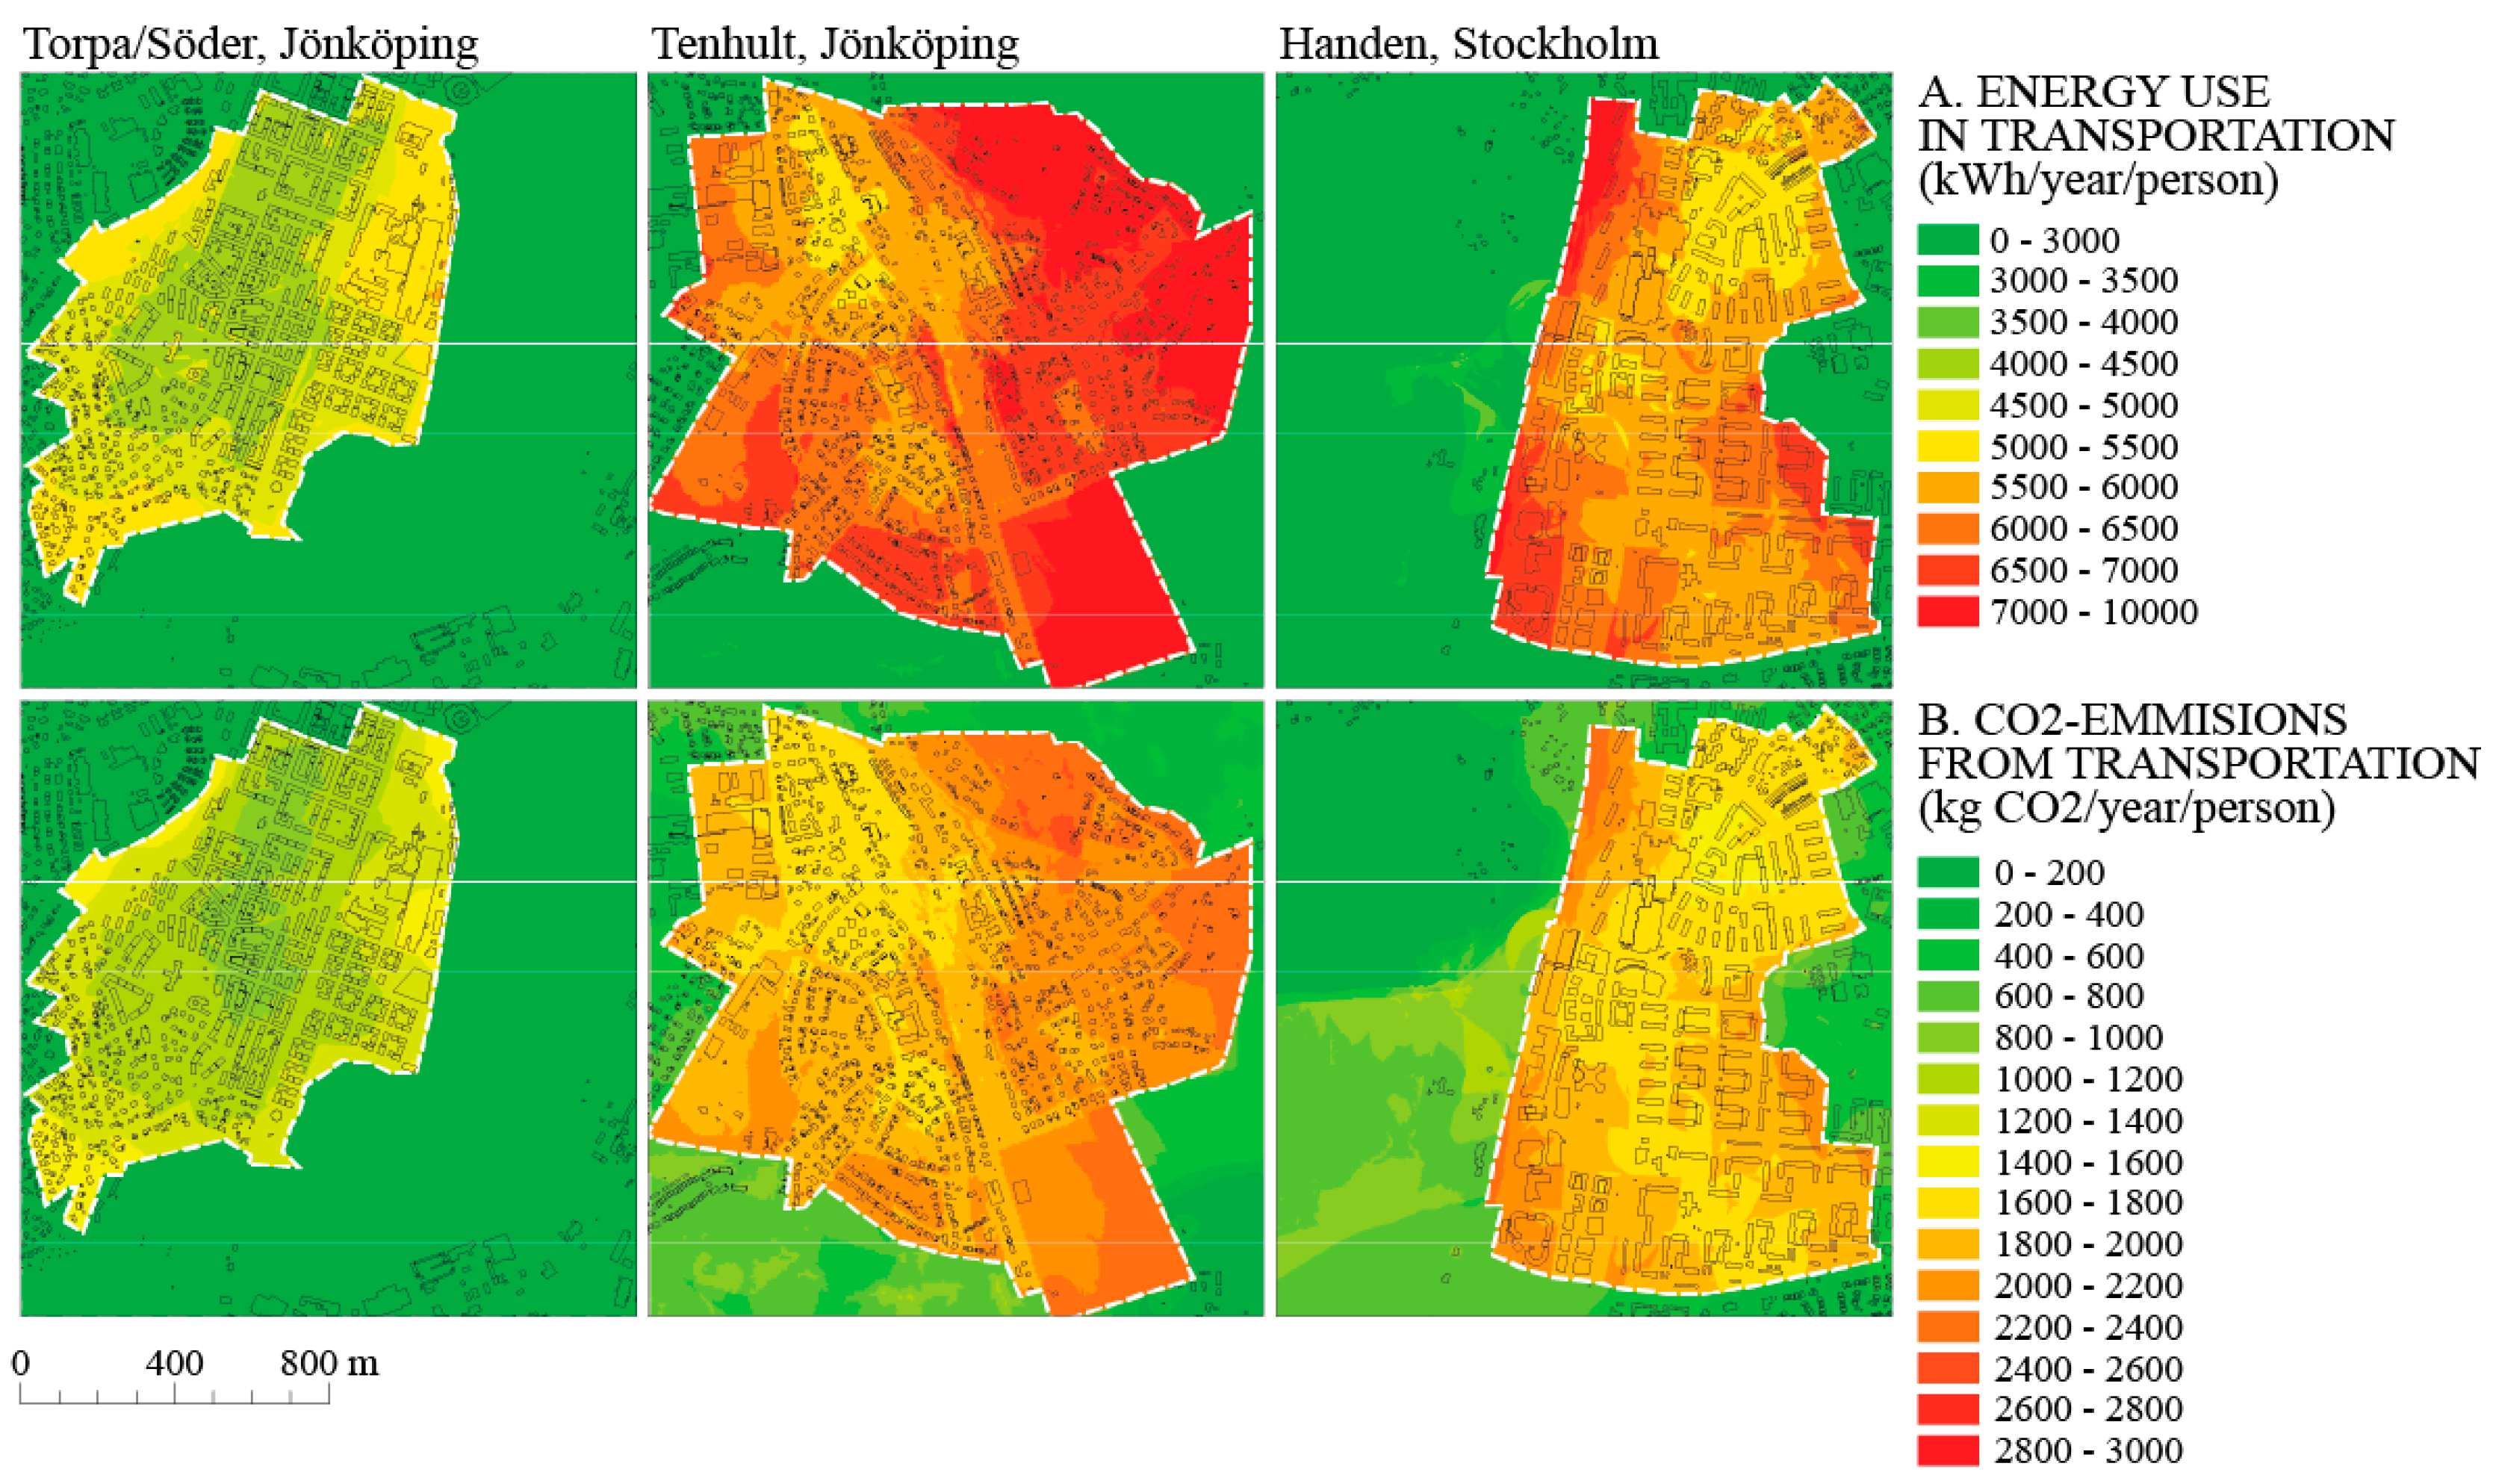
Figure 7 shows the energy use and CO2 estimation based on the modal shares of public transportation and private car, annual number of journeys and average travelled distances for journeys by public transportation and private car. Annual number of journeys is used because it balances for periodical variation in travel. The travel patterns vary seasonally (individuals make less journeys during holidays in summer than in spring or autumn). The metrics of kWh/year/person (Figure 7A) links the transportation energy estimation of the mobility choices model with EPCs. EPC is a European measure of energy performance of buildings based on annual energy use in kWh per square meters of floor space (kWh/m2/year). EPCs for apartment buildings in Sweden have an average energy performance of around 100–120 kWh/m2/year. The average floor space per person in Sweden is roughly 50 square meters. That would result in a yearly use of 5000–6000 kWh/year/person. This makes possible to compare energy efficiency and CO2 emissions used in buildings and for transportation.
Figure 7A shows that the estimated energy use varies between 3000 and 4000 kWh/year/person in Torpa/Söder that is part of the downtown in Jönköping (between 50% and 75% of the energy used in building). The downtown areas located along the main street Jönköping Söder have the lowest energy use with 3000 kWh/year/person are, whereas the transportation energy use in the houses of Torpa that surround the downtown increase to 5000 kWh/year/person. In Tenhult and Handen the energy use starts from 5000 kWh/year/person around the commercial strips and the shopping mall but it quickly increases towards the edges. Large parts of these neighbourhoods have estimated energy use of over 7000 kWh/year/person (that is higher than the average energy used in buildings). The Handen rail station (potentially) decreases energy use by 1000–2000 kWh/year/person by possibilities to shift to more energy effective public transportation. The heat maps for CO2 emissions (Figure 7B) show that the buildings on the edges of Tenhult and Handen emit 2–2.5 t CO2/year/person that is higher than the average CO2 emissions from transportation (1.7 t/year/person). The houses in Torpa/Söder produce 1–1.2 CO2/year/person, whereas the enclosed city blocks along the bus corridors in the downtown further decrease the carbon emissions to 0.6–0.8 CO2/year/person.
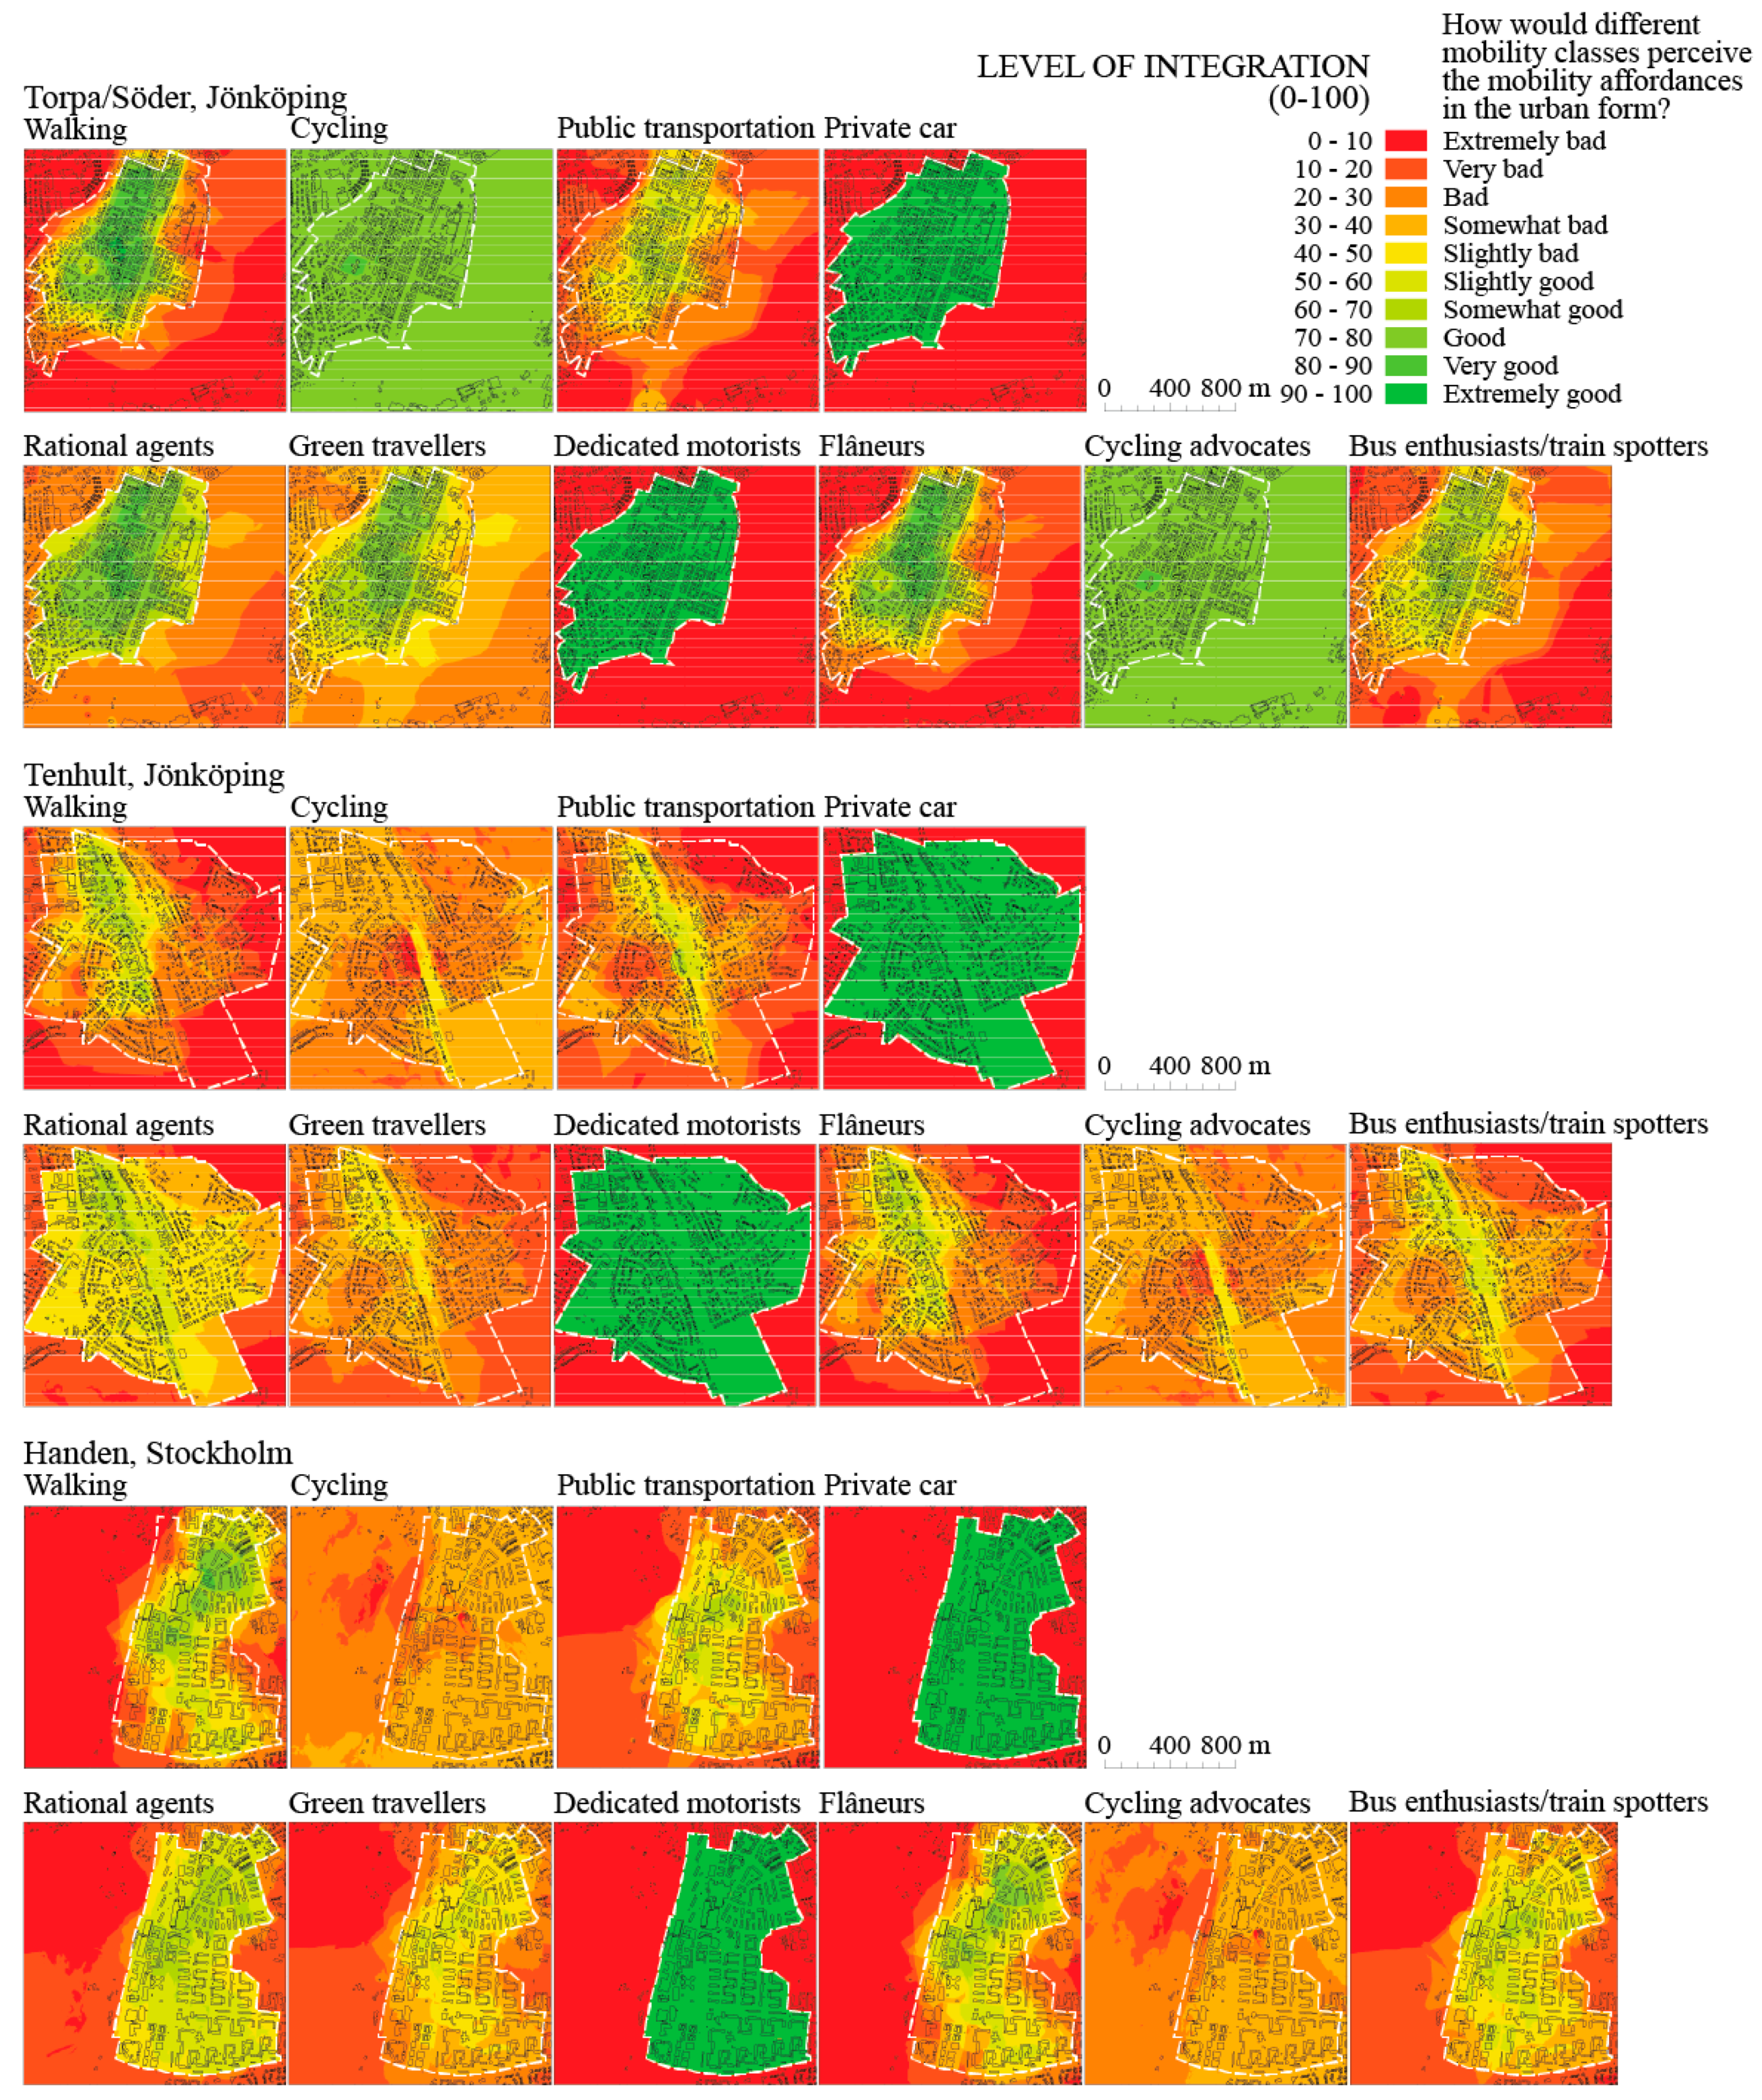
Figure 8 shows how individuals would perceive the mobility choices in the neighbourhoods from a perspective of flâneurs, cycling advocates, bus enthusiasts and train spotters, green travellers, rational agents and dedicated motorists. The results show that a cycling advocate would not like Tenhult or Handen but will choose to live in Torpa/Söder. Torpa/Söder would appeal to all mobility classes, whereas only dedicated motorists would be happy in Tenhult. The public transportation service produce some green hot spots around train stations and bus corridors that would be favoured by bus enthusiasts or train spotters.
The following section discusses the results and possible applications of the mobility choices model in informing urban planning and design practices and transforming cities to achieve more sustainable transportation.
6. Discussion
The mobility choices model links environmental goals (carbon emissions from transportation measured in t CO2/year/person) with urban form and accessibility factors commonly used in urban planning and design practices (density, building heights, building setbacks, street widths, parking standards, distance to transit, access to different services, etc.). It visualizes integration with transportation modes, modal shares, energy use and carbon emissions from transportation as heat maps to bring a concise information about environmental performance of transportation systems to urban planners and designers, municipal officials and developers. The research into carbon performance and sustainable transportation lacks specific measurements and tools [1,6,7]. Many Swedish municipalities have ambitious environmental goals and carbon management initiatives towards low or zero-carbon urban futures [6,13,14]. The estimates for CO2 emissions are crucial in the environmental and transportation policy of municipalities in Sweden and Nordic countries [12,13,14]. The model introduces additionally a measure for transportation energy use (kWh/year/person) conversable with the measure for annual energy consumption with EPC for buildings (measured in kWh/m2/year). The standard for an average person living in Sweden is 50 square meters (with average energy performance of around 100–120 kWh/m2/year it would result in a yearly use of 5000–6000 kWh/year/person). This allows for comparing energy and environmental performance of the building and transportation to and from the building.
The mobility choices model produces reasonable results considering the limitations of travel forecasting based on urban form and accessibility factors. The forecasted modal shares correspond to the actual modal shares in Jönköping and Haninge with a variation of 10%. The error goes to 20% for walking in the downtown or driving automobile in the suburbs but this can be explained by strong mobility cultures of walking in downtowns and driving in suburbs. Travel behaviour directly depends on personal characteristics such as economic rationality, personality traits, irrational commitment to specific modes and so forth (Figure 1) that become mobility cultures in struggle (Figure 4). In reality, the actual modal shares are product of market segmentation [80,81] and by how different mobility classes would perceive the travel affordances in the urban form (Figure 8). The presence of flâneurs, cycling advocates, bus enthusiasts and train spotters and dedicated motorists in the neighbourhoods would skew the modal share towards the preferred transportation modes despite the environmental preconditions to travel. Torpa/Söder would attract pedestrians and cyclists. Tenhult would be inhabited with dedicated motorists. The mobility cultures would affect the actual modal shares.
The mobility choices model illustrates problematic red spots (shown in the heat maps of the LoI, Figure A1, Figure A2 and Figure A3 in the Appendix) and can be used to identify parts of neighbourhoods that lack mobility choices. This can contribute to increased awareness among architects, urban planners and designers, municipality officials and developers to improve the integration with walking, cycling and public transportation. Neighbourhoods that were designed for the automobile with abundance of parking standards and road hierarchies, hinder the modal shift towards more sustainable mobility. These problems are not always visible, especially to motorists. Figure 8 shows that all the neighbourhoods have 100% integration with the private automobile and the motorists will see no problems in these urban forms. By revealing information about integration with different transportation modes, the mobility choices model provides concise visual information that has a potential to trigger a virtuous cycle of transforming these neighbourhoods to better integrate walking, cycling and public transportation. The good integration of the city with walking, cycling and public transportation can decrease the need for parking and driving around cities. The methodology for parking standards is arbitrary [88]. By linking urban form, mobility choices and environmental performance of buildings in terms of energy use and CO2 emissions from transportation, it is possible to negotiate parking standards and discuss trade-offs. Higher integration with walking, cycling and public transportation would allow for lower parking standards and would give more space for sustainable travel alternatives in cities. This can reflect in removal of parking spaces, creating more walkable streets, orientation of buildings towards transit stops and constructing new cycling infrastructures. In a vicious circle for the automobile, less parking would produce more walking, cycling and transit use, contribute to modal shift towards environmentally friendly mobilities and decrease in carbon emissions.
The first limitation of the mobility choices model is complexity. The methodology builds upon theories of environmental perception and sustainability assessments (composite indicators and certification systems). The embedded affordances in urban forms presented as sustainable mobility indicators in the mobility choices model create complex measures for integration of the urban form with walking, cycling, public transportation and private car (Table 1). The sustainable mobility indicators and weights assigned in Table 1 and Table 2 are somewhat subjective and arbitrary. Therefore, level of integration calculation in Equation (4) and the modal shares estimation in Equation (5) are also arbitrary. The mobility choices model can be useful despite the limitation of complexity and approximations, since it aims to provide two types of information. It informs directly about sustainable mobility in a very concise form (modal shares, transportation energy use in kWh/year/person and carbon emission in t CO2/year/person) but it also shows the complex composition of urban form and accessibility factors as background for the modal shares forecasts. The heat maps for different urban form and accessibility factors are presented on Figure A1, Figure A2 and Figure A3 in the Appendix. This complex information has to reach urban planners and designers, municipal officials and developers. Some transportation modes such as the private automobile are easily integrated with parking spaces, whereas walking, cycling and public transportation are very demanding in terms of urban form factors (density, walkable streets, flat terrain, visual proximity to transit stops, transit stops with frequent service, etc.).
The second problem is transferability and applicability. The mobility choices model and the complex set of sustainable mobility indicators should not be understood as a final product but a framework to communicate knowledge about the complex link between urban form and transportation systems among actors and stakeholders in the urban development processes. There is no universally accepted definition of sustainable mobility or agreement how to measure it [1,5,6,7,8,9,10]. The sustainable mobility indicators should must reflect upon and continuously develop new transportation and environmental policy [23,24]. This implies a continuous process of choosing and composing factors, negotiations and fine-tuning of the models and measures. The mobility choices model should be conceived furthermore as a research agenda about how specific urban form and accessibility factors (density, walkable streets, flat terrain, visual proximity to transit stops, transit stops with frequent service, building setbacks, building heights, walking radiuses to transit stops, etc.) commonly used in urbanist practice influence travel by different transportation modes. It should reflect empirical knowledge and tend to be concise and communicative. Therefore, the application of this specific mobility choices model is limited to Sweden. The sustainable mobility indicators are unique for the conditions in the Swedish municipalities. The development of the mobility choices model is coordinated with Jönköping and Haninge municipalities and developers. These actors see the mobility choices model as tool to negotiate parking standards and decrease costs for parking in new development projects. The mobility choices model starts with variable of parking spaces and expands to other urban form and accessibility factors commonly used in Swedish urban planning and design practice (building heights, street widths, FSIs, etc.). If the mobility choices model is to be transferred and applied in other countries, there should be an indicator development process that considers local environmental policies and specificities of urban planning and design practices. There are different traditions of urban regulation and legislations around the world, from conventional zoning to very detailed coding (FBCs) [16,17,18,19,20,21,22]. The indicators do not influence policy but the process of creating indicators inspires collaborative learning (about the effect of urban form on sustainable travel in a case of the mobility choices model) among actors and stakeholders [23,24]. In other words, the Swedish experience as a fixed set of sustainable mobility indicators (presented on Table 1 and Table 2) may not be transferable to other countries.
The final section concludes this paper and presents direction for future research.
7. Conclusions and Future Research
To fulfil the ambitious environmental goals of decreasing carbon emission in Swedish cities, there is a need to redesign the sprawled neighbourhoods and make walking, cycling and public transportation viable travel alternatives. Urban planners and designers, municipal officials and developers can manage carbon emissions only if they are informed about the environmental implications and transportation efficiency of the existing and newly planned buildings and neighbourhoods. This paper presents a mobility choices model that forecasts and visualizes integration with different transportation modes, modal shares, energy use and carbon emissions based on sustainable mobility indicators, a set of urban form and accessibility factors that are commonly used by urban planners and designers. It links to current environmental goals to curb carbon emissions by showing estimates of CO2 emissions in transportation. It introduces a measure for energy use performance from buildings (kWh/year/person) conversable with EPC and annual energy consumption for buildings (measured in kWh/m2/year). This allows to compare energy and environmental performance of the building with transportation to and from the building.
The mobility choices model can be used to identify unsustainable mobility patterns in existing neighbourhoods and new developments. The methodology can be additionally used to analyse alternative scenarios of redesigning sprawled Swedish neighbourhoods into more sustainable urban forms. The model can estimate future modal shares, gains in carbon emissions or energy efficiency caused by urban transformation. Visualizing this information about environmental performance and carbon implication of transportation has a potential to trigger a virtuous cycle of transforming neighbourhoods to better integrate walking, cycling and public transportation. Improving the walkability, introduction of cycling and transit infrastructures can help in lowering parking standards that are often crucial parameter in conventional zoning and planning practice. In a vicious circle for the automobile, less parking would produce more walking, cycling and transit use and contribute to decrease in carbon emissions. The problems with poor integration with walking, cycling and public transportation are not always visible, especially to motorists. All the neighbourhoods show 100% integration with the private automobile (Figure 8) and motorists would not see any mobility problems in neighbourhoods that have available parking spaces.
There are several limitations with the mobility choices model. Firstly, the modal shares estimates are approximated and must be considered with certain awareness. This is characteristics of all travel forecasting models based on urban form factors. The urban form and accessibility factors influence travel behaviour indirectly. Travel directly depends on discrete choices of individuals and it is skewed by personal characteristics and established mobility cultures. To show this, the paper presents an analysis of how radical flâneurs, cycling advocates, bus enthusiasts and train spotters, green travellers, rational agents and dedicated motorists would perceive the mobility choices in these neighbourhoods. Secondly, the mobility choices model selects embedded affordances in urban forms as sustainable mobility indicators and creates complex measures for integration of the urban form with walking, cycling, public transportation and private car. This complex set of sustainable mobility indicators and weights assigned in the mobility choices model are somewhat subjective and arbitrary. Even the approximated models can be useful considering their scope and limitations. The mobility choices model informs directly about sustainable mobility in a very concise form (modal shares, transportation energy use in kWh/year/person and carbon emission in t CO2/year/person) and shows a complex set of urban form and accessibility factors as background for the modal shares forecasts (Figure A1, Figure A2 and Figure A3 in the Appendix). Both the concise and complex information are need to reflect upon the complex link between urban form and sustainable mobility.
In the end, the mobility choices model should not be understood as a final product of fixed sustainable mobility indicators but as a framework to communicate knowledge about the complex link between urban form and transportation systems among actors and stakeholders in the urban development processes. The indicators influence urban development processes through collaborative learning during their development, through framing problems and solutions [23,24]. The application of the mobility choices model as a set of sustainable mobility indicators (Table 1 and Table 2) is limited to Sweden. The sustainable mobility indicators are unique for the conditions in the Swedish municipalities and developed with local actors and stakeholders. To transfer and apply the mobility choices model in other countries, there should be an indicator development process that considers local environmental policies and specificities of urban planning and design practices. There is no ready blueprint for sustainable mobility [1,5,6,7,8,9,10]. There are different traditions of urban regulation and legislations around the world, from conventional zoning to very detailed coding (FBCs) [16,17,18,19,20,21,22]. This kind of collaborative processes of creating and refining combinations of sustainable mobility indicators, linking urban planning and design practices with environmental goals in different localities, can contribute in urban development and transformation towards more sustainable cities.
There are several directions for future research. EU has established legislation and standard methodologies to assess environmental performance and energy efficiency of buildings. The mobility choices model can be institutionalized as Mobility Choices Certificates (MCC), a parallel to EPCs. This can become a consultancy service. Energy engineers produce EPCs for buildings. Transportation engineers, urban designers or planners can make MCCs that will show mobility choices and energy performance for transportation to and from buildings. This implies creation of inventories of urban form and accessibility factors as well as standardized methods to estimate modal shares, energy use and carbon emissions from transportation. Another practical application is to use the information about good integration of the city with walking, cycling and public transportation to negotiate arbitrary parking standards [88]. Another research direction is to calibrate the model that predicts modal shares on urban form and accessibility factors with travel surveys and automated mode detection mobile apps. This will compare the travel forecasts for buildings with individual travel patterns (modal shares). In long term, the goal is to integrate the sustainable mobility indicators within the existing municipal GIS and automate the analysis to inform urban designers and planners in real time. Another possibility is to create a web application that will automatically run the analysis based on GIS data.
Funding
This research is funded by Riksbyggen’s “Den Goda Staden” scholarship, Swedish Innovation Agency Vinnova, grant number 2015-03483 and the Swedish Energy Agency Energimyndigheten, grant number P44455-1 (2017-003267).
Acknowledgments
The author would like to thank Andrew P. Karvonen and Tigran Haas and two anonymous reviewers at the journal of Sustainability.
Conflicts of Interest
The author declares no conflict of interest.
Appendix A. Maps Showing Urban Form and Accessibility Factors and LoIs
Figure A1.
Modal share estimations based on urban form and accessibility factors in Torpa/Söder, Jönköping.
Figure A1.
Modal share estimations based on urban form and accessibility factors in Torpa/Söder, Jönköping.

Figure A2.
Modal share estimations based on urban form and accessibility factors in Tenhult, Jönköping.
Figure A2.
Modal share estimations based on urban form and accessibility factors in Tenhult, Jönköping.

Figure A3.
Modal share estimations based on urban form and accessibility factors in Handen, Stockholm.
Figure A3.
Modal share estimations based on urban form and accessibility factors in Handen, Stockholm.

References
- Herold, D.M.; Lee, K.-H. Carbon management in the logistics and transportation sector: An overview and new research directions. Carbon Manag. 2017, 3, 1–19. [Google Scholar] [CrossRef]
- Herold, D.M.; Lee, K.-H. The influence of internal and external pressures on carbon management practices and disclosure strategies. Aust. J. Environ. Manag. 2018, 1–19. [Google Scholar] [CrossRef]
- Herold, D.M.; Farr-Wharton, B.; Lee, K.-H.; Groschopf, W. The interaction between institutional and stakeholder pressures: Advancing a framework for categorising carbon disclosure strategies. Bus. Strat. Dev. 2018, 1–14. [Google Scholar] [CrossRef]
- Urry, J. The ‘System’ of Automobility. Theory Cult. Soc. 2004, 21, 25–39. [Google Scholar] [CrossRef]
- Hilty, L.M.; Arnfalk, P.; Erdmann, L.; Goodman, J.; Lehmann, M.; Wäger, P.A. The relevance of information and communication technologies for environmental sustainability—A prospective simulation study. Environ. Model. Softw. 2006, 21, 1618–1629. [Google Scholar] [CrossRef]
- Kramers, A.; Wangel, J.; Johansson, S.; Höjer, M.; Finnveden, G.; Brandt, N. Towards a comprehensive system of methodological considerations for cities’ climate targets. Energy Policy 2013, 62, 1276–1287. [Google Scholar] [CrossRef]
- Kramers, A.; Höjer, M.; Lövehagen, N.; Wangel, J. Smart sustainable cities—Exploring ICT solutions for reduced energy use in cities. Environ. Model. Softw. 2014, 56, 52–62. [Google Scholar] [CrossRef]
- Ringenson, T.; Arnfalk, P.; Kramers, A.; Sopjani, L. Indicators for Promising Accessibility and Mobility Services. Sustainability 2018, 10, 2836. [Google Scholar] [CrossRef]
- Banister, D. The sustainable mobility paradigm. Transp. Policy 2008, 15, 73–80. [Google Scholar] [CrossRef]
- Gil, A.; Calado, H.; Bentz, J. Public participation in municipal transport planning processes—The case of the sustainable mobility plan of Ponta Delgada, Azores, Portugal. J. Transp. Geogr. 2011, 19, 1309–1319. [Google Scholar] [CrossRef]
- Hickman, R.; Hall, P.; Banister, D. Planning more for sustainable mobility. J. Transp. Geogr. 2013, 33, 210–219. [Google Scholar] [CrossRef]
- Naess, P.; Hansson, L.; Richardson, T.; Tennøy, A. Knowledge-based land use and transport planning? Consistency and gap between “state-of-the-art” knowledge and knowledge claims in planning documents in three Scandinavian city regions. Plan. Theory Pract. 2013, 14, 470–491. [Google Scholar] [CrossRef]
- City of Malmö. Sustainable Urban Mobility Plan. 2016. Available online: http://malmo.se/download/18.16ac037b154961d0287384d/1491301288704/Sustainable+urban+mobility+plan%252528TROMP%252529_ENG.pdf (accessed on 18 December 2018).
- City of Stockholm. The City of Stockholm’s Environmental Work. 2017. Available online: http://miljobarometern.stockholm.se/content/docs/tema/Environmental-Work-Stockholm-2017.pdf (accessed on 18 December 2018).
- Southworth, M. Designing the walkable city. J. Urban Plan. Dev. 2005, 131, 246–257. [Google Scholar] [CrossRef]
- Duany, A.; Talen, E. Transect planning. J. Am. Plan. Assoc. 2002, 68, 245–266. [Google Scholar] [CrossRef]
- Talen, E. Help for urban planning: The transect strategy. J. Urban Des. 2002, 7, 293–312. [Google Scholar] [CrossRef]
- Talen, E. Design by the rules: The historical underpinnings of form-based codes. J. Am. Plan. Assoc. 2009, 75, 144–160. [Google Scholar] [CrossRef]
- Talen, E. Zoning for and against sprawl: The case for form-based codes. J. Urban Des. 2013, 18, 175–200. [Google Scholar] [CrossRef]
- Ben-Joseph, E. The Code of the City: Standards and the Hidden Language of Place Making; MIT Press: Cambridge, CA, USA, 2005. [Google Scholar]
- Walters, D.R. Designing Community: Charrettes, Master Plans and Form-Based Codes; Architectural Press: Oxford, UK, 2007. [Google Scholar]
- Marshall, S. (Ed.) Urban Coding and Planning; Routledge: Abingdon, UK, 2011. [Google Scholar]
- Innes, J.E. Knowledge and Public Policy: The Search for Meaningful Indicators, 2nd ed.; Transaction Publishers: New Brunswick, NJ, USA, 1990. [Google Scholar]
- Innes, J.E.; Booher, D.E. Indicators for sustainable communities: A strategy building on complexity theory and distributed intelligence. Plan. Theory Pract. 2000, 1, 173–186. [Google Scholar] [CrossRef]
- Innes, J.E.; Booher, D.E. Planning with Complexity: An Introduction to Collaborative Rationality for Public Policy; Routledge: London, UK, 2010. [Google Scholar]
- Bell, S.; Morse, S. Sustainability Indicators: Measuring the Immeasurable? Earthscan: London, UK, 2008. [Google Scholar]
- Singh, R.K.; Murty, H.R.; Gupta, S.K.; Dikshit, A.K. An overview of sustainability assessment methodologies. Ecol. Indic. 2009, 9, 189–212. [Google Scholar] [CrossRef]
- Mori, K.; Christodoulou, A. Review of sustainability indices and indicators: Towards a new City Sustainability Index (CSI). Environ. Impact Assess. Rev. 2012, 32, 94–106. [Google Scholar] [CrossRef]
- Cervero, R. America’s Suburban Centers: The Land-Use-Transportation Link; Unwin Hyman: Boston, MA, USA, 1989. [Google Scholar]
- Cervero, R. Congestion relief: The land use alternative. J. Plan. Educ. Res. 1991, 10, 119–130. [Google Scholar] [CrossRef]
- Crane, R. Cars and drivers in the new suburbs: Linking access to travel in neotraditional planning. J. Am. Plan. Assoc. 1996, 62, 51–65. [Google Scholar] [CrossRef]
- Crane, R. The influence of urban form on travel: An interpretive review. J. Plan. Lit. 2000, 15, 3–23. [Google Scholar] [CrossRef]
- Southworth, M. Walkable suburbs: An evaluation of neotraditional communities at the urban edge. J. Am. Plan. Assoc. 1997, 63, 28–44. [Google Scholar] [CrossRef]
- Cervero, R.; Kockelman, K. Travel demand and the 3Ds: Density, diversity, and design. Transp. Res. Part D Transp. Environ. 1997, 2, 199–219. [Google Scholar] [CrossRef]
- Boarnet, M.G.; Crane, R. Travel by Design: The Influence of Urban form on Travel; Oxford University Press: Oxford, UK, 2001. [Google Scholar]
- Ewing, R.; Cervero, R. Travel and the built environment: A synthesis. Transp. Res. Rec. J. Transp. Res. Board 2001, 87–114. [Google Scholar] [CrossRef]
- Ewing, R.; Cervero, R. Travel and the Built Environment. J. Am. Plan. Assoc. 2010, 76, 265–294. [Google Scholar] [CrossRef]
- Stead, D.; Marshall, S. The relationships between urban form and travel patterns. An international review and evaluation. Eur. J. Transp. Infrastruct. Res. 2001, 1, 113–141. [Google Scholar]
- Talen, E. Measuring urbanism: Issues in smart growth research. J. Urban Des. 2003, 8, 195–215. [Google Scholar] [CrossRef]
- Ewing, R.; King, M.R.; Raudenbush, S.; Clemente, O.J. Turning highways into main streets: Two innovations in planning methodology. J. Am. Plan. Assoc. 2005, 71, 269–282. [Google Scholar] [CrossRef]
- Krizek, K.J. Residential relocation and changes in urban travel: Does neighborhood-scale urban form matter? J. Am. Plan. Assoc. 2003, 69, 265–281. [Google Scholar] [CrossRef]
- Krizek, K.J. Measuring accessibility: Prescriptions for performance measures of the creative and sustainable city. Int. J. Sustain. Dev. 2010, 13, 149–160. [Google Scholar] [CrossRef]
- Naess, P. Urban Structure Matters: Residential Location, Car Dependence and Travel Behaviour; Routledge: London, UK, 2006. [Google Scholar]
- Naess, P. ‘New urbanism’or metropolitan-level centralization? A comparison of the influences of metropolitan-level and neighborhood-level urban form characteristics on travel behavior. J. Transp. Land Use 2011, 4, 25–44. [Google Scholar]
- Næss, P. Urban form and travel behavior: Experience from a Nordic context. J. Transp. Land Use 2012, 5, 21–45. [Google Scholar] [CrossRef]
- Naess, P. Urban form, sustainability and health: The case of greater Oslo. Eur. Plan. Stud. 2014, 22, 1524–1543. [Google Scholar] [CrossRef]
- Krizek, K.J.; Handy, S.L.; Forsyth, A. Explaining changes in walking and bicycling behavior: Challenges for transportation research. Environ. Plan. B Plan. Des. 2009, 36, 725–740. [Google Scholar] [CrossRef]
- Cervero, R.; Sarmiento, O.L.; Jacoby, E.; Gomez, L.F.; Neiman, A. Influences of built environments on walking and cycling: Lessons from Bogotá. Int. J. Sustain. Transp. 2009, 3, 203–226. [Google Scholar] [CrossRef]
- Ewing, R.; Handy, S. Measuring the unmeasurable: Urban design qualities related to walkability. J. Urban Des. 2009, 14, 65–84. [Google Scholar] [CrossRef]
- Iacono, M.; Krizek, K.J.; El-Geneidy, A. Measuring non-motorized accessibility: Issues, alternatives, and execution. J. Transp. Geogr. 2010, 18, 133–140. [Google Scholar] [CrossRef]
- Boarnet, M.G. A broader context for land use and travel behavior, and a research agenda. J. Am. Plan. Assoc. 2011, 77, 197–213. [Google Scholar] [CrossRef]
- Lee, S.; Talen, E. Measuring Walkability: A Note on Auditing Methods. J. Urban Des. 2014, 19, 368–388. [Google Scholar] [CrossRef]
- De Abreu e Silva, J. The Effects of Land-Use Patterns on Home-Based Tour Complexity and Total Distances Traveled: A Path Analysis. Sustainability 2018, 10, 830. [Google Scholar] [CrossRef]
- Stojanovski, T. How density, diversity, land use and neighborhood type influences bus mobility in the Swedish city of Karlstad: Mixing spatial analytic and typo-morphological approaches to assess the indirect effect of urban form on travel. J. Transp. Land Use 2018, 11, 769–789. [Google Scholar] [CrossRef]
- ITE (Institute of Transportation Engineers). Trip Generation Manual, 9th ed.; ITE: Washington, DC, USA, 2012. [Google Scholar]
- Ewing, R.; Greenwald, M.J.; Zhang, M.; Bogaerts, M.; Greene, W. Predicting transportation outcomes for LEED projects. J. Plan. Educ. Res. 2013, 33, 1–15. [Google Scholar] [CrossRef]
- Weinberger, R.; Dock, S.; Cohen, L.; Rogers, J.D.; Henson, J. Predicting travel impacts of new development in America’s major cities: Testing alternative trip generation models. J. Transp. Res. Board 2015, 2500, 36–47. [Google Scholar] [CrossRef]
- McFadden, D. The measurement of urban travel demand. J. Public Econ. 1974, 3, 303–328. [Google Scholar] [CrossRef]
- Hensher, D.A.; Johnson, L.W. Applied Discrete-Choice Modelling; Croom Helm: London, UK, 1981. [Google Scholar]
- Ben-Akiva, M.E.; Lerman, S.R. Discrete Choice Analysis: Theory and Application to Travel Demand; MIT Press: Cambridge, MA, USA, 1985. [Google Scholar]
- Kramers, A. Designing next generation multimodal traveler information systems to support sustainability-oriented decisions. Environ. Model. Softw. 2014, 56, 83–93. [Google Scholar] [CrossRef]
- Lewin, K. A Dynamic Theory of Personality: Selected Papers; McGraw-Hill: New York, NY, USA, 1935. [Google Scholar]
- Metcalfe, R.; Dolan, P. Behavioural economics and its implications for transport. J. Transp. Geogr. 2012, 24, 503–511. [Google Scholar] [CrossRef]
- Dolan, P.; Hallsworth, M.; Halpern, D.; King, D.; Metcalfe, R.; Vlaev, I. Influencing behaviour: The mindspace way. J. Econ. Psychol. 2012, 33, 264–277. [Google Scholar] [CrossRef]
- Gibson, J.J. The Ecological Approach to Visual Perception; Lawrence Erlbaum Associates: Hillsdale, NJ, USA, 1986. [Google Scholar]
- Gifford, R. Environmental psychology matters. Annu. Rev. Psychol. 2014, 65, 541–579. [Google Scholar] [CrossRef]
- Rapoport, A. Human Aspects of Urban form: Towards A Man-Environment Approach to Urban form and Design; Pergamon P.: Oxford, UK, 1977. [Google Scholar]
- Gehl, J. Life Between Buildings: Using Public Space; Van Nostrand Reinhold: New York, NY, USA, 1987. [Google Scholar]
- Haapio, A.; Viitaniemi, P. A critical review of building environmental assessment tools. Environ. Impact Assess. Rev. 2008, 28, 469–482. [Google Scholar] [CrossRef] [Green Version]
- Haapio, A. Towards sustainable urban communities. Environ. Impact Assess. Rev. 2012, 32, 165–169. [Google Scholar] [CrossRef]
- Sharifi, A.; Murayama, A. A critical review of seven selected neighborhood sustainability assessment tools. Environ. Impact Assess. Rev. 2013, 38, 73–87. [Google Scholar] [CrossRef]
- Wangel, J.; Wallhagen, M.; Malmqvist, T.; Finnveden, G. Certification systems for sustainable neighbourhoods: What do they really certify? Environ. Impact Assess. Rev. 2016, 56, 200–213. [Google Scholar] [CrossRef]
- Pucher, J.; Buehler, R. Making cycling irresistible: Lessons from the Netherlands, Denmark and Germany. Transp. Rev. 2008, 28, 495–528. [Google Scholar] [CrossRef]
- Pucher, J.R.; Buehler, R. Analysis of Bicycling Trends and Policies in Large North American Cities: Lessons for New York. Available online: http://www.utrc2.org/sites/default/files/pubs/analysis-bike-final_0.pdf (accessed on 18 December 2018).
- Pucher, J.; Buehler, R.; Seinen, M. Bicycling renaissance in North America? An update and re-appraisal of cycling trends and policies. Transp. Res. Part A Policy Pract. 2011, 45, 451–475. [Google Scholar] [CrossRef]
- Buehler, R.; Pucher, J. Cycling to work in 90 large American cities: New evidence on the role of bike paths and lanes. Transportation 2012, 39, 409–432. [Google Scholar] [CrossRef]
- Krizek, K.J.; Johnson, P.J. Proximity to trails and retail: Effects on urban cycling and walking. J. Am. Plan. Assoc. 2006, 72, 33–42. [Google Scholar] [CrossRef]
- O’Sullivan, S.; Morrall, J. Walking distances to and from light-rail transit stations. Transp. Res. Rec. J. Transp. Res. Board 1996, 1538, 19–26. [Google Scholar] [CrossRef]
- Daniels, R.; Mulley, C. Explaining walking distance to public transport: The dominance of public transport supply. J. Transp. Land Use 2013, 6, 5–20. [Google Scholar] [CrossRef]
- Anable, J. Complacent car addicts or aspiring environmentalists? Identifying travel behaviour segments using attitude theory. Transp. Policy 2005, 12, 65–78. [Google Scholar] [CrossRef]
- Prillwitz, J.; Barr, S. Moving towards sustainability? Mobility styles, attitudes and individual travel behaviour. J. Transp. Geogr. 2011, 19, 1590–1600. [Google Scholar] [CrossRef]
- Bourdieu, P. The social space and the genesis of groups. Theory Soc. 1985, 6, 723–744. [Google Scholar]
- LEED v4 for Neighborhood Development. 2016. Available online: https://www.usgbc.org/sites/default/files/LEED%20v4%20ND_07.2.18_current.pdf (accessed on 18 December 2018).
- Banister, D. The trilogy of distance, speed and time. J. Transp. Geogr. 2011, 19, 950–959. [Google Scholar] [CrossRef]
- Swedish Energy Agency (Statens Energimyndighet), Transportsektorns Energianvändning 2016. 2017. Available online: https://www.energimyndigheten.se/globalassets/statistik/transport/transportsektorns-energianvandning-2016.pdf (accessed on 18 December 2018).
- Jonkoping Municipality. Resvanor i Jonkopings kommun 2014. 2014. Available online: http://www.jonkoping.se/download/18.2d563fc149c4784291c281/1417172266872/Resvanor+i+J%C3%B6nk%C3%B6pings+kommun+2014.pdf (accessed on 18 December 2018).
- SLL (Stockholms läns landstigning), Resvanor i Stockholms lan 2015. 2016. Available online: http://www.sll.se/Global/Verksamhet/Kollektivtrafik/Kollektivtrafiken%20v%C3%A4xer%20med%20Stockholm/SU/Resvaneunders%C3%B6kningen/resvanor-i-stockholms-lan-2015.pdf (accessed on 18 December 2018).
- Shoup, D.C. The High Cost of Free Parking; American Planning Association Planners Press: Chicago, IL, USA, 2011. [Google Scholar]
Figure 1.
Conceptual framework for travel behaviour based on perceptual modalities (visual proximity) and cognitive representation of cities (destinations in neighbourhoods and urban regions).
Figure 1.
Conceptual framework for travel behaviour based on perceptual modalities (visual proximity) and cognitive representation of cities (destinations in neighbourhoods and urban regions).

Figure 2.
Mobility subcultures and their interactions.

Figure 3.
The travel forecasting method based on urban form and accessibility factors.

Figure 4.
The demographics input into the online travel forecasting model (https://applikation.trafikverket.se/trafikalstring/) that results in modal shares estimates.
Figure 4.
The demographics input into the online travel forecasting model (https://applikation.trafikverket.se/trafikalstring/) that results in modal shares estimates.

Figure 5.
Study areas in Stockholm and Jonkoping.

Figure 6.
Results of the travel forecasting model (https://applikation.trafikverket.se/trafikalstring/), actual modal shares by travel survey in comparison to the results for the modal shares by the proposed model.
Figure 6.
Results of the travel forecasting model (https://applikation.trafikverket.se/trafikalstring/), actual modal shares by travel survey in comparison to the results for the modal shares by the proposed model.

Figure 7.
Energy use and CO2 emissions based on the modal share estimation by the mobility choices model. Note. An average person living in 50 m2 apartment uses 5000–6000 kWh/year for heating and electricity. The average CO2 emissions from transportation are 1.7t CO2/year/person.
Figure 7.
Energy use and CO2 emissions based on the modal share estimation by the mobility choices model. Note. An average person living in 50 m2 apartment uses 5000–6000 kWh/year for heating and electricity. The average CO2 emissions from transportation are 1.7t CO2/year/person.

Figure 8.
How would different mobility classes (flâneurs, cycling advocates, bus enthusiasts and train spotters, green travellers, rational agents and dedicated motorists) evaluate the integration of the different transportation modes in Jönköping and Stockholm. Note that these estimation are exaggerated by the bias of typical subcultures (dedicated motorists prefer car before anything else, etc.). Established mobility culture such as cycling in Copenhagen or Amsterdam or transit in Stockholm would skew the modal share towards the preferred transportation mode.


Table 1.
Sustainable mobility indicators/urban form and accessibility factors at scales of visual perception, local accessibility and regional connectivity. The importance of the factor (9-point scale) is shown in the brackets (x) with the weights. The sums in Table 1 shows the sum of the 9-scale values for all the factors and the 100% integration for the LoIs. The weights of the factors are rounded proportionally according to the 9-scale values in the brackets to sum up to 100%. (e.g., Parking is extremely important (gets value 9) that rounds to 9/15=~60% of the integration with the private car).
| Sustainable Mobility Indicators/Urban Form and Accessibility Factors | Scale | Walking | Cycling | Public Transportation | Private Car | |
|---|---|---|---|---|---|---|
| 1 | Sidewalk design and continuity | Visual | (3) 5 1 | |||
| 2 | Street segment length/city block width | Visual | (7) 15 | |||
| 3 | Speed limit | Visual | (3) 5 1 | |||
| 4 | Bike parking | Visual | (3) 10 | |||
| 5 | Cycling lanes on street/cycleways | Visual | (3) 10 | |||
| 6 | Bus line/busway/tramway on street | Visual | (3) 5 | |||
| 7 | Transit stop/station exit on street | Visual | (3) 5 | |||
| 8 | Parking | Visual | (9) 60 | |||
| 9 | Undisturbed circulation (no congestion) | Visual | (3) 10 | |||
| 10 | Building setback | Visual | (3) 5 1 | |||
| 11 | Building height to street width ratio | Visual | (3) 5 1 | |||
| 12 | Building façade activity/openness | Visual | (9) 20 1 | |||
| 13 | City block density (residents and jobs) | Local | (9) 20 2 | (3) 5 | ||
| 14 | City block land use mix (entropy of residents and jobs) | Local | (9) 20 2 | (3) 5 | ||
| 15 | Neighbourhood topography (slope) | Local | (9) 40 | |||
| 16 | Access to everyday activities | Local | (9) 20 | |||
| 17 | Access to event-type activities | Local | (3) 5 | |||
| 18 | Access to a mix of activities | Local | (9) 20 | |||
| 19 | Access to a local transit stop | Local | (9) 30 | |||
| 20 | Access to a regional transit stop | Regional | (9) 30 | |||
| 21 | Access to an expressway | Regional | (5) 30 | |||
| 22 | Bikable location | Regional | (9) 40 | |||
| Walking (7) 20 | ||||||
| Sums | (42) 100 | (24) 100 | (27) 100 | (15) 100 |
1 assigned to street space/open spaces between building façades; 2 assigned to city blocks/constructed and open within the parameter of the building façades.
Table 2.
Urban form and accessibility factors and methods.
| Sustainable Mobility Indicators/Urban Form and Accessibility Factors | Method | Origin | |
|---|---|---|---|
| 1 | Sidewalk design and continuity | I1 is surveyed (I1 = 100 is assigned for continuous sidewalks) | LEED |
| 2 | Street segment length/city block width | where cbwx City block width (width lower than 100 m and minimum 0 points for width over 200 m). cbax City block area measured in GIS. | Ds, LEED |
| 3 | Speed limit | I3 is surveyed (I3 = 100 if speed limit = 30 km/h) | LEED |
| 4 | Bike parking | I4 is surveyed (bicycle parking racks on a street give I4 = 100) | |
| 5 | Cycling lanes on street/cycleways | I5 is surveyed (I5 = 100 for street segments with cycling lanes) | |
| 6 | Bus line/busway/tramway on street | I6 is surveyed (street segments with bus lines receive I6 = 50, whereas I6 = 100 with busways/tramways on street) | |
| 7 | Transit stop/station exit on street | I7 is surveyed (city blocks with a transit stop/station exit on the streets receives I7 = 100) | |
| 8 | Parking | I8 is surveyed (I8 = 100 is assigned if there is visible parking) | |
| 9 | Undisturbed traffic circulation | I9 is surveyed (if there is no visible congestion I9 = 100) | |
| 10 | Building setback | I10 is surveyed (building façade within 0.5 m get I10 = 100, between 0.5 and 5m I10 = 50 and I10 = 0 for over 5 m) | LEED |
| 11 | Building height to street width ratio | I11 is surveyed (if the ratio is 1:3 or lower I11 = 100) | LEED |
| 12 | Building façade activity/openness | I12 is surveyed (if any part of the building façade is publicly accessible I12 = 100) | LEED |
| 13 | City block density (residents and jobs) | qrj residents and jobs per ha (if number of residents and jobs per ha > 100 then I13 =100) | Ds, LEED |
| 14 | City block land use mix (entropy of residents and jobs) | erj Entropy (if erj > 0.7 then I14 =100) Pi Proportion of categories 1–2 (e.g., of residents P1 and jobs P2) N Number of categories (2: residents and jobs) | Ds, LEED |
| 15 | Neighbourhood topography (slope) | I15 is calculated in GIS with raster map algebra method. Two raster maps with cost distance from the central points of the neighbourhoods are created to calculate the travel ratio (TTR): (1) without slope; and (2) with slope degree penalty: no penalty was given for 0–0.5 degrees, 50% for 0.5–1, 100% for 1–2, 300% for 2–5, 400 % for 5–10 and beyond 10%-degree slope got 100 times penalty (1000%). By dividing the raster without and with slope penalty it is possible to see how difficult is to reach a destination. A TTR of 1 would mean two points on the map connect without slope obstacles, whereas 2 would mean 0–1% slope. I15 is normalized (0–100) with map algebra formula: (negative values are corrected to 0) ttrx Travel time ratio in a cell of the raster map | Walk Score |
| 16 | Access to everyday activities | I16 is calculated in GIS. O-D matrix network analysis in ArcGIS is used to calculate distances from each supermarket, shop, restaurant, bar and so forth to every building in the neighbourhood. Interpolation method (IDW) is used to calculate ranges. I16 = 100 if building is within 100 m (buffer tool is used), 60 if between 200–400 m network distance, 30 if within 400–800 m network distance. | |
| 17 | Access to event-type activities | I17 is calculated in GIS with the same method as I16, just destinations included in this case churches, libraries and so forth | |
| 18 | Access to a mix of activities | I18 is calculated in GIS. Service area network analysis in ArcGIS is used. Service area polygons within 400 m to entries with different land uses (shopping, culture, recreation, bars and restaurants, services, education and public spaces) are created. An overlay in GIS is used to sum up the total number of land uses: The polygons are converted in a raster map with following values: I16 = 0 (0–1 uses); I16 = 25 (2–3 uses); I16 = 50 (4–5 uses): and I16 = 100 (6–7 uses). | LEED |
| 19 | Access to a local transit stop | I19 is calculated in GIS. O-D matrix network analysis in ArcGIS is used to calculate distances from local transit stops to every building in the neighbourhood. Each local transit stop received a Transit Stop Performance Benchmark (TSPB) in respect to the frequency and type of service. The formula is: fts Frequency at transit stop (weekly departures multiplied by 2 for commuter rail/subway/regional bus lines, 1.5 for local trunk buses and 1 for standard buses). The reference for the calculus (TSPB = 100) is Stockholm’s busiest transit node (Centralen/T-central/) as most busy and integrated transit stop in Sweden which has 3374 departures or arrivals per week by bus, 2002 by trunk bus, 6643 by subway and 1302 by commuter rail (weighted sum of 22,267). I19 is calculated by the formula below considering parameter wts that distance to the transit stop: Interpolation method (IDW) is used to calculate wts: wts = 100% if building is within 100 m (buffer tool in GIS is used), 60% if between 200–400 m network distance, 30% if within 400–800 m network distance. | Walk Score |
| 20 | Access to a regional transit stop | I19 is calculated in GIS is used with the same method as for access to a local transit stop, just for transit stops with regional service. | |
| 21 | Access to an expressway | I21 = 100 if the neighbourhood centre is within 3 km to an exit to an expressway | |
| 22 | Bikable location (regionally) | I22 is calculated by the formula: wcc Distance to the metropolitan core (in km) (if wcc > 10 km then I23 = 0) |
Table 3.
Transportation statistics from Swedish national travel surveys (Trafa, Swedish government agency for transport analysis, https://www.trafa.se/, in the original transportation statistics sums up journeys (e.g., to and from work) into one main journey by purpose (e.g., work). Here there are presented as two journeys.).
| Number of Journeys Per Day | Number of Journeys Per Year | ||||||||
| By foot, bicycle | Car | Public transport | Total | By foot, bicycle | Car | Public transport | Total | ||
| 1999 | 0.91 | 1.72 | 0.28 | 3.08 | 1999 | 331 | 629 | 100 | 1124 |
| 2005–2006 | 0.97 | 1.56 | 0.34 | 2.96 | 2005–2006 | 353 | 569 | 123 | 1080 |
| 2011 | 1.00 | 1.74 | 0.38 | 3.24 | 2011 | 365 | 635 | 139 | 1183 |
| 2011–2012 | 1.12 | 1.66 | 0.36 | 3.30 | 2011–2012 | 409 | 606 | 131 | 1205 |
| 2014–2015 | 0.88 | 1.44 | 0.40 | 2.82 | 2014–2015 | 321 | 526 | 146 | 1029 |
| 2015–2016 | 0.80 | 1.40 | 0.40 | 2.70 | 2015–2016 | 292 | 511 | 146 | 986 |
| Average Distance Travelled by Person and Day in km | Average Time Travelled (in min) by Person and Day in km | ||||||||
| By foot, bicycle | Car | Public transport | Total | By foot, bicycle | Car | Public transport | Total | ||
| 1999 | 1.4 | 26.7 | 2.9 | 41.6 | 1999 | ||||
| 2005–2006 | 1.2 | 25.7 | 6.6 | 40.0 | 2005–2006 | 12.9 | 36.8 | 9.0 | 64.7 |
| 2011 | 1.8 | 30.1 | 6.0 | 43.7 | 2011 | 14.9 | 34.6 | 10.7 | 66.9 |
| 2011–2012 | 1.7 | 29.3 | 6.1 | 47.5 | 2011–2012 | 15.7 | 38.6 | 11.9 | 73.0 |
| 2014–2015 | 1.5 | 25.1 | 6.6 | 41.8 | 2014–2015 | 17.4 | 36.5 | 11.0 | 72.6 |
| 2015–2016 | 1.4 | 25.0 | 6.0 | 38.0 | 2015–2016 | 13.1 | 31.3 | 11.3 | 61.0 |
| Average Length of Journey | Average Time Travelled (in min) Per Journey | ||||||||
| By foot, bicycle | Car | Public transport | Total | By foot, bicycle | Car | Public transport | Total | ||
| 1999 | 1.5 | 15.5 | 10.5 | 13.5 | 1999 | ||||
| 2005–2006 | 1.3 | 16.5 | 19.4 | 13.5 | 2005–2006 | 14.2 | 21.4 | 32.8 | 21.0 |
| 2011 | 1.8 | 17.3 | 15.7 | 13.5 | 2011 | 15.4 | 22.2 | 31.6 | 22.6 |
| 2011–2012 | 1.5 | 17.6 | 16.9 | 14.4 | 2011–2012 | 15.7 | 22.2 | 31.4 | 22.5 |
| 2014–2015 | 1.7 | 17.5 | 16.5 | 14.8 | 2014–2015 | 15.5 | 22.0 | 30.5 | 22.0 |
| 2015–2016 | 1.8 | 17.9 | 15.0 | 14.1 | 2015–2016 | 14.9 | 21.8 | 28.3 | 21.6 |
Table 4.
Weighting of transportation mode preferences for typical mobility classes.
| Walking | Cycling | Public Transportation | Private Car | |
|---|---|---|---|---|
| Flâneurs | Like extremely (0.92) | Dislike slightly (0.03) | Dislike slightly (0.03) | Dislike extremely (0.01) |
| Cycling Advocates | Dislike slightly (0.03) | Like extremely (0.92) | Dislike slightly (0.03) | Dislike extremely (0.01) |
| Bus or Rail Nerds | Neither like nor dislike (0.08) | Neither like nor dislike (0.08) | Like extremely (0.75) | Neither like nor dislike (0.08) |
| Green Travelers | Like moderately (0.33) | Like moderately (0.33) | Like moderately (0.33) | Dislike moderately (0.01) |
| Rational Agents | Neither like nor dislike (0.25) | Neither like nor dislike (0.25) | Neither like nor dislike (0.25) | Neither like nor dislike (0.25) |
| Dedicated motorists | Dislike extremely (0.01) | Dislike extremely (0.01) | Dislike extremely (0.01) | Like extremely (0.96) |
© 2019 by the author. Licensee MDPI, Basel, Switzerland. This article is an open access article distributed under the terms and conditions of the Creative Commons Attribution (CC BY) license (http://creativecommons.org/licenses/by/4.0/).
Share and Cite
MDPI and ACS Style
Stojanovski, T. Urban Form and Mobility Choices: Informing about Sustainable Travel Alternatives, Carbon Emissions and Energy Use from Transportation in Swedish Neighbourhoods. Sustainability 2019, 11, 548. https://doi.org/10.3390/su11020548
AMA Style
Stojanovski T. Urban Form and Mobility Choices: Informing about Sustainable Travel Alternatives, Carbon Emissions and Energy Use from Transportation in Swedish Neighbourhoods. Sustainability. 2019; 11(2):548. https://doi.org/10.3390/su11020548
Chicago/Turabian StyleStojanovski, Todor. 2019. "Urban Form and Mobility Choices: Informing about Sustainable Travel Alternatives, Carbon Emissions and Energy Use from Transportation in Swedish Neighbourhoods" Sustainability 11, no. 2: 548. https://doi.org/10.3390/su11020548
Note that from the first issue of 2016, this journal uses article numbers instead of page numbers. See further details here.