Article

Evaluation of the Performance of Unreinforced Stone Masonry Greek “Basilica” Churches When Subjected to Seismic Forces and Foundation Settlement

by
George C. Manos
*,
Lambros Kotoulas
and
Evangelos Kozikopoulos
Lab. Strength of Materials and Structures, Aristotle University, 541 24 Thessaloniki, Greece
*
Author to whom correspondence should be addressed.
Buildings 2019, 9(5), 106; https://doi.org/10.3390/buildings9050106
Submission received: 3 April 2019 / Revised: 18 April 2019 / Accepted: 23 April 2019 / Published: 30 April 2019
(This article belongs to the Special Issue Masonry Buildings: Research and Practice)

Abstract

:
Unreinforced stone masonry made of low strength mortar has been used for centuries in forming old type stone masonry churches of the “Basilica” typology. The seismic performance of such stone masonry structures damaged during recent strong seismic activity in Greece, combined with long term effects from foundation settlement, is presented and discussed. A simplified numerical process is presented for evaluating the performance of such damaged stone masonry structures, making use of linear and non-linear numerical tools and assumed limit-state failure criteria. In order to obtain a quantification of the in-plane sliding shear failure criterion, a number of stone masonry wallets were built with weak mortar and were tested in the laboratory. Through the comparison of the obtained numerical predictions with the observed structural behaviour for selected cases of stone masonry “Basilica” churches, the validity of the applied simplified numerical process is demonstrated. It is shown that reasonable approximation of the observed performance of such structures can be obtained when the assumed failure criteria are realistic.

1. Introduction

During the last fifty years, various parts of Greece have been subjected to a number of damaging earthquakes ranging from Ms = 5.2 to Ms = 7.2 on the Richter scale. Some of these events, not necessarily the most intense, occurred near urban areas [1]. One of the most demanding tasks for counteracting the consequences of all these seismic events was the effort to ensure the structural integrity of old masonry structures that had sustained considerable damage. In this framework, it was essential to study their structural system and to investigate the most significant causes of structural damage. From such an investigation two main contributing factors have come to light. The first factor is the pre-existing state of stress and strain either from previous earthquake events and/or from long term permanent foundation settlement. The effect of foundation deformability is significant for structures that are currently designed and constructed with contemporary materials and construction techniques [2,3]. The effects of interaction between old masonry structures and deformable layers of supporting soil are far more significant. Some of the most celebrated cases are masonry towers that are inclined, like the tower of Pisa in Italy, due to soil deformability; in some cases such inclination led to total collapse. An in-depth presentation of the causes of soil settlement and its effect on old masonry structures as well as remedial measures is given by Croci [4] in the chapter with the relevant sub-title. Stone masonry bridges are another structural type that suffer from foundation settlement [5]. In this case, foundation deformability, which results from long term river flow or short term turbulent river flow from flooding, also leads to the collapse of such stone masonry structures [6,7]. The worst case scenario for the various masonry structural elements is the accumulation of stress and strain from such long term effects and the absence of any appropriate counter-measures. The second factor is a strong seismic ground motion and the earthquake forces generated by it [1,8,9,10,11,12,13,14]. Such seismic events result in stress demands that many times exceed the capacities of unreinforced masonry structural elements and their connections; this is more likely to occur for masonry structures which have already accumulated a considerable pre-existing state of stress and strain, as described in References [4,10,12]. The combination of these two contributing factors can lead unreinforced masonry structural members and their connection to a critical state that is accompanied by significant structural damage and partial collapse. The combination of these two actions must be seen in a relatively wide time window when one studies their effect on Cultural Heritage Structures. M. Cerone et al. [15], by investigating the influence of the soil together with earthquake forces on the Colosseum in Rome (Italy), concluded that the registered collapses are due to the combination of soil movement together with the earthquake activity over the centuries and the continued lack of maintenance. The most detrimental state of stress is that resulting from uneven foundation settlement [4]. Heavy structural damage develops as a result of such actions because the resistance of unreinforced weak-mortar masonry to tensile or shear stress demands is rather low and is accompanied by a brittle type behaviour. In many cases, this resistance is in effect even lower than assumed due to poor maintenance conditions.
Initially, a summary of observed case studies is presented that ascertains the previously stated rationale. Next, a simplified numerical process is presented which can assist the evaluation of the performance of such stone masonry structural systems in the framework of either explaining the observed structural damage or predicting it in advance in order to prohibit its development with certain retrofitting counter-measures [16]. Summary results from specific tests are also presented towards verifying assumed in-plane sliding shear strength values.
From a variety of stone masonry structures a particular typology is selected to be investigated here. This is because its use is widespread and as such its performance has been studied by the authors for quite some time. This structural system is utilized in many Greek Christian churches, with a number of variations in plan and height [10,
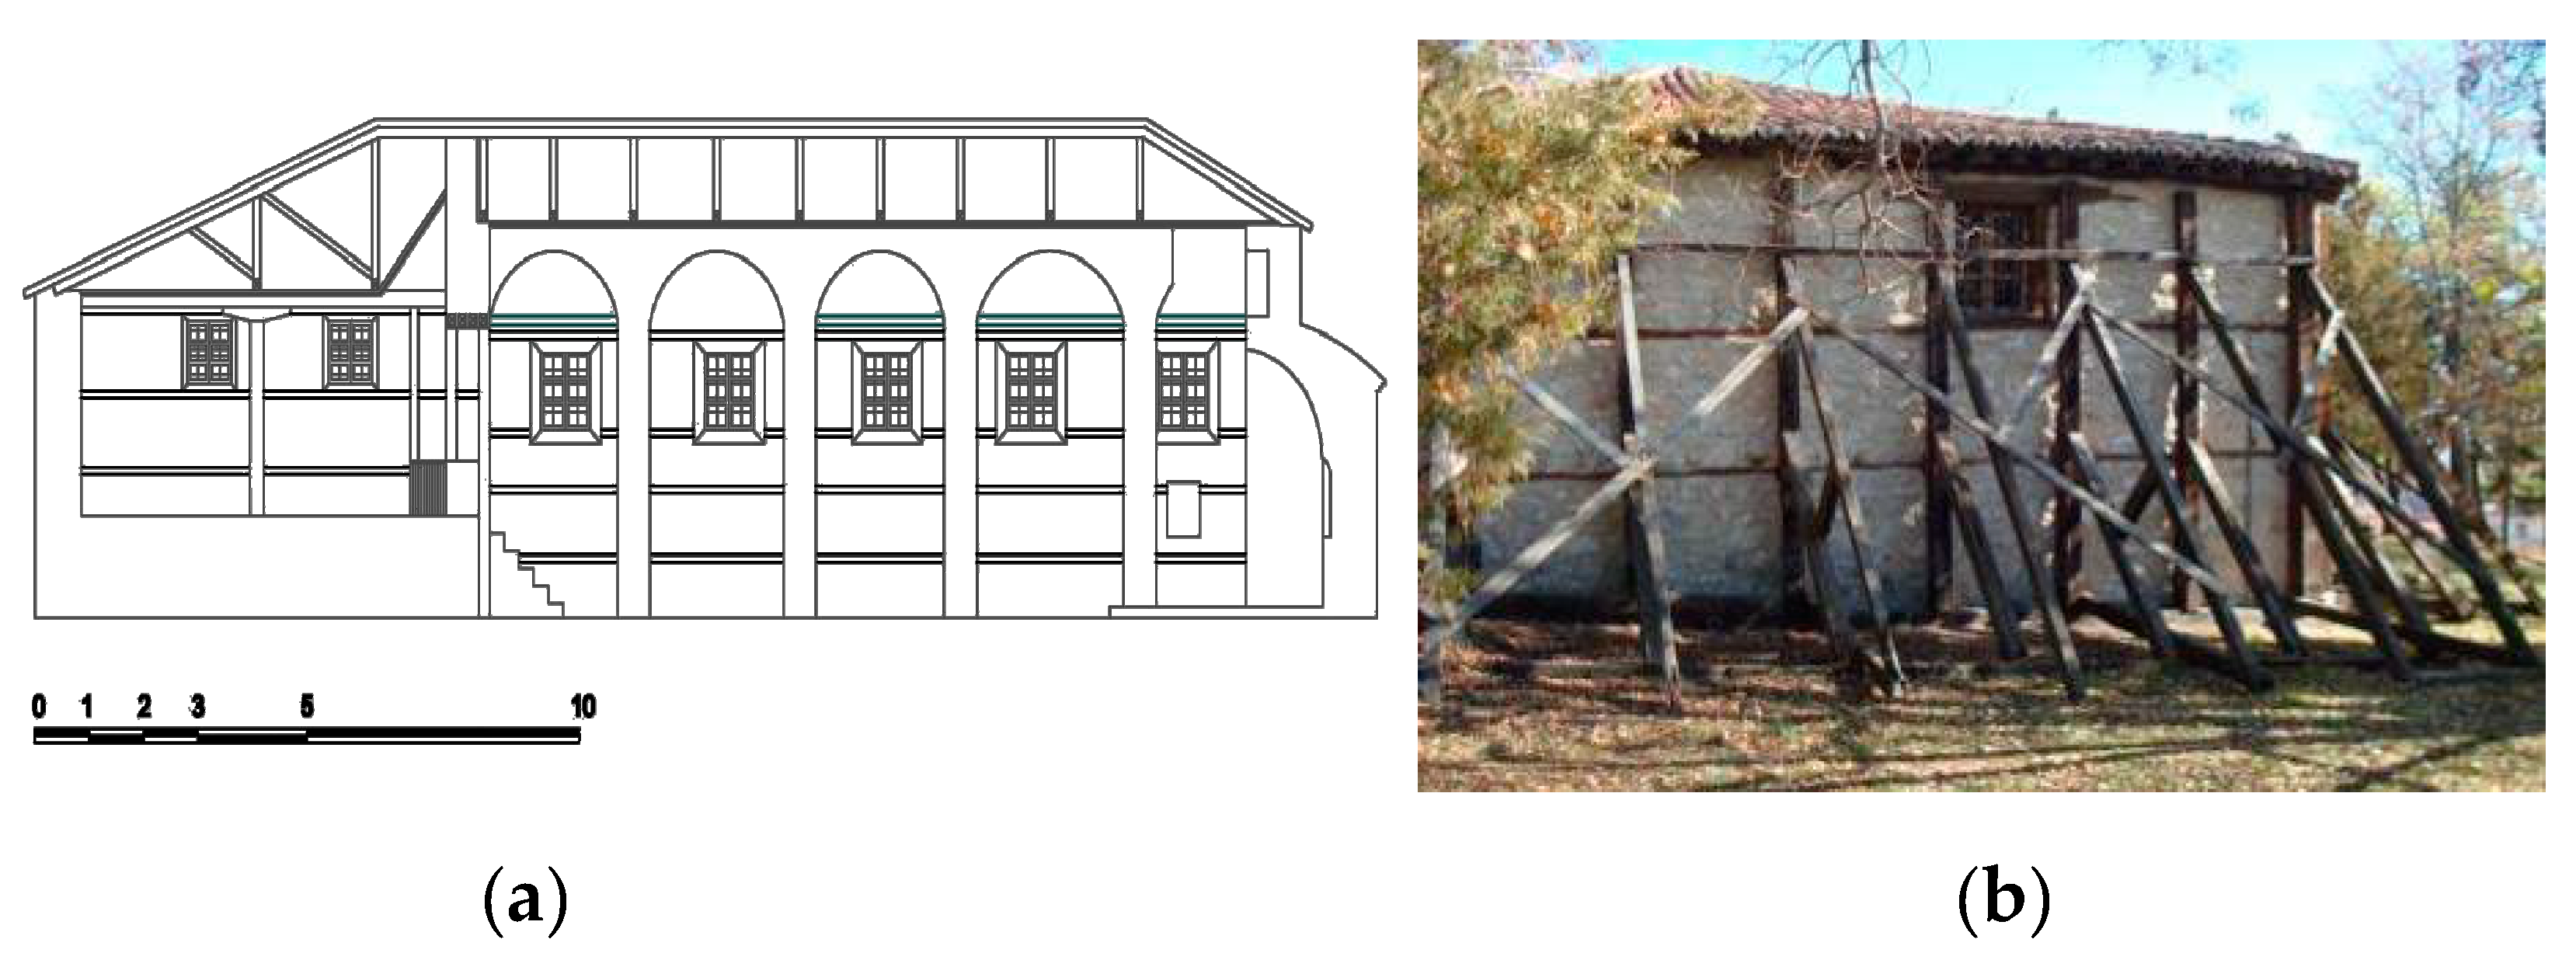
12], belonging to the so called “Basilica” typology which is one of the oldest structural forms. This “Basilica” structural system is of rectangular shape, formed by relatively thick peripheral masonry walls; a semi-cylindrical apse is usually part of the East wall, whereas the interior is divided into a number of naves by longitudinal colonnades of various dimensions and shapes, as shown in Figure 1a. The roofing system develops mainly in the longitudinal direction and usually rises for the central nave at a higher level than that of the side-naves, being seen as an elevated extension of the interior colonnades. The roofing system that covers the side naves is partially supported on the peripheral walls and is usually lower than the roofing of the central nave (Figure 1b). In some instances this structural type takes the simplest form of one nave with no internal separations.
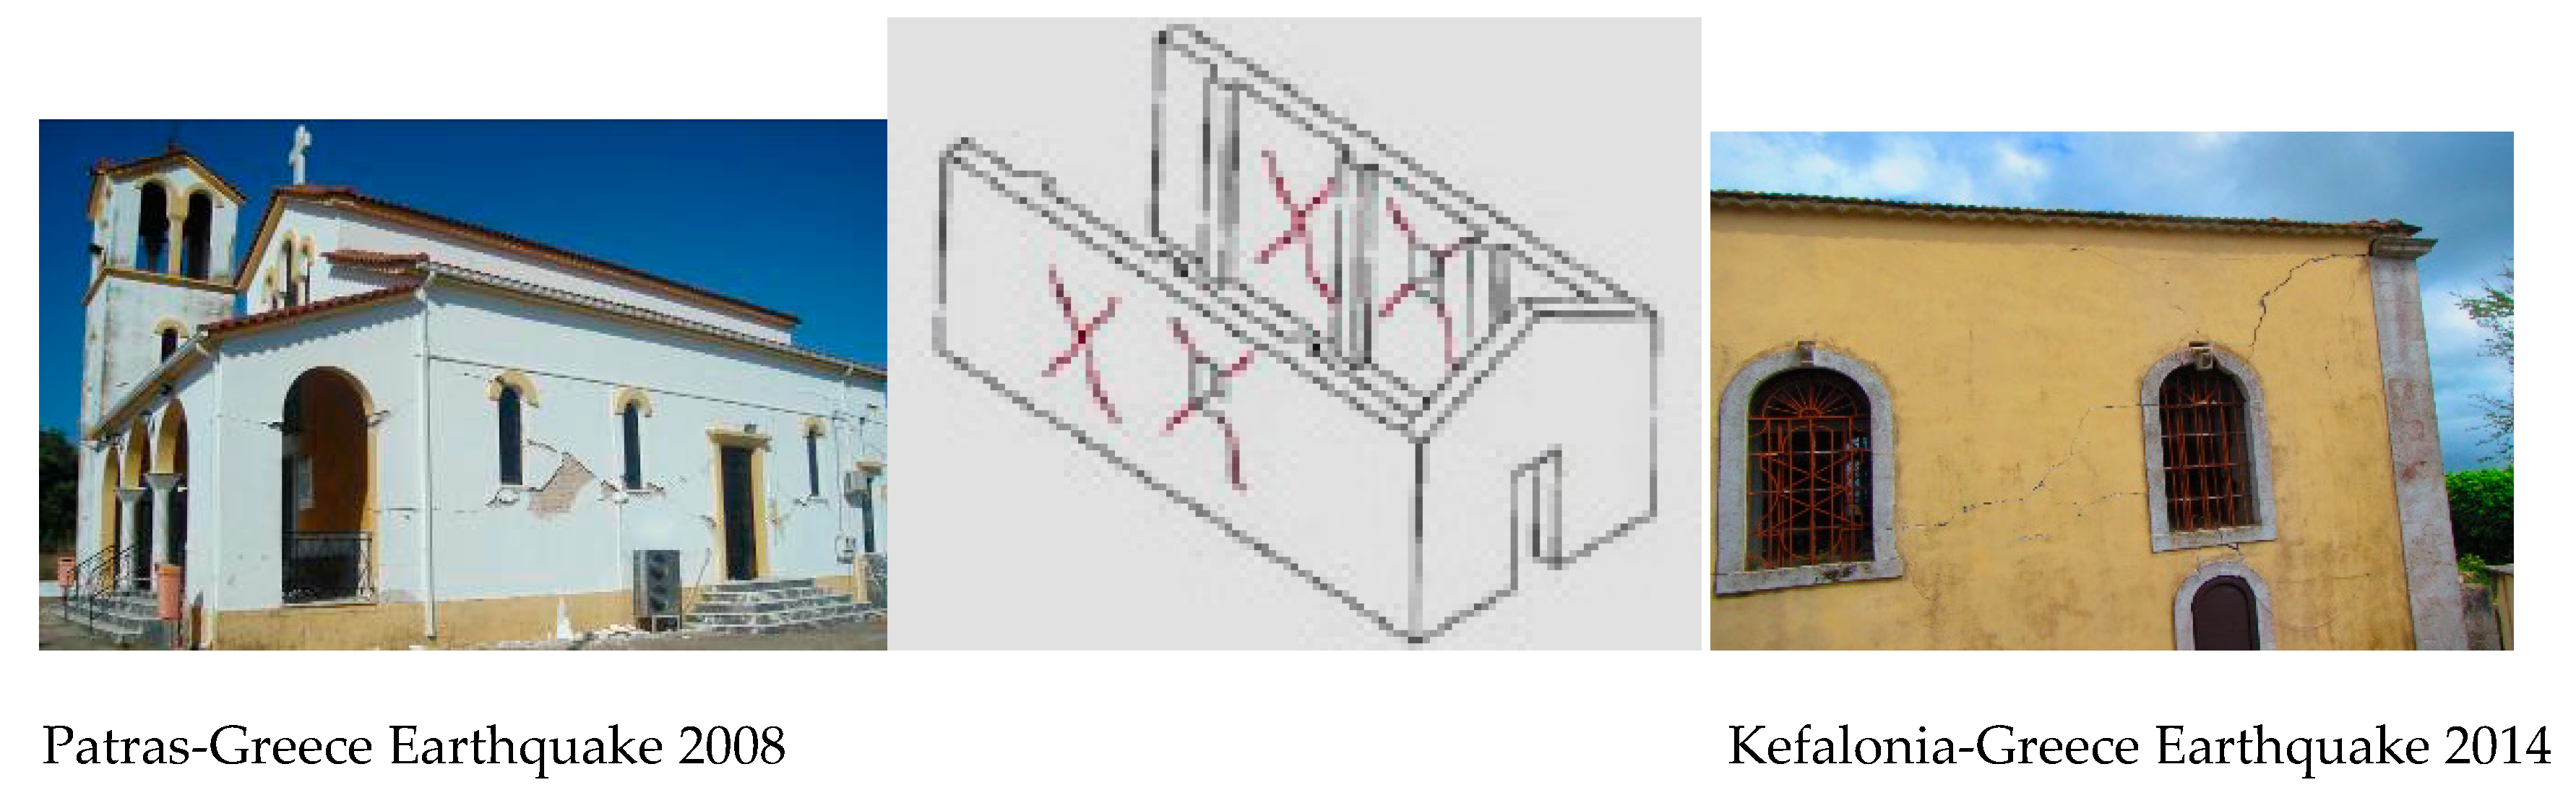
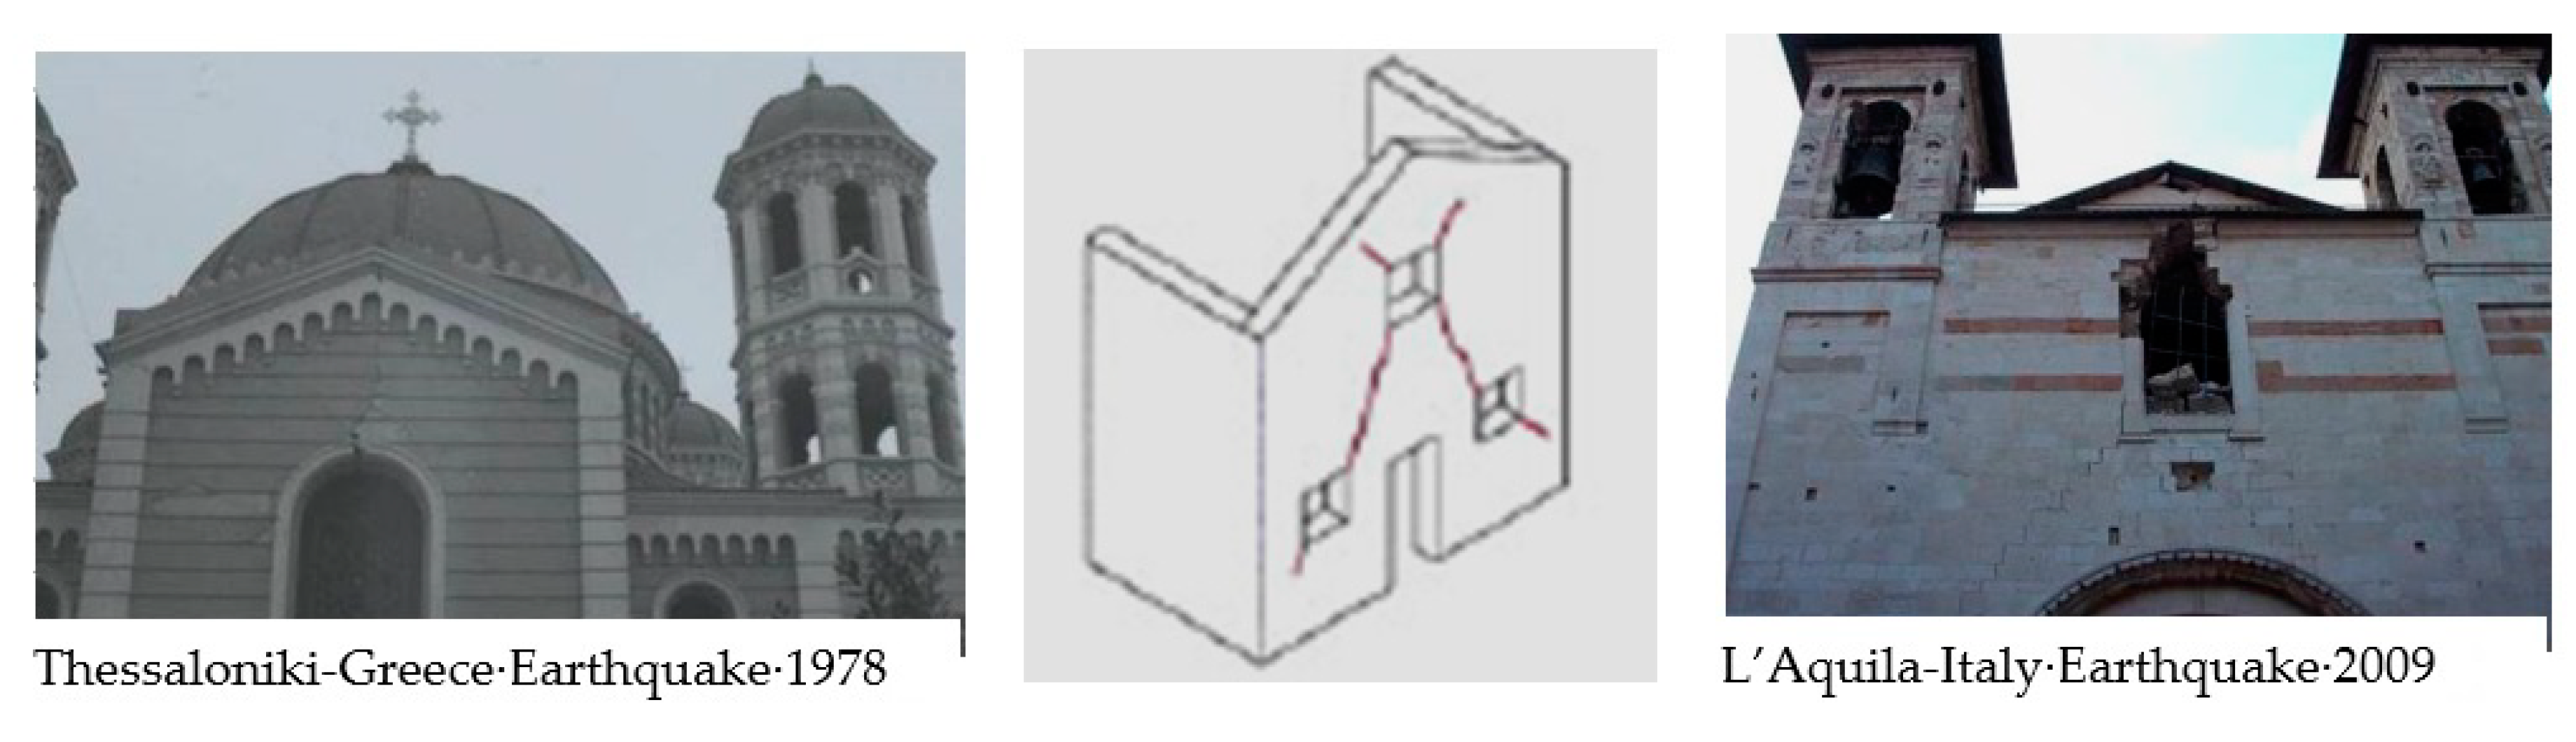
The longitudinal and transverse walls of such structures are usually long and thick with very large in-plane stiffness. These walls are interconnected to form the main part of the total 3-D structural system, which mainly resists the horizontal earthquake forces [10,12]. Moreover, any change of shape imposed by soil-foundation settlement, because of the large in-plane wall stiffness, leads to considerable stressing of these planar structural elements and their interconnections [
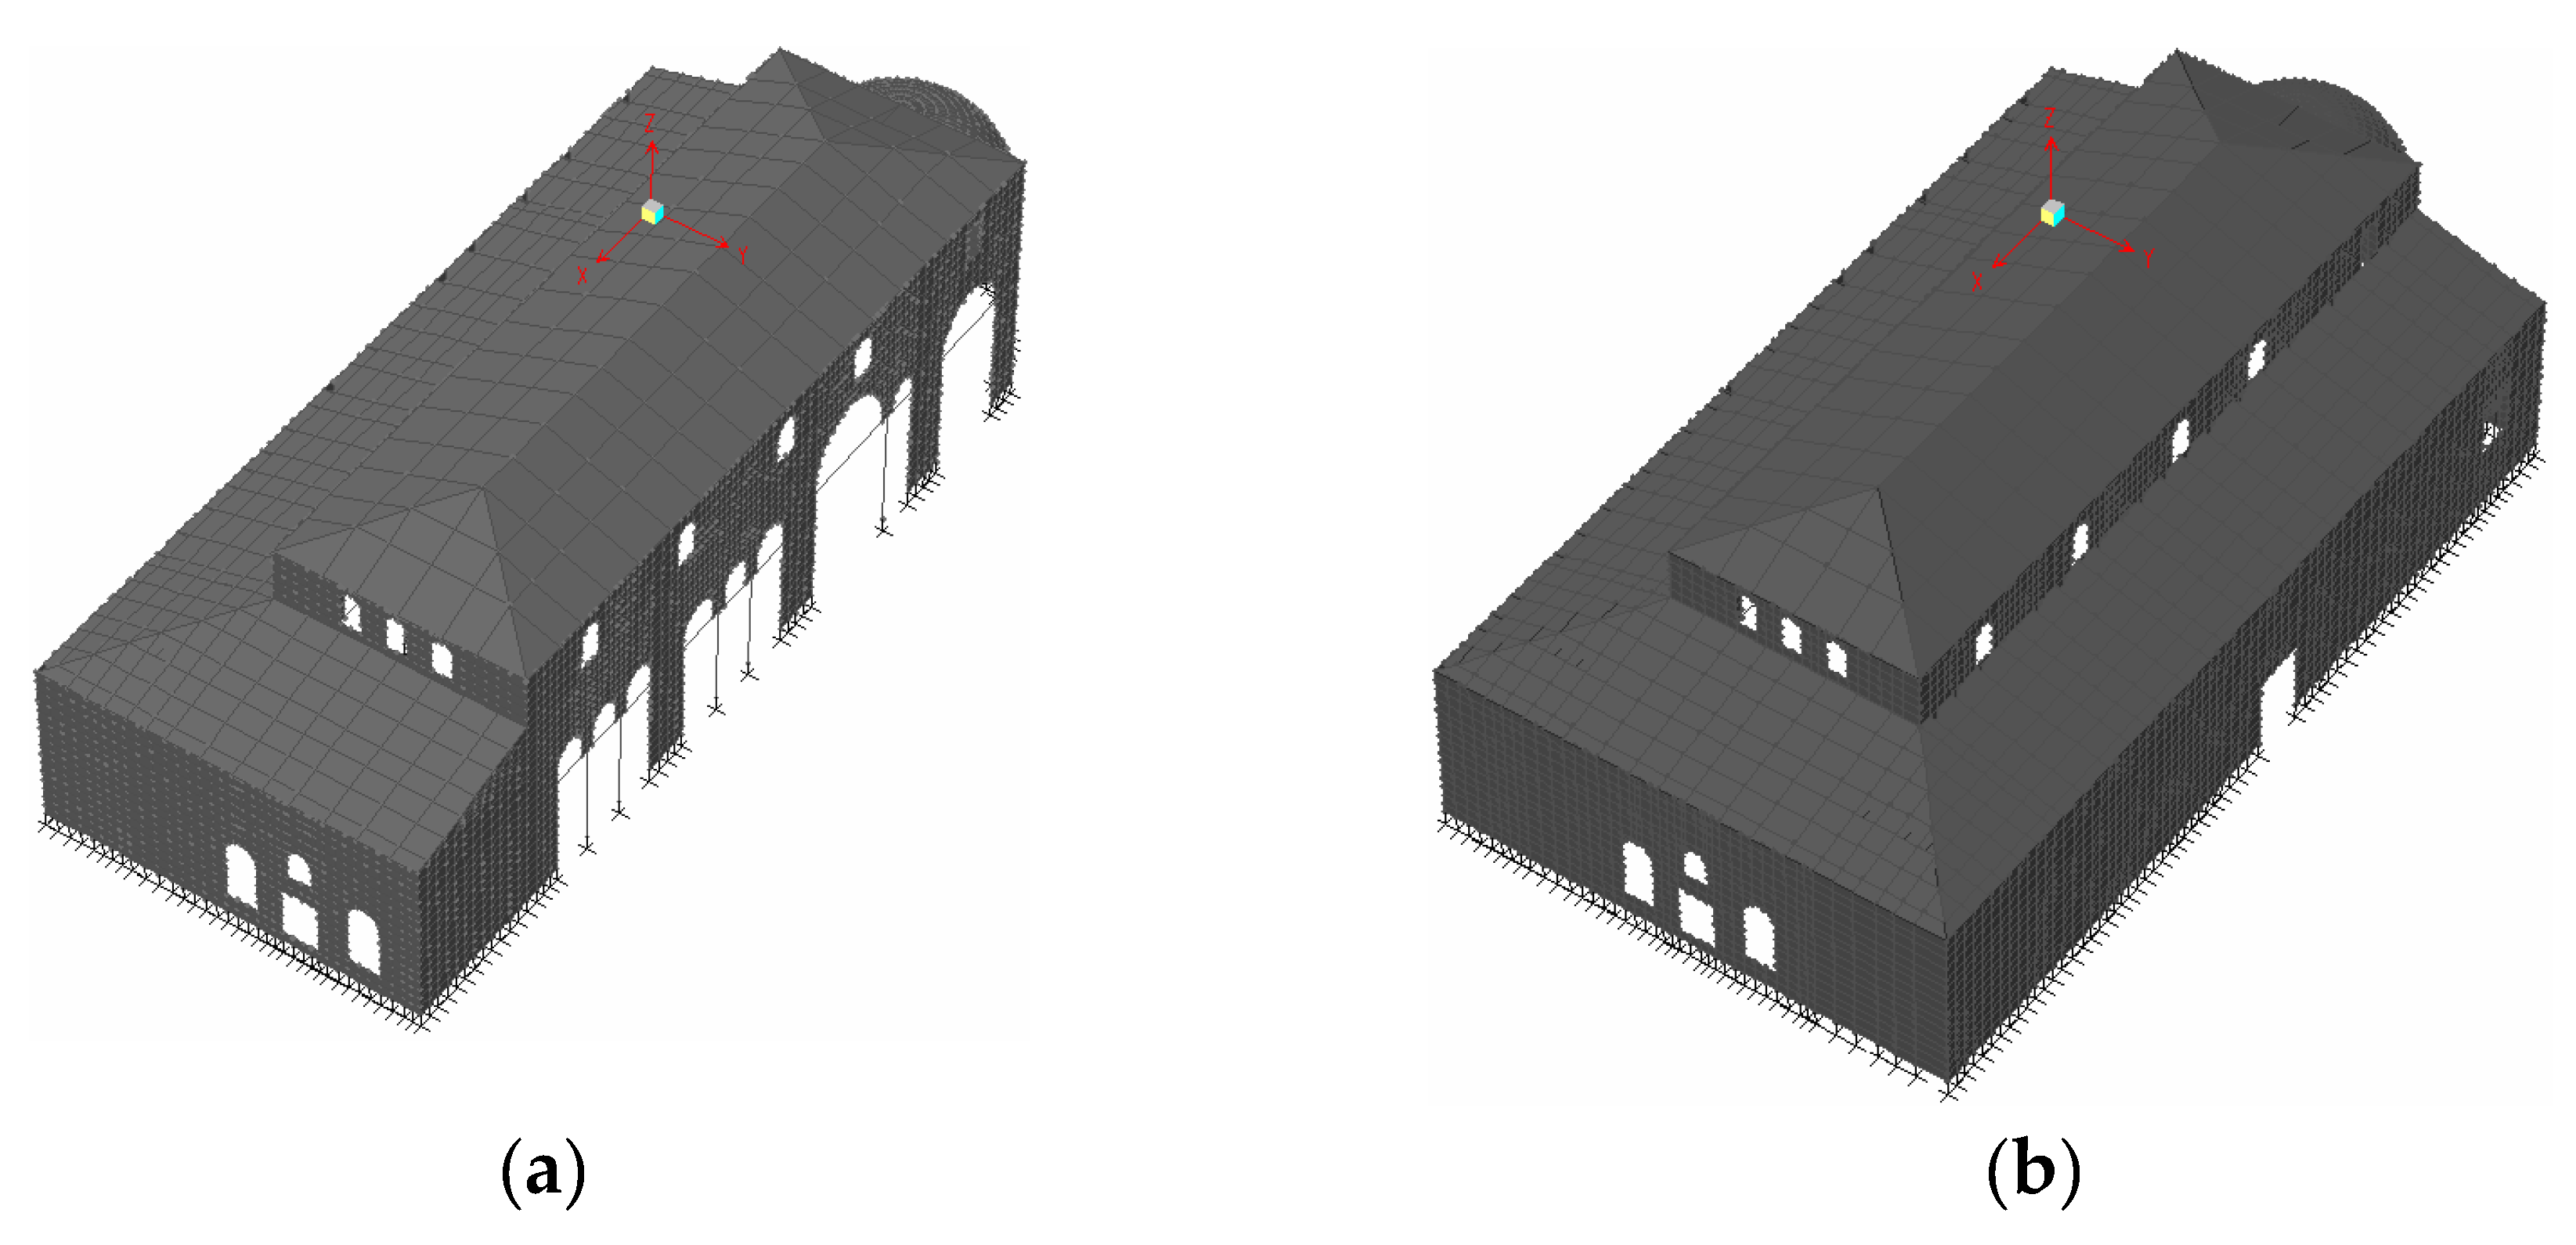
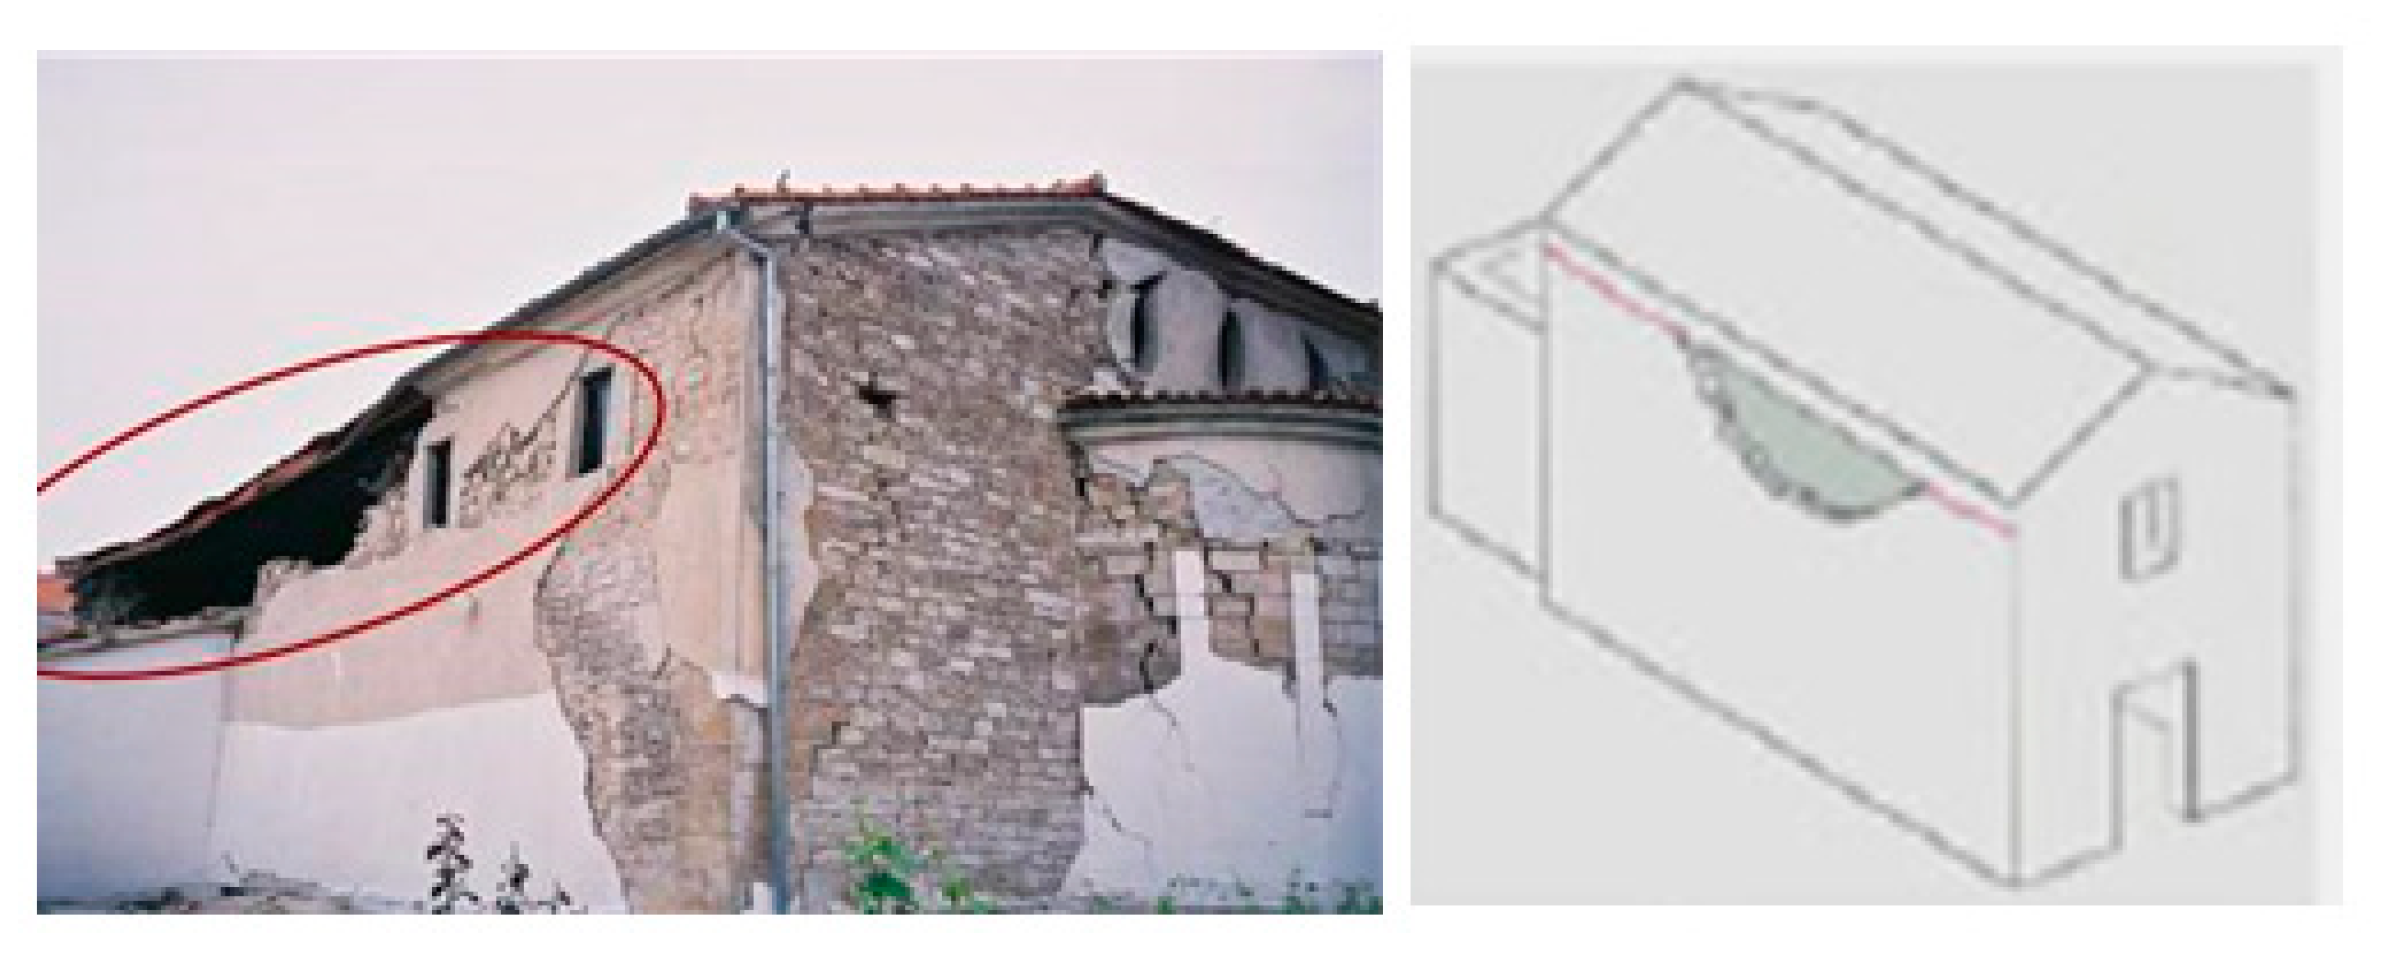
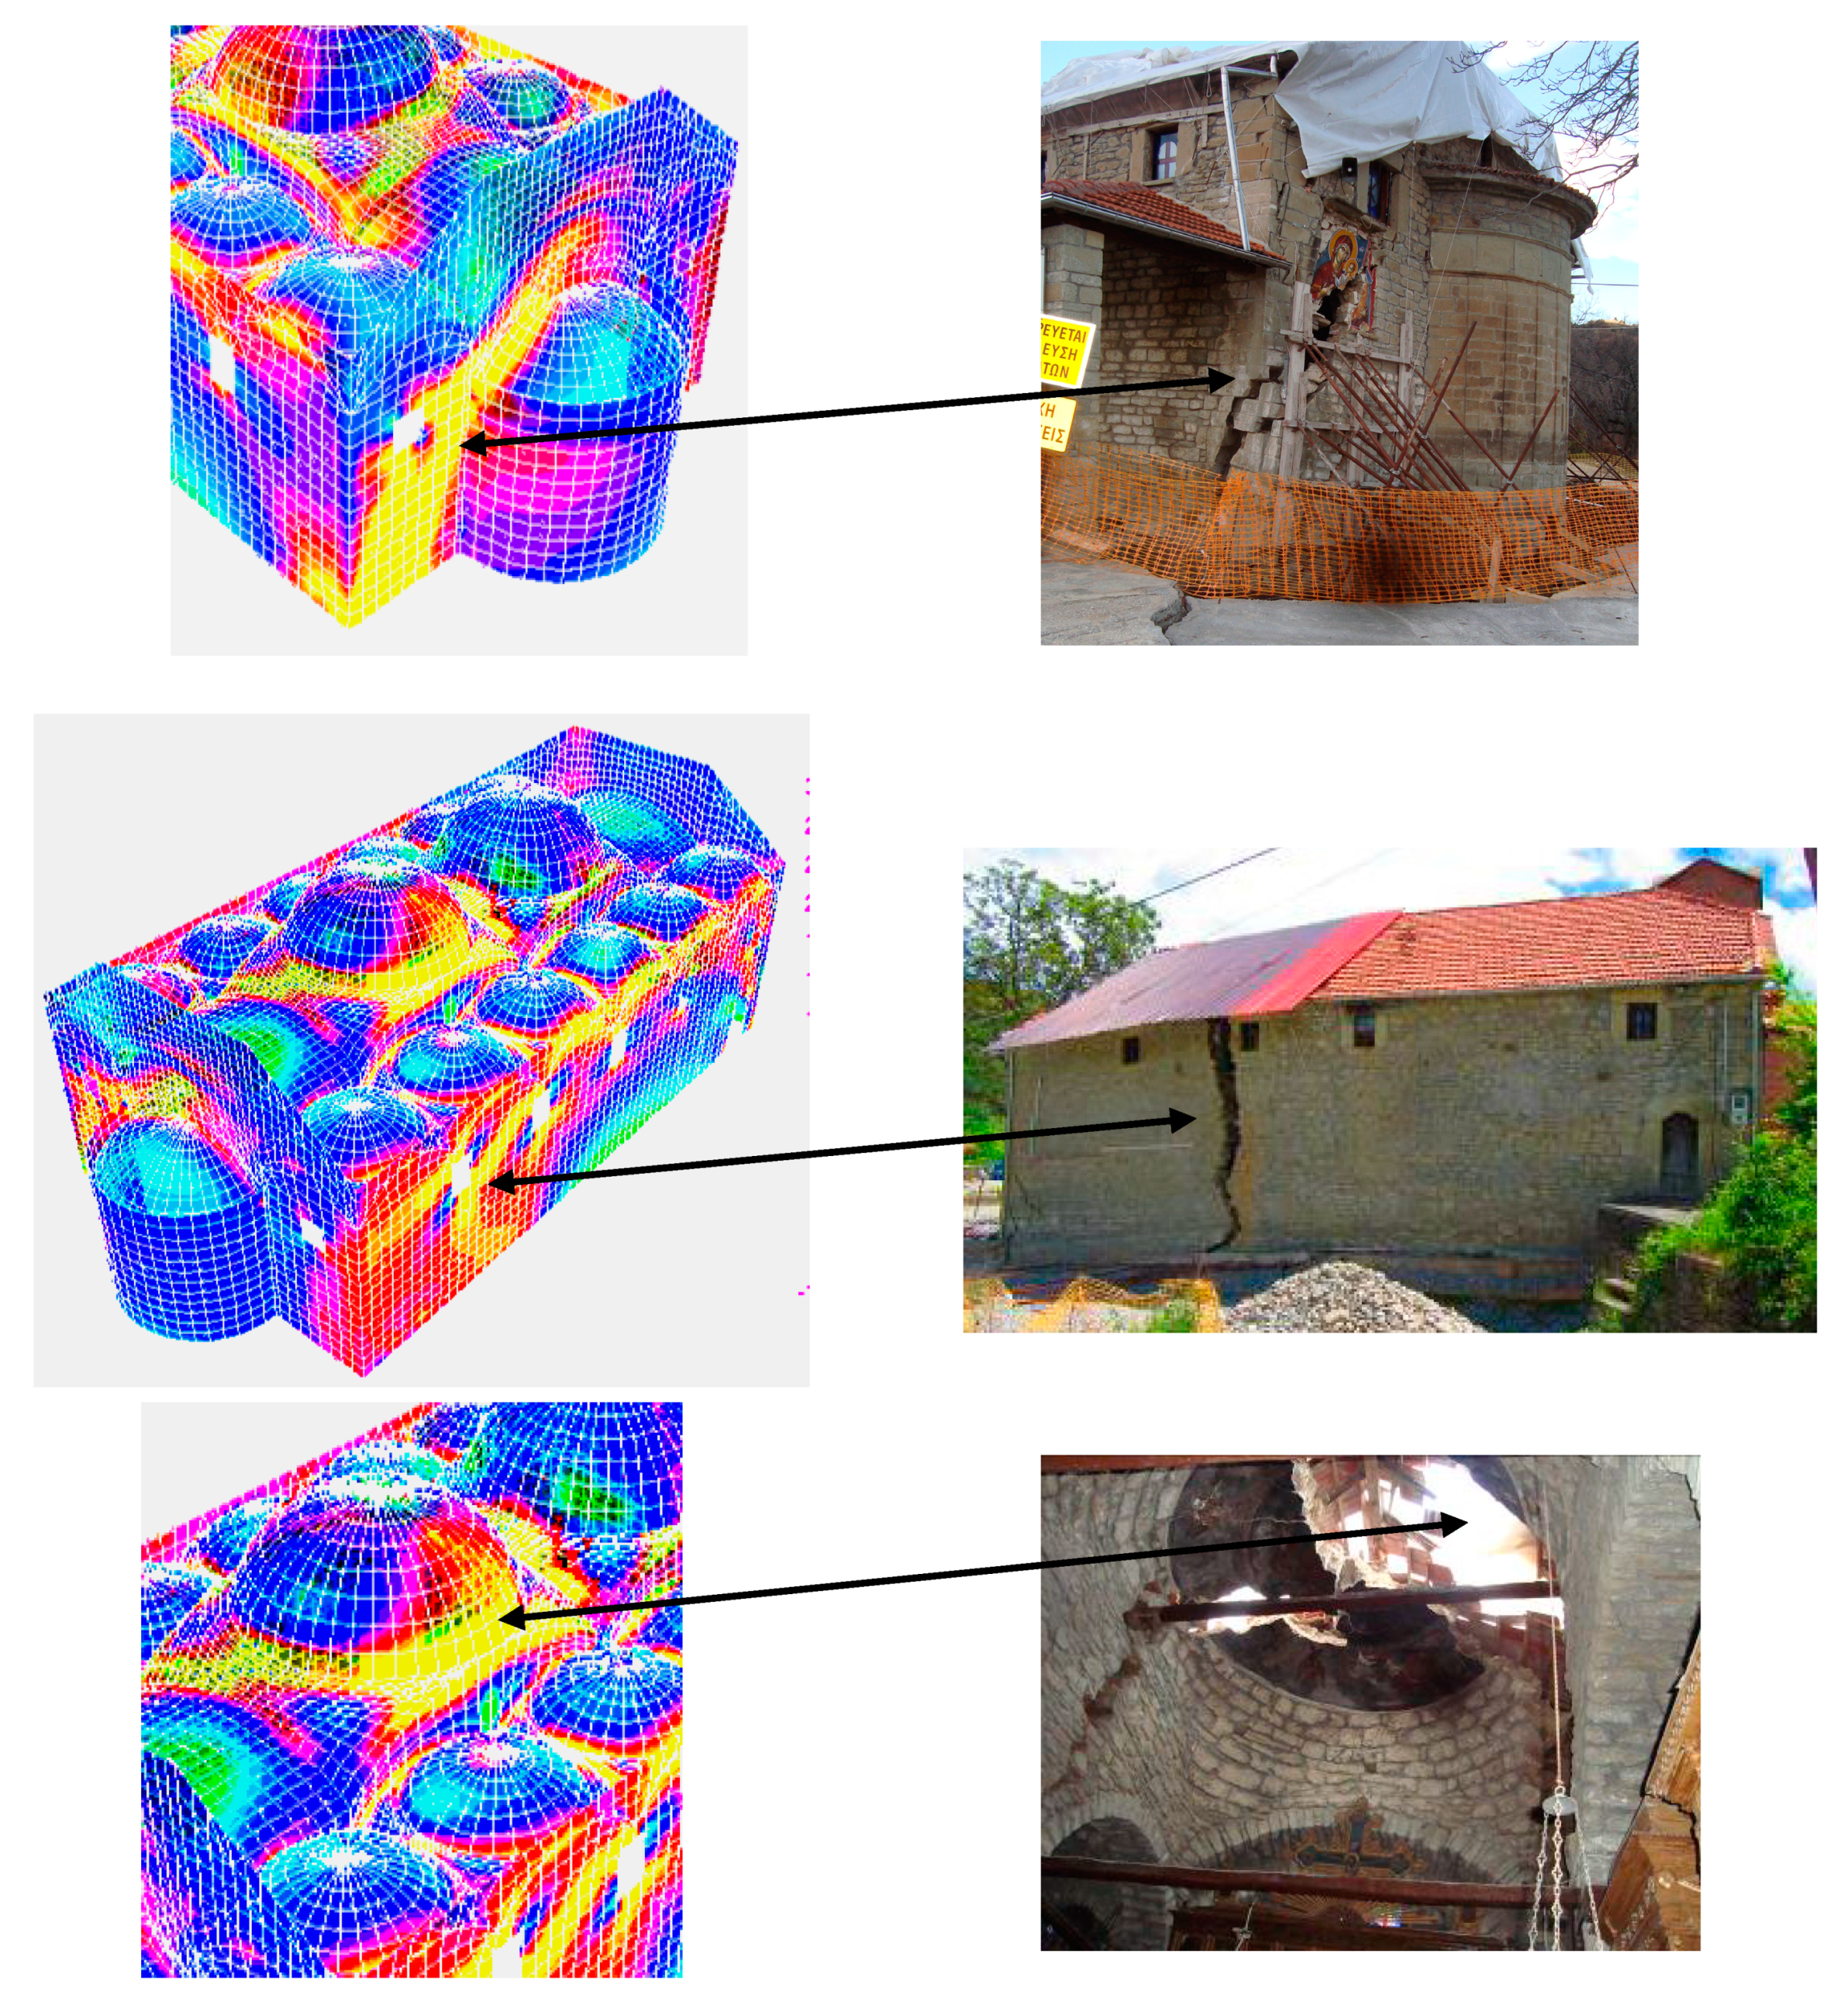
4]. In some cases, these planar masonry walls as well as the internal colonnades support a simple or complex relatively stiff masonry vaulting that is in turn protected by a wooden roof (
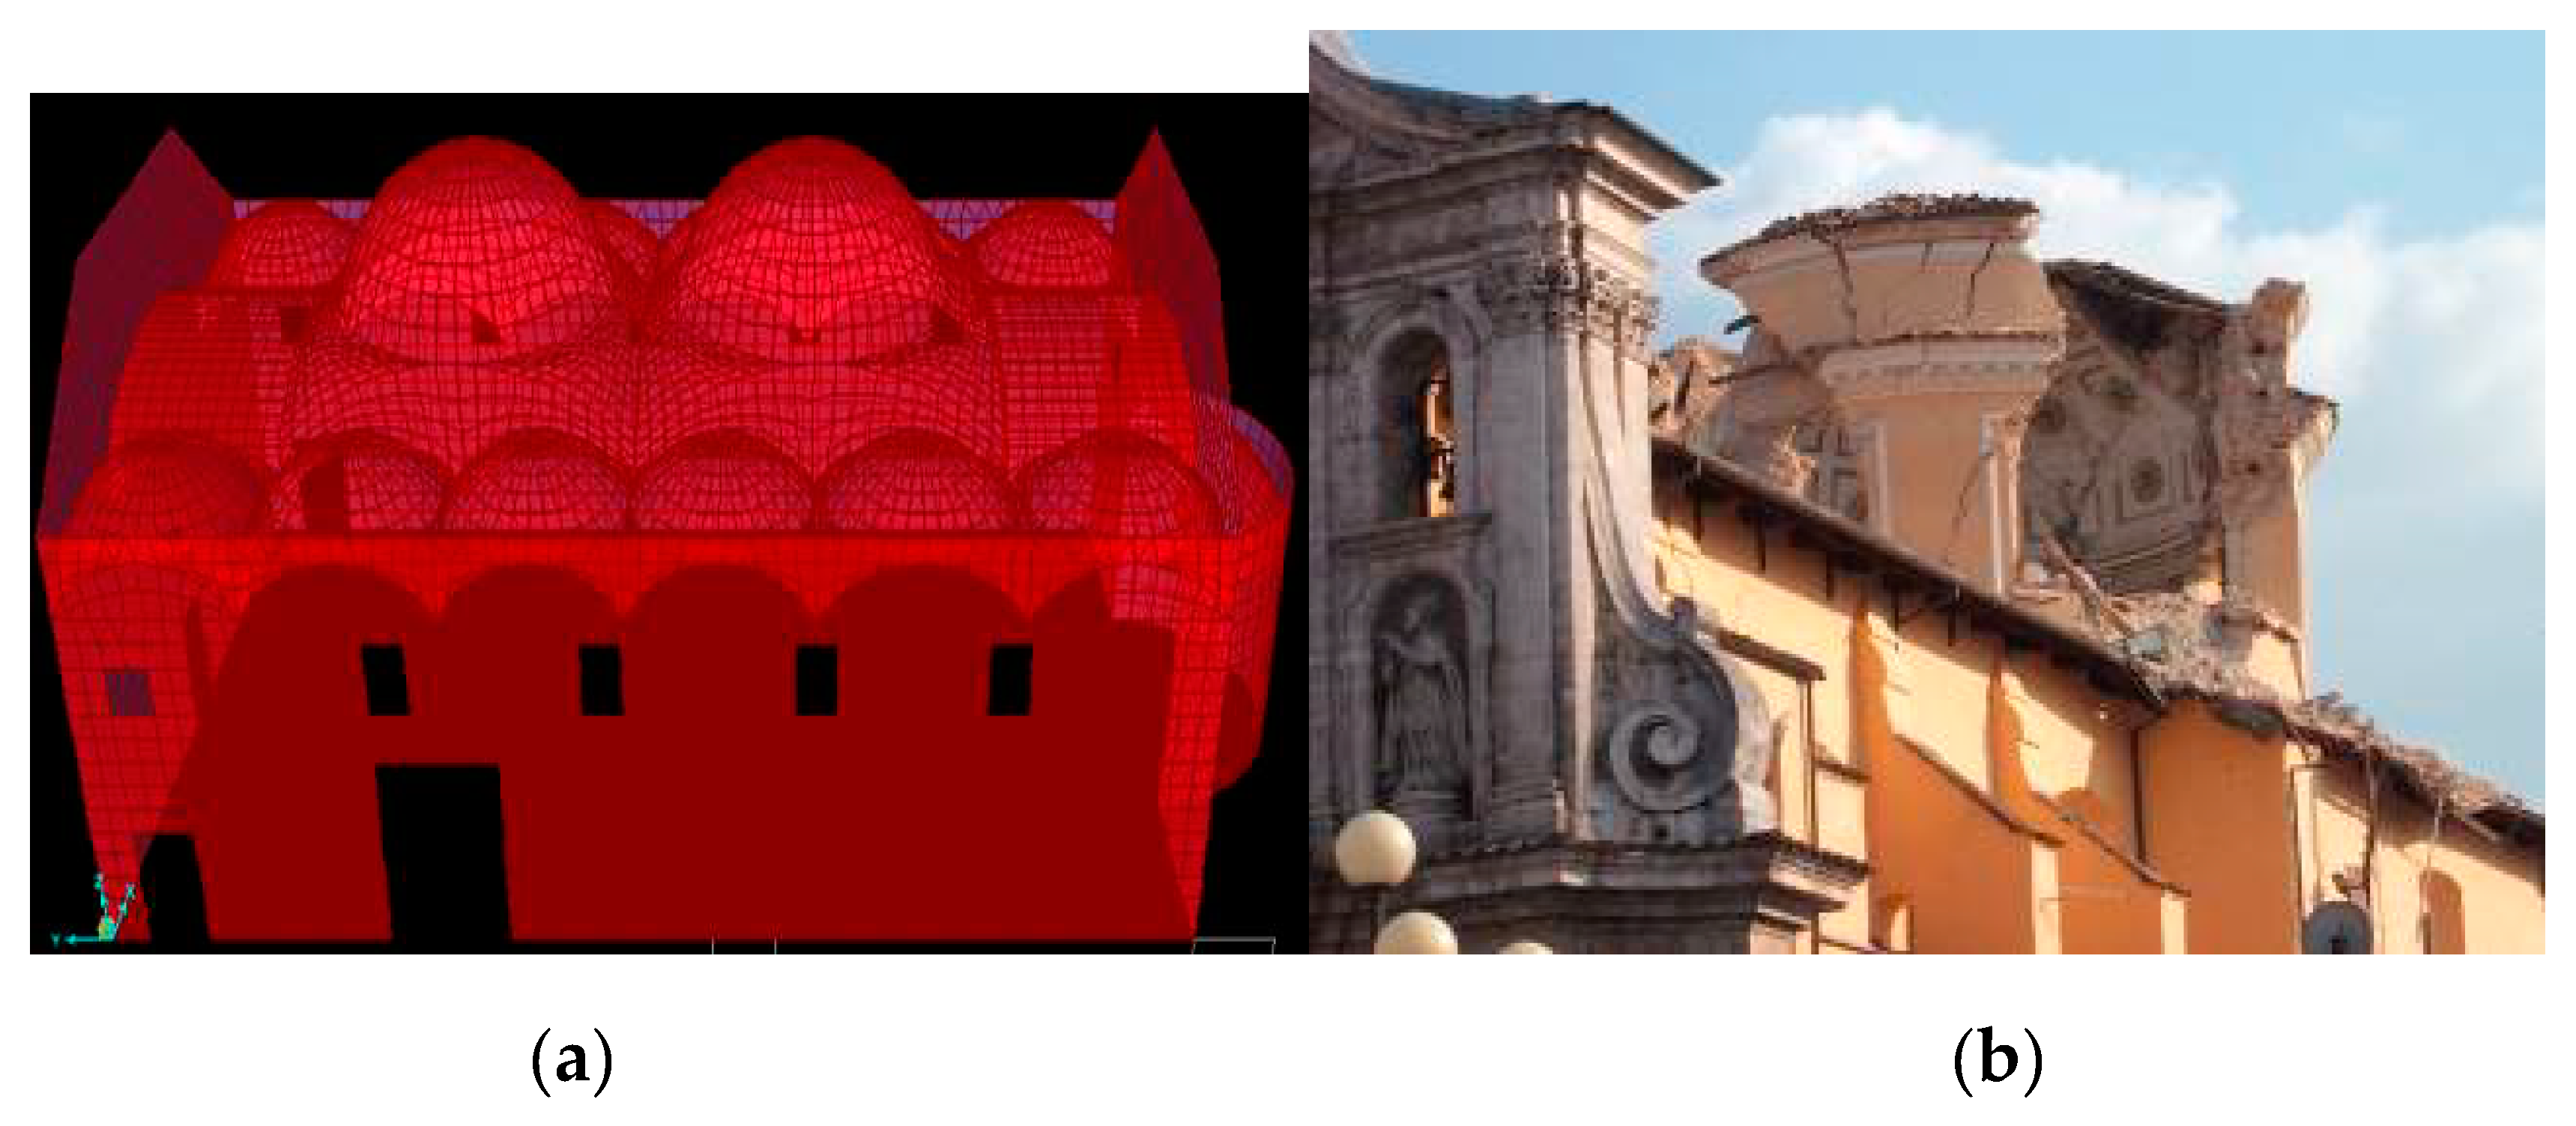
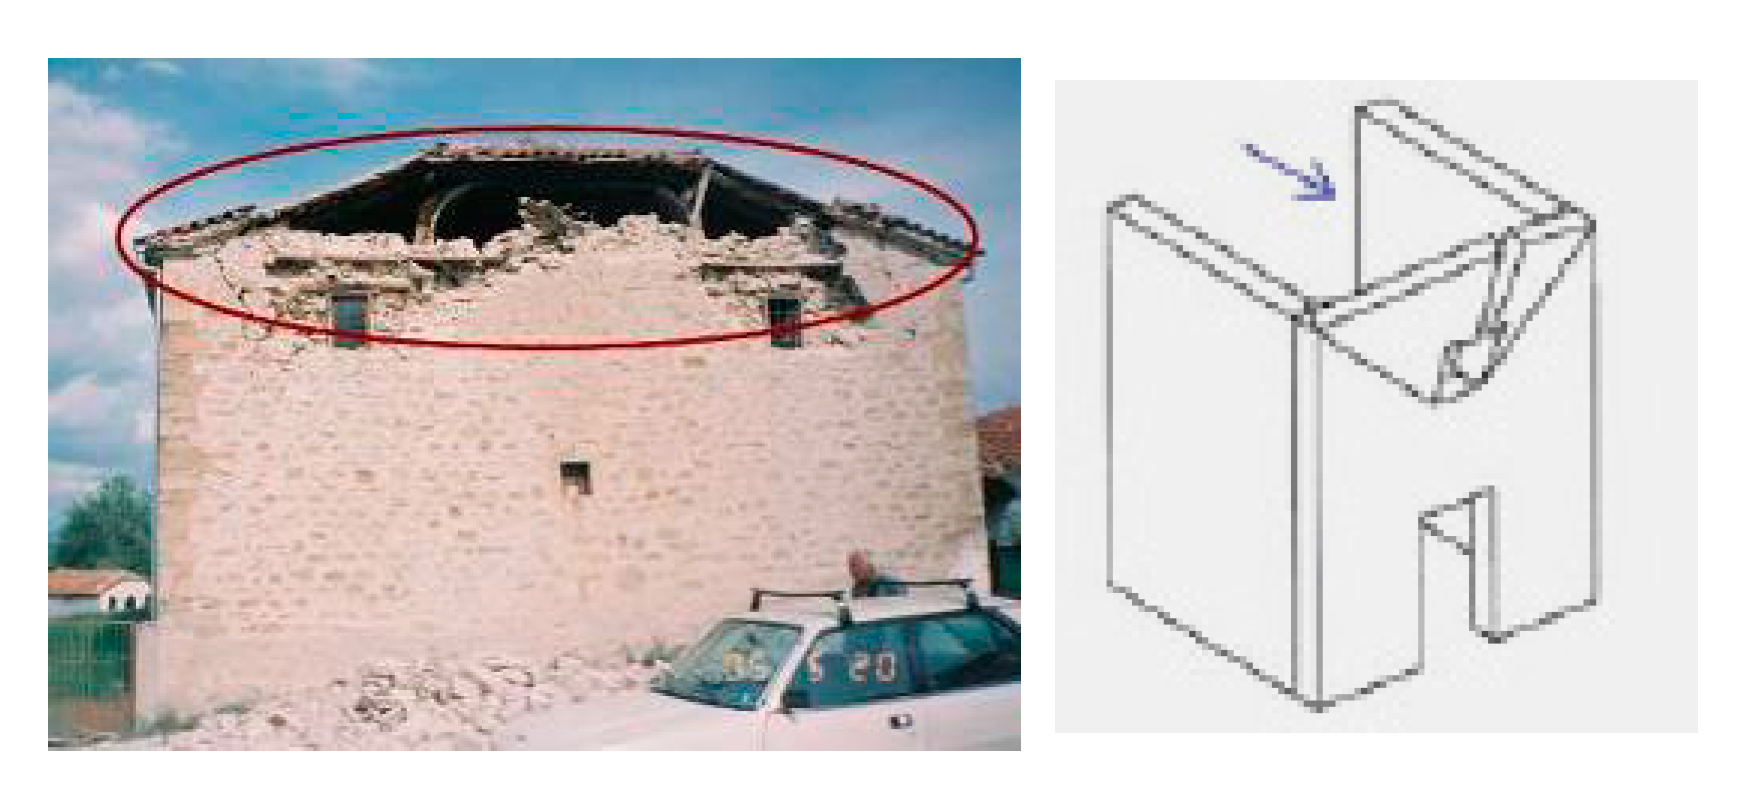
Figure 2a). The soil-foundation settlement and the resulting state of stress-strain that develops on these planar masonry walls spreads also to such masonry vaulting. Therefore, the resulting structural damage develops in either the planar walls or/and the vaulting. Such relatively heavy masonry vaulting also generates large inertia forces in case of a strong earthquake ground motion, which in turn result in large tensile and shear stress demands that can be detrimental for the structural performance of the masonry planar walls and/or the masonry vaulting. Figure 2b depicts a typical damage pattern with the collapse of the central masonry dome [14].

2. Summary of Observed Case Studies

2.1. Foundation Settlement

In what follows, two distinct cases of foundation settlement are presented. In the first case the uneven deformability of the soil caused considerable damage to the “Basilica” church of the Assumption of the Virgin Mary at Dilofo-Voio-Kozani, built in 1844 A.D. Its basic dimensions are 21.5 m long (together with the apse of the East wall) 11 m wide and a maximum height to the top of the wooden roof of 10 m.
A stone masonry vaulting superstructure (Figure 2a) rests on the peripheral walls as well as on internal five-column twin colonnades. The largest portion of the South-West plan of this church is founded on relatively hard soil (weathered flysch layers) whereas the North-Eastern part, from the North-East corner up to the East part of the North wall, is founded on silty clays that were deposited over the years on top of the flysch layers prior to building the church. Soft soil layers were also added to compensate for the natural slope at this location in order to form a horizontal plane to construct the foundation of the church. A number of boreholes were made close to the East (Figure 3a) and North (Figure 3b) sides; they revealed that at the North-East corner the silty clay layers extended to a depth of 7 m.
The uneven settlement of the foundation of the stone masonry walls as well as of the internal columns caused considerable structural damage that progressed to the partial collapse of the whole North-East part. An external view of this church from the South-East is shown in Figure 3a. Extensive damage developed due to considerable settlement at the South-East corner. A very wide crack started off at the top of the East peripheral wall near the apse and propagated towards the bottom of this wall near the South-East corner. Furthermore, a wide crack propagates through the North peripheral wall from top to bottom as is shown in Figure 3b. It must be noted that the thickness of these masonry walls varies from 750 mm to 800 mm. From this extensive peripheral wall damage the vaulting system that is supported by these peripheral walls also suffered extensive severe cracking that eventually led to its partial collapse. The partially collapsed central dome is shown in Figure 3c.
Another case of foundation settlement of a Post-Byzantine three-nave Basilica is that of the church of Profitis Ilias at Siatista–Kozani, built in 1701 A.D. on the top of a hill. This time the damage, caused by the long term foundation settlement combined with the strong earthquake motion of May 1995, is less spectacular than that shown in Figure 3a–c. This church is a three-nave “Basilica” with a wooden roof without a stone masonry vaulting system. The horizontal dimensions of this church are 23.25 m in length and 16.60 m in width. The top of the roof lies at 7.1 m from the floor level of the interior of this church. The naves are formed by four-column twin colonnades (Figure 4a) built with stone masonry. The structural damage is in the form of inclination of the South longitudinal wall outwards, shown in Figure 4b together with its temporary wooden shoring. This is accompanied by extensive cracking at the connections of this wall with the East and West exterior masonry walls as well as with the mid-transverse wall. Cracking is also evident at the arches of the internal colonnades.

2.2. Damage due to Strong Earthquake Ground Motion

Figure 5 and Figure 6 depict the in-plane typical damage patterns of the longitudinal and transverse masonry walls for a number of stone masonry “Basilica” churches. Figure 7 and Figure 8 depict out-of-plane typical damage patterns of the longitudinal and transverse walls for two cases of stone masonry “Basilica” churches. Initially, a simplified assumption is that the various planar and vaulting masonry structural elements are well interconnected at their intersections as well as with the wooden roof and the foundation. The simplified numerical evaluation process presented in Section 3 is based on this assumption. However, in many cases, like those depicted in Figure 7 and Figure 8, failure of the connection between the wooden roof and the masonry wall results in loss of support for parts of the masonry walls leading to out-of-plane partial collapse. Therefore, it is realistic to consider the effect of limit stage conditions at the interconnection of the various masonry structural elements either at the corners of longitudinal and transverse planar walls or at locations where planar walls are joined with the wooden roof or the soil-foundation interface. This is studied in Section 5 utilizing the strength values listed in Table 2.

3. Simplified Numerical Evaluation Process Assuming Non-Failing Masonry Wall Inter-Connections

In evaluating the dynamic and earthquake response of such masonry structures it is initially assumed that the various planar and vaulting masonry structural elements are well interconnected at their intersections as well as with the wooden roof and the foundation.
At this “
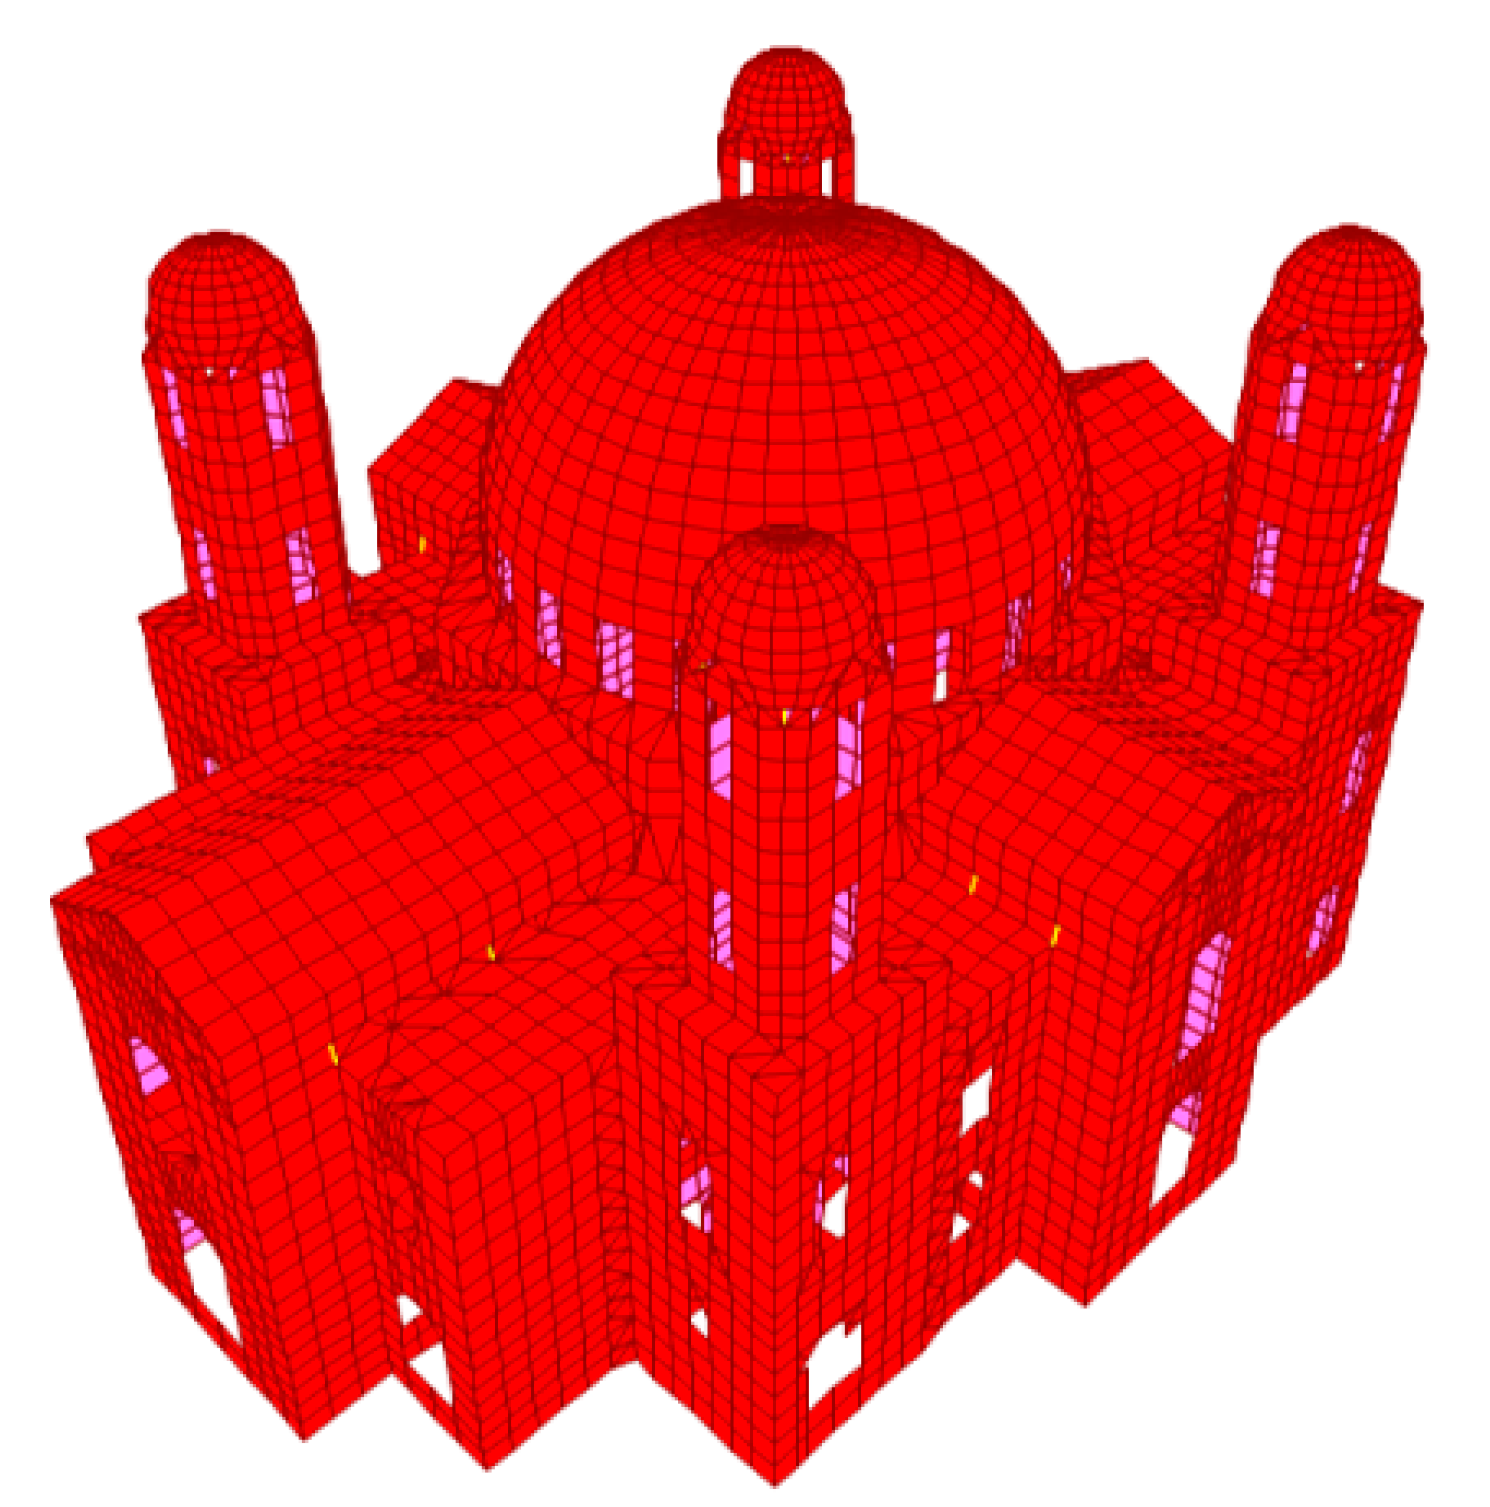
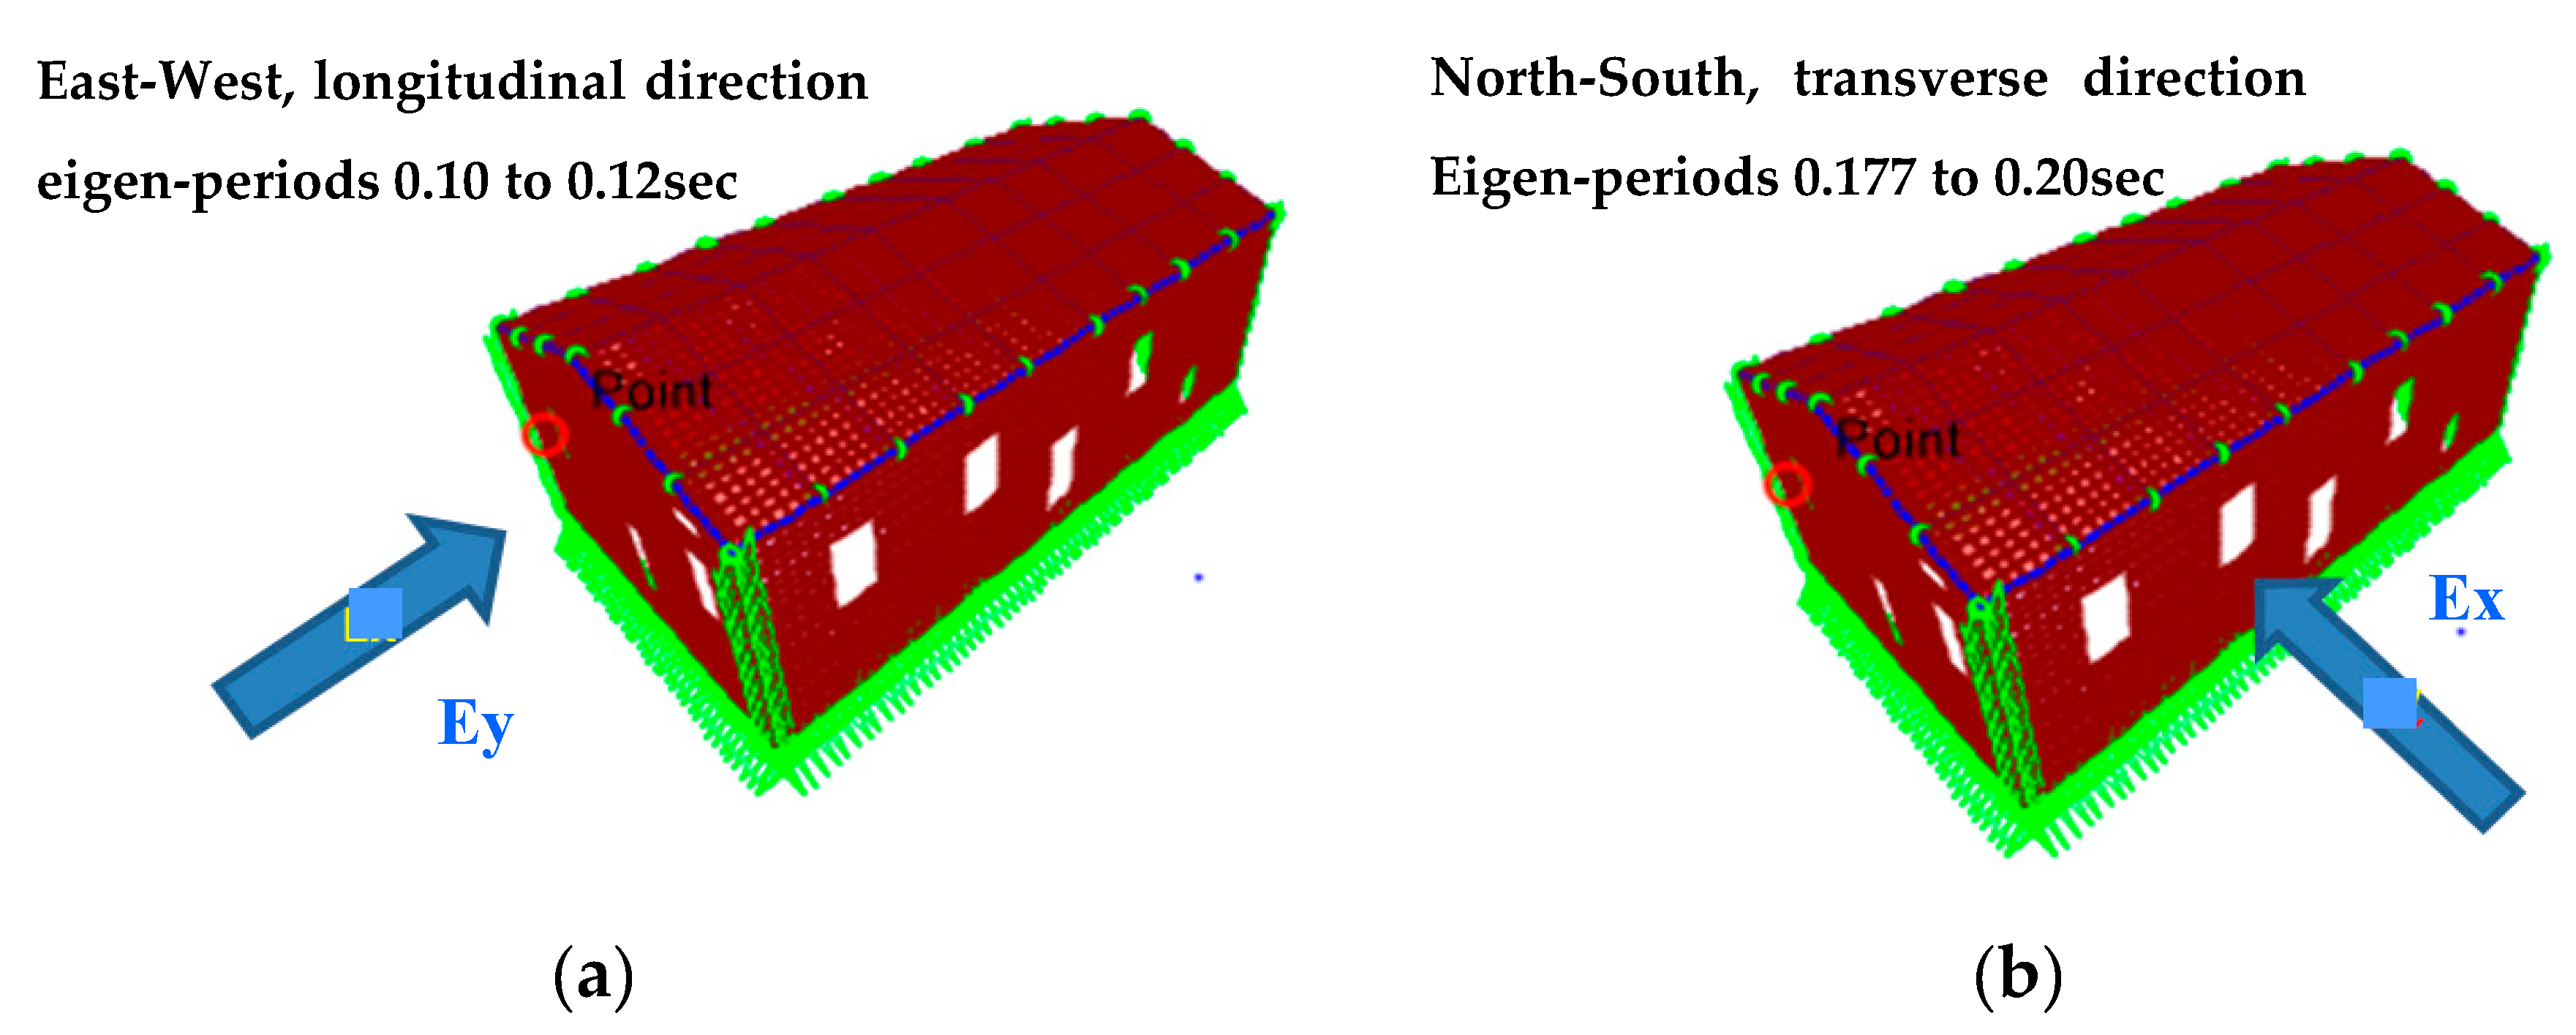
first stage” evaluation, the performance of each particular structural element is assessed individually, assuming that these interconnections are withstanding the imposed demands without any form of damage. Assumed elastic properties are adopted for each individual masonry structural element in order to approximate its in-plane and out-of-plane stiffness characteristics. The actual main architectural features are used to form a three dimensional (3-D) numerical model of the whole structural system, as shown in Figure 2a and Figure 9. This linear elastic numerical model is further simplified by utilizing shell elements for numerically simulating each masonry structural element thus approximating the in-plane and flexural (out-of-plane) stiffness without having to actually portray the masonry structural thickness in this numerical approximation.
Towards this objective, appropriate software packages are utilized in order to form this 3-D numerical model [17,18]. It is important at this stage to carefully check all the intersections in order to ensure that there is compatibility in the finite element representation of the 3-D actual structural system, despite the simplification introduced by the use of shell finite elements. The deformability of the foundation is also approximated in two different ways. First, deformable supports are placed under the foundation; these supports have elastic properties equivalent to the deformability properties of the underlying soil layers. Alternatively, layers of deformable soil are used and placed under the foundation of this numerical simulation. Manos and Kozikiopoulos [19] utilized in-situ measurements from a bell tower in Kefalonia island in order to approximate the stiffness characteristics of the underlying soil layers. Moreover, a 3-D finite element approximation of flexible soil layers was utilized to obtain the stiffness properties of equivalent link elements used to replace the soil layer in a 3-D finite element representation of the structure together with its flexible foundation. This 3-D numerical approximation is subjected to a variety of load combinations that include the gravitational forces as well as snow or earthquake loads, described by relevant design provisions. The outcome of such a numerical study is deformation and stress demands SEd for each masonry structural element. These stress demand values (SEd) are next utilized together with corresponding capacity values SRd obtained on the basis of assumed strength values for the stone masonry for the studied churches. A set of such assumed strength values are listed in Table 2. In order to utilize current provisions for the design of masonry structural elements the numerically obtained deformation and stress demands for each masonry structural element is uncoupled into its in-plane and out-of-plane part. One of the main difficulties in assessing the capacity values for old stone masonry construction is the lack of experimentally verified strength values. In order to partially overcome this difficulty a number of specimens (
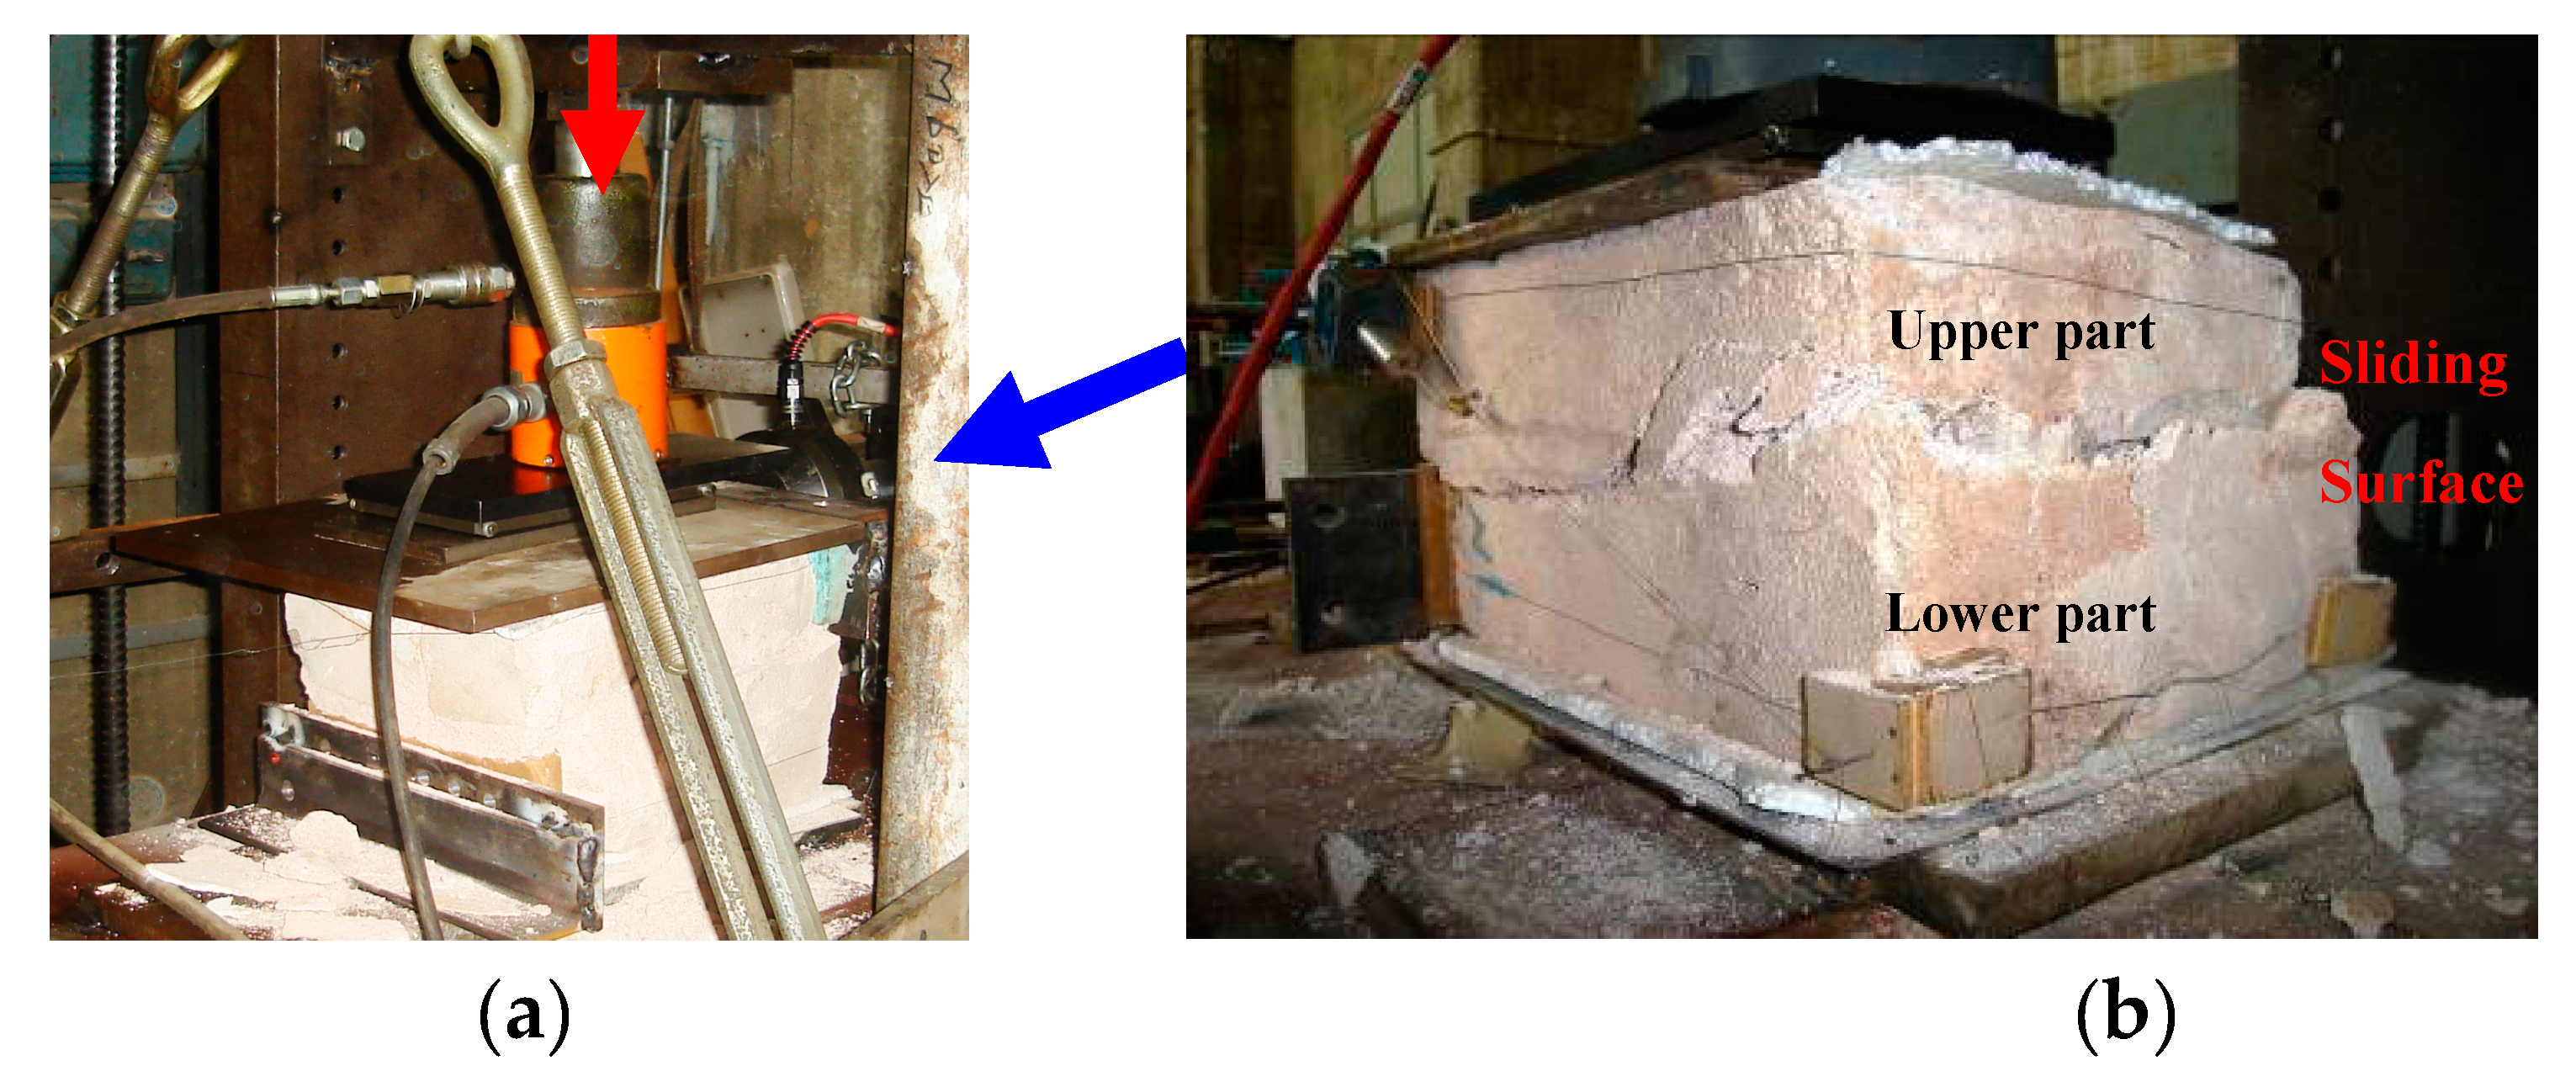
Table 1 column 1) were built employing irregular stones with a cubic compressive strength of 60 MPa and low strength mortar with a mean cubic compressive strength equal to 0.85 MPa. The mortar joints were relatively thick (approximately 25 mm). These specimens were approximately 370 mm by 270 mm in plan and 270 mm height. Each specimen was placed in a testing rig hosting a vertical jack with a load cell and a flat sliding bearing resting at the top surface of each specimen; each specimen had its bottom part securely fixed as shown in Figure 10a,b. In addition, a horizontal actuator was securely attached at the top part of each specimen in order to apply a horizontal load in a gradually increasing manner, keeping at the same time the vertical load constant at a predetermined level. The aim of this experimental setup was to force each specimen to fail in an almost horizontal sliding mode at an equivalent mortar joint located between its top and bottom part, as is shown in Figure 10b. The final objective of this experimental sequence was to be able to quantify the shear strength against the sliding mode of failure (fvk) through the parameters included in a “Mohr-Coulomb” shear strength criterion as is expressed by Equation (1). The shear strength of the stone masonry when the normal stress is zero is denoted by fvko. The compressive axial stress acting on the bed joint is denoted by σn and μ is an assumed value for the static coefficient of friction.
fvk = fvko + μ σn
Table 1 (column 2) lists the measured shear strength values together with the corresponding values of the compressive stress normal to the equivalent bed-joint (σn) applied during testing (Table 1 column 3). Employing formula 1 with values fvko = 0.12 MPa and μ = 0.45 the predicted sliding shear strength values are found, listed in Table 1 column 4. Reasonably good agreement is obtained between measured and predicted sliding shear strength, as is indicated by the relevant ratio of measured over predicted sliding shear strength with values listed in column 5 of the same Table.
The in-plane shear capacity of masonry structural elements based on such a “Mohr-Coulomb“ failure envelope, as defined through Equation (1) with a normal stress (σn) acting simultaneously, is also employed by Euro-Code 6 [20]. In this case, the value of the static friction coefficient is assumed to be equal to 0.4. The strength values listed in Table 2 are based on the Euro-Code 6 shear strength envelope, assuming values of fvko = 0.16 MPa and of μ = 0.4 (Table 2, column 1). Similarly, low strength values were assumed for the tensile strength normal (fxk1) and parallel (fxk2) to an equivalent horizontal joint (Table 2, column 2). The shear capacity defined in this way corresponds to the mechanism resisting the sliding mode of failure. Tomazevic [21] proposed a procedure, developed by Turnsek and Cacovic [22], towards estimating the shear capacity corresponding to the mechanism resisting the diagonal tension mode of failure for a masonry structural element having a height (h) and a length (l). In this case the shear strength (τmax) is given by the following relationship.
τ max = f x k 1 ( f x k 1 + σ n ) / b   where :   b = h / l
The quality of the used stones may vary, therefore the stone compressive values, listed below, are indicative. It is frequently reported that the variability of the quality of mortar as well as that of the techniques used in the stone masonry construction are far more important in influencing the strength values that are most significant in defining the earthquake capacity of the various structural elements. A number of destructive and non-destructive techniques have been employed in the past in the framework of investigation procedures for the diagnosis of historic masonries [23]. However, most of these procedures are of a qualitative nature. The determination of the most significant strength values for particular masonry construction is quite a demanding task to be performed in-situ, which is fulfilled only in limited cases. As an alternative, one can use relevant information from controlled laboratory experiments, like those performed by Vintzileou [24]. A number of stone masonry wallets were built [24] with low strength lime mortar (mortar compressive strength 0.80 MPa, stone compressive strength 50 MPa), including timber ties connected within these masonry wallets in various ways. The resulting compressive strength of the wallet without timber ties was found equal to 0.47 MPa. In the framework of ongoing research, stone masonry wallets of similar dimension were built at Aristotle University, having a cross section 500 mm × 600 mm and a height of 830 mm also with low strength mortar (mortar cubic compressive strength 1.10 MPa, stone cubic compressive strength 60 MPa); this resulted in wallet compressive strength values equal to 1.5 MPa. In this experimental sequence a number of wallets, which included timber ties, were also tested. These wallets including the wooden ties, when tested in compression, resulted in a moderate increase (10% to 20%) of the initially measured compressive strength.
It was observed during the stone masonry wallet compressive tests conducted at Aristotle University that a moderate increase in the mortar compressive strength with the addition of pozzolan in the mortar (mortar compressive strength 1.28 MPa) resulted in a threefold increase of the compressive strength of the corresponding stone masonry wallet (approximately 5.0 MPa). Therefore, the compressive strength value of 3.50 MPa adopted here, listed in column 3 of Table 2, seems to be a reasonable assumption. In any case, in all the examined structures the compressive limit-state scenario is very remote. In columns 4 and 5 of Table 2 the adopted values of Young’s modulus and Poisson’s ratio are also listed. Apart from the wooden inserts that are included in stone masonry walls the influence of spandrels that bridge the door and window openings must also be briefly discussed. Past research demonstrated that spandrels can have a significant influence on the capacity of masonry walls [25,26,27,28]. Spandrels are constructed in a variety of forms employing as basic materials in old stone masonry construction: masonry, wooden or even iron parts. Due to this variety of materials and construction techniques and the lack of measured strength values for the structures studied in the present work this influence, although important, is not investigated in any detail. In order to estimate the performance of each masonry structural element the following inequalities are employed:
Ri = SRdi/SEdi > 1
Ri = SRdi/SEdi < 1
SEdi represents the demand posed for each masonry structural element as it results from the simplified numerical simulation; SRdi is the corresponding capacity value which is obtained on the basis of assumed strength values for the stone masonry (
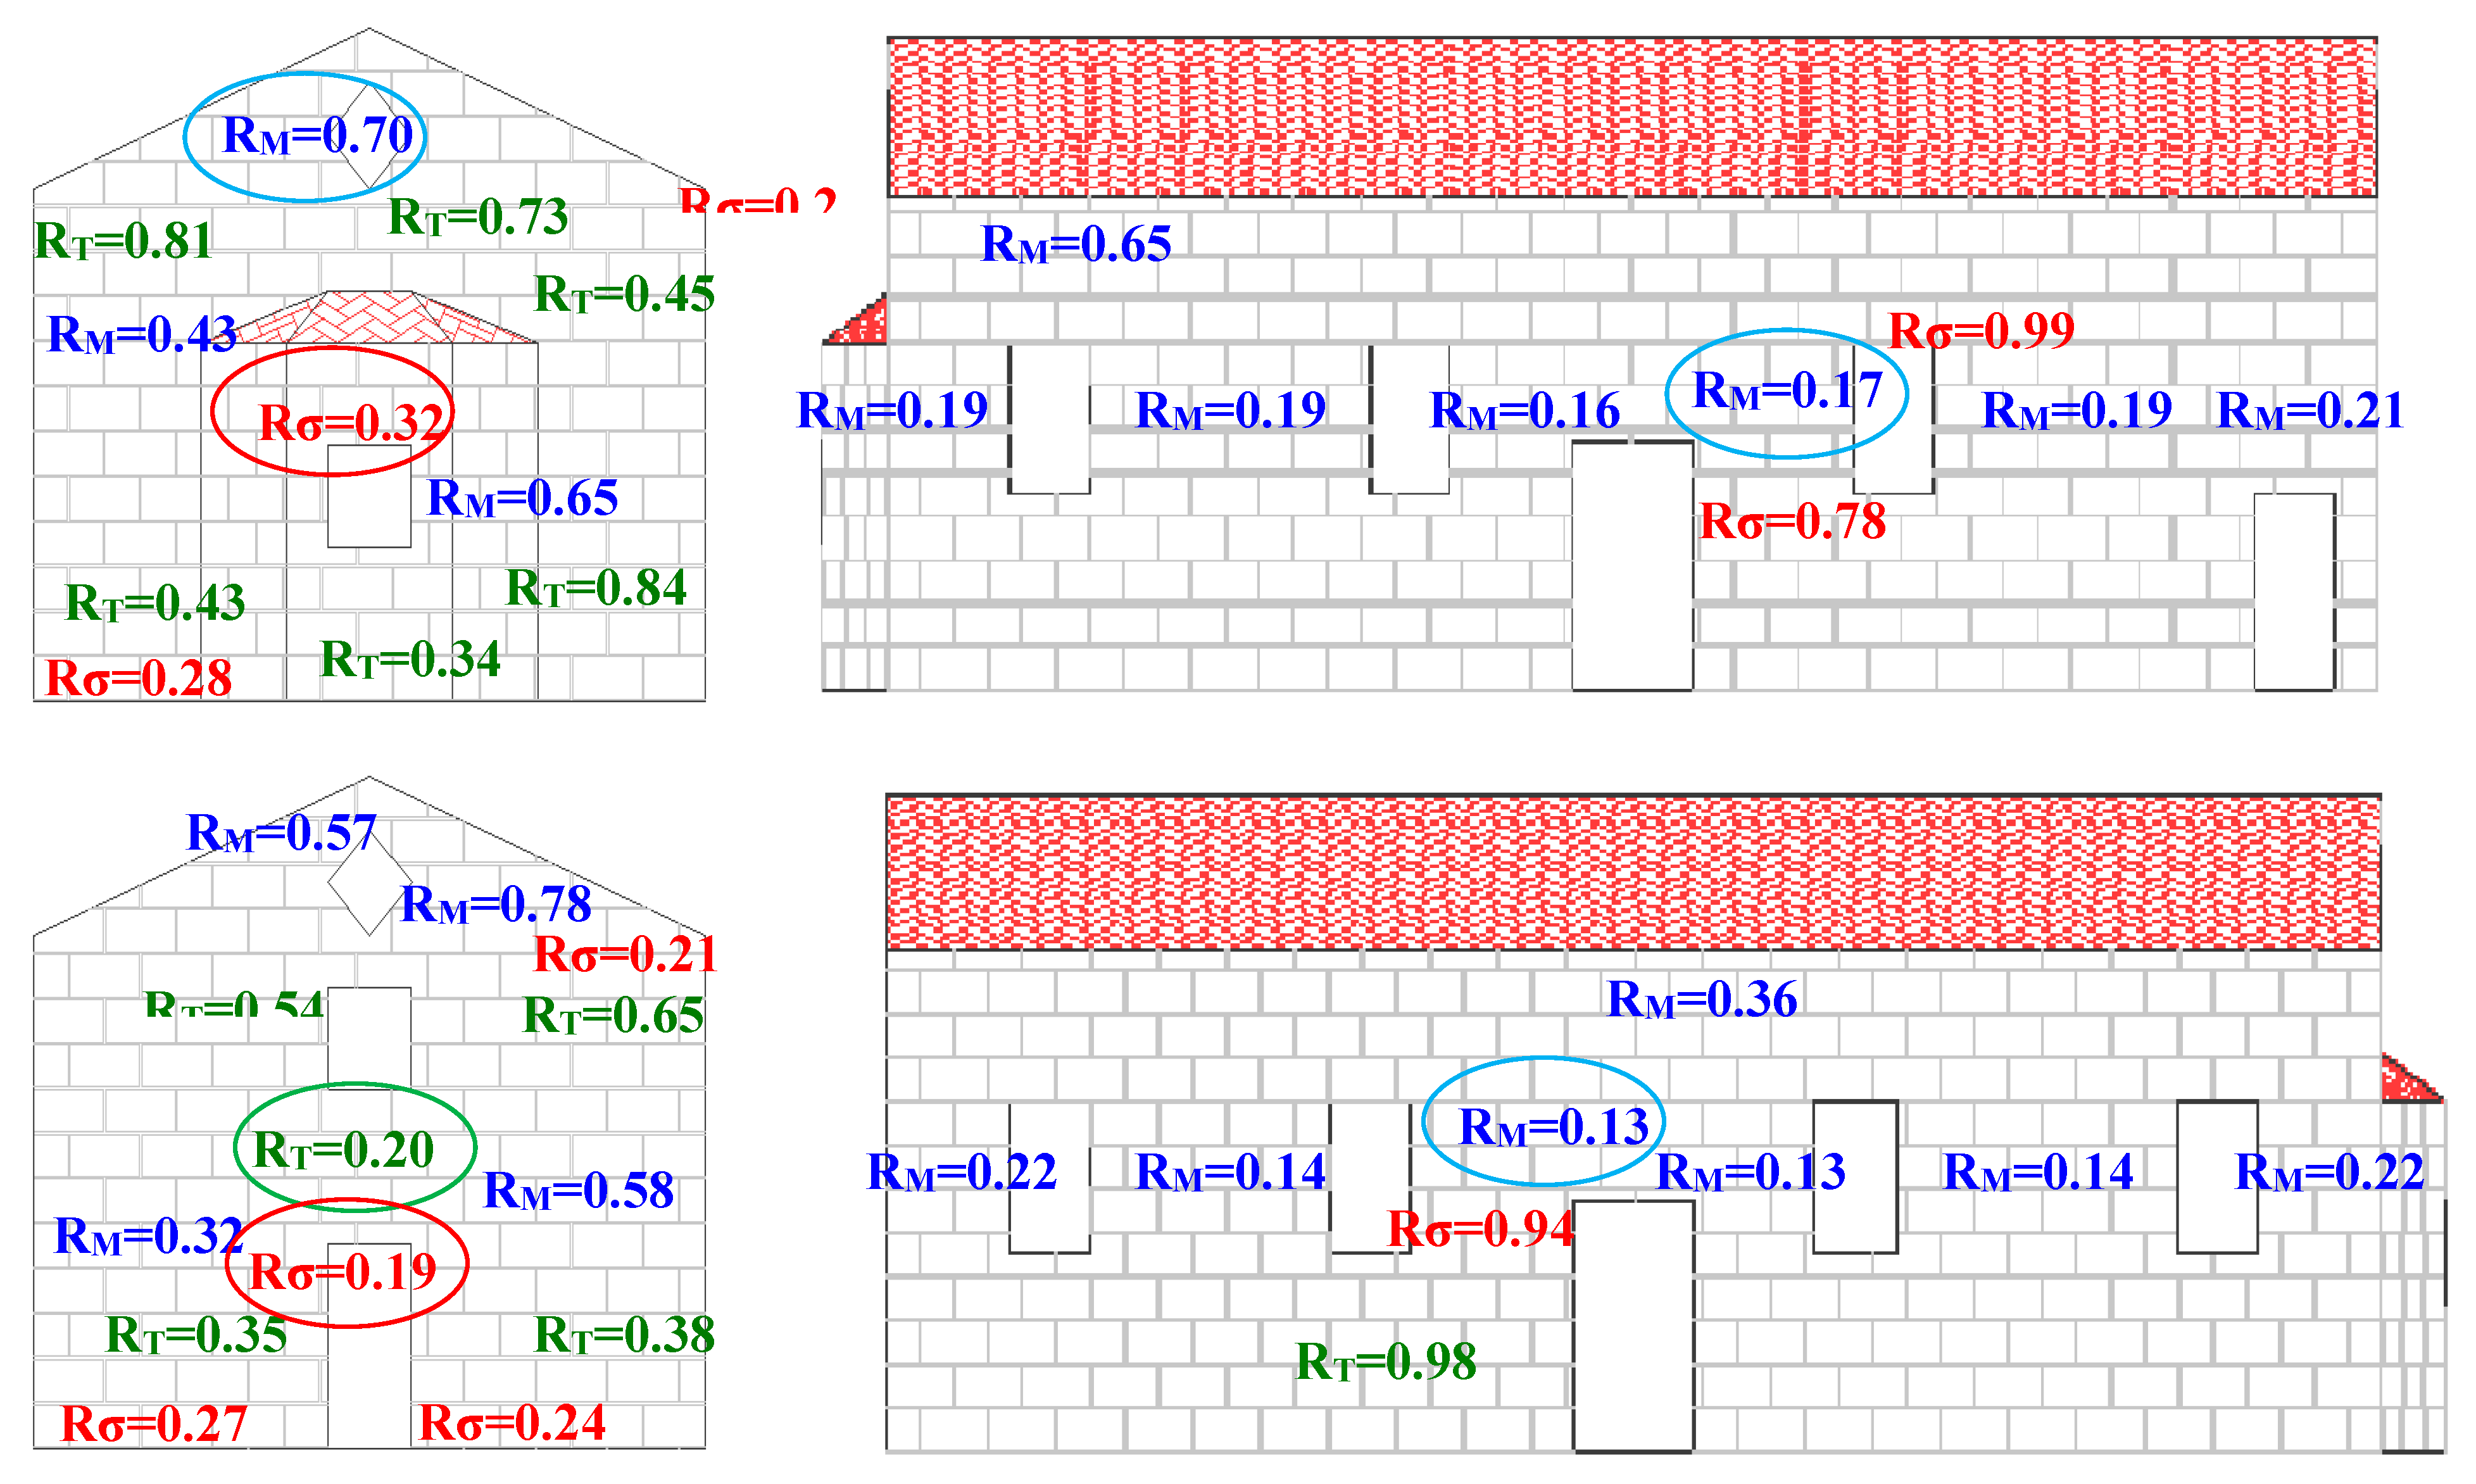
Table 2). Note that no safety coefficients are used in estimating the capacity values at this stage of the evaluation process. Inequality 3 signifies safe structural performance. Inequality 4 denotes that the predicted structural performance exceeds a certain limit state thus signifying the development of structural damage corresponding to the specific limit state that is exceeded. These corresponding capacity over demand ratio (Ri) values are used in this simplified numerical evaluation process; a ratio (Ri) value smaller than 1 indicates that a distinct limit state has been reached leading to the corresponding failure mode. The following five common structural damage scenarios are stated corresponding to five distinct relevant limit-states through the relevant ratio values (Ri = SRdi/SEdi). Scenario (a1) addresses the in-plane shear limit state which corresponds to a sliding failure mode through the value of the ratio (Rτsli); scenario (a2) addresses the in-plane shear limit state corresponding to a diagonal tension failure mode (Rτdia). Scenario (b) corresponds to a compressive mode of failure (Rς) whereas scenario (c) corresponds to the in-plane tensile limit state (Rσ). Finally, scenario (d) corresponds to the out-of-plane tensile limit state (RM). Both scenario (c) and scenario (d) use the fxk1 strength value, listed in Table 2 column 2.
(a1) Rτsli = shear strength/shear stress demand. Rτsli < 1 signifies in-plane sliding shear mode of failure
(a2) Rτdia = shear strength/shear stress demand. Rτdia < 1 signifies in-plane diagonal tension mode of failure.
(b) Rς = compressive strength/compression stress demand. Rς < 1 signifies in-plane compression mode of failure.
(c) Rσ = tensile strength/tensile stress demand. Rσ < 1 signifies tensile mode of failure normal to bed joint (in-plane)
(d) RM = tensile strength/tensile stress demand from out-of-plane flexure. RM < 1 signifies out-of-plane tensile mode of failure normal to bed joint at the extreme fibre.
All masonry parts of the studied structures were examined in terms of in-plane and out-of-plane stress demands posed by the applied load combinations against the corresponding capacities, as these capacities were obtained by applying the “Mohr-Coulomb” criterion of Equation (1) or the stone masonry compressive and tensile strength limits listed in Table 2. Ratio values smaller than one (Rτsli, 
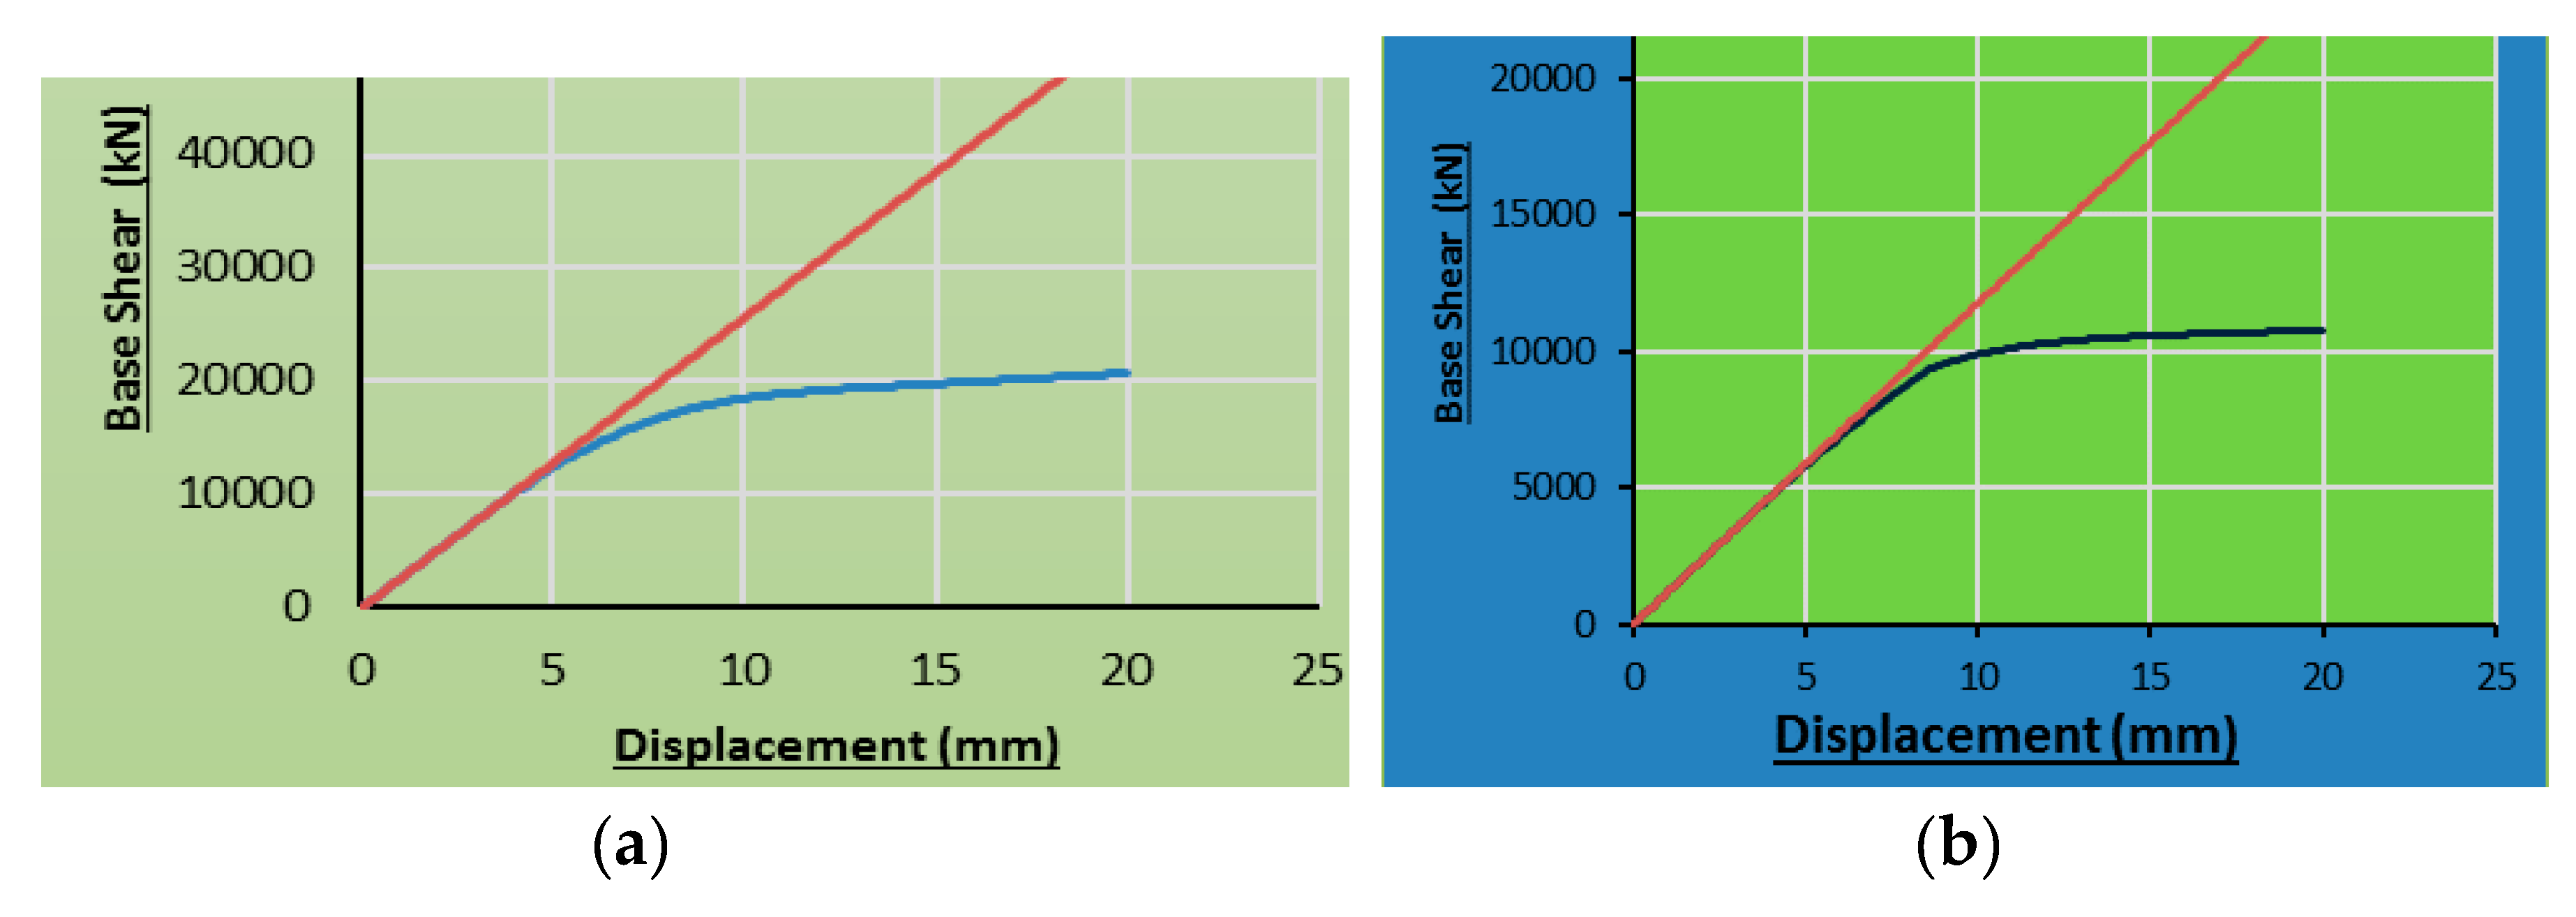
Rτdia, Rς, Rσ, RM < 1) predict the corresponding limit state condition. As can be seen, this methodology is based on combining numerical stress demands resulting from elastic analyses with limit-state strength values. An alternative approach is to incorporate these limit-state strength values in a non-linear push-over type of analysis [29]. As was shown in this study by Manos et al. [29] the above linear-elastic approach is a reasonable approximation of the actual behaviour and of predicting regions of structural damage, being both less complex and time consuming than the corresponding non-linear approach. Manos et al. [30,31] developed a relevant expert system for assessing the various resisting capacities of vertical masonry structural elements.

4. Results from Distinct Case Studies and Discussion

4.1. Numerical Simulation of the “Basilica” Church of Assumption of the Virgin Mary at Dilofo-Voio-Kozani

Summary results of the numerical simulation of the “Basilica” church of the Assumption of Virgin Mary at Dilofo-Voio-Kozani (Section 2, Figure 3a–c), damaged by foundation settlement are presented here. The assumptions presented in Section 3 were followed in forming this numerical model. Two different cases were simulated. In the first case the soil-foundation interface was assumed to be non-deformable (Figure 11a,b) whereas in the second case a deformable soil layer was placed under the foundation exactly at the same location as was identified from the in-situ examination (Figure 12a,b).
The in-plane maximum tensile stress distribution is shown in these figures. Figure 11a and Figure 12a represent a South-East view of the maximum tensile stress response that can be compared to the actual structural damage shown in Figure 3a whereas Figure 11b and Figure 12b represent a North-East view of the tensile stress response which can be similarly compared to the damage shown in Figure 3b,c. The maximum in-plane tensile stress demands appear at the regions supporting the central vertical domes and have maximum values 0.28 MPa in the case of non-deformable foundation and 0.99 MPa in the case of the deformable foundation, respectively. As can be seen, this maximum in-plane tensile stress value in the case of deformable foundation exceeds by far the tensile strength value adopted in this study and listed in column 2 of Table 2 (0.15 MPa). Therefore, in this latter case the simplified numerical process indicates that scenario c (exceeding the tensile strength) occurs in these locations, thus predicting the development of the relevant structural damage, which correlates reasonably well with observed performance.
In more detail, a comparison of the tensile stress distribution pattern at the South-East corner of the transverse wall shown in Figure 12a correlates well with the observed damage depicted in Figure 3a for the same location (see also top of Figure 13). Similarly, the maximum in-plane tensile stress distribution at the middle of the North longitudinal wall, depicted in Figure 12b correlates well with the observed damage depicted in Figure 3b for the same location (see also middle of Figure 13). Finally, the area surrounding the supporting ring of the central dome (Figure 12a,b) also develops high in-plane tensile stress demands that exceed by far the assumed strength values which leads to a reasonably good correlation with the extensive structural damage which actually developed in this part (Figure 3c) of this “Basilica” church (see also bottom of Figure 13).

4.2. Numerical Simulation of the Dynamic and Earthquake Response of “Basilica” Churches

The dynamic and earthquake response of the 17th century “Basilica” church of St. Marina in Soullaroi, which is located in the island of Kefalonia and was heavily damaged during the 2014 earthquake sequence [11,12], is studied here. A linear elastic numerical simulation was formed as previously described. Thick shell finite elements [17] were employed to numerically simulate all the stone masonry structural elements having a thickness of 750 mm and an assumed Young’s Modulus of 1000 MPa (Table 3); 7160 finite elements were employed in total for this numerical simulation with dimensions approximately 300 mm × 300 mm. The foundation deformability was introduced with linear links [17] having axial stiffness equal to either 109 KN/mm, representing relatively hard soil conditions or 24.5 KN/mm, representing a moderately deformable foundation. Moreover, in all cases the vertical walls were connected at the corners with two-node 3-D links in an effort to control the rigidity of these connections as well as to approximate the structural behaviour when the examined structures exhibited heavy damage in these locations (see Section 5). The eigen-periods for the N-S transverse direction translational response are equal to 0.177 s and 0.20 s for the hard and medium soil deformability, respectively. Similarly, the eigen-periods for the E-W longitudinal direction translational response are equal to 0.10 s and 0.12 s for the hard and medium soil deformability, respectively (Figure 14). More information on the dynamic properties of this numerical simulation is given by Manos et al. [12]. The numerical dynamic analyses included the superposition of the gravitational forces with the seismic forces specified on the basis of the ground acceleration that was recorded at two stations during the 3rd February strongest aftershock GEER-EERI-ATC [11], Papaioannou [32]. More information on the location of these recordings in relation to the studied “Basilica” church is given in Manos et al. [12]. The corresponding response curves for the Chavriata recording which is more demanding than the Lixouri ground motion, are shown in Figure 15a,b for the North-South and East-West directions, respectively.
In each one of these figures the relevant constant ductility spectral curves are depicted for a ductility ratio equal to 1.5, which is assumed to be valid for unreinforced masonry structures. Moreover, the Type-1 and Type-2 design spectral curves specified according to Euro-Code 8 [33,34,35] for design ground acceleration equal to 0.36 g (g is the acceleration of gravity), importance factor equal to γ = 1, response modification coefficient q = 1.5 (for unreinforced masonry) and soil category D. Finally, in each one of these figures the eigen-period values of the main translational eigen-modes in the North-South and East-West direction, as specified above, are also indicated. As can be seen from Figure 14a,b the acceleration spectral ordinates of the actual strong motion in the North-South direction are more demanding (transverse direction for the church, approximately 1.5 g) than the corresponding values in the East-West direction (longitudinal direction for the church, approximately 1.0 g).
Moreover, the flexibility of the foundation results in a moderate increase of the seismic demands resulting from the similar increase of the corresponding spectral ordinates, as can be seen in Table 3. Such large values of spectral acceleration result in very high seismic load values, listed in Table 3 in terms of base shear, that exceed the design seismic loads resulting from applying the Euro-Code 8 provisions for the island of Kefalonia, which belongs to the seismic zone of Greece [35] with the highest expected design earthquake ground acceleration (0.36 g). It is no surprising that this old unreinforced stone masonry structure was heavily damaged as was the case for a number of similar structures in nearby locations Manos et al. [12].
In what follows, the simplified evaluation process described in Section 3 was followed for the case of St. Marina in Soullaroi church at the island of Kefalonia, Greece, built in 1686 A.D. The soil-foundation interface was simulated with linear link elements having axial stiffness equal to 24.5 KN/mm, representing a moderately deformable foundation [12,19]. Figure 16 depicts summary results of this evaluation process in terms of Rτ, Rσ, RM ratio values. These ratio values for either the sliding shear (Rτsli,) or the diagonal tension (Rτdia) are indicated with the common ratio value Rτ. Ratio Rς values, indicating in-plane compressive limit-state, are not shown as this mode of failure is not reached anywhere in this church.
The following observations can be made on the basis of the Rτ, Rσ, RM ratio values. It can be seen that all these ratio values are smaller than one (Rτ, Rσ, RM < 1) in numerous locations, indicating that the corresponding limit state has been reached at all these locations of the structure that the relevant ratio value is linked with. For clarity the whole structure is deconstructed part by part in these figures in four walls that form its 3-D stone masonry shell. The East transverse wall is placed at the top left corner of Figure 16 whereas the West transverse wall at the bottom left corner. The South longitudinal wall is placed at the top right corner of Figure 16 whereas the North longitudinal wall at the bottom right corner.
The results of the evaluation include all possible combinations of the gravitational forces with the seismic actions indicated in Figure 14. As can be seen in Figure 15 the RM ratio values are well below one (RM < 1) mainly for both North and South longitudinal walls indicating that these walls for this church reached a widespread out-of-plane flexural limit state.
This is confirmed by the observed damage, which was also very widespread. In order to avoid partial or total collapse, temporary scaffolding was installed very shortly after the severity of the sustained damage was realized. Furthermore, this evaluation process indicates that the East and West transverse walls reached at their bottom part in-plane tensile and shear limit states with the corresponding ratio values well below one (Rσ <1, Rτ < 1) whereas at the top part of these walls the development of the out-of-plane flexure limit state prevails (RM < 1).
Again, reasonably good correlation can be seen between predicted limit states, based on the simplified evaluation results of Figure 16, with the observed damage shown in Figure 17. As already discussed in Section 2 and Section 3, this simplified numerical evaluation process assumes non-failing inter-connections of masonry elements. Therefore, one could neither predict the severity of the structural damage which developed near the inter-connections between the transverse and the longitudinal walls (Figure 18) nor account for the effect of this type of damage to the state of stress of each individual wall. An effort to study this effect is presented in the following Section 5.

5. Numerical Simulations of the Seismic Performance Including Non-Linear Response Mechanisms

In this section numerical simulations which include specific non-linear response mechanisms will be presented and discussed. The non-linear mechanisms which are introduced in the numerical simulation of a stone masonry structure of the “Basilica” typology are the following:
(a1) First, the two-node 3-D links at the soil-foundation interface, introduced to account for the soil-foundation deformability, are provided with a tension cut-off limit so they can sustain only compression in their axial direction and no tension (Figure 19a).
(b1) Similarly, two-node 3-D non-linear link elements are also utilized in connecting the vertical walls at their corners with a tension cut-off limit in such a way as to transfer compression between the intersecting walls at the corner but limited transfer of tension (Figure 19b).
(c1) A similar connection is used between the wooden elements of the roof and the tympana of the masonry walls at the East and West sides or at the top of the North or South longitudinal masonry walls.
The value of each of these tension cut-off limits was based on the assumed in-plane shear and tensile strength values listed in Table 2 and on the relevant contact surface corresponding to each non-linear link. It must be recognized that this quantification process entails a considerable degree of uncertainty that must be investigated further. Thus, through the proper use of these non-linear 3-D two-node link elements, these non-linear mechanisms are introduced in an effort to simulate numerically the capability of the uplifting of the structure at the soil-foundation interface, the possibility of detachment between the wooden elements of the roof and the masonry walls or between the transverse from the longitudinal walls at the connecting corners (Figure 17 and Figure 18). This alternative approach adopted here employs such realistic multiple selective failure mode scenarios in either the longitudinal or the transverse direction finding for each case a base shear capacity value rather than following the spectrum method. This push-over type of non-linear analysis was applied to the 3-D numerical simulation of a typical stone masonry church with overall dimensions that are representative of numerous other churches in Kefalonia island. These non-linear numerical simulations use a step-by-step push-over type of analysis Manos et al. [14] with the first step being the application of all the permanent vertical loads (100% D). During subsequent time steps the horizontal seismic loads are gradually introduced at each shell element (corresponding to its mass) either in the North-South (y-y, Ey Figure 14a) or East-West (x-x, Ex Figure 14b) directions. This is done gradually by increasing the level of the applied seismic forces by a small amount at each subsequent step. The seismic horizontal displacement attained at each step is checked at the top point of the tympanum of the East wall for the East-West push-over analyses or at the top of the middle of the North wall (where the roof is connected) for the push-over analyses in the North-South direction. The analysis is stopped when a target horizontal displacement is reached.

5.1. Foundation Uplift

The base shear versus horizontal displacement response obtained from these push-over numerical analyses is depicted in Figure 20a,b for the East-West (D + Ey) and North-South (D + Ex) directions, respectively. The difference between the linear response (plotted with the straight lines) and the corresponding non-linear response, resulting from these push-over analyses, becomes evident in these figures. As can be seen in the uplifting of the foundation occurs when the base shear reaches approximately 20,000 KN (Figure 20a) in the East-West and 11,000 KN (Figure 20b) in the North-South direction, respectively. When these base shear values are compared with the corresponding values listed in Table 3, obtained from the linear dynamic spectral analyses that employed the recorded ground motion response spectra (Chavriata record, Figure 15a,b), it can be concluded that foundation uplift cannot develop for this particular “Basilicas” church.

5.2. Non-Linear Response Simulating the Detachment of the Masonry Walls from the Roof Level as well as at Their Corner Interconnection

Next, the potential of the walls to be detached at the corners where these vertical walls are interconnected as well as at the roof level is examined. This is examined for load combinations D + Ey or D + Ex, whereby the seismic forces Ey (East-West) or Ex (North-South) are applied in a push-over type of non-linear analyses. The obtained base shear versus horizontal displacement response from these push-over numerical analyses is depicted in Figure 21a,b for the East-West (D + Ey) and North-South (D + Ex) directions, respectively. Again, the difference between the linear response (plotted with straight lines) and the corresponding non-linear response becomes evident in these figures. As can be seen in Figure 21a, a 10 mm relative detachment displacement of the West wall occurs for a base shear value approximately 7000 KN in the East-West direction. Similarly, a 10 mm relative detachment displacement of the North wall in the North-South direction (Figure 21b) occurs for a base shear value approximately 5000 KN. In both cases, these values are smaller than the corresponding base shear values listed in Table 3, which were obtained from the dynamic spectral linear analyses that employed the Chavriata ground motion. Therefore, it can be concluded that for these force levels the detachment of these walls at the corners is predicted by combining the results of both numerical simulations. Such predicted wall detachment agrees with the observed performance (Figure 17 and Figure 18).

6. Observed Structural Performance for a Long Period Range

In the previous sections, typical damage sustained by stone masonry “Greek Basilica” churches was presented together with the underlying causes due to natural hazards. Some of these churches span a period of over 800 years [1,9,12,13,29,30] with the majority of them being approximately 300 years old. One significant factor is the variability of the severity of the natural hazards that are linked with the structural response of the foundation and/or the superstructure. Apart from this variability of the severity of the actions it must also be stressed that the structural performance at any given time depends on the structural maintenance for each individual church. The heavy damage that was observed for numerous Christian churches during the L’Aquila earthquake [
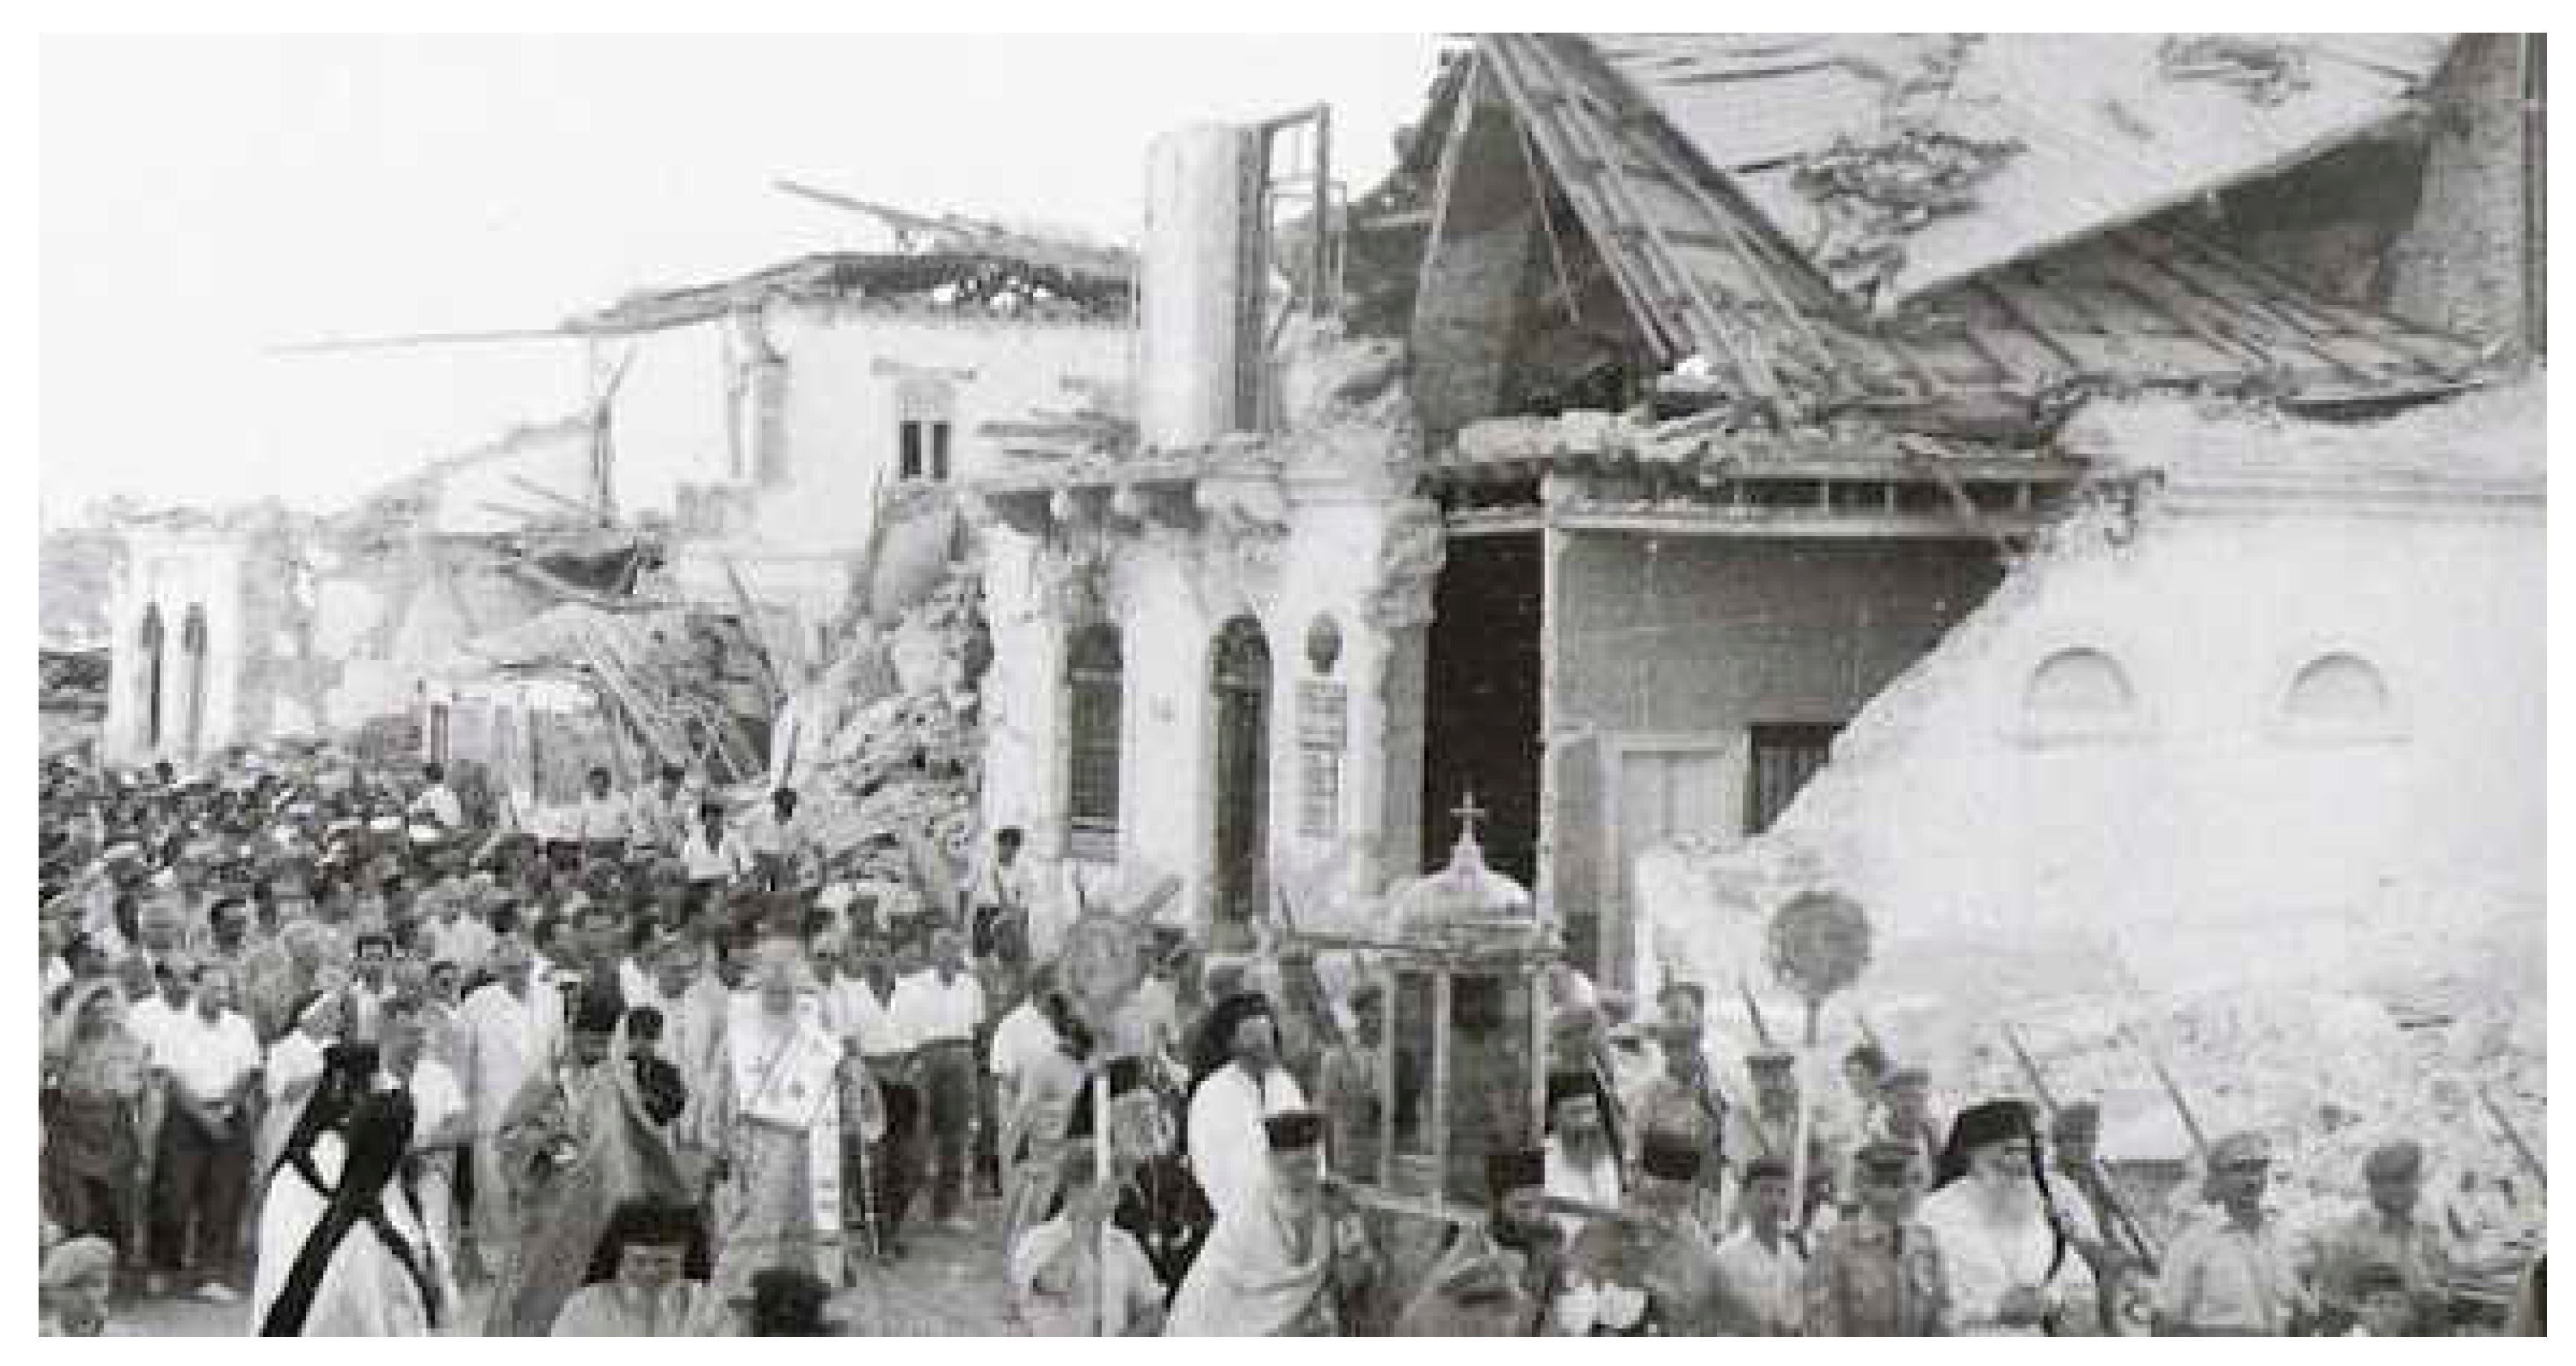
14] created new stimulus for research on the effectiveness of various structural maintenance techniques applied in the past to old masonry structures. Despite this controversy, it must be agreed that neglecting structural maintenance for such old masonry structures is in the long term synonymous to severe structural damage. An effort was made here to demonstrate that the most critical combination is a strong earthquake event subjecting an old masonry structure, which is already in a state of pre-existing state of stress and deformation from uneven foundation settlement, to considerable earthquake forces. Greece is divided into three seismic zones with Kefalonia island being in the most intense seismic zone [35]. All the churches in Argostoli, the capital of this island, are relatively new, built after the destruction of the old churches during the catastrophic seismic sequence of 1953 (Figure 22). During the seismic sequence of 2014 these new churches met the earthquake demands very successfully; however, at the Western region of this island surrounding the town of Lixouri, the 2nd largest city in the island, the seismic ground motion was more severe, as shown by the acceleration recordings of the ground motion [11,
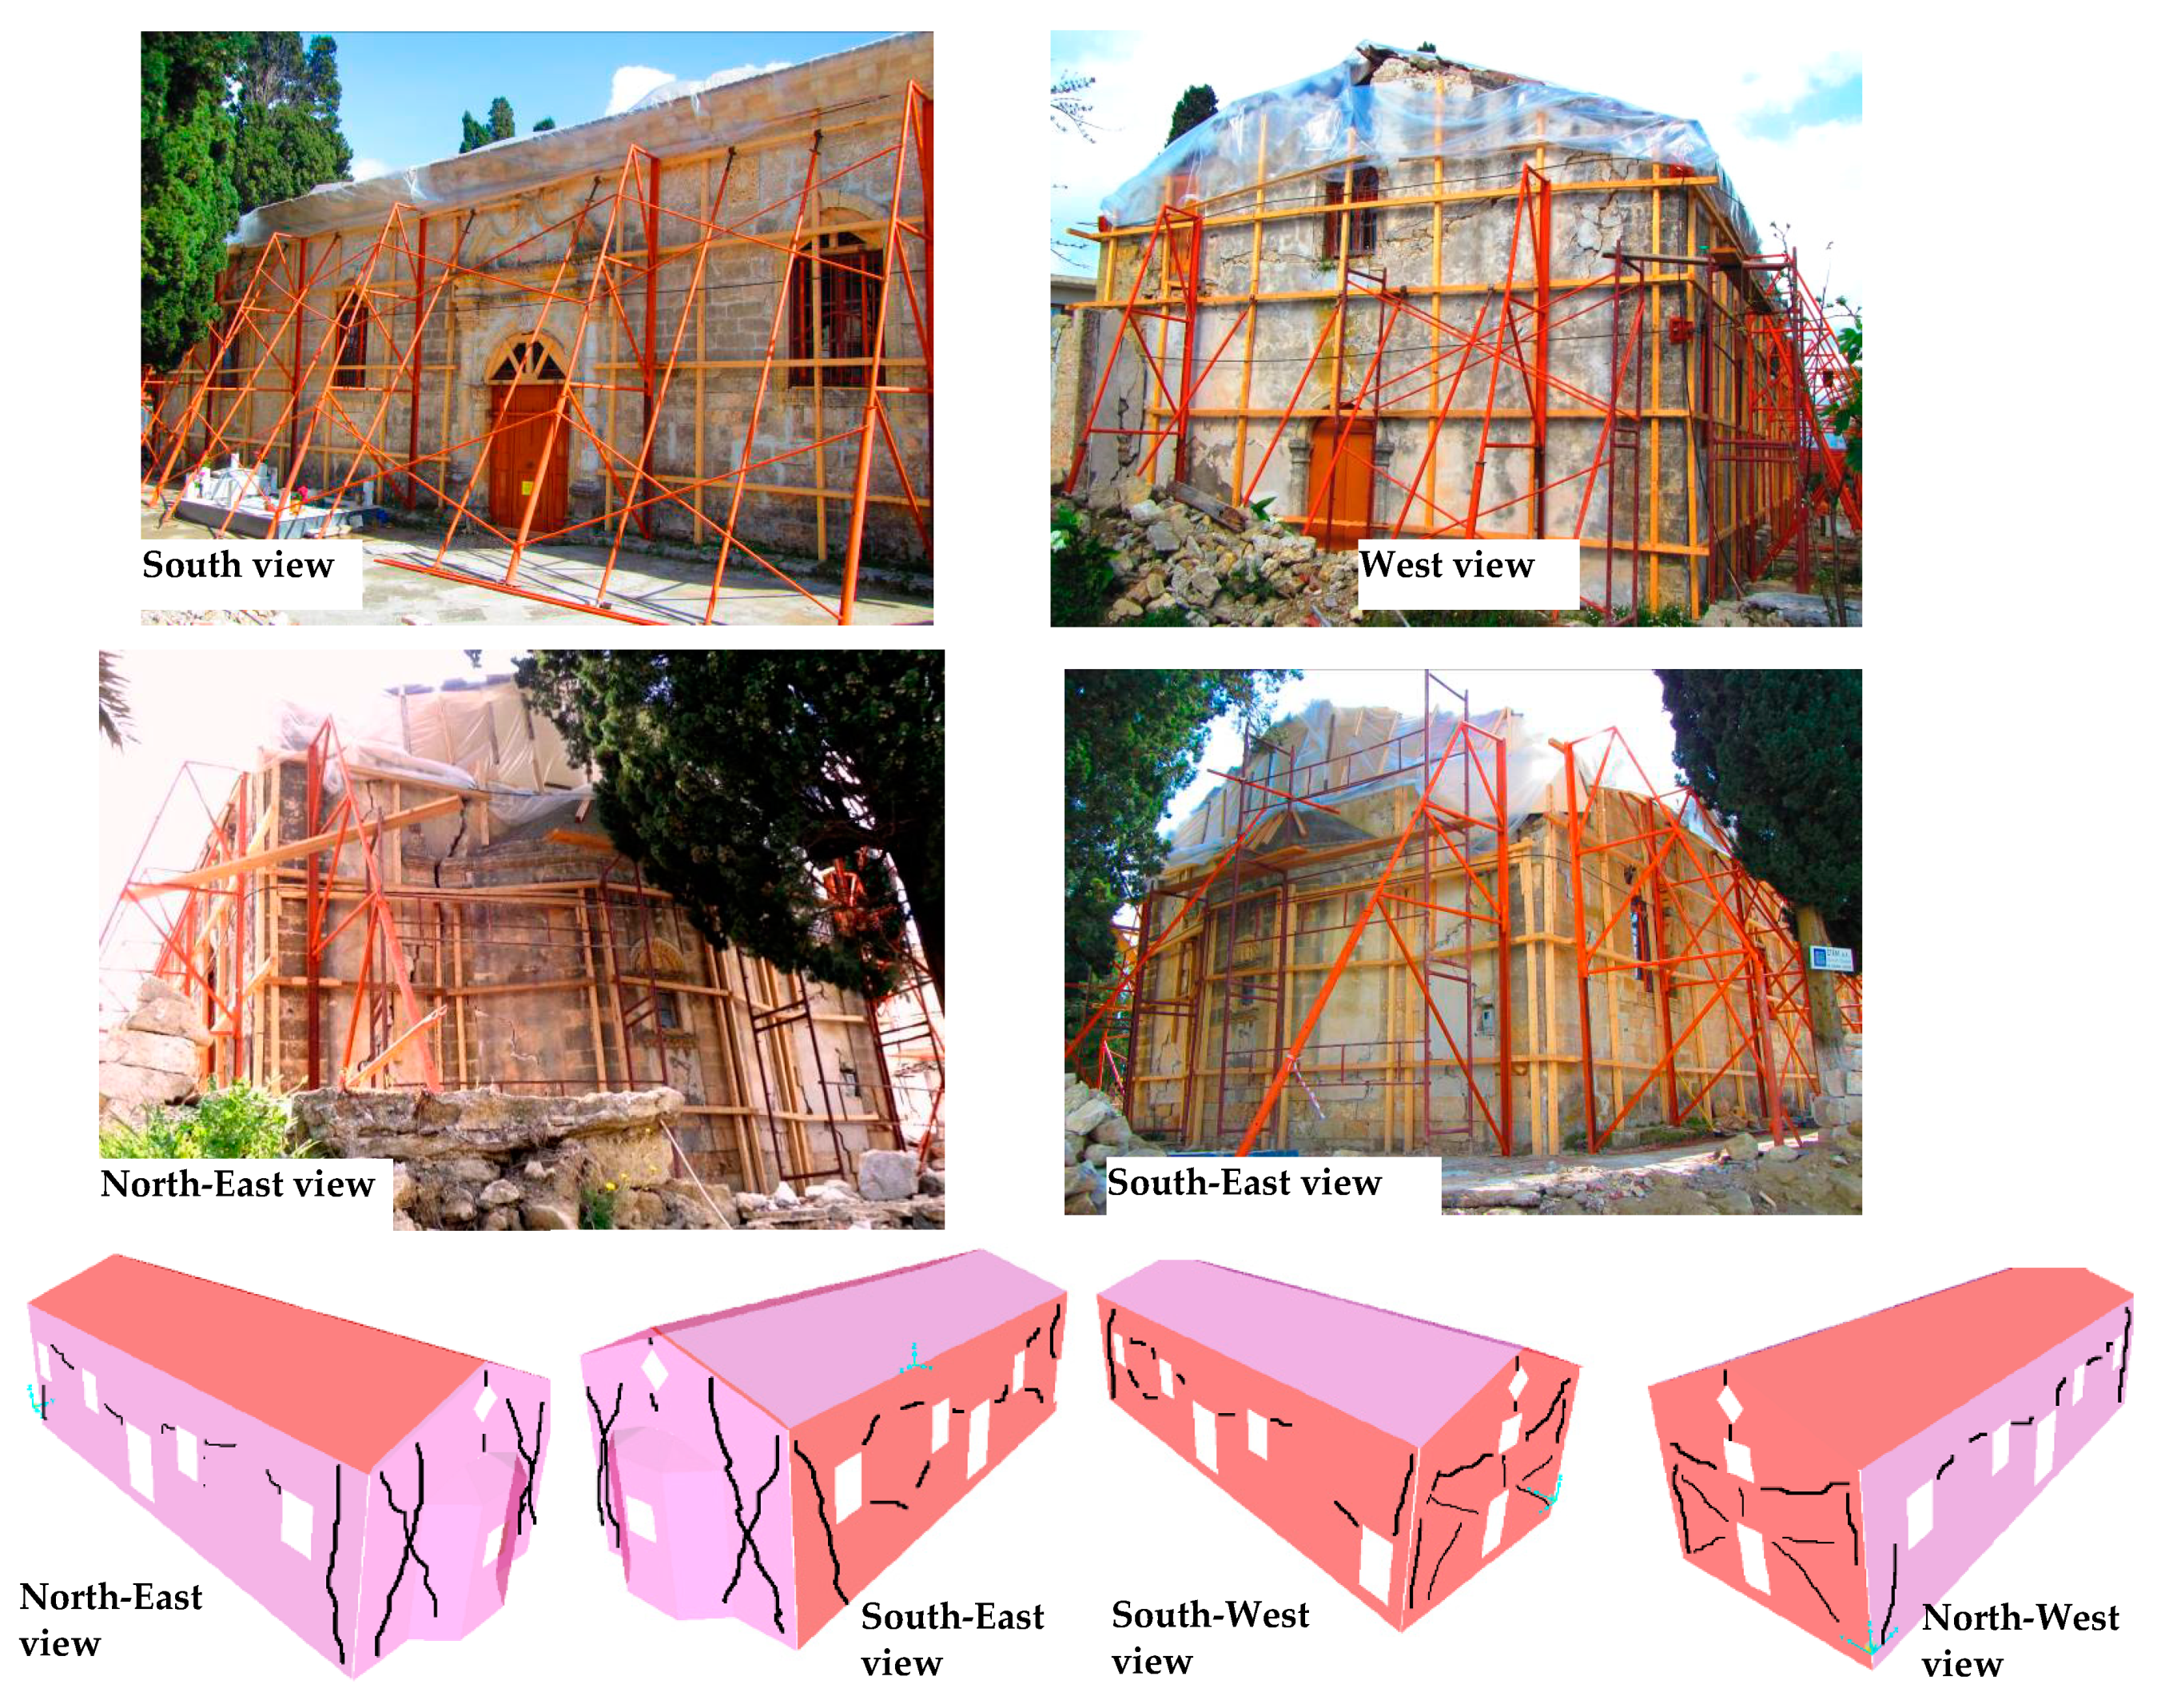
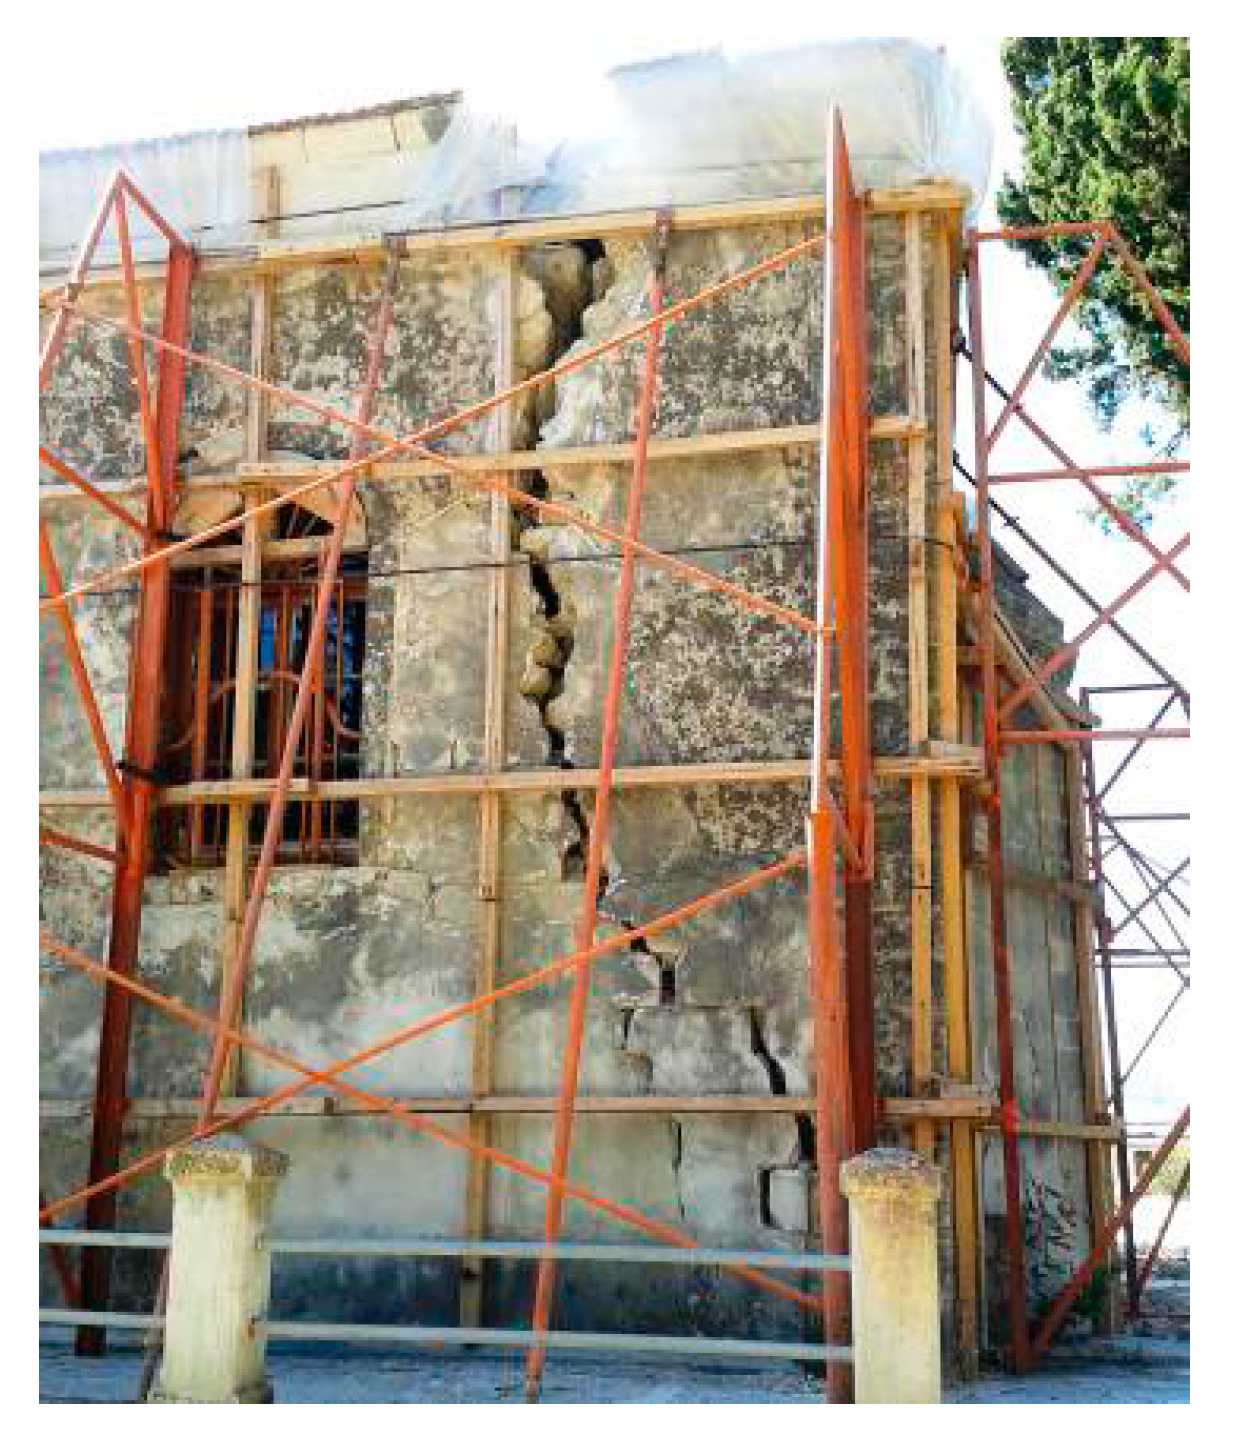
12]. Numerous churches in this region developed heavy structural damage reaching collapse, like the church of St. Marina Soullaroi presented in Section 4 and Section 5, although they did not suffer greatly during the 1953 earthquake sequence. The structural maintenance measures that were applied to these churches after the 1953 event proved to be insufficient for the demands generated by the 2014 earthquake sequence [11,12]. Similar observations can be made for the old masonry churches in the Kozani prefecture and the structural damage they developed during the 1995 earthquake sequence [
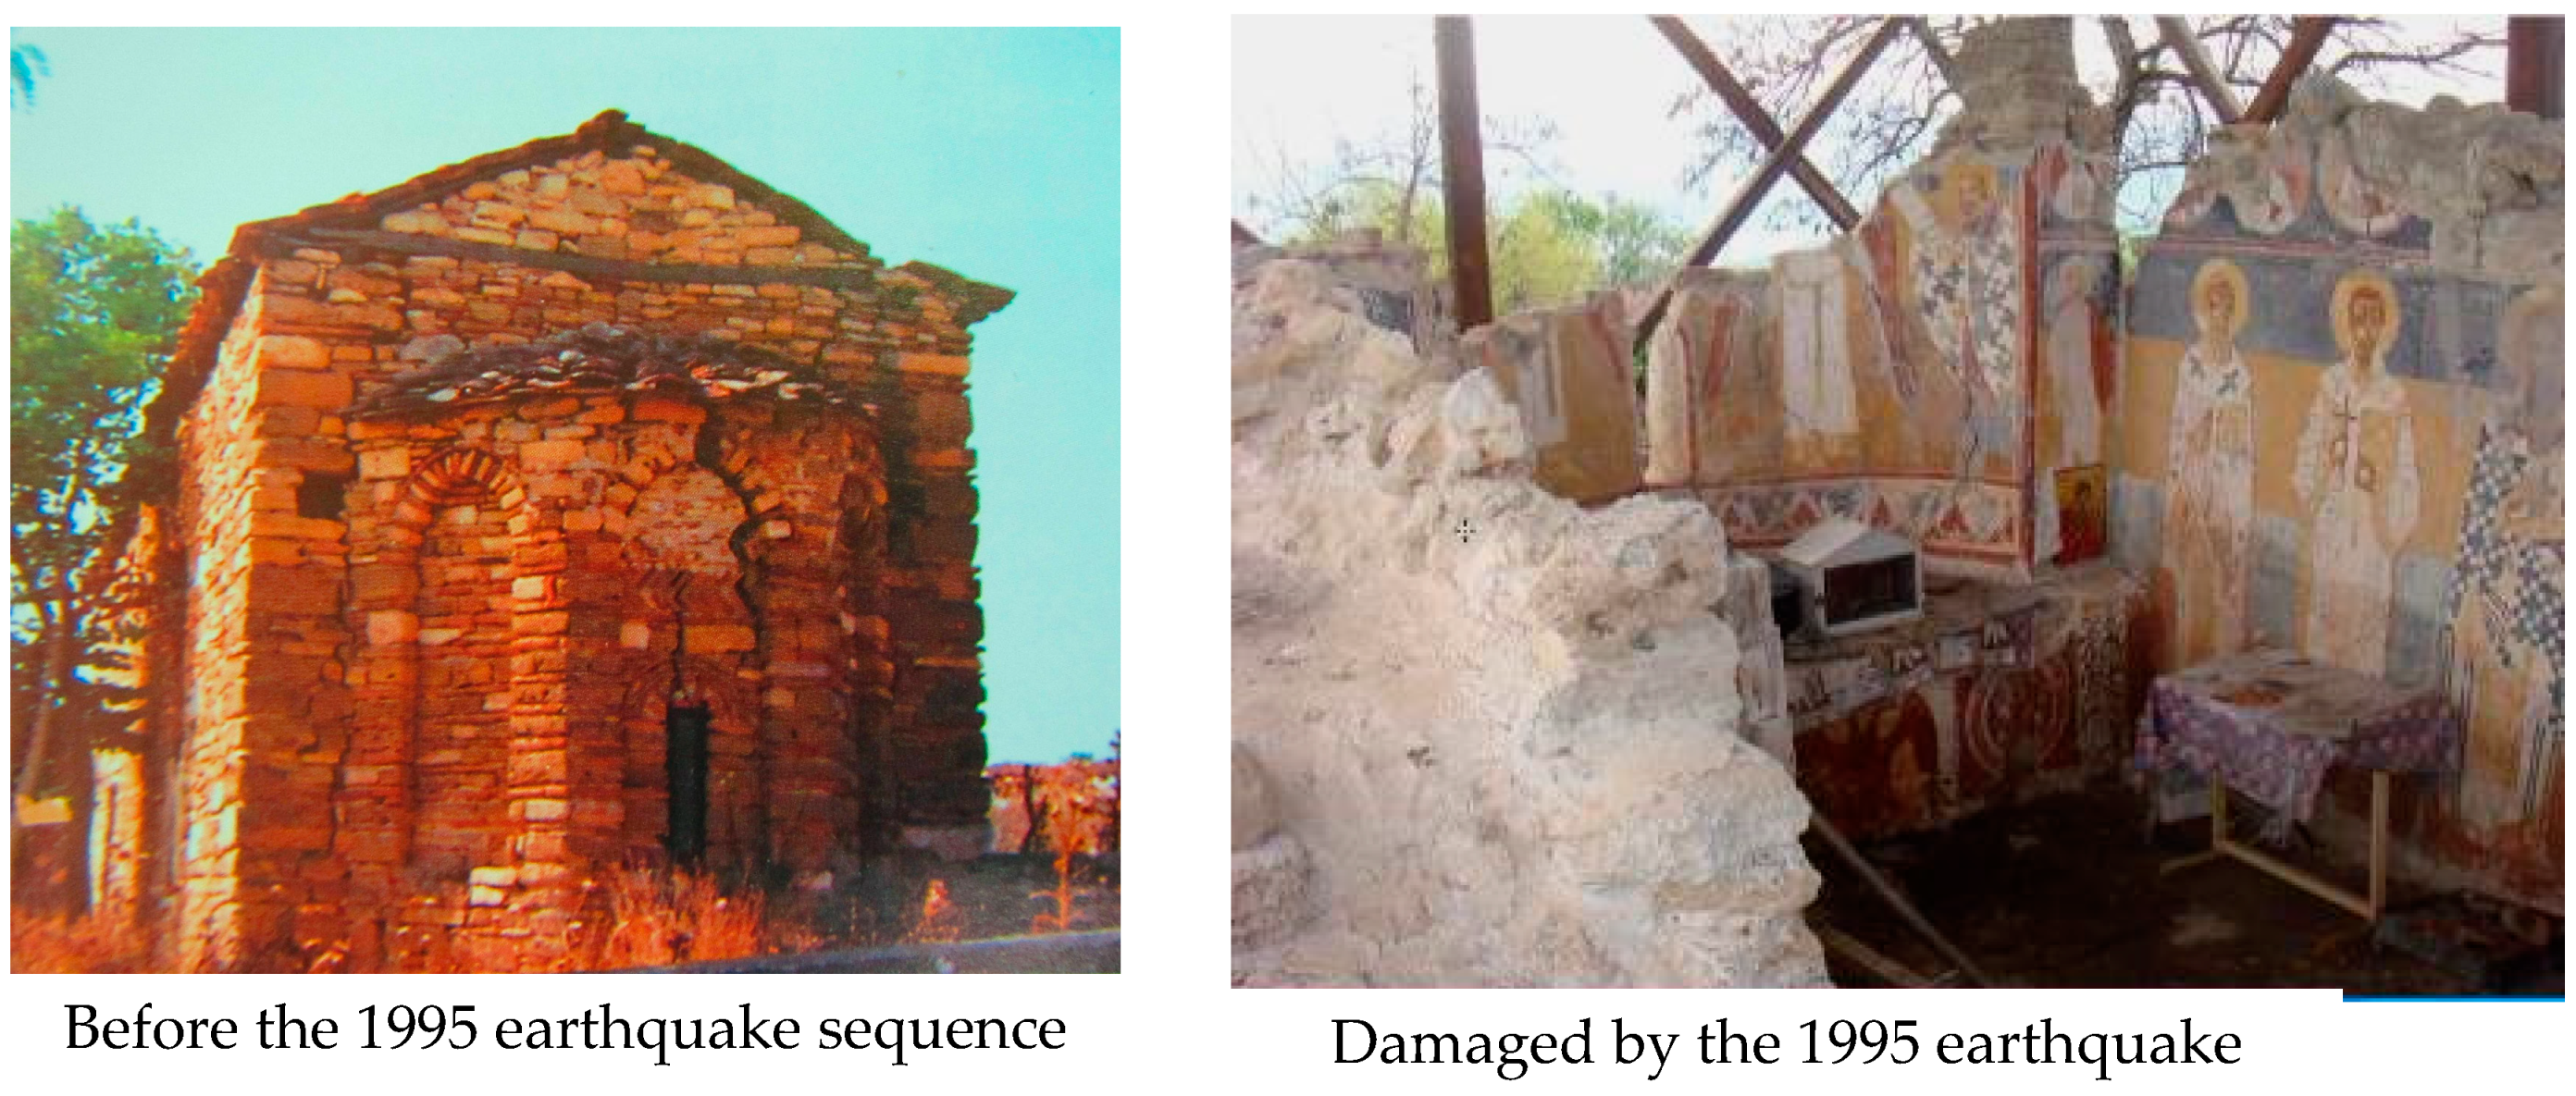
9]. This region was seismically “quiet” for many centuries before this damaging 1995 earthquake sequence. Consequently, it was believed that earthquake strong motion was not an actual hazard for either old or new structures in this region. The most spectacular damage to an old stone masonry church was that of Taxiarchis in the outskirts of Eani (12th century AD). Despite its small size, the walls of this church were totally destroyed, indicating the severity of the ground motion as well as the lack of maintenance (Figure 23). This monument remains in this damaged condition till today. Many other churches in this region with less heavy structural damage have experienced successful structural rehabilitation.
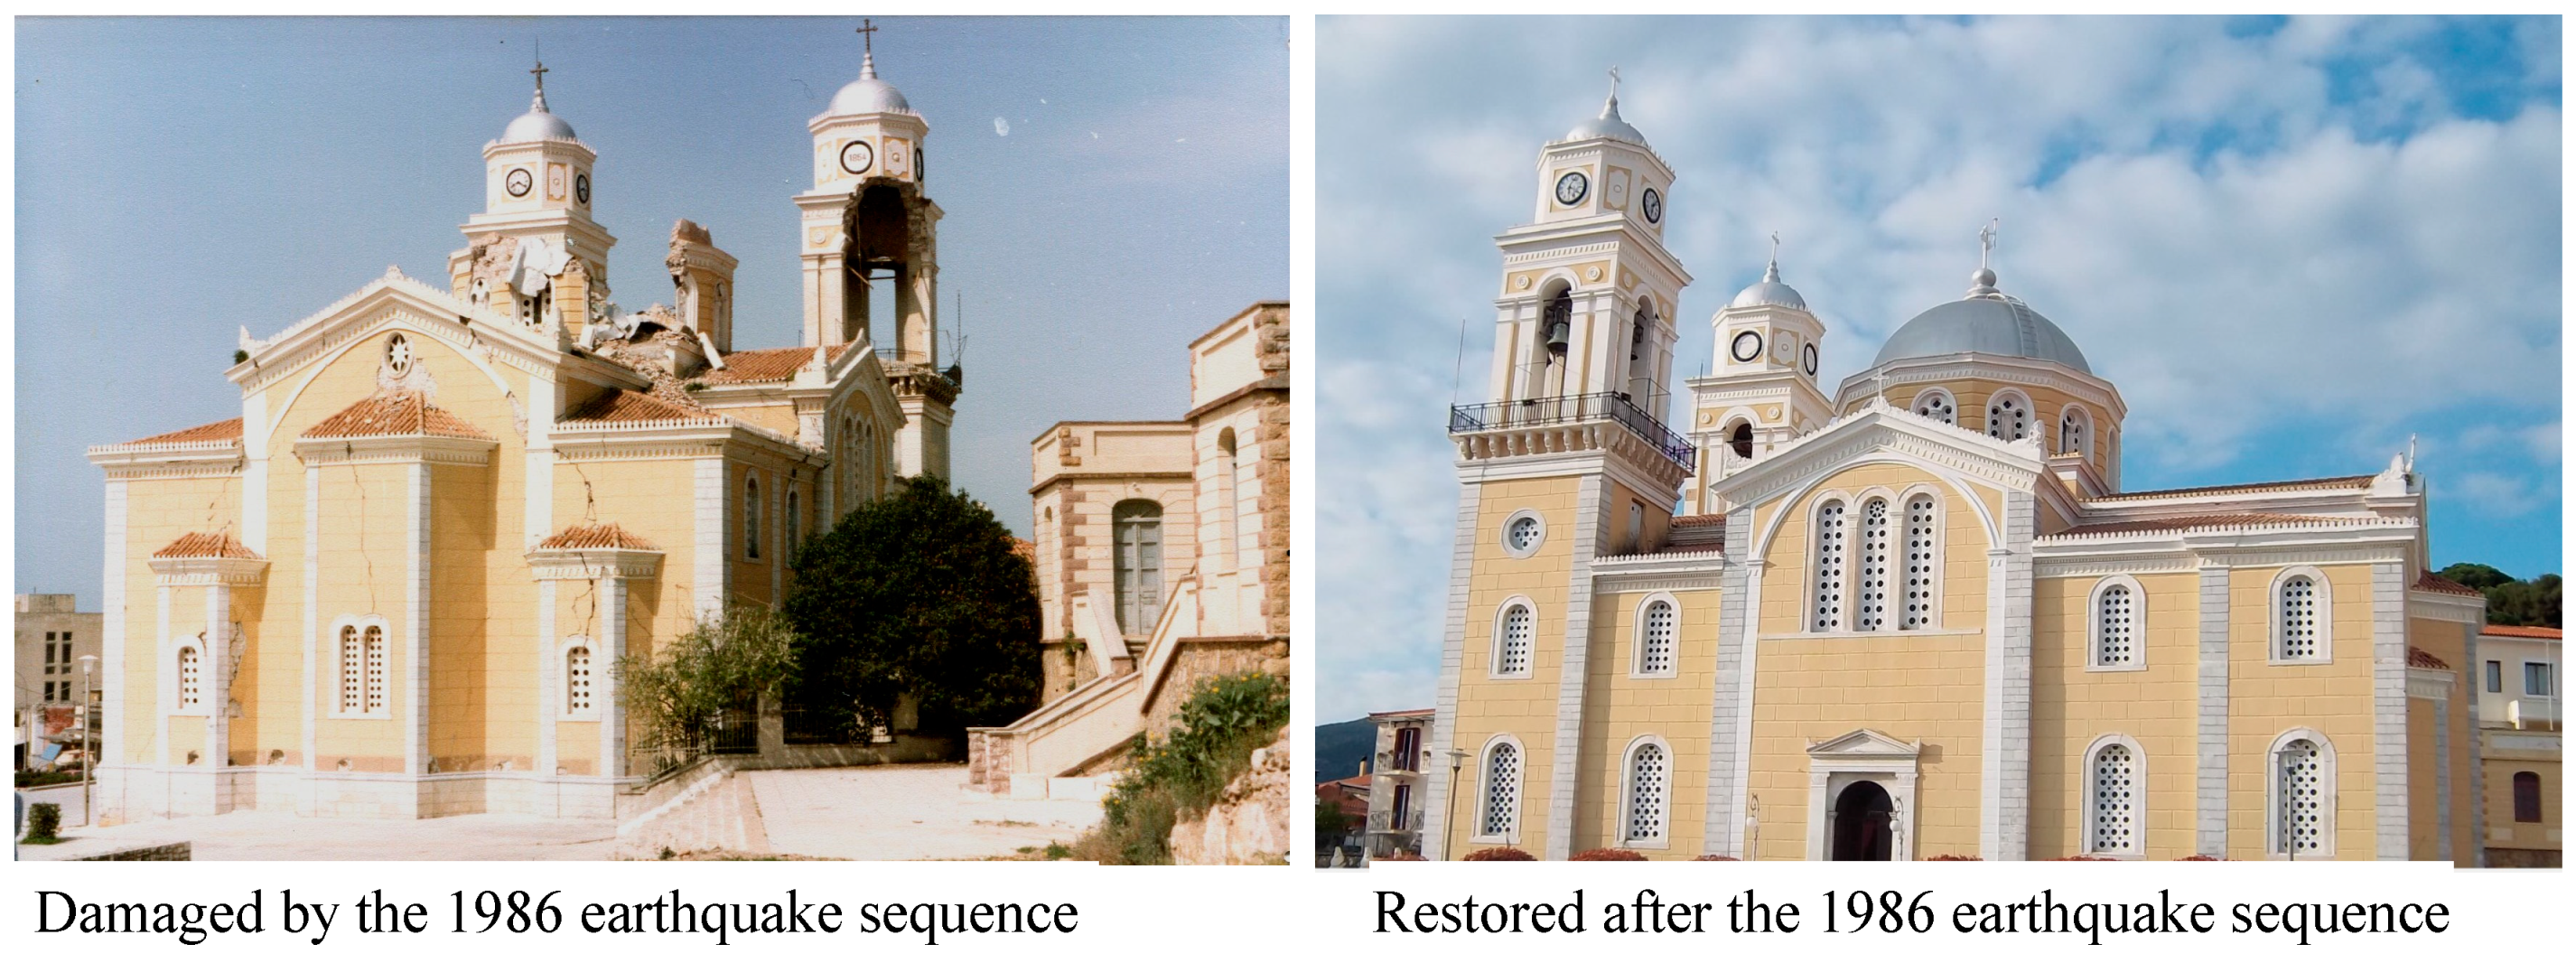
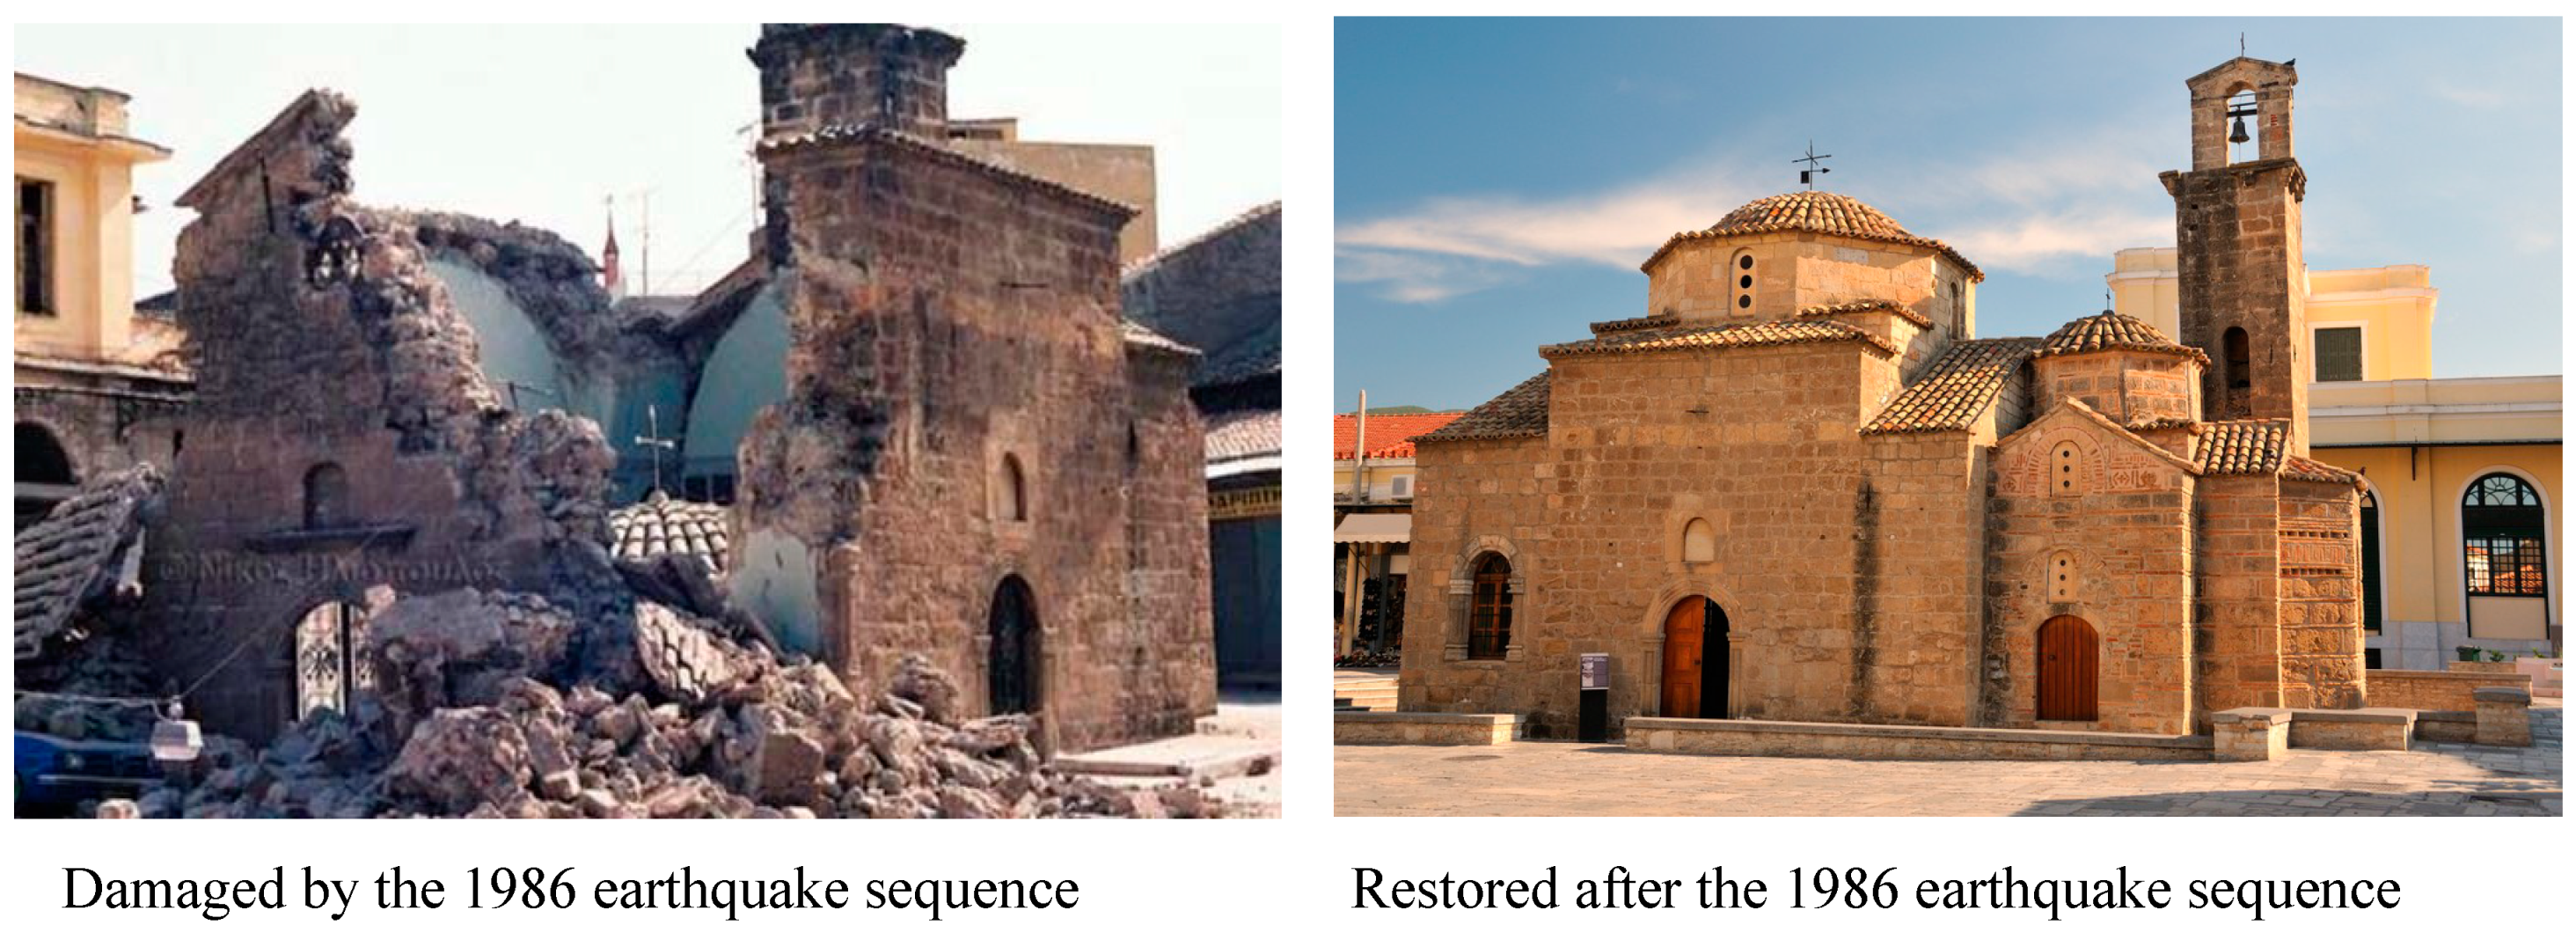
A heavy task after numerous strong earthquake events during the last 50 years in many regions of Greece has been the structural rehabilitation of old masonry churches. This is also the case for masonry churches which sustained heavy structural damage in the city of Kalamata during the 1986 strong earthquake sequence. Numerous churches in this city as well as in the surrounding area were damaged. Figure 24 and Figure 25 depict two such cases located in the centre of Kalamata. The heavy structural damage of the peripheral walls in these two churches was accompanied by the collapse of the central dome and the partial collapse of the bell towers; similar damage patterns were observed in many churches during the 2009 L’Aquila earthquake [14]. These figures also show the condition of these two churches today. It must be underlined that due to this structural rehabilitation effort for numerous cultural heritage structures in Greece over the last fifty years very valuable scientific and technical knowledge has been gained in this field.
Certain comments are also due relevant to the numerical tools presented in Section 3, Section 4 and Section 5. It was stressed, when outlining the numerical process in Section 3 and the corresponding numerical predictions of the structural performance in Section 4 and Section 5, that both numerical approaches are based on simplified assumptions. In both approaches, that is the linear numerical simulation which assumes non-failing masonry wall inter-connections or the non-linear numerical simulation which assumes flexible masonry wall inter-connections or foundation uplift, one of the major obstacles is to be able to quantify all these numerical assumptions with realistic limit-state values. This difficulty is due to the immense variability of old stone masonry in terms of materials and construction techniques and the subsequent lack of relevant in-situ or laboratory measurements. Recordings of the dynamic response of a particular structure from in-situ man-made excitations can be utilized in order to validate a given numerical simulation [6,7]. During the past decade, numerous researchers have proposed the application of complex numerical simulations for predicting the performance of old stone masonry structures like then ones investigated here. However, these complex numerical simulations are faced with the already mentioned obstacles; that is the immense variability of old stone masonry in terms of materials and construction techniques and the subsequent lack of relevant in-situ or laboratory measurements. Therefore, it is essential not to rely on the complexity of the numerical modelling; instead to follow a number of limit state scenarios, like those presented in Section 4 and Section 5, ensuring that these are based on a certain degree of realism for every particular case being studied [36].

7. Conclusions

1. A systematic study of the performance of damaged stone masonry structures representing “Basilica” Christian churches substantiates two fundamental causes; the long-term permanent uneven foundation settlement combined with seismic forces generated from relatively strong earthquake ground motions.
2. A simplified evaluation process is presented based on a dynamic linear elastic numerical simulation for obtaining the imposed demands on the various structural elements. Next, towards predicting the structural performance use is made of strength over demand ratio values (Rτ, Rς, Rσ, RM). These are derived using the numerically predicted demands as well as capacities based on assumed strength properties of the masonry for distinct failure modes which correspond to in-plane shear, compression or tension as well as out-of-plane flexure limit states.
3. Limited experimental results are also presented in an effort to verify up to a point the validity of the assumed strength values for the masonry at hand.
4. This simplified evaluation process, is applied to selected cases of “Basilica” Christian churches. It is demonstrated that reasonably good agreement can be obtained when compared to observed behaviour either for a case of foundation settlement or a case of strong earthquake excitation. This fact must be considered together with the simplified process basic limitation which is the assumption that the interconnections of masonry walls between themselves or with the roof remain in-tact.
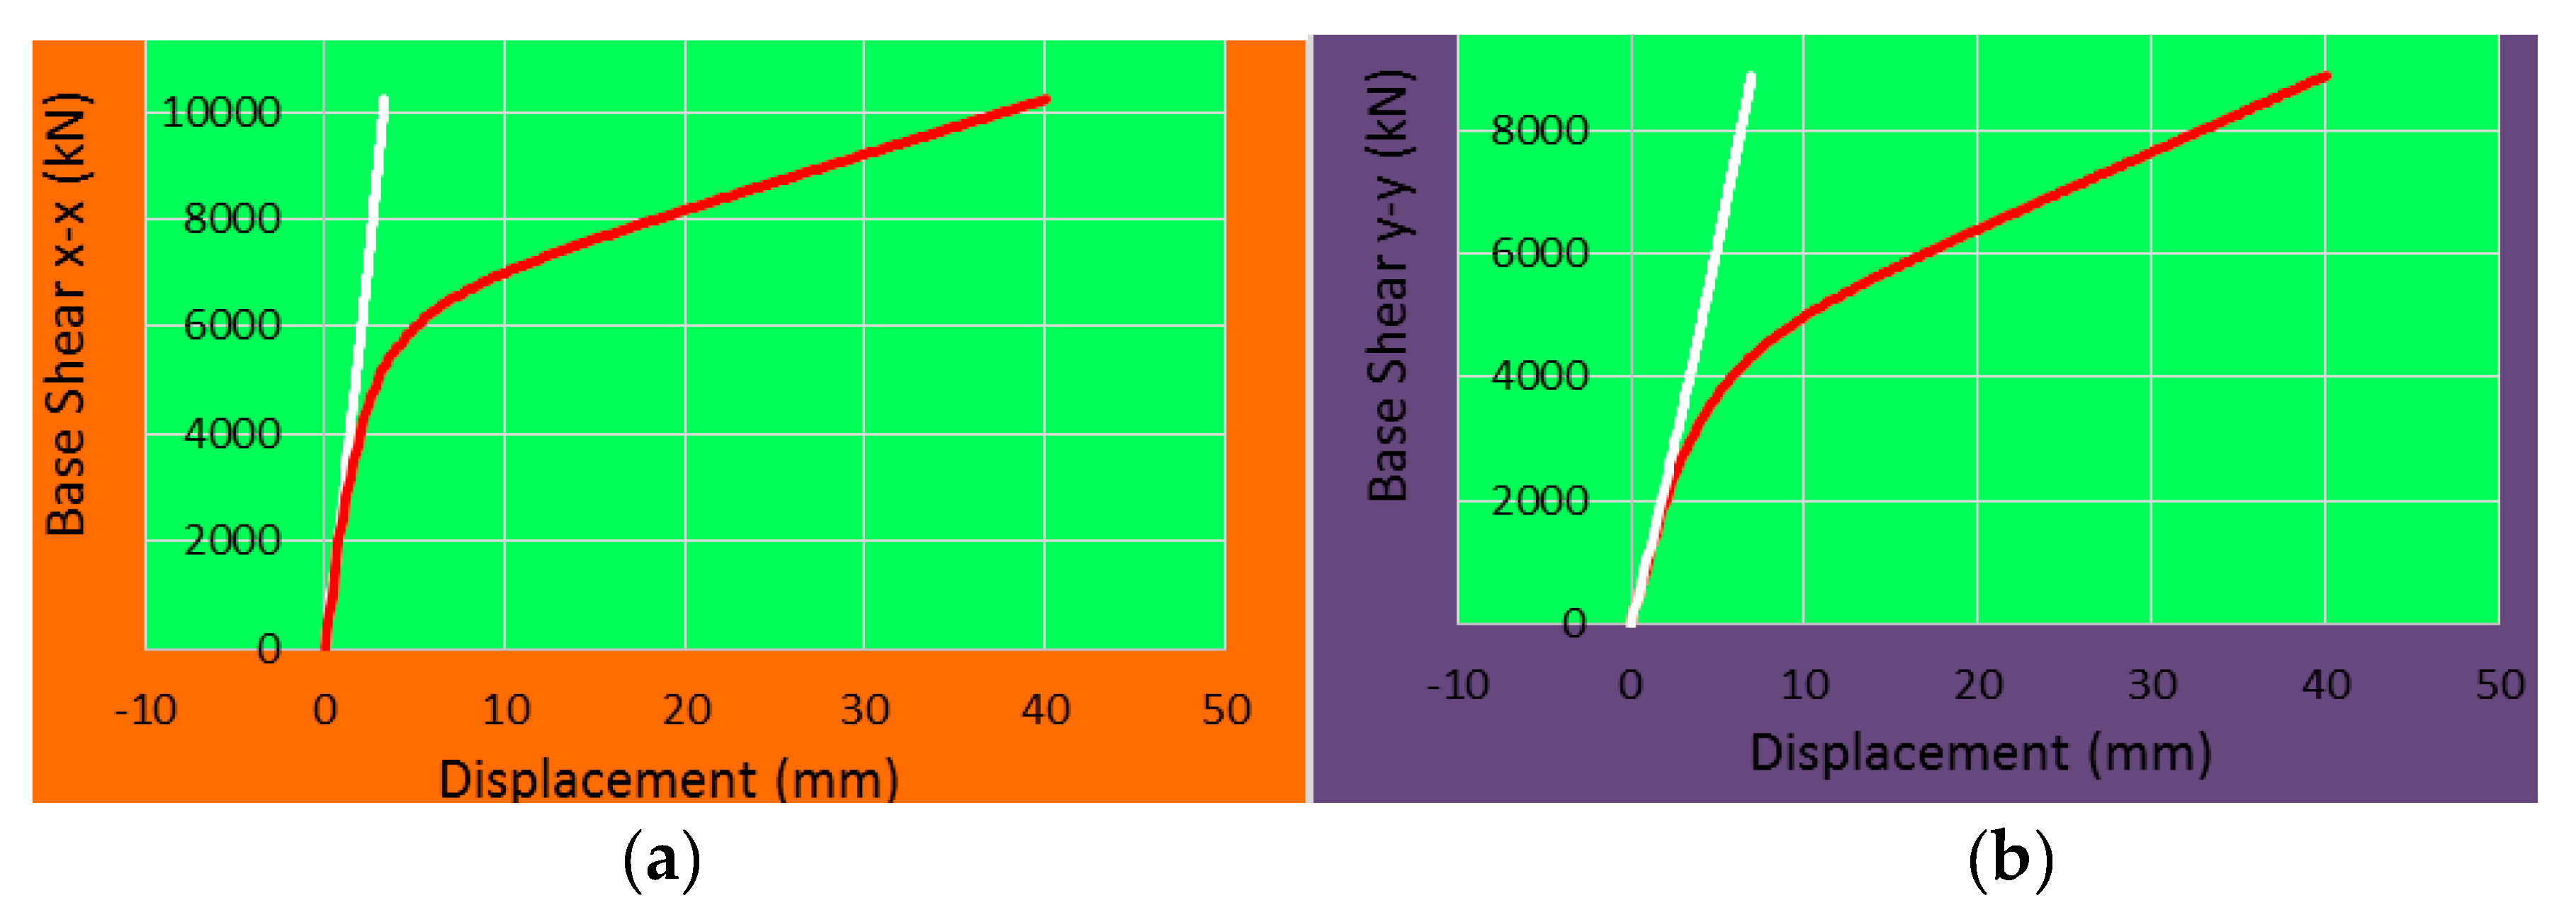
5. In order to deal with this limitation, push-over step-by-step non-linear numerical analyses were next performed. These non-linear analyses include the potential of foundation uplift as well as the potential of the masonry walls to be detached from their interconnections either at their corners or at their connection with the roof.
6. It is shown that both these type of analyses, that is the simplified dynamic linear elastic analysis and the “push-over” non-linear step-by-step non-linear analysis can be used in a combined way in order to achieve a more realistic prediction of the expected performance of such stone masonry structures.
7. The necessity to obtain a more comprehensive set of measured strength properties for such type of masonry construction must be also underlined. This is necessary in order to increase the confidence on the validity of simple or complex numerical approximations.
8. Complex numerical simulations in predicting the performance of old masonry structures should not be considered a’ priori with a high degree of confidence. They are also faced with the immense variability of old stone masonry in terms of materials and construction techniques and the subsequent lack of relevant in-situ or laboratory measurements. Therefore, it is essential not to rely on the complexity of the numerical modelling; instead to follow a number of limit state scenario, like those presented in Section 4 and Section 5, ensuring that these are based on a certain degree of realism for every particular case being studied.

Author Contributions

G.C.M., L.K. and E.K. had equal contribution. In addition, G.C.M. wrote the manuscript.

Funding

This research received no external funding.

Conflicts of Interest

The authors declare no conflict of interest.

References

  1. Manos, G.C. Consequences on the urban environment in Greece related to the recent intense earthquake activity. Int. J. Civ. Eng. Architect. 2011, 5, 1065–1090. [Google Scholar]
  2. Zhang, N.; Tan, K.-H. Effects of support settlement on continuous deep beams and STM modelling. Eng. Struct. 2010, 32, 361–372. [Google Scholar] [CrossRef]
  3. Naser, M.Z.; Hawileth, R.A. Predicting the response of continuous RC deep beams under varying levels of differential settlement. Front. Struct. Civ. Eng. 2018. [Google Scholar] [CrossRef]
  4. Croci, G. The Conservation and Structural Restoration of Architectural Heritage; Computational Mechanics Publication: Southampton, UK; Boston, MA, USA, 1998; ISBN 1-85312-4826. [Google Scholar]
  5. Jones, C.J.F.P. Defects originating in the ground. In The Maintenance of Brick and Stone Masonry Structures; Sowden, A.M., Ed.; 1990; Chapter 9; ISBN 0419-14930-9. Available online: https://www.amazon.com/Maintenance-Brick-Stone-Masonry-Structures/dp/0419149309 (accessed on 29 April 2019).
  6. Manos, G.C.; Nick Simos, N.; Kozikopoulos, E. The Structural Performance of Stone-Masonry Bridges. In Structural Bridge Engineering; InTechOpen: London, UK, 2016; Chapter 4; ISBN 978-953-51-2689-8. Print ISBN 978-953-51-2688-1. [Google Scholar] [CrossRef]
  7. Simos, N.; Manos, G.; Kozikopoulos, E. Near- and far-field earthquake damage study of the Konitsa stone arch. Eng. Struct. 2018, 177, 256–267. [Google Scholar] [CrossRef]
  8. Sergio, L. Damage assessment of churches after L’Aquila earthquake (2009). Bull. Earthq. Eng. 2011. [Google Scholar] [CrossRef]
  9. Manos, G.C.; Soulis, V.J.; Karamitsios, N. The Performance of Post-Byzantine churches during the Kozani-1995 Earthquake—Numerical Investigation of their Dynamic and Earthquake Behaviour. In Proceedings of the 15WCEE, Lisbon, Portugal, 24–28 September 2012. [Google Scholar]
  10. Manos, G.C.; Soulis, V.; Felekidou, O.; Matsou, V. A Numerical Investigation of the Dynamic and Earthquake Behaviour of Byzantine and Post-Byzantine Basilicas. In Proceedings of the 3rd International Workshop on Conservation of Heritage Structures Using FRM and SHM, Ottawa, ON, Canada, 11–13 August 2010. [Google Scholar]
  11. GEER-EERI-ATC. Cephalonia GREECE Earthquake Reconnaissance January 26th/February 2nd 2014. Report No. GEER-034, Report date 06-06-2014. Available online: http://www.geerassociation.org/index.php/component/geer_reports/?view=geerreports&id=32 (accessed on 29 April 2019). [CrossRef]
  12. Manos, G.C.; Kozikopoulos, E. The Dynamic and Earthquake Response of Basilica Churches in Kefalonia-Greece including Soil-Foundation Deformability and Wall Detachment. In Proceedings of the CompDyn 2015, Crete, Greece, 25–27 May 2015. [Google Scholar]
  13. Manos, G.C. The Seismic Behaviour of Stone Masonry Greek Orthodox Churches. J. Architect. Eng. 2016, 1, 44–53. [Google Scholar] [CrossRef]
  14. Modena, C.; Casarin, F.; da Porto, F.; Munari, M. L’Aquila 6th April 2009 Earthquake: Emergency and Post-emergency Activities on Cultural Heritage Buildings. In Earthquake Engineering in Europe, Geotechnical, Geological, and Earthquake Engineering; Garevski, M., Ansal, A., Eds.; Springer Science+Business Media B.V.: Berlin, Germany, 2010; Volume 17, Available online: https://link.springer.com/book/10.1007/978-90-481-9544-2 (accessed on 29 April 2019). [CrossRef]
  15. Cerone, M.; Viscovic, A.; Carriero, A.; Sabbadini, F.; Capparela, L. The Soil Stiffness Influence and the Earthquake Effects on the Colosseum in Roma. In Proceedings of the 2nd Internationl Conference on Studies in Ancient Structures, Istanbul, Turkey, 9–13 July 2001; pp. 421–426. [Google Scholar]
  16. Manos, G.C.; Karamitsios, N. Numerical simulation of the dynamic and earthquake behavior of Greek post-Byzantine churches with and without base isolation. In Earthquake Engineering Retrofitting of Heritage Structures, Design and Evaluation of Strengthening Techniques; Syngellakis, S., Ed.; Wessex Institute of Technology: Southampton, UK, 2013; pp. 171–186. ISBN 978-1-84564-754-4. eISBN 978-1-84564-755-1. [Google Scholar]
  17. SAP2000, Integrated Software for Structural Analysis and Design; Computers and Structures Inc. Available online: https://www.csiamerica.com/products/sap2000 (accessed on 29 April 2019).
  18. Abaqus Unified FEA-SIMULIA™ by Dassault Systèmes. Available online: https://www.3ds.com/products-services/simulia/products/abaqus/ (accessed on 29 April 2019).
  19. Manos, G.C.; Kozikopoulos, E. In-situ measured dynamic response of the bell tower of Agios Gerasimos in Lixouri-Kefalonia, Greece and its utilization in the numerical predictions of its earthquake response. In Proceedings of the CompDyn 2015, Crete, Greece, 25–27 May 2015. [Google Scholar]
  20. European Committee for Standardization. Euro-Code 6: Design of Masonry Structures, Part 1-1: General Rules for Building. Rules for Reinforced and Un-Reinforced Masonry; EN 1996-1-1; European Committee for Standardization: Brussels, Belgium, 2005. [Google Scholar]
  21. Tomaževič, M. Shear resistance of masonry walls and Eurocode 6: shear versus ten-sile strength of masonry. Mater. Struct. 2009, 42, 889–907. [Google Scholar] [CrossRef]
  22. Turnsek, V.; Cacovic, F. Some experimental results on the strength of brick masonry walls. In Proceedings of the 2nd International Brick-Masonry Conference, Stoke-on-Trent, UK, 12–15 April 1971; pp. 149–156. [Google Scholar]
  23. Binda, L.; Saisi, A.; Tiraboschi, C. Investigation procedures for the diagnosis of historic masonries. Contruct. Build. Mater. 2000, 14, 199–233. [Google Scholar] [CrossRef]
  24. Vintzileou, E. Effect of Timber Ties on the Behavior of Historic Masonry. J. Struct. Eng. 2008, 134. [Google Scholar] [CrossRef]
  25. Cattari, S.; Lagomarsino, S. A strength criterion for the flexural behaviour of spandrels in un-reinforced masonry walls. In Proceedings of the 14th WCEE, Beijing, China, 12 October 2008. [Google Scholar]
  26. Beyer, K.; Mangalathu, S. Review of strength models for masonry spandrels. Bull. Earthq. Eng. 2013, 11, 521–542. [Google Scholar] [CrossRef]
  27. Betti, M.; Galano, L.; Vignoli, A. Seismic response of masonry plane walls: A numerical study on spandrel strength. AIP Conf. Proc. 2008, 1020, 787–794. [Google Scholar]
  28. Beyer, K.; Mangalathu, S. Numerical study on the peak strength of masonry spandrels with arches. J. Earthq. Eng. 2014, 18, 169–186. [Google Scholar] [CrossRef]
  29. Manos, G.C.; Soulis, V.J.; Diagouma, A. Numerical Investigation of the behaviour of the church of Agia Triada, Drakotrypa, Greece. Adv. Eng. Softw. 2007, 39, 284–300. [Google Scholar] [CrossRef]
  30. Manos, G.C.; Kotoulas, L.; Felekidou, O.; Vaccaro, S.; Kozikopoulos, E. Earthquake damage to Christian Basilica Churches—Application of an expert system for the preliminary in-plane design of stone masonry piers. In Proceedings of the International Conference on STREMAH 2015, A Coruna, Spain, 13–15 July 2015; WIT Press: Southampton, UK, 2015. [Google Scholar]
  31. Manos, G.C.; Kotoulas, L. Unreinforced stone masonry under in-plane state of stress from gravitational and seismic actions. Measured and predicted behavior. In Proceedings of the CompDyn2017, Rhodes Island, Greece, 15–17 June 2017. [Google Scholar]
  32. Papaioannou, C. Strong Ground Motion of the 3rd February 2014, (M = 6.0) Kefalonia Earthquake. Institute of Earthquake Engineering and Engineering Seismology Report. 2014. Available online: http://www.itsak.gr/news/news/79 (accessed on 29 April 2019).
  33. European Committee for Standardization. Euro-Code 8: Design of Structures for Earthquake Resistance—Part 1: General Rules, Seismic Actions and Rules for Buildings; Final Draft prEN 1998-1; European Committee for Standardization: Brussels, Belgium, 2003. [Google Scholar]
  34. Manos, G.C. International Handbook of Earthquake Engineering: Codes, Programs and Examples; Seismic Code of Greece; Paz, M., Ed.; Chap-Man and Hall: London, UK, 1994; Chapter 17; ISBN 0-412-98211-0. [Google Scholar]
  35. Provisions of Greek Seismic Code with Revisions of Seismic Zonation; Government Gazette: Athens, Greece, 2003.
  36. Limoge Schraen, C.; Giry, C.; Desprez, C.; Ragueneau, F. Tools for a large-scale seismic assessment method of masonry cultural heritage. In Structural Studies, Repair and Maintenance of Cultural Heritage, STREMAH XIV; WIT Press: Southampton, UK, 2015; ISBN 978-1-84564-968-5. [Google Scholar]
Figure 1. (a) The Basilica structural system with the interior colonnade of the central nave; (b) The Basilica structural system with the peripheral longitudinal and transverse walls.
Buildings 09 00106 g001
Figure 2. (a). Masonry vaulting; (b). Church of delle Anime Sante, L’Aquila earthquake 2009.
Buildings 09 00106 g002
Figure 3. (a) Heavy damage of the East wall. South-East view; (b) Heavy damage of the North wall. North-West view; (c) Heavy damage of the vaulting superstructure.
Buildings 09 00106 g003
Figure 4. The “Basilica” church of Profitis Ilias at Siatista – Kozani (a) Longitudinal cross-section; (b) Wooden shoring of South longitudinal wall.
Buildings 09 00106 g004
Figure 5. Typical damage patterns of longitudinal walls.
Buildings 09 00106 g005
Figure 6. Typical in-plane damage of transverse wall.
Buildings 09 00106 g006
Figure 7. Typical out-of-plane damage of longitudinal wall. Kozani-Greece Earthquake 1995.
Buildings 09 00106 g007
Figure 8. Typical out-of-plane damage of longitudinal wall. Kozani-Greece Earthquake 1995.
Buildings 09 00106 g008
Figure 9. Formation of the 3-D numerical approximation.
Buildings 09 00106 g009
Figure 10. (a). Short stone masonry specimen subjected to sliding shear; (b) Sliding mode of failure of short stone masonry specimen.
Buildings 09 00106 g010
Figure 11. Non-deformable foundation (a) distribution of maximum tensile stresses South-East view (b) distribution of maximum tensile stresses North-East view. The scale at the far right of each plott indicates that the colours used to represent stress values in this numerical representation of the structure are ranging from 0.1 MPa to −0.1 MPa. Yellow colour indicates stress values excedding 0.1MPa.
Buildings 09 00106 g011
Figure 12. Deformable foundation (a) distribution of maximum tensile stresses South-East view (b) distribution of maximum tensile stresses North-East view. The scale at the far right of each plott indicates that the colours used to represent stress values in this numerical representation of the structure are ranging from 0.1 MPa to −0.1 MPa. Yellow colour indicates stress values excedding 0.3 MPa.
Buildings 09 00106 g012
Figure 13. Correlation between predicted (deformable foundation) and observed damage.
Buildings 09 00106 g013
Figure 14. The numerical simulation of the “Basilica” church of St. Marina in Soullaroi in Kefalonia. (a) Longitudinal direction; (b) Transverse direction.
Buildings 09 00106 g014
Figure 15. Constant ductility response spectral curves of the Chavriata record, Kefalonia 2014 earthquake together with the relevant Euro-Code 8 design spectral curves: (a) N-S component (b) E-W component.
Buildings 09 00106 g015
Figure 16. Summary results of the evaluation process in terms of , , RM ratio values, for moderately deformable foundation (axial stiffness value of supporting links equal to 24.5 KN/mm).
Buildings 09 00106 g016
Figure 17. Photographs and sketches of the most severe structural damage.
Buildings 09 00106 g017
Figure 18. Damage at the N-W corner.
Buildings 09 00106 g018
Figure 19. (a) Non-linear links to simulate uplifting of the structure at the soil-foundation interface; (b) Non-linear links to simulate detachment between the roof and the masonry walls or between vertical walls at the corners.
Buildings 09 00106 g019
Figure 20. (a) Push-over in the East-West direction (Ey), foundation uplift; (b) Push-over in the North-South direction (Ex), foundation uplift.
Buildings 09 00106 g020
Figure 21. (a) Push-over in the East-West direction (Ey)—detachment of the West wall; (b) Push-over in the North-South direction (Ex)—detachment of the North wall.
Buildings 09 00106 g021
Figure 22. Images of total destruction to old masonry construction in Argostoli, Kefalonia island during the 1953 earthquake sequence.
Buildings 09 00106 g022
Figure 23. The church of Taxiarchis in Eani, Kozani prefecture.
Buildings 09 00106 g023
Figure 24. The church of Ipapanti in the centre of Kalamata.
Buildings 09 00106 g024
Figure 25. The church of Holy Apostles in the centre of Kalamata.
Buildings 09 00106 g025
Table 1. Comparison between measured and predicted shear strength values.
Code Name of Tested SpecimenMeasured Value fvk (Mpa)Applied Level of Normal Stress σn (Mpa)Predicted fvk (Mpa)Ratio Measured fvk/Predicted fvk
(1)(2)(3)(4)(5)
Sample 10.3960.530.3591.103
Sample 20.410.610.3951.038
Sample 30.3050.460.3270.933
Sample 4α0.200.300.2550.784
Sample 4β0.3750.540.3631.033
Table 2. Assumed Mechanical Characteristics of the Stone Masonry in N/mm2 (MPa).
Shear Strength fvko for Zero (σn) Normal Stress (MPa)Tensile Strength Normal (fxk1)/Parallel (fxk2) to Bed-Joint (MPa)Compressive Strength fk (MPa)Young’s Modulus E (MPa)Poisson’s Ratio
(1)(2)(3)(4)(5)
0.160.15/0.603.5010000.2
Table 3. Base shear Values (KN) based on the Chavriata response spectra (which is the most demanding).
Studied Church/Soil ConditionsN-S (Transverse x-x)E-W (Longitudinal y-y)
St. Marina Soullaroi/Hard Soil52298397
St. Marina Soullaroi/Soft Soil58038828

