Application of Artificial Neural Networks for Multi-Criteria Yield Prediction of Winter Rapeseed


Institute of Biosystems Engineering, Faculty of Agronomy and Bioengineering, Poznań University of Life Sciences, Wojska Polskiego 50, 60-627 Poznań, Poland
Sustainability 2019, 11(2), 533; https://doi.org/10.3390/su11020533
Submission received: 13 December 2018
/
Revised: 8 January 2019
/
Accepted: 17 January 2019
/
Published: 20 January 2019
(This article belongs to the Special Issue Sustainable Crop Production Systems)
Abstract
:The aim of the work was to produce three independent, multi-criteria models for the prediction of winter rapeseed yield. Each of the models was constructed in such a way that the yield prediction can be carried out on three dates: April 15th, May 31st, and June 30th. For model building, artificial neural networks with multi-layer perceptron (MLP) topology were used, on the basis of meteorological data (temperature and precipitation) and information about mineral fertilisation. The data were collected from the years, 2008–2015, from 328 production fields located in Greater Poland, Poland. An assessment of the quality of forecasts produced based on neural models was verified by determination of forecast errors using RAE (relative approximation error), RMS (root mean square error), MAE (mean absolute error) error indicators, and MAPE (mean absolute percentage error). An important feature of the produced prediction models is the ability to realize the forecast in the current agrotechnical year on the basis of the current weather and fertiliser information. The lowest MAPE error values were obtained for the neural model WR15_04 (April 15th) based on the MLP network with structure 15:15-18-11-1:1, which reached 7.51%. Other models reached MAPE errors of 7.85% for model WR31_05 (May 31st) and 8.12% for model WR30_06 (June 30th). The performed sensitivity analysis gave information about the factors that have the greatest impact on winter rapeseed yields. The highest rank of 1 was obtained by two networks for the same independent variable in the form of the sum of precipitation within a period from September 1st to December 31st of the previous year. However, in model WR15_04, the highest rank obtained a feature in the form of a sum of molybdenum fertilization in the current year (MO_CY). The models of winter rapeseed yield produced in the work will be the basis for the construction of new forecasting tools, which may be an important element of precision agriculture and the main element of decision support systems.
1. Introduction
The prediction of the quantity and quality of crop yields is very important in terms of planning, use as a means of production, current decision-making, transport, stockholding, and risk management [1,2,3]. The prediction of yields during the growing season is the basis for estimating production levels and expected yields at the end of the growing season, and therefore the amount of income [4].
The results of plant production are strongly influenced by atmospheric conditions, which may vary due to climate changes. Reliable estimates of the effects of climate change require the integration of meteorological and crop data in the produced models [5]. The yield of plants depends on a large number of factors, which are often correlated with each other and directly or indirectly affect the yield of a particular plant. The most common factors are soil factors (pH, structure, organic matter content, nutrient levels), weather and climate factors (air temperature, precipitation, sunshine), soil cultivating technology, plant variety, fertilisation technology and level, plant protection, harvesting technology, and crop rotation [6].
Modern technologies of cultivation and harvesting of plants have an increasing impact on the increase in the quantity and quality of yields. It is also connected with the possibility of using linear and non-linear prediction models used to perform simulations before harvest, and, as a consequence, to optimize the production process [1]. For example, in [7], the artificial neural network (ANN) and linear regression method (MLR) were used to build the Ajowan (Trachyspermum ammi L.) yield model. It was shown that all parameters of the model, i.e., determination coefficient (R2), mean absolute error (MAE), and root mean square error (RMS) are better for the ANN model than for MLR. Similarly, in [8], the ANN and MLR methods were used to produce a model of safflower yield (Carthamus tinctorius L.). The results of analyses (R2, MAE, RMS) also confirm better results for ANN models than MLR models. Therefore, crop yield models are used to develop forecasting tools, which can be an important element of high-precision agriculture and the main element of the decision-making support systems [9]. Precision agriculture can help in managing crop production inputs in an environmentally friendly way. By using site-specific knowledge, precision agriculture can target rates of fertilizer, seed and chemicals for soil, and other conditions. The concepts of precision agriculture and sustainability are inextricably linked. From the first time a global positioning system was used on agricultural equipment, the potential for environmental benefits has been discussed. Intuitively, applying fertilizers and pesticides only where and when they are needed should reduce the environmental burden [10].
Non-linear models are becoming more and more popular in practice. A particular increase can be observed in the use of artificial neural networks in agriculture, where better analysis results are often obtained than with classical statistical methods [1,6,7,8,11,12,13,14,15,16,17,18,19].
The rapeseed is one of the most important oilseeds. It is a basic raw material for the food industry and an element of renewable energy sources as a component of biofuel for diesel engines. In this context, competition in land use between food and energy crops is becoming a critical issue. As a result, there is a growing demand for decision-making support tools [20,21,22].
Rapeseed is grown mainly in Europe, Canada, China, and India. In Poland, winter rapeseed was cultivated in 2016 on 826,946 ha of sown area. The average yield per 1 ha was 26.8 dt and the total production was 2,219,270 tons. Winter rape is a plant which occupies the third place in Poland in terms of total cultivated area. The share of Polish winter rapeseed production in the European Union in 2016 was ranked 3rd in 28 associated countries. First place was taken by France with an area of 1,550,720 ha and a total production of 4,727,961 tons [23].
In recent years, the growing importance of rapeseed cultivation has led to many attempts to adapt commonly known models of cultivation systems to simulate the yields of winter rapeseed. The examples are CERES—Crop Environment Resource Synthesis [24], AquaCrop—water-driven model [25], DSSAT—Decision Support System for Agrotechnology Transfer [26], and APSIM—Agricultural Production Systems sIMulator [27]. For a reliable and accurate yield prediction, it is necessary to obtain meteorological, cultivation, and fertilizer information. Unfortunately, most models are based on information from specialised research. Consequently, the use of prediction models based on such detailed data is not possible for a wide range of users. Therefore, the aim of this paper is to create multi-criteria yield models on the basis of information generally available to every farmer. These models are an important element of precision agriculture that is part of the concept of sustainability, including respect for the natural environment. The novelty in this paper is the selection of a data structure for the produced models. The division into meteorological data and information on fertilisation from the previous year and from the current year is presented. The data for the current year were additionally divided into three ranges and forecast dates—15th April, 31st May, and 30th June. All data necessary to simulate the yield comes from the period before winter rape harvest. Such actions lead to the minimisation of the forecast error. The dates for carrying out the forecast, i.e., 15 April, 31 May, and 30 June, were defined with the cooperation of farmers. On these dates, in Greater Poland, an initial estimation of winter rapeseed yield is made. Moreover, it is possible to simulate the yield at any time for future weather and fertilisation parameters. This makes it possible to build different scenarios for cultivation and care, harvest, storage, and making decisions about selling grain, considering price trends.
2. Materials and Methods
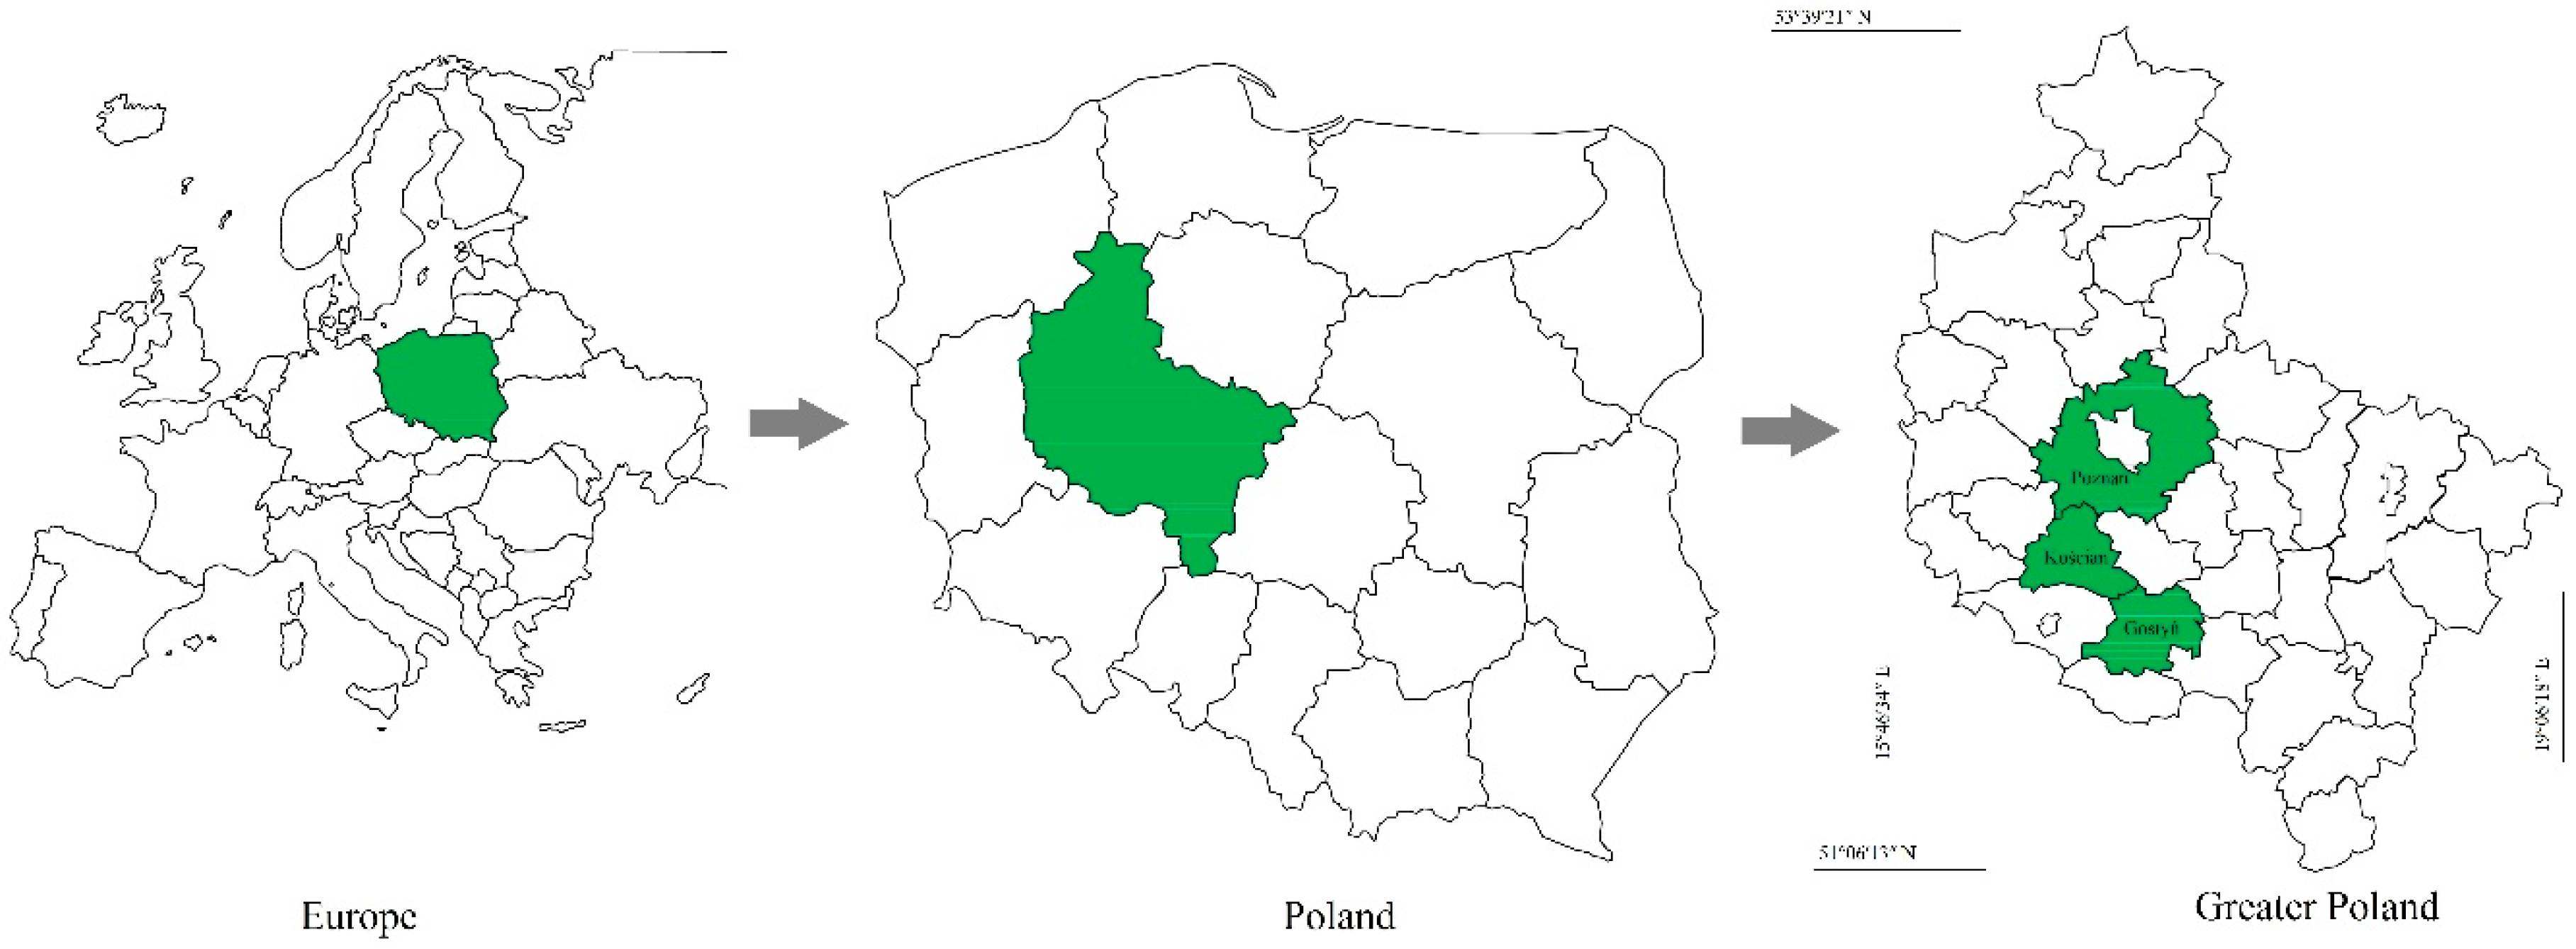
Prediction neural models were built based on data collected in the years, 2008-2015, from winter rapeseed fields located in Poland, in the central and south-western part of Greater Poland, and particularly in the districts of Poznań (52°24′29.759″ N 16°56′0.672″ E), Kościan (52°5′10.77″ N 16°38′41.998″ E), and Gostyń (51°53′5.762″ N 17°0′47.829″ E) (Figure 1). In total, data from 328 fields were used for model construction and verification (Table 1). This information formed the basis for the creation of a database for the construction of predictive neural models, which was divided into two sets, A and B. Set A (292 fields) is composed of information from 2008-2014, which was used to build models. Set B (36 fields) consists of information from 2015, which was not involved in model building, but was used for model validation.
Meteorological data—air temperature and precipitation for the research area and period—were obtained from Davis stationary and mobile meteorological stations located closest to the research area, namely in Kórnik, Gola, Turew, Piotrowo, and Stary Gołębin.
The construction of neural predictive models was prepared based on three predicted dates for a calendar year: April 15th, May 31st, and June 30th. The models have been named, respectively, WR15_04, WR31_05, and WR30_06. The models included factors (independent variables) that affect crop yields and are easily available to agricultural producers (Table 2).
This approach to the prediction of winter rapeseed yields enables the making of forecasts and the simulation of expected yields directly before harvesting, in the same agricultural year.
2.1. Method of Construction of Neural Models
Independent variables for the construction of neural models were selected in such a way that each neural network used a different number of independent variables, which are presented in Table 1 and Table 2.
In the selection of a network topology and learning method, consideration was taken of the network’s ability to approximate and generalise, based on measures of network quality. Using the Statistica v7.1 [28] program, it was possible to test networks with different architectures. For each of the neural models, WR15_04, WR31_05, and WR30_06, the number of networks tested was 10,000, with the use of an automated network designer (AND). Network selection was made based on the best parameters determining the network quality.
The set of empirical data was divided randomly into a learning set, a validation set, and a test set. The sizes of the sets were as follows: Learning set—204 cases; validation set—44 cases; testing set—44 cases. The set was divided in the proportions of 70%–15%–15%, taking account of the number of fields included in the study.
2.2. Methodology for Validating the Neural Models
Following the construction of neural models using the automate network designer, each model was evaluated based on information obtained from Statistica, namely the standard deviation, mean error, error deviation, mean absolute error, deviation quotient, and correlation. The best model was selected based on the smallest value of the mean absolute error and the largest value of the correlation.
In the next step, the predictive ability of the constructed neural models was evaluated using ex post measures of the prediction error, comparing data from set B with the results of the predictions made based on set A. These errors have the property that they are computed on the basis of materials from the past, namely expired predictions and the corresponding actual values of the predicted variable. The prediction error is the difference between the observed and predicted value.
Validation of the constructed models was performed based on data from the last year of the study (2015) and covering 36 fields of winter rapeseed. These data were not used in the construction of the neural models. The quality of the predictions was evaluated using a methodology widely described in the literature [2,29,30,31,32,33,34].
- RAE—relative approximation error:
- RMS—root mean square error:
- MAE—mean absolute error:
- MAPE—mean absolute percentage error:where,
- n—number of observations;
- —actual values obtained during research; and
- —values given by the model.
For better visualisation of the relations between the observed and predicted yield, graphs were plotted showing those relations for each prediction date.
2.3. Neural Network Sensitivity Analysis
In order to check which of the examined independent features contribute the most to the explanation of the variability of biological yields of winter rapeseed, a sensitivity analysis of the neural networks under construction was carried out. After removing a specific input variable (independent trait) from the model, its influence on the total error of the neural network can be observed, which allows the determination of the significance (influence on the output variable, i.e., yield) of individual independent traits. Two indicators were used for this purpose. The error quotient—this is the ratio of error to error obtained using all independent features, the larger this value is the greater is the significance of the given feature. If it is less than 1, a feature may be removed from the model in order to improve its quality, although this is not a compulsory procedure. Rank—this shows numerically the ordering of the features by decreasing error, a rank of 1 indicating the greatest significance for the network.
3. Results
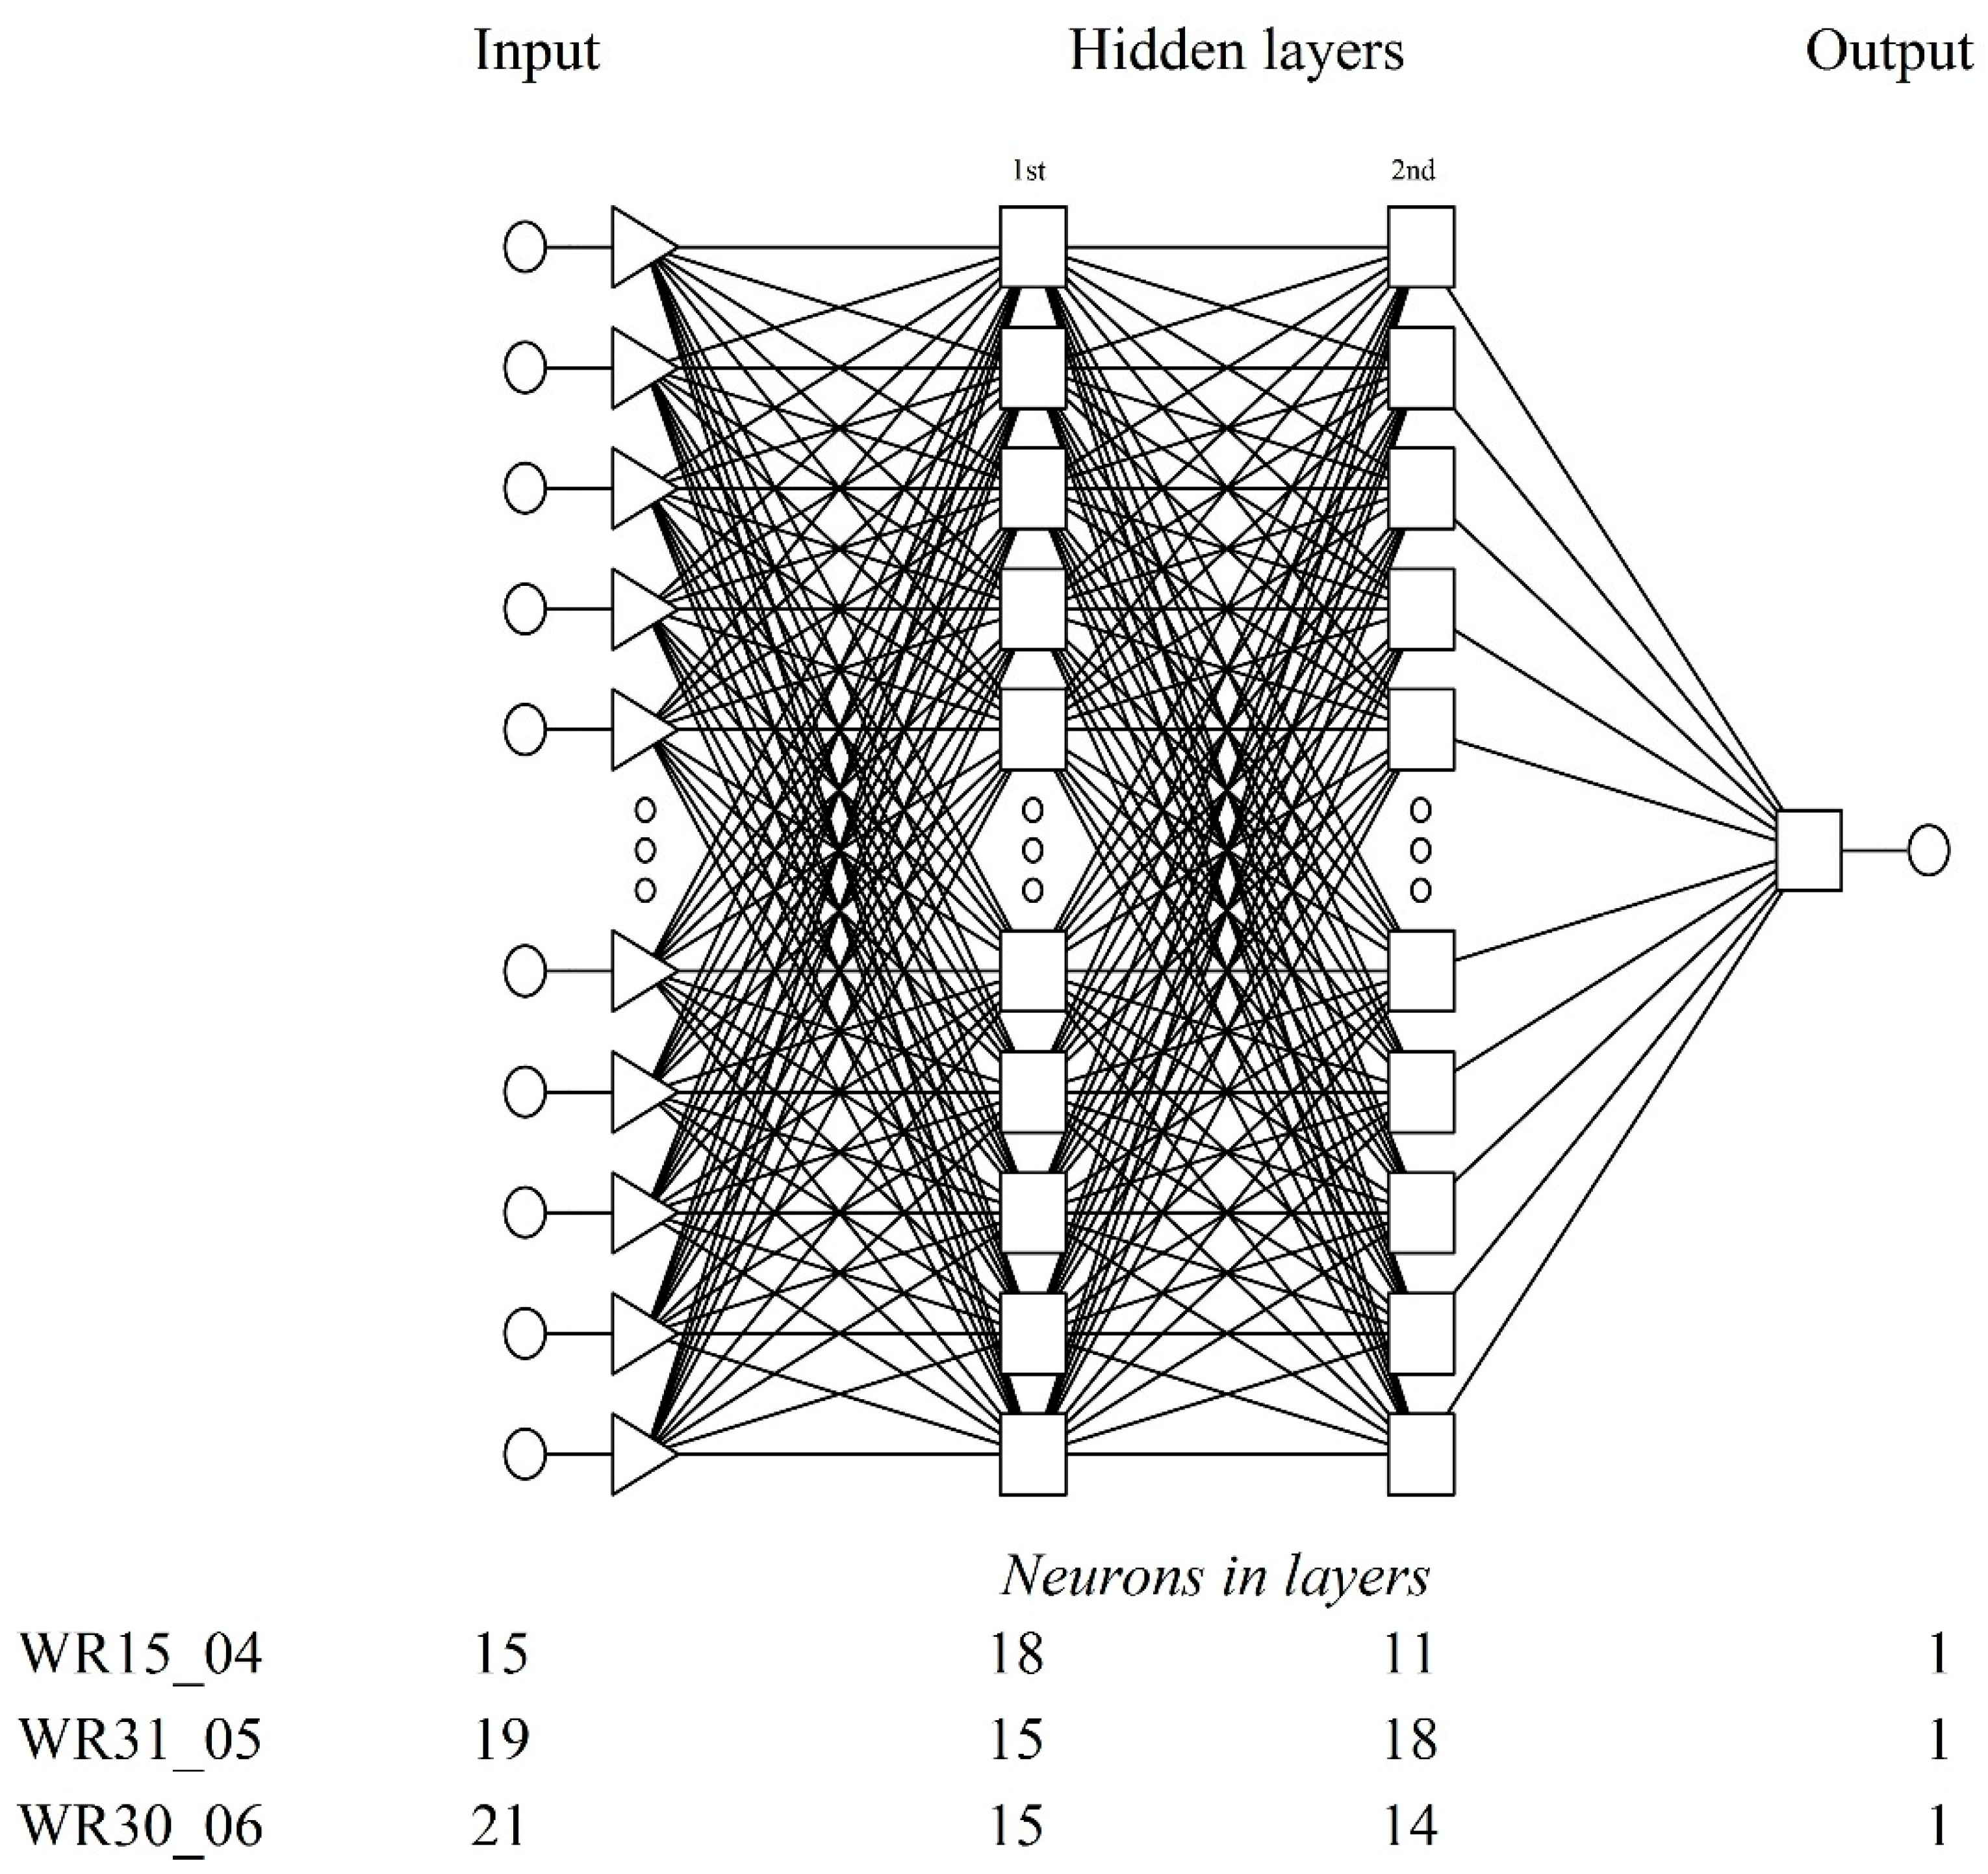
As a result of the analyses, one neural model was selected for each prediction date. Basic information on the quality of the neural models, WR15_04, WR31_05, and WR30_06, is given in Table 3. The general structure of the designed neural network model is presented in Figure 2.
To determine the quality of the prediction, computations applied for ex post methods were performed, using the formulae (1–4). The results are given in Table 4.
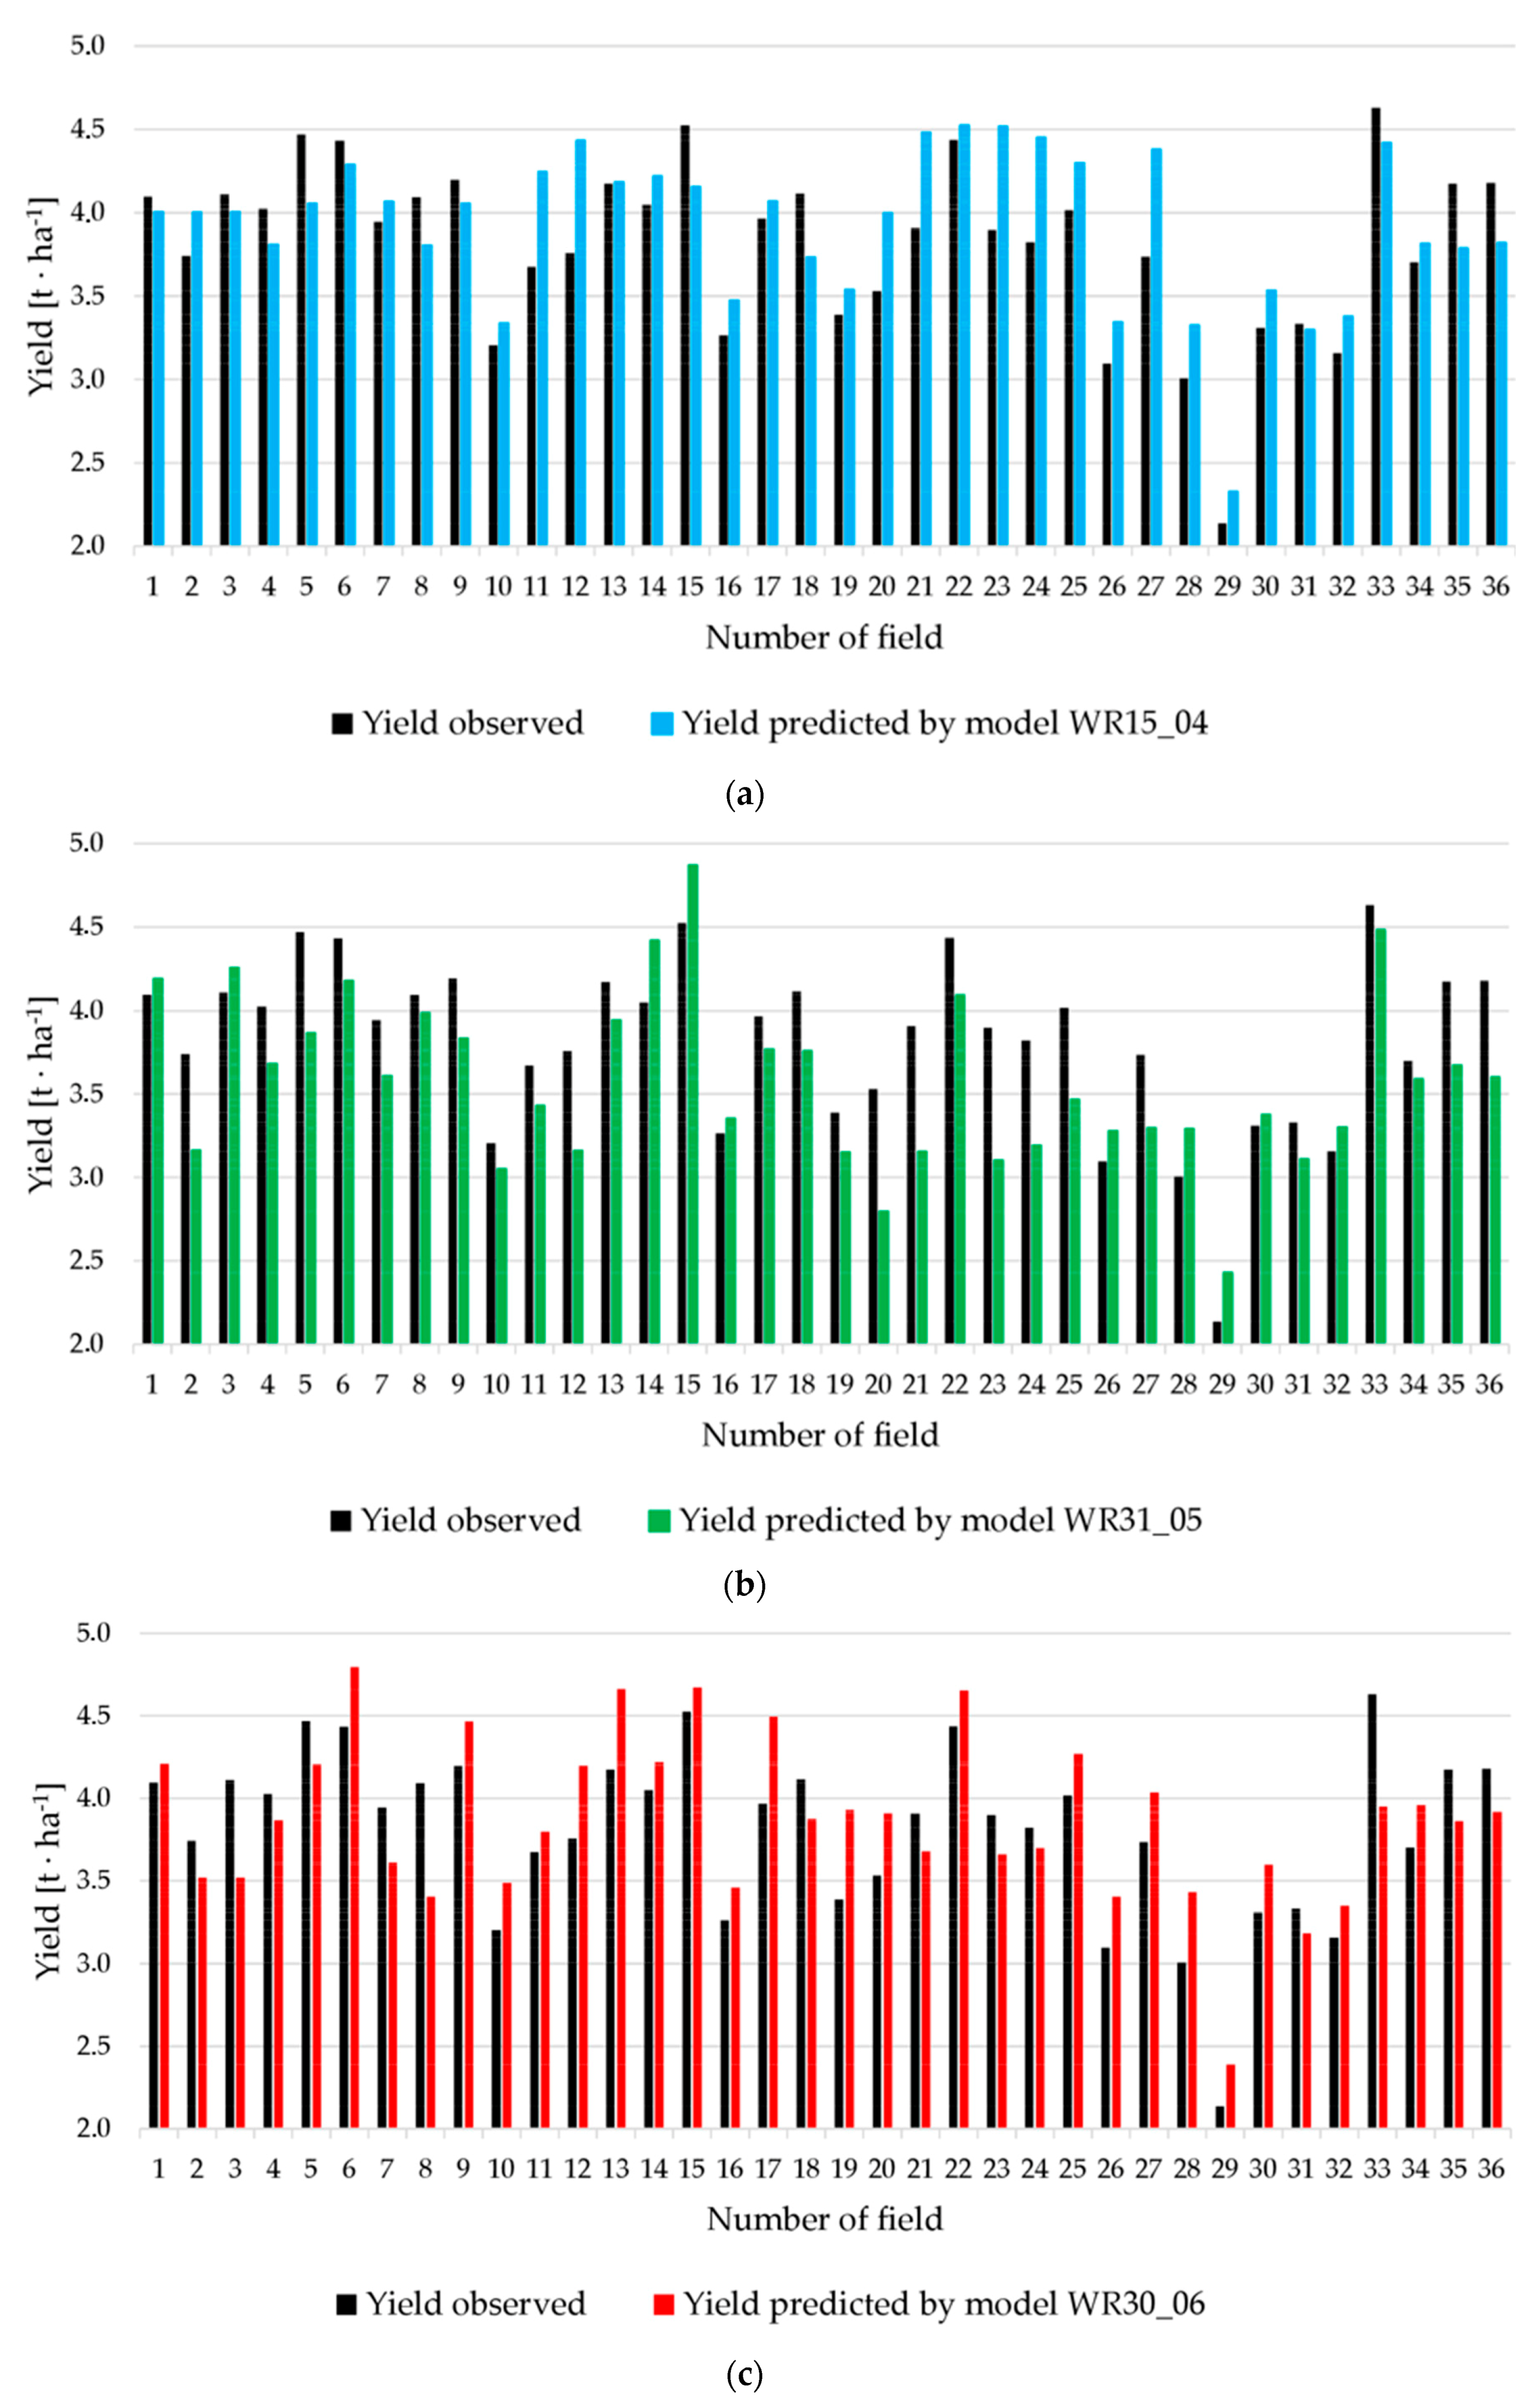
In the next step, graphs were plotted showing the relationship between the actual and forecasted yield for each prediction date. Figure 3 show this relationship for the models, WR15_04, WR31_05, and WR30_06, respectively.
Figure 3 shows a comparison of yield results for all models produced with the observed yield. As it is easy to notice, fields no. 29 and 33 definitely differ from the average value of the observed yield, which amounted to 3.81 t∙ha−1. For field no. 29, the observed yield was 2.14 t∙ha−1, and 4.63 t∙ha−1 for field no. 33. The average value of the forecast yield for models WR15_04, WR31_05, and WR30_06 amounted to 3.92 t∙ha−1, 3.58 t∙ha−1, and 3.87 t∙ha−1 respectively.
Network Sensitivity Analysis
In the last step of the computations, network sensitivity analysis was carried out for all of the constructed neural models. The results of this analysis are given in Table 5.
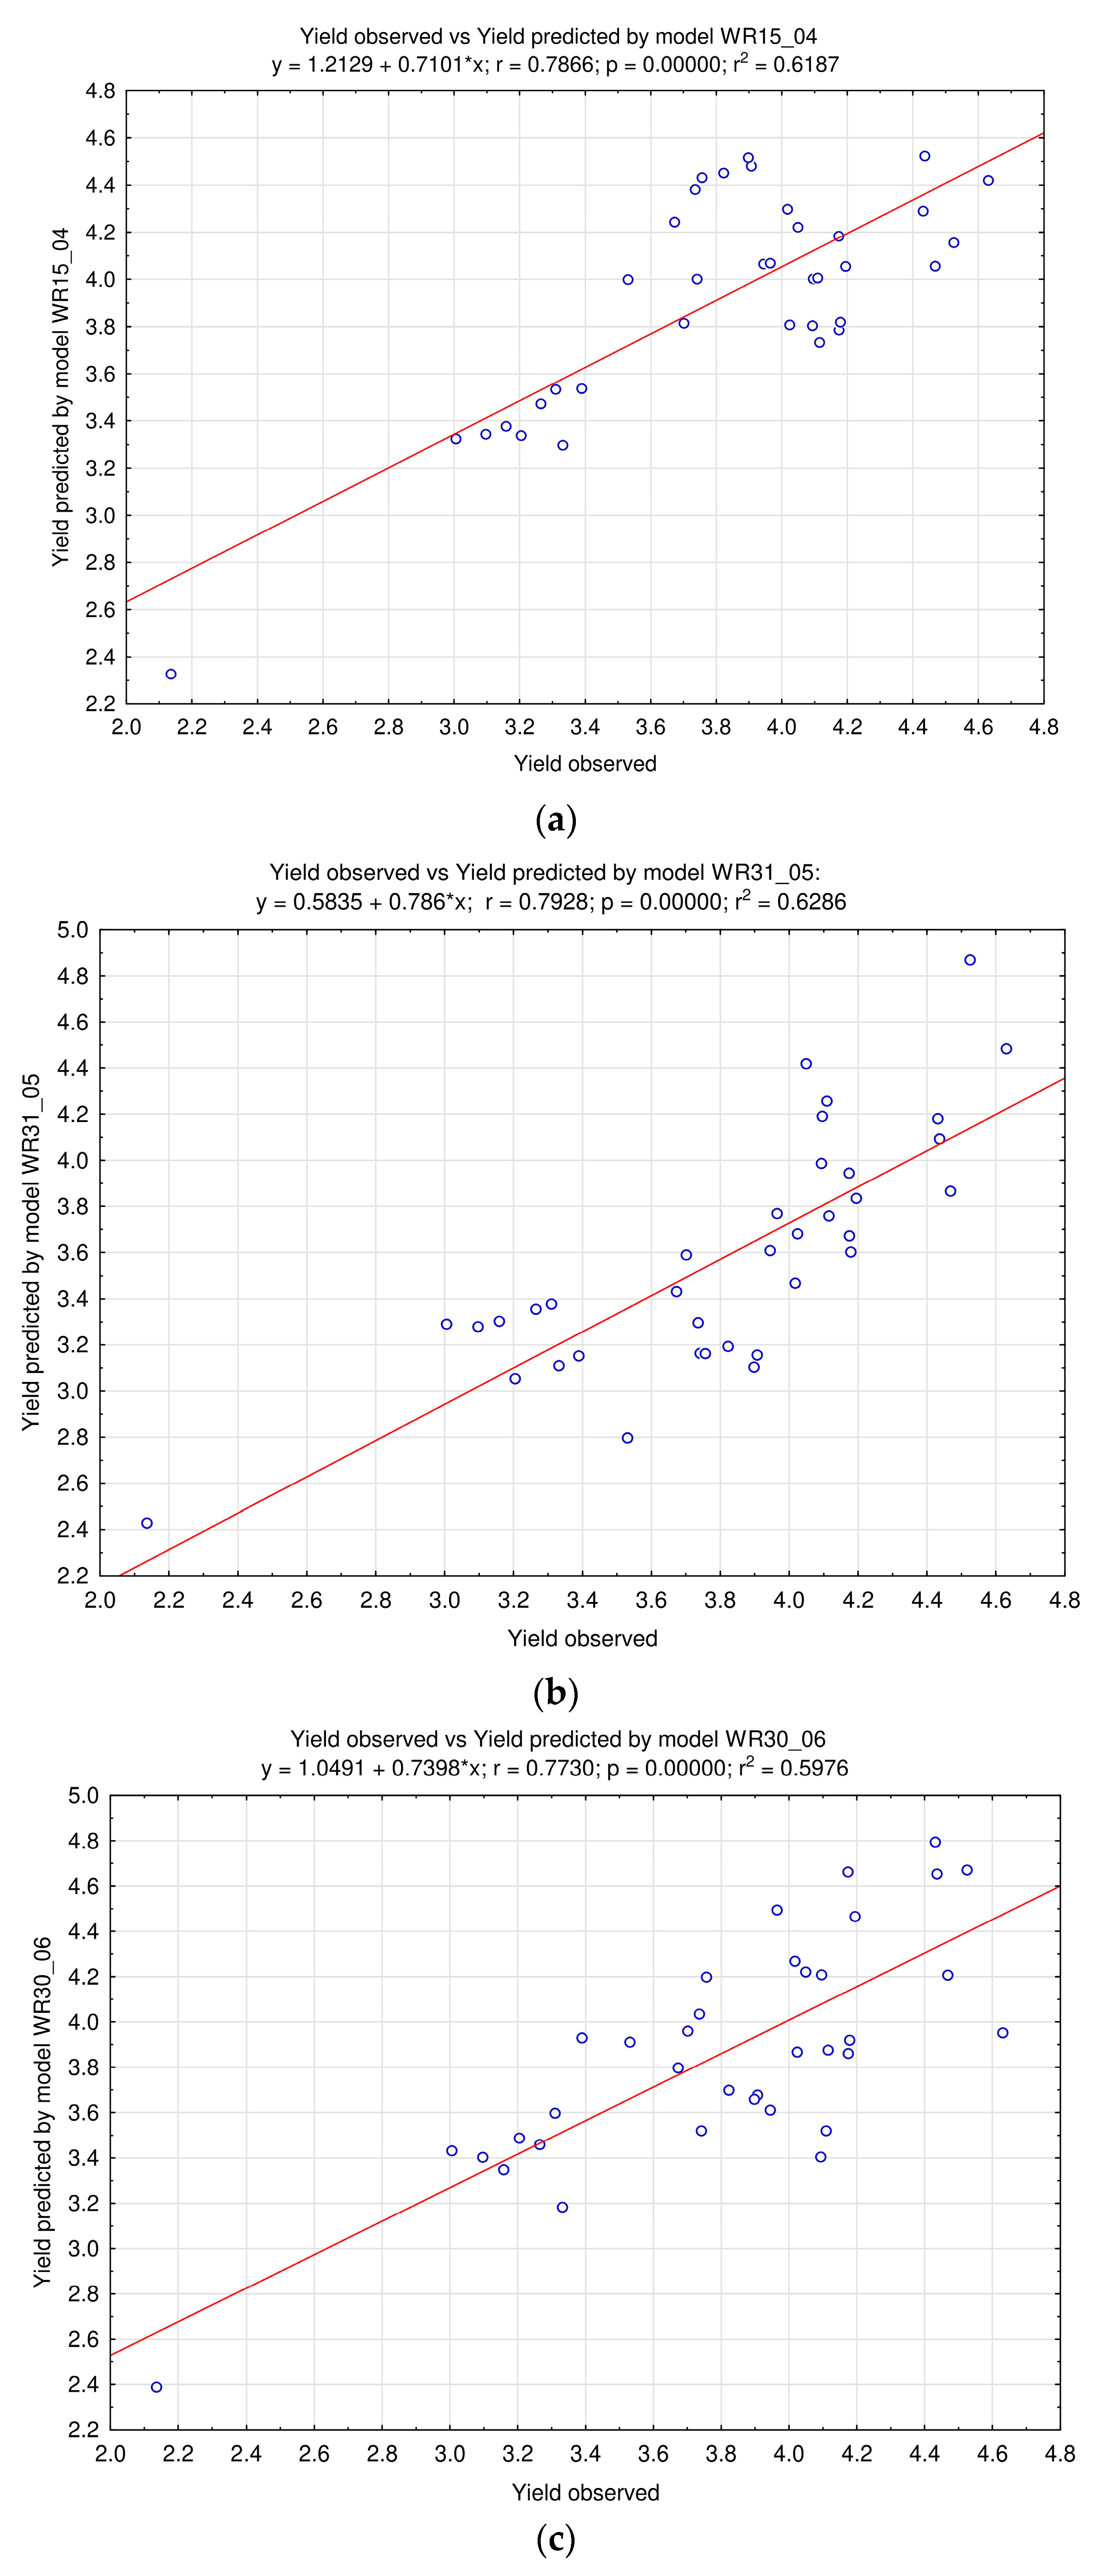
As shown in Figure 4, model WR31_05 has the best match between the real yield and the forecasted yield, for which the determination coefficient of R2 was 0.6286. The other models slightly deviate from this result. In model WR15_04, the determination coefficient, R2, of 0.6187 was achieved, while in model WR30_06, the determination coefficient, R2, of 0.5976 was obtained.
4. Discussion
Three independent, multi-criteria models of winter rapeseed yield were produced in the following study. These models were produced based on weather and crop information from the last seven years. Moreover, the models were validated on the basis of data from 2015. The model WR15_04 was based on field data, including 15 independent variables contained in Table 2. The data included basic weather information from the previous and current year, as well as data on fertilisation with micro and macro elements. Model WR31_05 (19 traits) was additionally enriched with weather data from April and May, while in model WR30_06 (21 traits), the weather information from June was added. In each model, the yield of winter rape expressed in t∙ha−1 of cultivated area was forecasted.
A common problem in the process of prediction of plant yields using neural models is the selection of the appropriate network topology. The most frequently used for prediction issues is the MLP network, i.e., multilayer perceptron, which gives the best forecasting results. A good model should adequately describe the behaviour of the system [31]. This means that the model under construction should be similar to the tested empirical system, from which data for research, analysis, and calculations are taken.
In view of the above, four ex post error measures were used in this work, i.e., relative approximation error (RAE), root mean square error (RMS), mean absolute error (MAE), and mean absolute percentage error (MAPE). They were used to determine the quality of models and to determine yield forecast errors for winter rapeseed.
Table 4 shows the ex post error values for all models created. The most commonly used indicators characterising the values of prediction errors belongs to MAPE [2,35]. The lowest values of MAPE errors were obtained for the WR15_04 neural model based on the MLP network with a 15:15-18-11-1:1 structure, which reached 7.51%. Similar results were obtained for model WR31_05 - 7.85%. The highest MAPE error of 8.12% was obtained for model WR30_06. Based on the literature [36], threshold values for the assessment of errors may be indicated. If the error is less than 10%, the degree of fit of the model is perfect; when it is in the range of 10% to 20%, the degree of fit of the model is good. In the range of 20% to 30%, the error is acceptable, while above 30%, the degree of fitting is bad—such a model is not usable. In this paper, all MAPE error results were up to 10%. In cases that are significantly influenced by random conditions, the results obtained for all models are highly satisfying. Other ex post error rates—RAE, RMS, and MAE for all models produced also reached a satisfying level (Table 4). On the basis of the results obtained, in order to illustrate the relation between the actual yield and the forecast, three graphs were created (Figure 4).
In the next step, a network sensitivity analysis was carried out for all neural models produced. The highest rank 1 was obtained for WR31_05 and WR30_06 models for the independent variable in the form of the sum of precipitation in the period from 1th September to 31st December of the previous year (R9-12_LY). This means that this factor had the greatest influence on the yield of winter rape in the period from May to June. It is known that water is an essential factor for the correct and rapid germination of seeds and the growth and development of the leaf rosette before the end of vegetation. The accumulation of water resources in the soil during winter rest is an important reservoir to cover the water needs of the canopy in early spring.
In model WR15_04, the highest rank was obtained by the sum of Mo fertilization (MO_CY). This means that after sowing, in the period of initial plant growth, this component has the greatest influence on the final yield. Interestingly, the second place was occupied by the feature of the average temperature in the period from 1st September to 31st December of the previous year (T9-12_LY). The values of the error quotient differed slightly from 1.1935 (MO_CY) and 1.1933 (T9-12_LY), respectively.
Molybdenum is an essential element for the proper growth and development of plants, and its content in soil is traceable. The availability of this element depends on the pH of the soil, the concentration of certain oxides (e.g., iron), and the amount of organic compounds in the soil. The plant needs molybdenum to carry out multiple oxidation and reduction reactions [37]. Molybdenum deficiency in the Brassicaceae family, to which rapeseed belongs, is a characteristic feature. They show gray-green discoloration of leaves, which become flaccid [38]. Plants have a low content of chlorophyll and ascorbic acid [39]. The main aim of molybdenum rape fertilization is to increase its resistance to low temperatures and to prepare the future yield structure.
To sum up, on the basis of the above results, it should be stated that the prediction of winter rape yield with the use of artificial neural networks gives satisfactory results of the forecast. However, in order to optimize the models, further research should be undertaken in order to obtain data from a larger number of fields and further analysis of the number of independent factors in the models.
5. Conclusions
Prediction of agricultural crop yields is a useful tool in rational management of the means of production and responsible management of crops in the era of climate change. Forecasting winter rapeseed yields using artificial neural networks makes it possible to obtain an accurate yield forecast before harvesting. This paper presents three neural models, which were constructed in such a way that each of them predicts the yield in three different dates of the calendar year: April 15th—model WR15_04, May 31st—model WR31_05, and June 30th—model WR30_06. All tested models were characterized by high forecast accuracy, which was confirmed by very good values of their qualitative parameters. The average absolute percentage error of MAPE, considered as the basic indicator of model quality, did not exceed 10% in any model. The sensitivity analysis of neural networks indicates a high influence of autumn-winter precipitation and molybdenum fertilization in shaping winter rapeseed yields. The presented method of neural modelling extends the range of plant yield modelling and may be an important element of precision agriculture. This method, after some modifications, may be used for forecasting yields of other cultivated plants as well, which may result in measurable macro and microeconomic effects. Moreover, the concept of neural modelling presented in this paper may contribute to sustainability by reducing the doses of mineral fertilizers while keeping high yields of cultivated plants at the same time.
Author Contributions
G.N. proposed the ideas, collected and analyzed the data and wrote the paper.
Funding
This research received no external funding.
Acknowledgments
The author would like to thank everyone who made it possible to collect weather data and information on fertilisation in selected places. Without them the work could not have been done.
Conflicts of Interest
The author declares no conflict of interest.
References
- Gonzalez-Sanchez, A.; Frausto-Solis, J.; Ojeda-Bustamante, W. Attribute selection impact on linear and nonlinear regression models for crop yield prediction. Sci. World J. 2014, 2014, 509249. [Google Scholar] [CrossRef] [PubMed]
- Kantanantha, N.; Serban, N.; Griffin, P. Yield and price forecasting for stochastic crop decision planning. J. Agric. Biol. Environ. Stat. 2010, 15, 362–380. [Google Scholar] [CrossRef]
- Domínguez, J.A.; Kumhálová, J.; Novák, P. Winter oilseed rape and winter wheat growth prediction using remote sensing methods. Plant Soil Environ. 2015, 61, 410–416. [Google Scholar] [CrossRef]
- Bussay, A.; van der Velde, M.; Fumagalli, D.; Seguini, L. Improving operational maize yield forecasting in Hungary. Agric. Syst. 2015, 141, 94–106. [Google Scholar] [CrossRef]
- Nelson, G.C.; Valin, H.; Sands, R.D.; Havlík, P.; Ahammad, H.; Deryng, D.; Elliott, J.; Fujimori, S.; Hasegawa, T.; Heyhoe, E. Climate change effects on agriculture: Economic responses to biophysical shocks. Proc. Natl. Acad. Sci. USA 2014, 111, 3274–3279. [Google Scholar] [CrossRef] [PubMed]
- Khairunniza-Bejo, S.; Mustaffha, S.; Ishak, W.; Ismail, W. Application of Artificial Neural Network in Predicting Crop Yield: A Review. J. Food Sci. Eng. 2014, 4, 1–9. [Google Scholar] [CrossRef]
- Mohsen, N.; Seyed Ahmad, S.-N.; Moslem, A. Modeling the seed yield of Ajowan (Trachyspermum ammi L.) using artificial neural network and multiple linear regression models. Ind. Crops Prod. J. 2018, 117, 224–234. [Google Scholar] [CrossRef]
- Abdipour, M.; Younessi-Hmazekhanlu, M.; Ramazani, S.H.R.; Omidi, A.H. Artificial neural networks and multiple linear regression as potential methods for modeling seed yield of safflower (Carthamus tinctorius L.). Ind. Crops Prod. 2019, 127, 185–194. [Google Scholar] [CrossRef]
- Park, S.J.; Hwang, C.S.; Vlek, P.L.G. Comparison of adaptive techniques to predict crop yield response under varying soil and land management conditions. Agric. Syst. 2005, 85, 59–81. [Google Scholar] [CrossRef]
- Bongiovanni, R.; Lowenberg-Deboer, J. Precision agriculture and sustainability. Precis. Agric. 2004, 5, 359–387. [Google Scholar] [CrossRef]
- Neruda, M.; Neruda, R. To contemplate quantitative and qualitative water features by neural networks method. Plant Soil Environ. 2002, 2002, 322–326. [Google Scholar] [CrossRef]
- Grahovac, J.; Jokić, A.; Dodić, J.; Vućurović, D.; Dodić, S. Modelling and prediction of bioethanol production from intermediates and byproduct of sugar beet processing using neural networks. Renew. Energy 2016, 85, 953–958. [Google Scholar] [CrossRef]
- Mueller, W.; Idziaszek, P.; Boniecki, P.; Zaborowicz, M.; Koszela, K.; Kujawa, S.; Kozłowski, R.J.; Przybył, K.; Niedbała, G. An IT system for the simultaneous management of vector and raster images. In Proceedings of the Eighth International Conference on Digital Image, Chengu, China, 20–22 May 2016; pp. 10033–100332. [Google Scholar]
- Kung, H.Y.; Kuo, T.H.; Chen, C.H.; Tsai, P.Y. Accuracy analysis mechanism for agriculture data using the ensemble neural network method. Sustainability 2016, 8, 735. [Google Scholar] [CrossRef]
- Liu, Y.; Zhang, S.; Chen, X.; Wang, J. Artificial Combined Model Based on Hybrid Nonlinear Neural Network Models and Statistics Linear Models—Research and Application for Wind Speed Forecasting. Sustainability 2018, 10, 4601. [Google Scholar] [CrossRef]
- Niedbała, G. Simple model based on artificial neural network for early prediction and simulation winter rapeseed yield. J. Integr. Agric. 2019, 18, 54–61. [Google Scholar] [CrossRef]
- Niedbała, G.; Mioduszewska, N.; Mueller, W.; Boniecki, P.; Wojcieszak, D.; Koszela, K.; Kujawa, S.; Kozłowski, R.J.; Przybył, K. Use of computer image analysis methods to evaluate the quality topping sugar beets with using artificial neural networks. In Proceedings of the Eighth International Conference on Digital Image, Chengu, China, 20–22 May 2016; pp. 10033–100332. [Google Scholar]
- Wojciechowski, T.; Niedbala, G.; Czechlowski, M.; Nawrocka, J.R.; Piechnik, L.; Niemann, J. Rapeseed seeds quality classification with usage of VIS-NIR fiber optic probe and artificial neural networks. In Proceedings of the ICOIP 2016 International Conference on Optoelectronics and Image Processing, Warsaw, Poland, 10–12 June 2016. [Google Scholar]
- Niedbała, G.; Kozłowski, R.J. Application of Artificial Neural Networks for Multi-Criteria Yield Prediction of Winter Wheat. J. Agric. Sci. Technol. 2019, 21, 51–61. [Google Scholar]
- Bartoszek, K. Usefulness of MODIS data for assessment of the growth and development of winter oilseed rape. Zemdirb. Agric. 2014, 101, 445–452. [Google Scholar] [CrossRef]
- Saluja, R.K.; Kumar, V.; Sham, R. Stability of biodiesel–A review. Renew. Sustain. Energy Rev. 2016, 62, 166–181. [Google Scholar] [CrossRef]
- Gilardelli, C.; Stella, T.; Frasso, N.; Cappelli, G.; Bregaglio, S.; Chiodini, M.E.; Scaglia, B.; Confalonieri, R. WOFOST-GTC: A new model for the simulation of winter rapeseed production and oil quality. Field Crops Res. 2016, 197, 125–132. [Google Scholar] [CrossRef]
- Food and Agriculture Organization of the United Nations (FAO). FAOSTAT Online Statistical Service. Available online: http://faostat.fao.org (accessed on 5 November 2018).
- Gabrielle, B.; Denoroy, P.; Gosse, G.; Justes, E.; Andersen, M.N. Development and evaluation of a CERES-type model for winter oilseed rape. Field Crops Res. 1998, 57, 95–111. [Google Scholar] [CrossRef]
- Zeleke, K.T.; Luckett, D.; Cowley, R. Calibration and testing of the FAO AquaCrop model for canola. Agron. J. 2011, 103, 1610–1618. [Google Scholar] [CrossRef]
- Deligios, P.A.; Farci, R.; Sulas, L.; Hoogenboom, G.; Ledda, L. Predicting growth and yield of winter rapeseed in a Mediterranean environment: Model adaptation at a field scale. Field Crops Res. 2013, 144, 100–112. [Google Scholar] [CrossRef]
- Zeleke, K.T.; Luckett, D.J.; Cowley, R.B. The influence of soil water conditions on canola yields and production in Southern Australia. Agric. Water Manag. 2014, 144, 20–32. [Google Scholar] [CrossRef]
- StatSoft Inc. Statistica. Data Analysis Software System, Version 7.1. Available online: www.statsoft.pl (accessed on 5 November 2018).
- Emamgholizadeh, S.; Parsaeian, M.; Baradaran, M. Seed yield prediction of sesame using artificial neural network. Eur. J. Agron. 2015, 68, 89–96. [Google Scholar] [CrossRef]
- Grzesiak, W.; Błaszczyk, P.; Lacroix, R. Methods of predicting milk yield in dairy cows-Predictive capabilities of Wood’s lactation curve and artificial neural networks (ANNs). Comput. Electron. Agric. 2006, 54, 69–83. [Google Scholar] [CrossRef]
- Li, F.; Qiao, J.; Han, H.; Yang, C. A self-organizing cascade neural network with random weights for nonlinear system modeling. Appl. Soft Comput. 2016, 42, 184–193. [Google Scholar] [CrossRef]
- Khoshnevisan, B.; Rafiee, S.; Iqbal, J.; Omid, M.; Badrul, N.; Wahab, A.W.A. A Comparative Study Between Artificial Neural Networks and Adaptive Neuro-Fuzzy Inference Systems for Modeling Energy Consumption in Greenhouse Tomato Production: A Case Study in Isfahan Province. J. Agric. Sci. Technol. 2015, 17, 49–62. [Google Scholar]
- Safa, M.; Samarasinghe, S.; Nejat, M. Prediction of Wheat Production Using Artificial Neural Networks and Investigating Indirect Factors Affecting It: Case Study in Canterbury Province, New Zealand. J. Agric. Sci. Technol. 2015, 17, 791–803. [Google Scholar]
- Huang, N.; Li, R.; Lin, L.; Yu, Z.; Cai, G. Low redundancy feature selection of short term solar irradiance prediction using conditional mutual information and Gauss process regression. Sustainability 2018, 10, 2889. [Google Scholar] [CrossRef]
- Zhang, G.P.; Patuwo, E.B.; Michael, Y.H. Forecasting with artificial neural networks: The state of the art. Int. J. Forecast. 1998, 14, 35–62. [Google Scholar] [CrossRef]
- Peng, J.; Kim, M.; Kim, Y.; Jo, M.; Kim, B.; Sung, K.; Lv, S. Constructing Italian ryegrass yield prediction model based on climatic data by locations in South Korea. Grassl. Sci. 2017, 63, 184–195. [Google Scholar] [CrossRef]
- Kaiser, B.N.; Gridley, K.L.; Brady, J.N.; Phillips, T.; Tyerman, S.D. The role of molybdenum in agricultural plant production. Ann. Bot. 2005, 96, 745–754. [Google Scholar] [CrossRef] [PubMed]
- Hewitt, E.J.; Bolle-Jones, E.W. Molybdenum as a Plant Nutrient: I. The Influence of Molybdenum on the Growth of Some Brassica Crops in Sand Culture. J. Hortic. Sci. 1952, 27, 245–256. [Google Scholar] [CrossRef]
- Hale, K.L.; McGrath, S.P.; Lombi, E.; Stack, S.M.; Terry, N.; Pickering, I.J.; George, G.N.; Pilon-Smits, E.A.H. Molybdenum Sequestration in Brassica Species. A Role for Anthocyanins? Plant Physiol. 2001, 126, 1391–1402. [Google Scholar] [CrossRef] [PubMed]
Figure 1.
Research area—Greater Poland, Poland.

Figure 2.
General structure of the neural network.

Figure 3.
Graphical presentation of the observed and predicted yield by neural model: (a) WR15_04, (b) WR31_05, and (c) WR30_06.
Figure 3.
Graphical presentation of the observed and predicted yield by neural model: (a) WR15_04, (b) WR31_05, and (c) WR30_06.

Figure 4.
Relation between the observed and predicted yield by models (a) WR15_04, (b) WR31_05, and (c) WR30_06.
Figure 4.
Relation between the observed and predicted yield by models (a) WR15_04, (b) WR31_05, and (c) WR30_06.


Table 1.
The number of productive fields of winter rapeseed divided into two sets, A and B.
| Set A | Set B | |||||||
|---|---|---|---|---|---|---|---|---|
| Year | 2008 | 2009 | 2010 | 2011 | 2012 | 2013 | 2014 | 2015 |
| Number of fields | 32 | 49 | 48 | 50 | 45 | 28 | 40 | 36 |
Table 2.
Data structure in neural prediction models.
| Symbol | Unit of Measure | Variable Name | Model WR15_04 | Model WR31_05 | Model WR30_06 | The Scope of Data |
|---|---|---|---|---|---|---|
| R9-12_LY | mm | The sum of precipitation from 1 September to 31 December of the previous year | + | + | + | 63–234 |
| T9-12_LY | °C | The average air temperature from 1 September to 31 December of the previous year | + | + | + | 4.9–9.4 |
| R1-4_CY | mm | The sum of precipitation from 1 January to 15 April of the current year | + | + | + | 59–185 |
| T1-4_CY | °C | The average air temperature from 1 January to 15 April of the current year | + | + | + | −0.4–4.9 |
| R4_CY | mm | The sum of precipitation from 1 April to 30 April of the current year | - | + | + | 8.7–60.4 |
| T4_CY | °C | The average air temperature from 1 April to 30 April of the current year | - | + | + | 5.9–12.2 |
| R5_CY | mm | The sum of precipitation from 1 May to 31 May of the current year | - | + | + | 14.2–132.5 |
| T5_CY | °C | The average air temperature from 1 May to 31 May of the current year | - | + | + | 11.8–16.2 |
| R6_CY | mm | The sum of precipitation from 1 June to 30 June of the current year | - | - | + | 15–121 |
| T6_CY | °C | The average air temperature from 1 June to 30 June of the current year | - | - | + | 14.2–19.6 |
| N_LY | kg ha−1 | The sum of N fertilization—autumn in the previous year | + | + | + | 0–41 |
| N_CY | kg ha−1 | The sum of N fertilization—spring in the current year | + | + | + | 0–175 |
| P2O5_CY | kg ha−1 | The sum of P2O5 fertilization in the current year | + | + | + | 0–104 |
| K2O_CY | kg ha−1 | The sum of K2O fertilization in the current year | + | + | + | 0–234 |
| MGO_CY | kg ha−1 | The sum of MgO fertilization in the current year | + | + | + | 0–298 |
| SO3_CY | kg ha−1 | The sum of sulfate ions (VI) fertilization in the current year | + | + | + | 14–115 |
| B_CY | g ha−1 | The sum of B fertilization in the current year | + | + | + | 0–3.66 |
| CU_CY | g ha−1 | The sum of Cu fertilization in the current year | + | + | + | 10–487 |
| MN_CY | g ha−1 | The sum of Mn fertilization in the current year | + | + | + | 70–600 |
| MO_CY | g ha−1 | The sum of Mo fertilization in the current year | + | + | + | 0–60 |
| ZN_CY | g ha−1 | The sum of Zn fertilization in the current year | + | + | + | 10–560 |
“+”—the variable exists in the model, “-”—the variable does not exist in the model.
Table 3.
The quality and structure of the neural models produced.
| WR15_04 | WR31_05 | WR30_06 | |
|---|---|---|---|
| Neural Network Structure | MLP 15:15-18-11-1:1 | MLP 19:19-15-18-1:1 | MLP 21:21-15-14-1:1 |
| Learning error | 0.1229 | 0.1053 | 0.0924 |
| Validation error | 0.0625 | 0.1051 | 0.1053 |
| Test error | 0.1283 | 0.1258 | 0.1277 |
| Mean | 3.3626 | 3.3626 | 3.3626 |
| Standard deviation | 1.0703 | 1.0703 | 1.0703 |
| Average error | 0.0762 | −0.0401 | −0.0245 |
| Deviation error | 0.7183 | 0.6264 | 0.6098 |
| Mean Absolute error | 0.5819 | 0.5021 | 0.4771 |
| Quotient deviations | 0.6711 | 0.5852 | 0.5697 |
| Correlation | 0.7413 | 0.8127 | 0.8218 |
Table 4.
Measures prediction ex post of analyzed neural models.
| Model | RAE [-] | RMS [t ha−1] | MAE [t ha−1] | MAPE [%] |
|---|---|---|---|---|
| WR15_04 | 0.075 | 0.337 | 0.282 | 7.51 |
| WR31_05 | 0.091 | 0.401 | 0.344 | 7.85 |
| WR30_06 | 0.081 | 0.341 | 0.306 | 8.12 |
Table 5.
Sensitivity analysis of the neural networks.
| Variable | Model | |||||
|---|---|---|---|---|---|---|
| WR15_04 | WR31_05 | WR30_06 | ||||
| Quotient | Rank | Quotient | Rank | Quotient | Rank | |
| R9-12_LY | 1.1669 | 3 | 1.3693 | 1 | 1.1508 | 1 |
| T9-12_LY | 1.1933 | 2 | 1.0366 | 10 | 1.0529 | 9 |
| R1-4_CY | 1.0224 | 6 | 1.0599 | 6 | 1.0252 | 16 |
| T1-4_CY | 1.0250 | 5 | 1.0689 | 5 | 1.1034 | 3 |
| R4_CY | - | - | 1.0698 | 4 | 1.0906 | 4 |
| T4_CY | - | - | 1.0403 | 9 | 1.0376 | 12 |
| R5_CY | - | - | 1.1412 | 3 | 1.0881 | 5 |
| T5_CY | - | - | 1.2512 | 2 | 1.0340 | 14 |
| R6_CY | - | - | - | - | 1.0527 | 10 |
| T6_CY | - | - | - | - | 1.0471 | 11 |
| N_LY | 0.9966 | 14 | 1.0031 | 17 | 1.0296 | 15 |
| N_CY | 1.0124 | 10 | 1.0167 | 12 | 1.0163 | 19 |
| P2O5_CY | 1.0000 | 12 | 0.9796 | 19 | 0.9854 | 21 |
| K2O_CY | 0.9975 | 13 | 1.0043 | 15 | 1.0086 | 20 |
| MGO_CY | 1.0143 | 8 | 1.0550 | 7 | 1.1308 | 2 |
| SO3_CY | 1.0340 | 4 | 1.0295 | 11 | 1.0655 | 6 |
| B_CY | 1.0034 | 11 | 0.9911 | 18 | 1.0357 | 13 |
| CU_CY | 0.9905 | 15 | 1.0103 | 14 | 1.0200 | 18 |
| MN_CY | 1.0138 | 9 | 1.0033 | 16 | 1.0589 | 8 |
| MO_CY | 1.1935 | 1 | 1.0540 | 8 | 1.0650 | 7 |
| ZN_CY | 1.0220 | 7 | 1.0135 | 13 | 1.0239 | 17 |
© 2019 by the author. Licensee MDPI, Basel, Switzerland. This article is an open access article distributed under the terms and conditions of the Creative Commons Attribution (CC BY) license (http://creativecommons.org/licenses/by/4.0/).
Share and Cite
MDPI and ACS Style
Niedbała, G. Application of Artificial Neural Networks for Multi-Criteria Yield Prediction of Winter Rapeseed. Sustainability 2019, 11, 533. https://doi.org/10.3390/su11020533
AMA Style
Niedbała G. Application of Artificial Neural Networks for Multi-Criteria Yield Prediction of Winter Rapeseed. Sustainability. 2019; 11(2):533. https://doi.org/10.3390/su11020533
Chicago/Turabian StyleNiedbała, Gniewko. 2019. "Application of Artificial Neural Networks for Multi-Criteria Yield Prediction of Winter Rapeseed" Sustainability 11, no. 2: 533. https://doi.org/10.3390/su11020533
Note that from the first issue of 2016, this journal uses article numbers instead of page numbers. See further details here.