Attitude towards Bike Use in Rende, a Small Town in South Italy


Department of Civil Engineering, University of Calabria, 87036 Rende, Italy
*
Author to whom correspondence should be addressed.
Sustainability 2019, 11(9), 2703; https://doi.org/10.3390/su11092703
Submission received: 16 April 2019
/
Revised: 6 May 2019
/
Accepted: 9 May 2019
/
Published: 13 May 2019
(This article belongs to the Section Sustainable Transportation)
Abstract
:The bike can contribute to the development of sustainable mobility. This requires interventions to promote bike use, such as increasing the cyclist safety, construction of bikeways, and provision of ancillary services and bike sharing activities. In the literature many studies focus on bike use and agree with the application of such interventions. However, these studies are often related to specific urban areas that are very different; the transferability of results and models has not been adequately analyzed. This work investigates the attitudes towards cycling in Rende, a small town in Southern Italy. The aim is to determine in what conditions the users would be willing to use bicycles in relation to the trip purpose, the presence or absence of cycle paths, and the availability of bike sharing services. Different factors, such as age, gender, and occupation, are taken into account. The results show that the bike use could be incentivized by enlarging the existent bike network, adopting bike sharing systems, and promoting specific policies oriented to sustainable transport modes. Furthermore, two aspects emerged from the analysis: the importance of studying the propensity to use bikes by different groups of users and the importance of focusing interventions on market segments with greater willingness to bike.
1. Introduction
During the last century, a mobility model was developed based mainly on the use of motorized transportation modes and in particular on the use of the individual car. This model has been in crisis for some time due to the serious levels of environmental pollution recorded in recent decades, the scarcity of fossil fuels, and problems associated with road congestion [1]. Everyday people move to conduct various activities, producing an amount of trips [2]. Transport policies are currently directed towards the development of sustainable mobility, focusing on the issues of energy saving and the containment of atmospheric and noise pollution. To this end, urban mobility will have to focus mainly on the use of collective modes and nonmotorized transport modes such as cycling [3]. Due to the particular technology adopted, the bicycle allows to obtain a high performance of physical work, so the speed and the range of action are significantly higher than those of walking.
The bike can provide a satisfactory answer to the need for mobility, even if in a well-defined area in relation to environmental conditions, speed, and length of travel. It can be used as a single transport mode for the entire journey, but also as a means of access/egress from the collective transport. It can contribute to satisfying the daily mobility for work, study, and other current activities, but can also be a tool for leisure and for providing a specific tourist activity, even over long distances [4]. Cycling must however be a pleasant and safe activity in an urban environment on a human scale. This presupposes a series of interventions aimed at increasing the safety of cyclists, such as the creation of specific routes free of obstacles and architectural barriers, well identified from the urban point of view, and capable of providing cyclists with adequate protection against motorized traffic. The necessary ancillary services, such as car parks and bike sharing activities, must also be realized. Bike sharing is a service in which bicycles are made available for shared use to individuals on a short-term basis for a price or free. Many bike share systems allow people to borrow a bike from a “dock” and take back it at another dock belonging to the same system. Docks are special bike racks that lock the bike, and only release it by computer control. The user enters payment information, and the computer unlocks a bike. The user returns the bike by placing it in the dock, which locks it in place.
However it is evident that the bicycle cannot constitute an adequate mode of transport for all categories of users and in all territorial contexts; but it can serve a significant proportion of mobility. In urban areas, bikes can be the main mode to serve an entire community under certain conditions [5]. For example, the urban structure must be characterized by compact and small-medium settlements in order to allow internal shifts of less than 6 kilometers in length; the climate must be mild, without excessive rainfall and without extreme temperatures; and the territory must be flat or slightly undulating, with wide roads, which allow the creation of cycle paths. Furthermore, as far as potential users are concerned, there must be a large segment of the population aged between 15 and 35 years.
The bike can also be used as a means of access to the terminals of public transport, providing suitable services for the storage and custody of the bike near the transport node. Then, the bike is congenial as means of transport within natural parks and extensive green areas, serving mainly tourist mobility, or simply for recreational purposes and for getting some physical exercise.
Some data on the use of the bike in Europe can be extrapolated from the results of the survey on the mobility habits of European citizens published in the Eurobarometer report 422a [6]. The European average of citizens who have declared to use the bike routinely to move is 8%, equally distributed between both sexes. The difference between the age groups is significant: the highest average (13%) was registered among young people aged between 15 and 24 against 7/8% of the 25–39 age groups, 40–54, and over 55. The Netherlands is the country where citizens ride the most, with 36% of urban cyclists declared, followed by Denmark (23%) and Sweden (17%). In Malta, however, the share of cyclists is close to zero, while in Portugal and Cyprus the percentage is 1%. According to the Eurobarometer, Italy would be just below the European average, with 6% use, better than France and Spain.
The present work aims to investigate the attitudes towards cycling in Rende, a small town in Southern Italy. In particular, we want to determine in what conditions the users would be willing to use the bicycle, in relation to the trip purpose, the presence or absence of cycle paths, the availability or not of bike sharing services.
2. Literature Review
In the literature, numerous factors are identified as influential in bicycle use [7]. The most common reasons reported for cycling include health reasons, exercise/fitness, fun, flexible, convenient, and the enjoyment of an attractive setting. There are also a number of cycling’s more negative aspects as reasons not to ride a bike, including too dangerous, too much traffic, bad weather, personal factors (too busy), lack of daylight, inconvenience, lacking sufficient fitness, uncomfortable, lack of time, being tired, too much effort, and difficulties with trip-chaining. In addition, safety is often mentioned as a reason not to cycle, and if there is a heightened risk of having an accident; the assumption is that people will cycle less [8].
Muñoz et al. [9] introduced latent variables affecting bicycle commuting for exploring attitudes towards bicycle commuting characteristics like moving quickly, be free or not dependent on any other transport mode, save money, get some physical exercise, be able to park easily, pollute the environment less, enjoy the ride, and relax during the trip.
Among the variables that influence bicycle use, there are psychosocial factors that make the bicycle eligible as a modal alternative [10]. These factors are related to intention, attitudes and perceptions, and their identification can contribute to obtain the keys for a successful bicycle policy. The authors estimated a structural equations model to find structure and relationships among variables and to understand users’ intentions to use the bike. The results highlight convenience (the bicycle is flexible and efficient) and exogenous restrictions (danger, vandalism, and facilities) as the most important elements to understand the attitudes towards cycling.
Another study that analyses the influence of commuters’ attitudes toward the benefits of travel by bicycle for commutes to work proposes a factor analysis using data from an internet survey conducted among a sample of residents in a selection of Dutch cities [11]. The results show that the habit of cycling positively influences the likelihood of cycling full-time to work. In addition, cyclists are more inclined to cycle to work each day regardless of distance if they also cycle for other purposes.
The research conducted by Cervero et al. [12] presents a multivariate model that reflects the influences of such factors for cities and towns in Britain, and reveals a complex web of influences, both endogenous and exogenous in nature, that influence cycling to work. The authors conclude that for promoting cycling there is no single factor but is important making the cycling experience as safe, efficient, enjoyable, and stress-free as possible.
The bicycle use is strongly influenced by the safety condition of the road and by the traffic. As claimed by Bagloee et al. [13], the main obstacles to boosting the bicycle as a regular mode of transport are safety concerns due to interactions with motorized traffic. In particular, the cyclists give high value to off-street bike paths and enhanced neighborhood bikeways with traffic calming features.
The availability of infrastructure and services for cycling mobility also has an important impact on the decision to commute using bicycle. Cole-Hunter et al. [14] proposed multinomial logistic regression models for assessing willingness to commute by bicycle in Barcelona, Spain. The results showed that greater availability of public bicycle stations and higher levels of urban greenness might increase bicycle use by adults commuting. In addition, electrically assisted public bicycles may address the challenge of slope, making this system a more competitive mode against traditional motorized public transport. Kaplan et al. [15] analyzed, under a behavioral framework, the intentions of inhabitants of a driving-oriented region to use conventional and electric bicycles within a hypothetical scenario of a bicycle sharing system. The findings from the model revealed gender and age differences in the probability of using electric bicycles, as female as well as older respondents were more likely to prefer the technological innovation. In addition, the findings from the model showed that functional and relational needs were associated with a higher likelihood of using both types of bicycle, while personal needs were related to a higher probability of using a conventional bicycle and lower probability of using an electric bicycle. To ensure the proper functioning of a bike sharing system it is necessary to monitor the amount of available bikes in the stations of the bike sharing system and to use this information for improving the bicycle program [16].
Among the external factors that determine the attitude towards the bike use, the weather conditions are relevant. Nankervis [17] examined data on the effect of both (short-term) weather conditions and (long-term) seasonal variation patterns on bicycle commuting patterns among several groups of tertiary students in the temperate climate of Melbourne, Australia. The results showed a decline in winter when conditions can be more adverse than summer. Weather conditions can affect users differently depending on their characteristics. Regarding the several groups interviewed during this study, student commuter cyclists are not easily dissuaded from cycling, even if the weather conditions are bad.
In the literature, there are also many studies that analyze cycling mobility in relation to public transport. In this perspective, the combined use of the bicycle and public transport should be understood in a broader perspective, especially where bicycles link to higher speed and higher capacity public transport [18]. As reported by Zhao et al. [19], bicycle–transit integration, in which cycling is used as a transfer mode towards or from transit station is widely believed to be one very important way of achieving efficient and sustainable urban transport systems. Using a multilevel logistic model, the authors found that travel distance is the factor that most influences the rates of cycling for transfer trips between metro stations and home or the workplace. The presence of bicycle-sharing programs, mixed land use, and green parks in metro station areas were associated with greater rates of cycling transfer.
Using the real spatial location data of the public bicycle-sharing systems of Hangzhou and Ningbo in China, Yang et al. [20] propose a multilayer coupling spatial network model that considers the geographical information on bus stations, bus routes, and public bicycle stations by studying the urban public transport networks. The results showed that public bicycle-sharing systems can decrease the average trip time of passengers and increase the efficiency of an urban public transport network, as well as effectively improve the uneven level of traffic flow spatial distribution of an urban public transport network and will be helpful to smoothening the traffic flow and alleviating traffic congestion. Saplıoğlu and Aydın [21] examined the negative and positive effective parameters on safety and choice while integrating cycling with a public transport (bus link) system. It is known that bicycle utilization provides several benefits for traffic, health, and cost. However, the growing in bicycle utilization demand causes many problems such as safety, effectiveness, etc. For this reason, cycling mobility should not be treated as an isolated phenomenon but urban mobility should be planned by networking all the different modes of transport available.
Bicycle use is also related to neighborhood walkability. Analyzing the relationships between adult bicycle use for transport and measures of neighborhood walkability in an Australian city with low rates of bicycle use and a Belgian city with high rates of bicycle use, Owen et al. [22] found that living in a high-walkable neighborhood was associated with significantly higher odds of bicycle use for transport.
By studying cycling mobility it must be taken into account that cyclists are heterogeneous. Building a network adapted to different cyclist types and emphasizing its convenience, flexibility and speed, could be an effective strategy to increase cycling mode share and frequency. Damant-Sirois et al. [23] elaborated a factor cluster analysis for outlining the cyclists of the city of Montreal (Canada) and for dividing them into four groups. The findings show meaningful differences between groups in demographic characteristics, behavior and specific infrastructure preferences. Analyzing answers about motivators, deterrents, and infrastructure preferences given by respondents of each cyclist type allows understanding which type of cyclists will likely be affected by certain interventions.
3. Case Study
3.1. Territorial Context
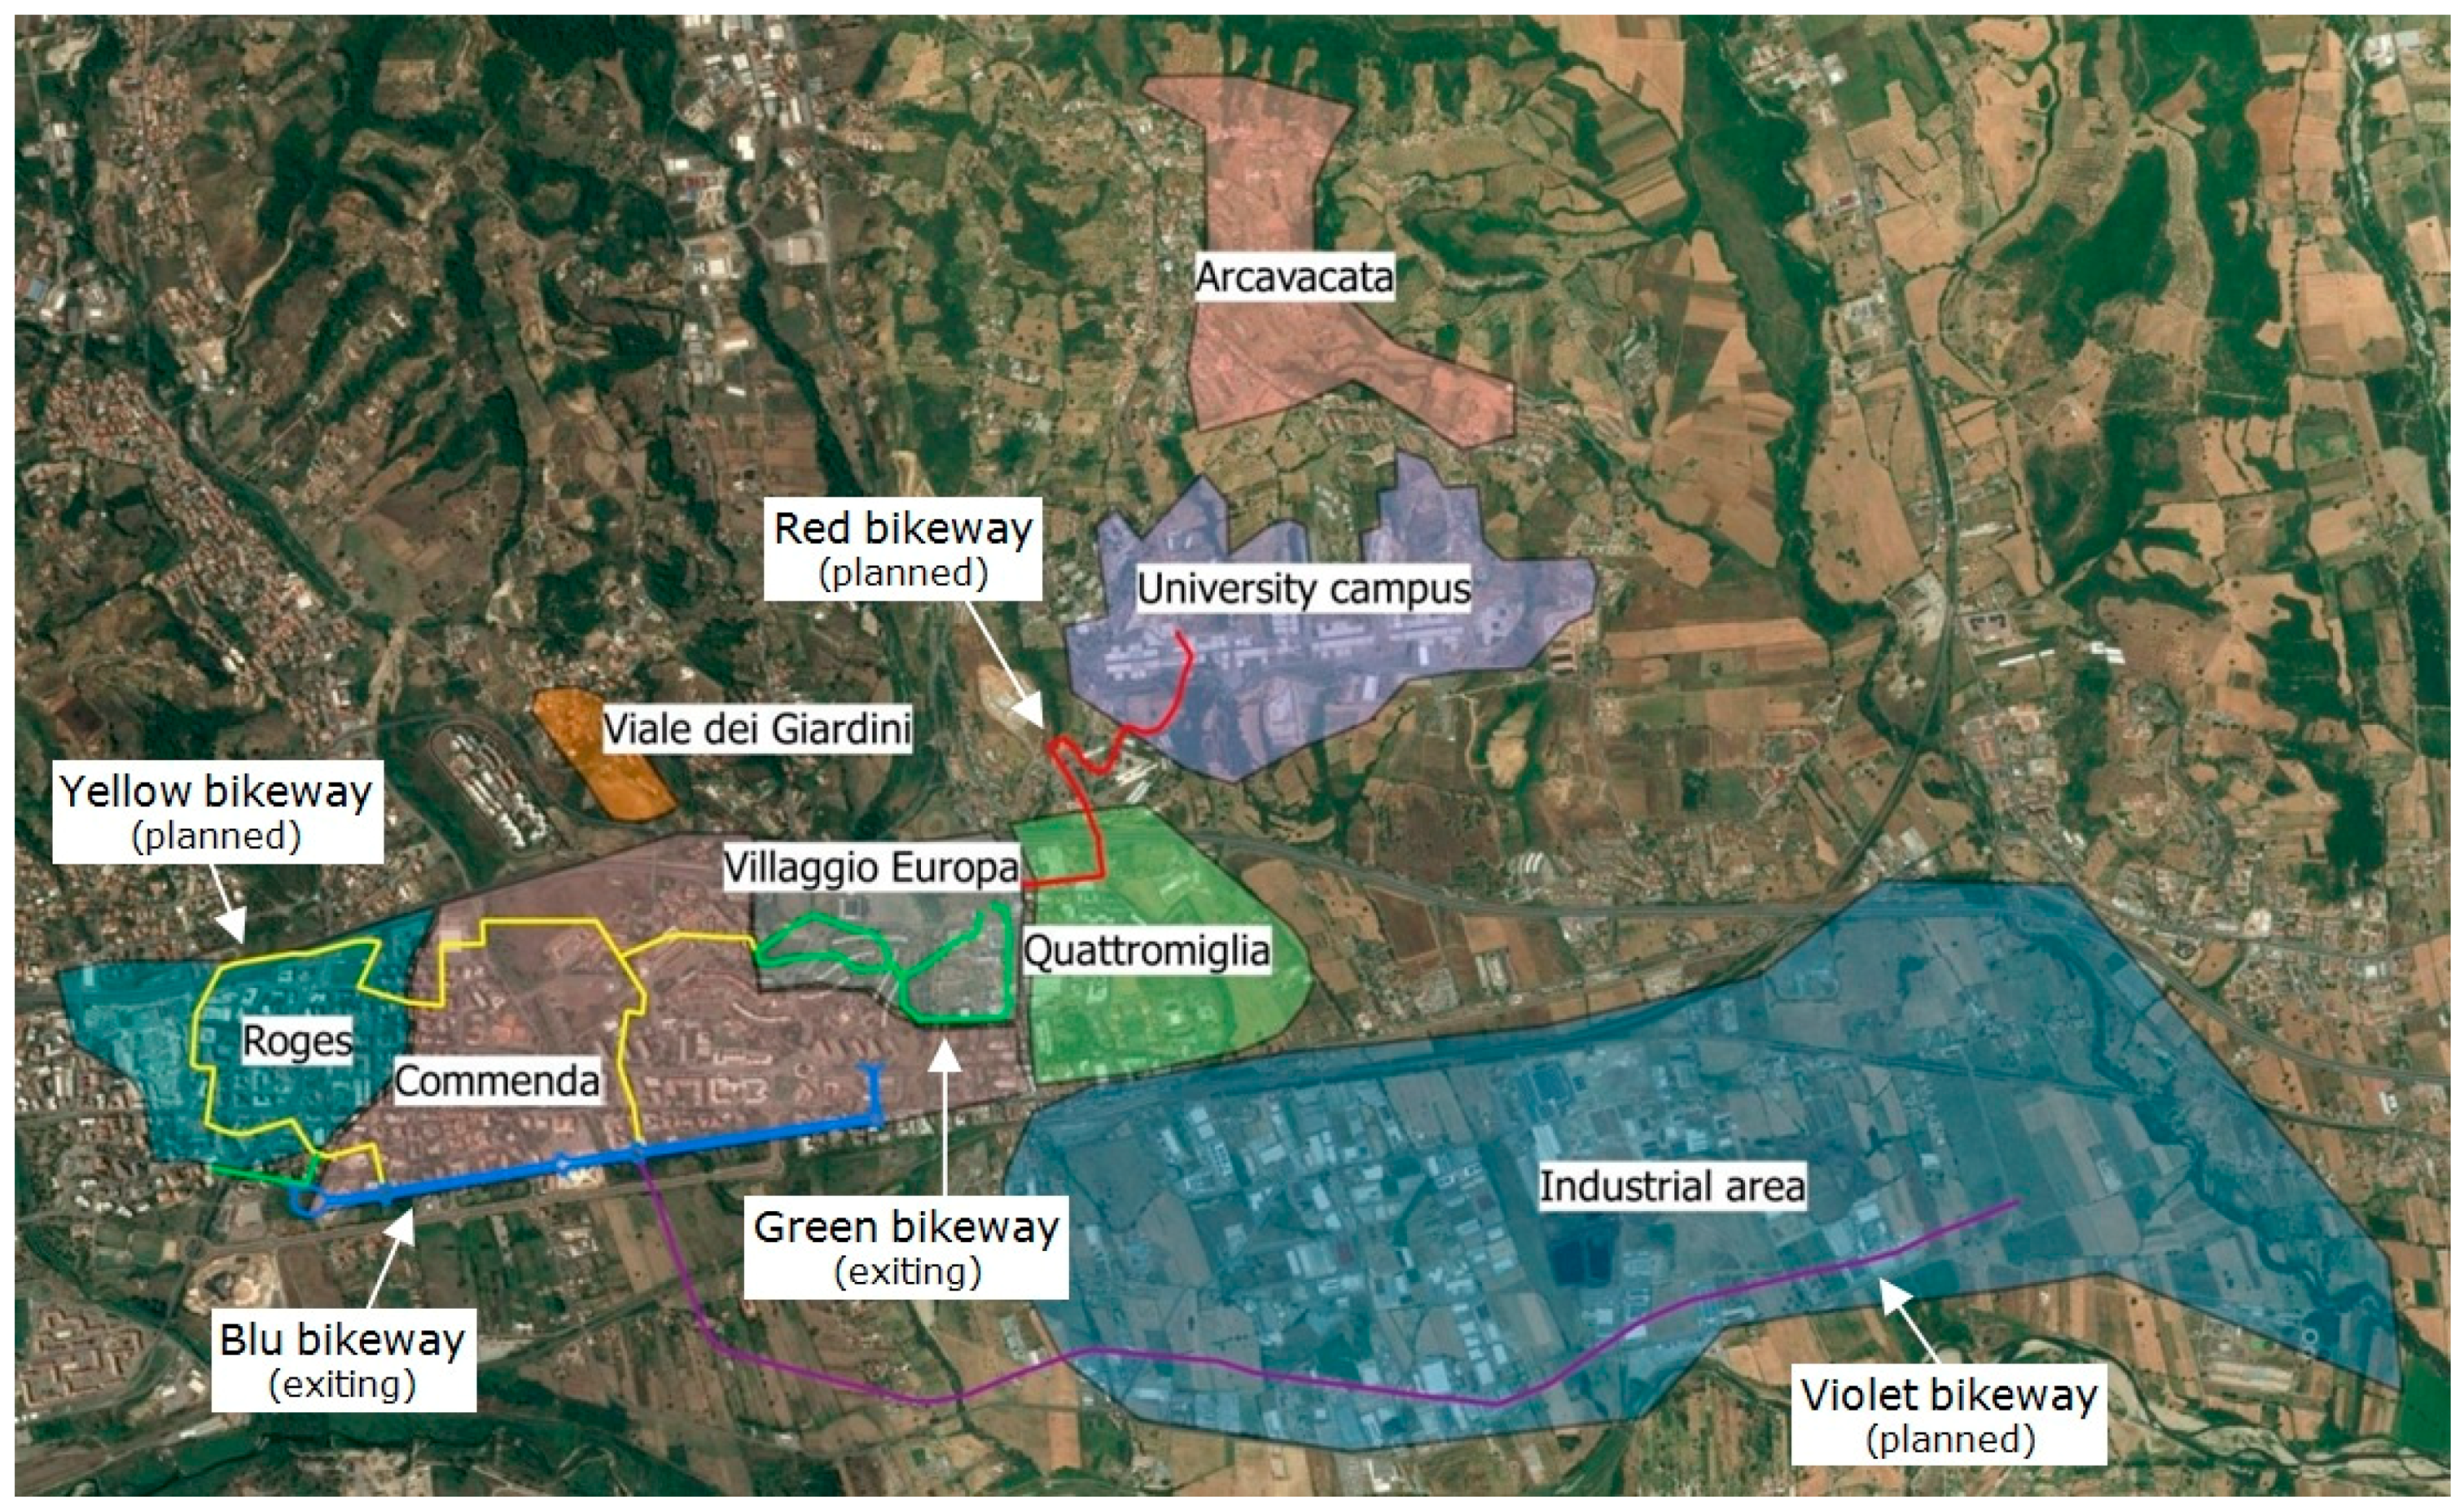
The town of Rende (Italy) has 35,727 inhabitants [24]. Rende expands in the South–North direction as an extension of Cosenza, one of the provincial capitals of the Calabrian region. The municipal territory of Rende spreads into more than 20 neighborhoods, including the historical center (in the west side), the industrial areas (in the east side), and several minor residential centers. Roges, Commenda and Quattromiglia are the main neighborhoods with both residential and commercial functions, extending in the South-North direction; Viale dei Giardini and Villaggio Europa, placed in the west side of the territory, are other important neighborhoods with a purely residential vocation. The most important cultural institution of Rende, and also of the urban area of Cosenza, is the University of Calabria, the largest university in Calabria and one of the best among medium-sized Italian universities, which currently boasts the largest university campus in Italy. Located in Arcavacata—a hamlet of Rende—the university was founded in 1972 and attracts around 30,000 students and more than 2000 teachers, technical and administrative staff (see Figure 1).
The valley part of Rende, which runs from Roges to Quattromiglia, is completely flat; was built starting in the 1960s; building quality is high, housing density is low; the roads are wide, often with service roads; and the parking is adequate and the traffic does not present congestion problems. The settlements in the valley are mainly residential, with widespread commercial and service activities; the area is therefore the origin of substantial commuter traffic flows, which from it goes towards the city of Cosenza and the finite municipalities, to the south, or to the other municipalities in the north of the Province.
The urban area of Cosenza and Rende does not have an efficient local public transport system. Rende lacks an urban service; the service includes only an urban line, from Cosenza to Quattromiglia, and a line that connects Cosenza with the University Campus, practically used exclusively by students. The valley part is crossed by extra-urban lines, which operate between Cosenza and the north of the Province. The shortcomings of public transport drive mobility towards the private car; the modal split is strongly unbalanced, and in the urban area of Cosenza the car reaches an average of 90% of motorized movements.
The University feeds very consistent traffic flows with the surrounding territory. The available data show that ~30,000 people enter the University every day; 57.4% on cars, 25.9% on urban buses, 3.5% on extra-urban buses, and 13.2% on foot; the bike is almost nonexistent.
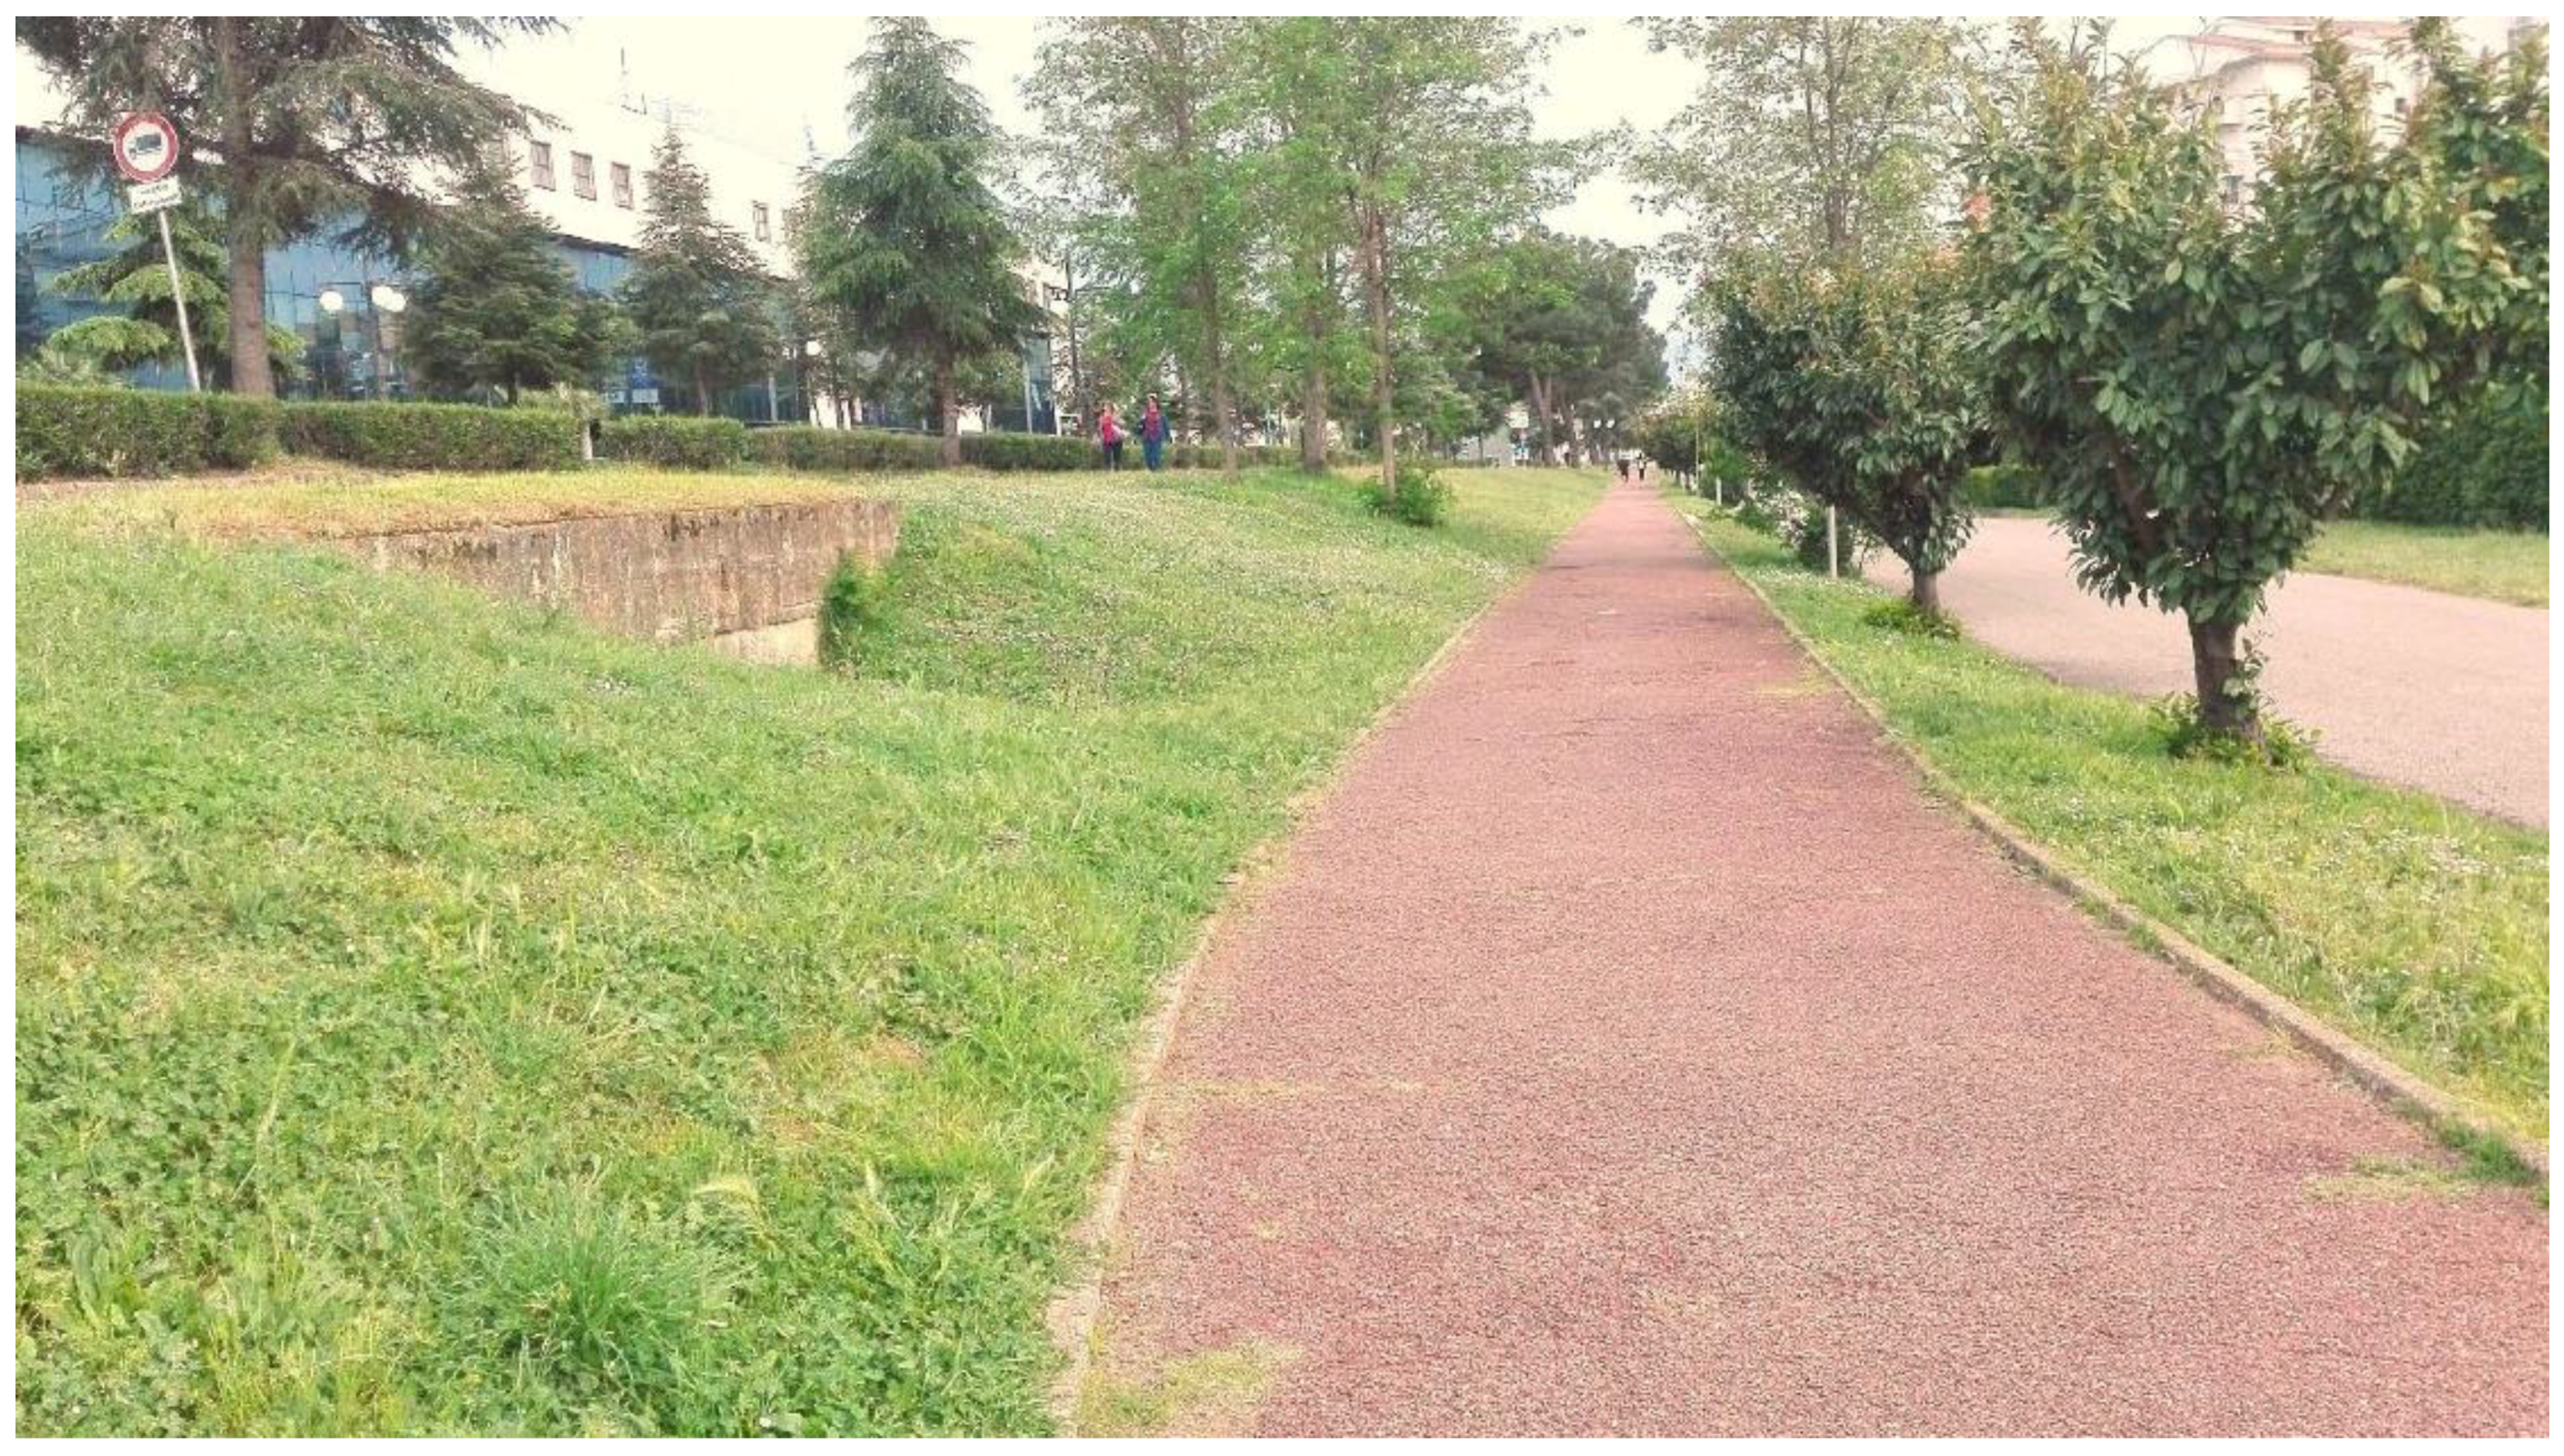
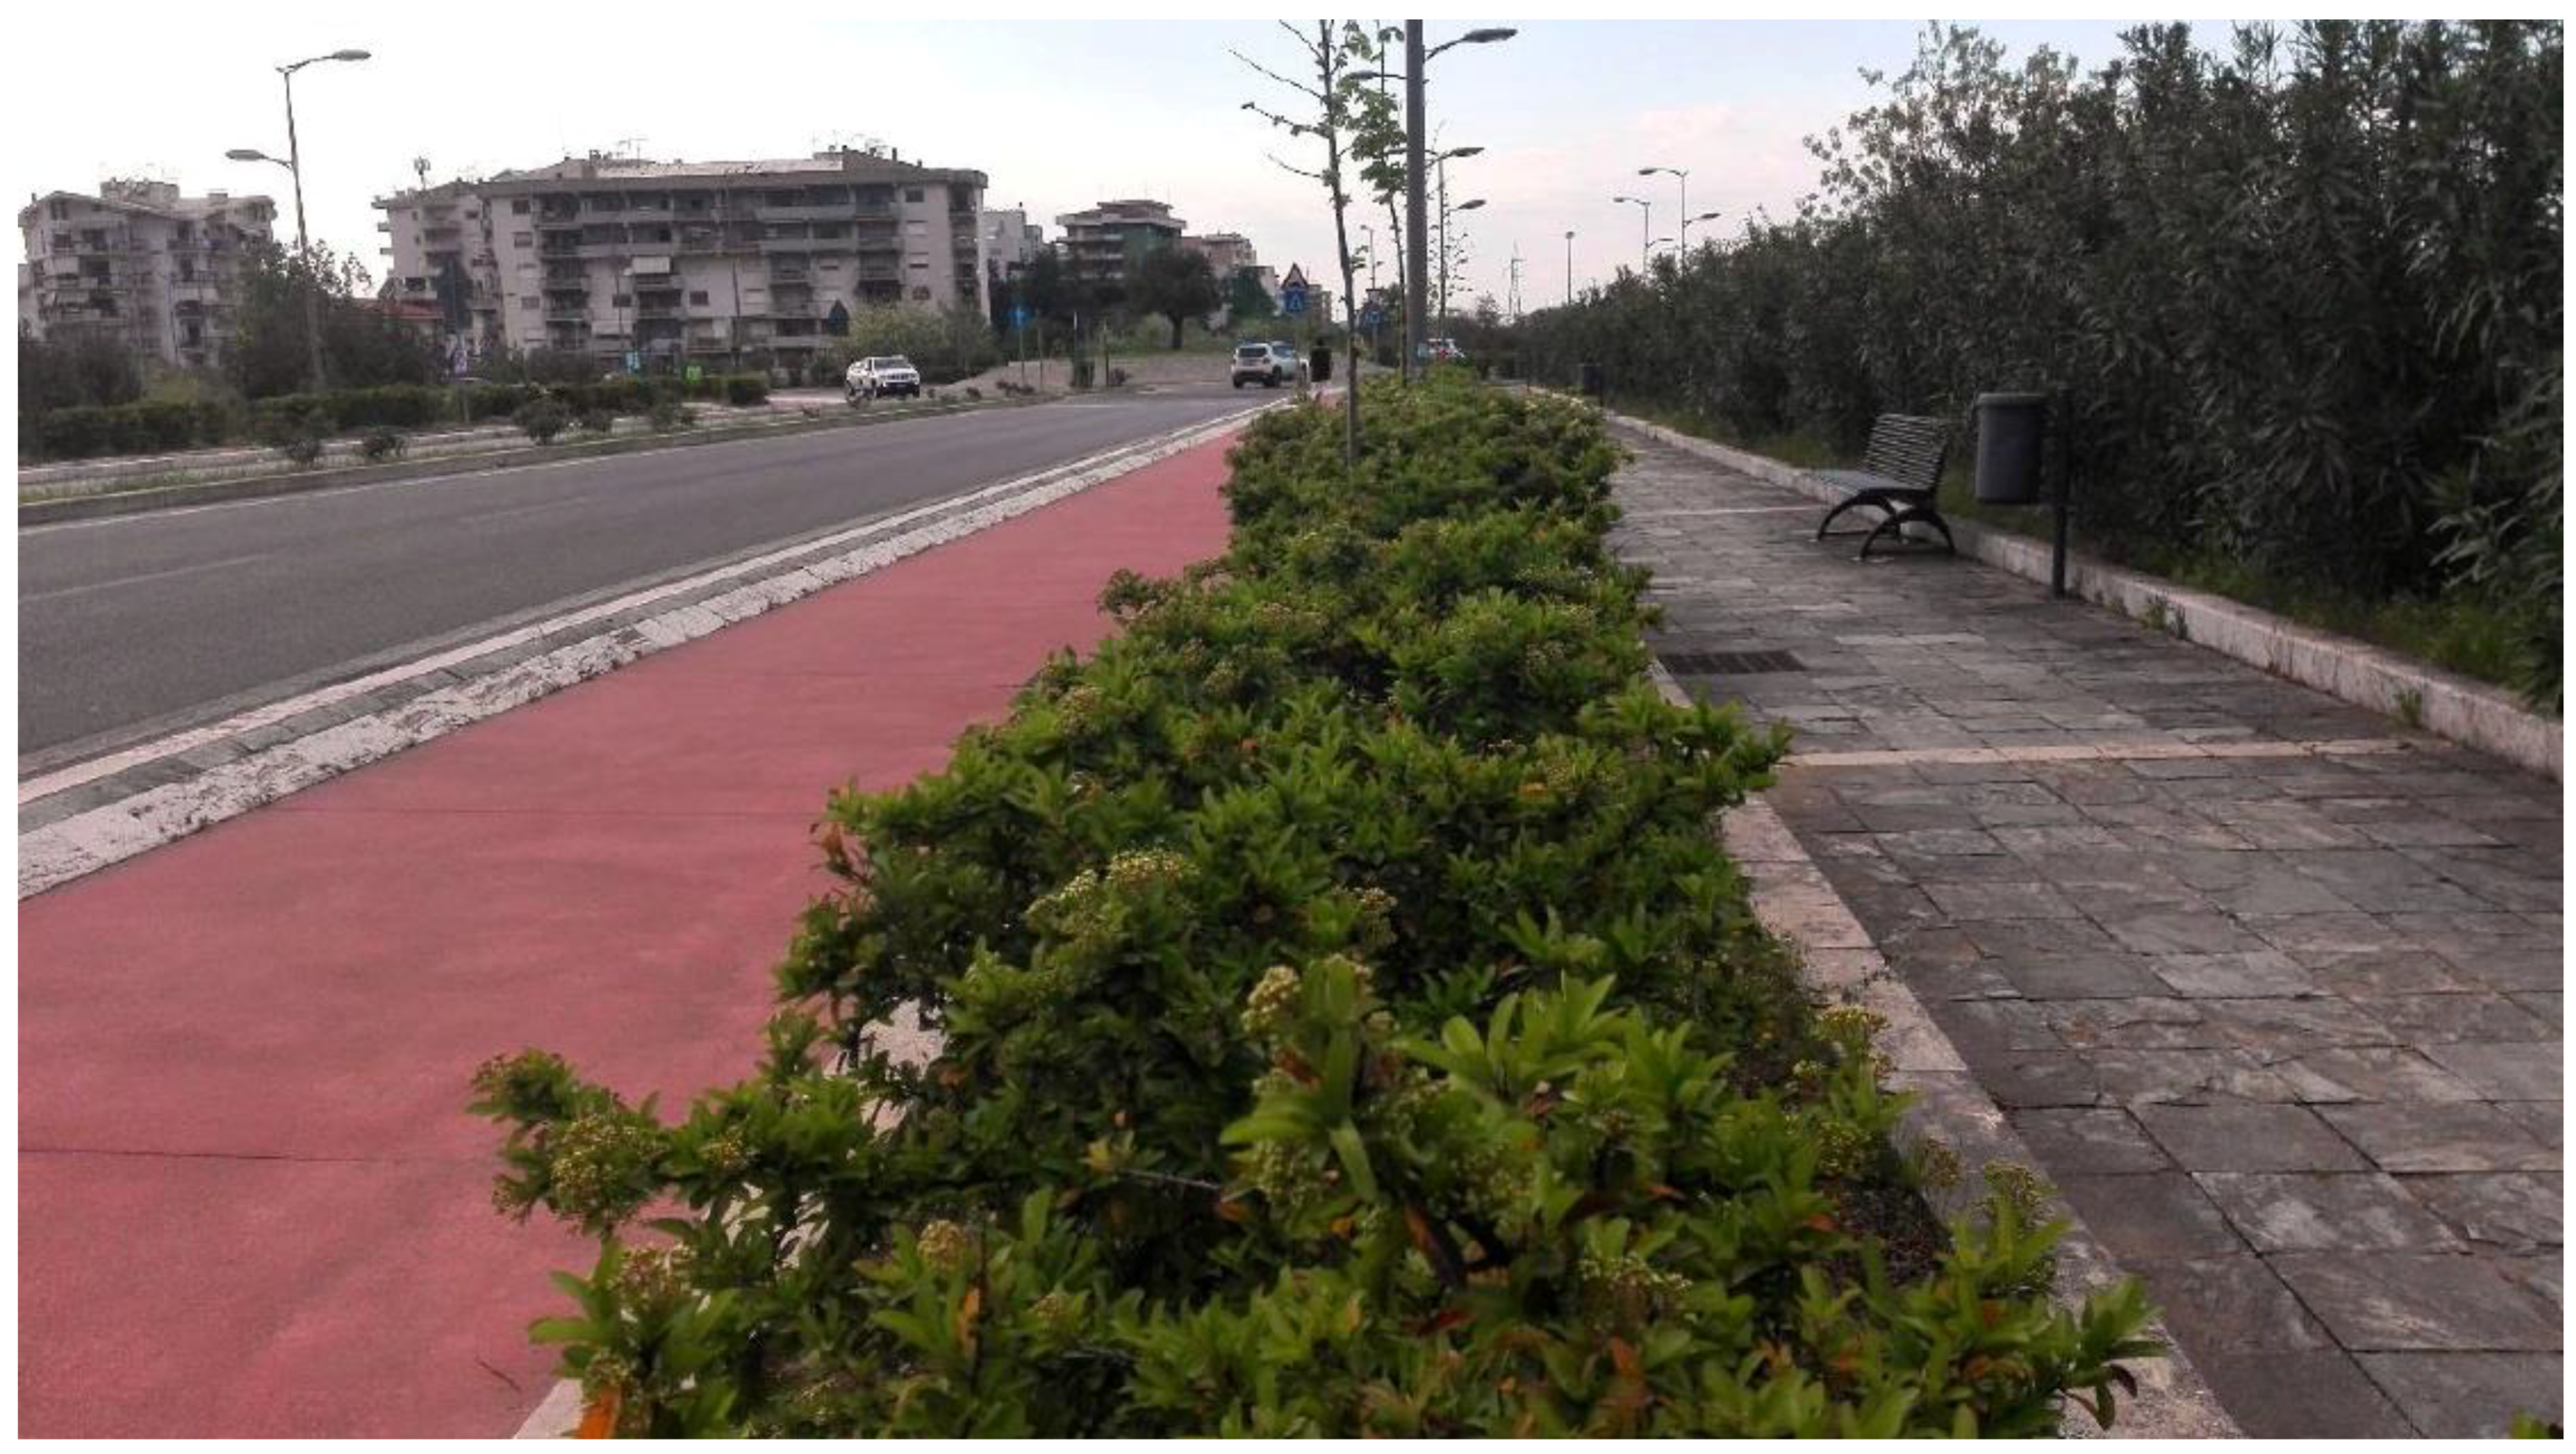
Currently, there are two usable bikeways, and three other bikeways are planned (see Figure 1). Existing bikeways are the Green bikeway that runs inside Villaggio Europa neighborhood and along the river park, and the Blue bikeway, that connects Commenda with Quattromiglia. The Green bikeway is long ~2.7 kilometers and provide access to a number of administrative offices and commercial activities. The Blue bikeway is long about 2.0 kilometers running Commenda along Viale Parco, a newly built avenue. In both cases, the bikeways are one-way, and located outside the lanes reserved for cars. A pedestrian path has been built next to the blue bikeway. The width of the tracks is about 2.50 meters, the slope is very low (less than 1%), and the flooring is red asphalt (see Figure 2 and Figure 3).
Planned bikeways are the Red, the Yellow and the Violet bikeways. The Red bikeway (2.0 kilometers long) will connect Villaggio Europa with the university by crossing Quattromiglia and other residential centers inside the campus. The Yellow bikeway will connect the existing Green and Blue bikeways surrounding Roges and Commenda neighborhoods, covering a distance of 4.3 kilometers and a very large area (more than 1 square kilometer). Finally, the Violet bikeway will connect the Blue bikeway with the industrial area located in the east side of the town. The characteristics of new bikeways will be similar to the existing ones.
The current cycle paths are not connected; with the construction of the new tracks, a connected system will be built, able to connect the residential valley area with the University and the industrial area.
3.2. Survey
The questionnaire addressed to a sample of citizen living in Rende was structured into five sections. Section A contains a question regarding the bike use. Section B is oriented towards bike nonusers, and it is focused on the purposes of bike nonuse. Section C is oriented towards bike users, and it is focused on the purposes of bike use, the frequency in using the bike, the main trip purposes. Section D refers to the choices among the bikeways habitually used, and the preferences about the new planned bikeways. Finally, Section E is focused on sample socioeconomic characteristics, as gender, age and professional condition.
A sample of 286 people living in Rende was interviewed in the time lapse between October and December 2016, by using face-to-face questionnaires. The interviewers stopped people on the road when they walked in the neighborhoods where existing or planned bikeways are located; ~20 stop points were selected [25].
3.3. Sample Characteristics
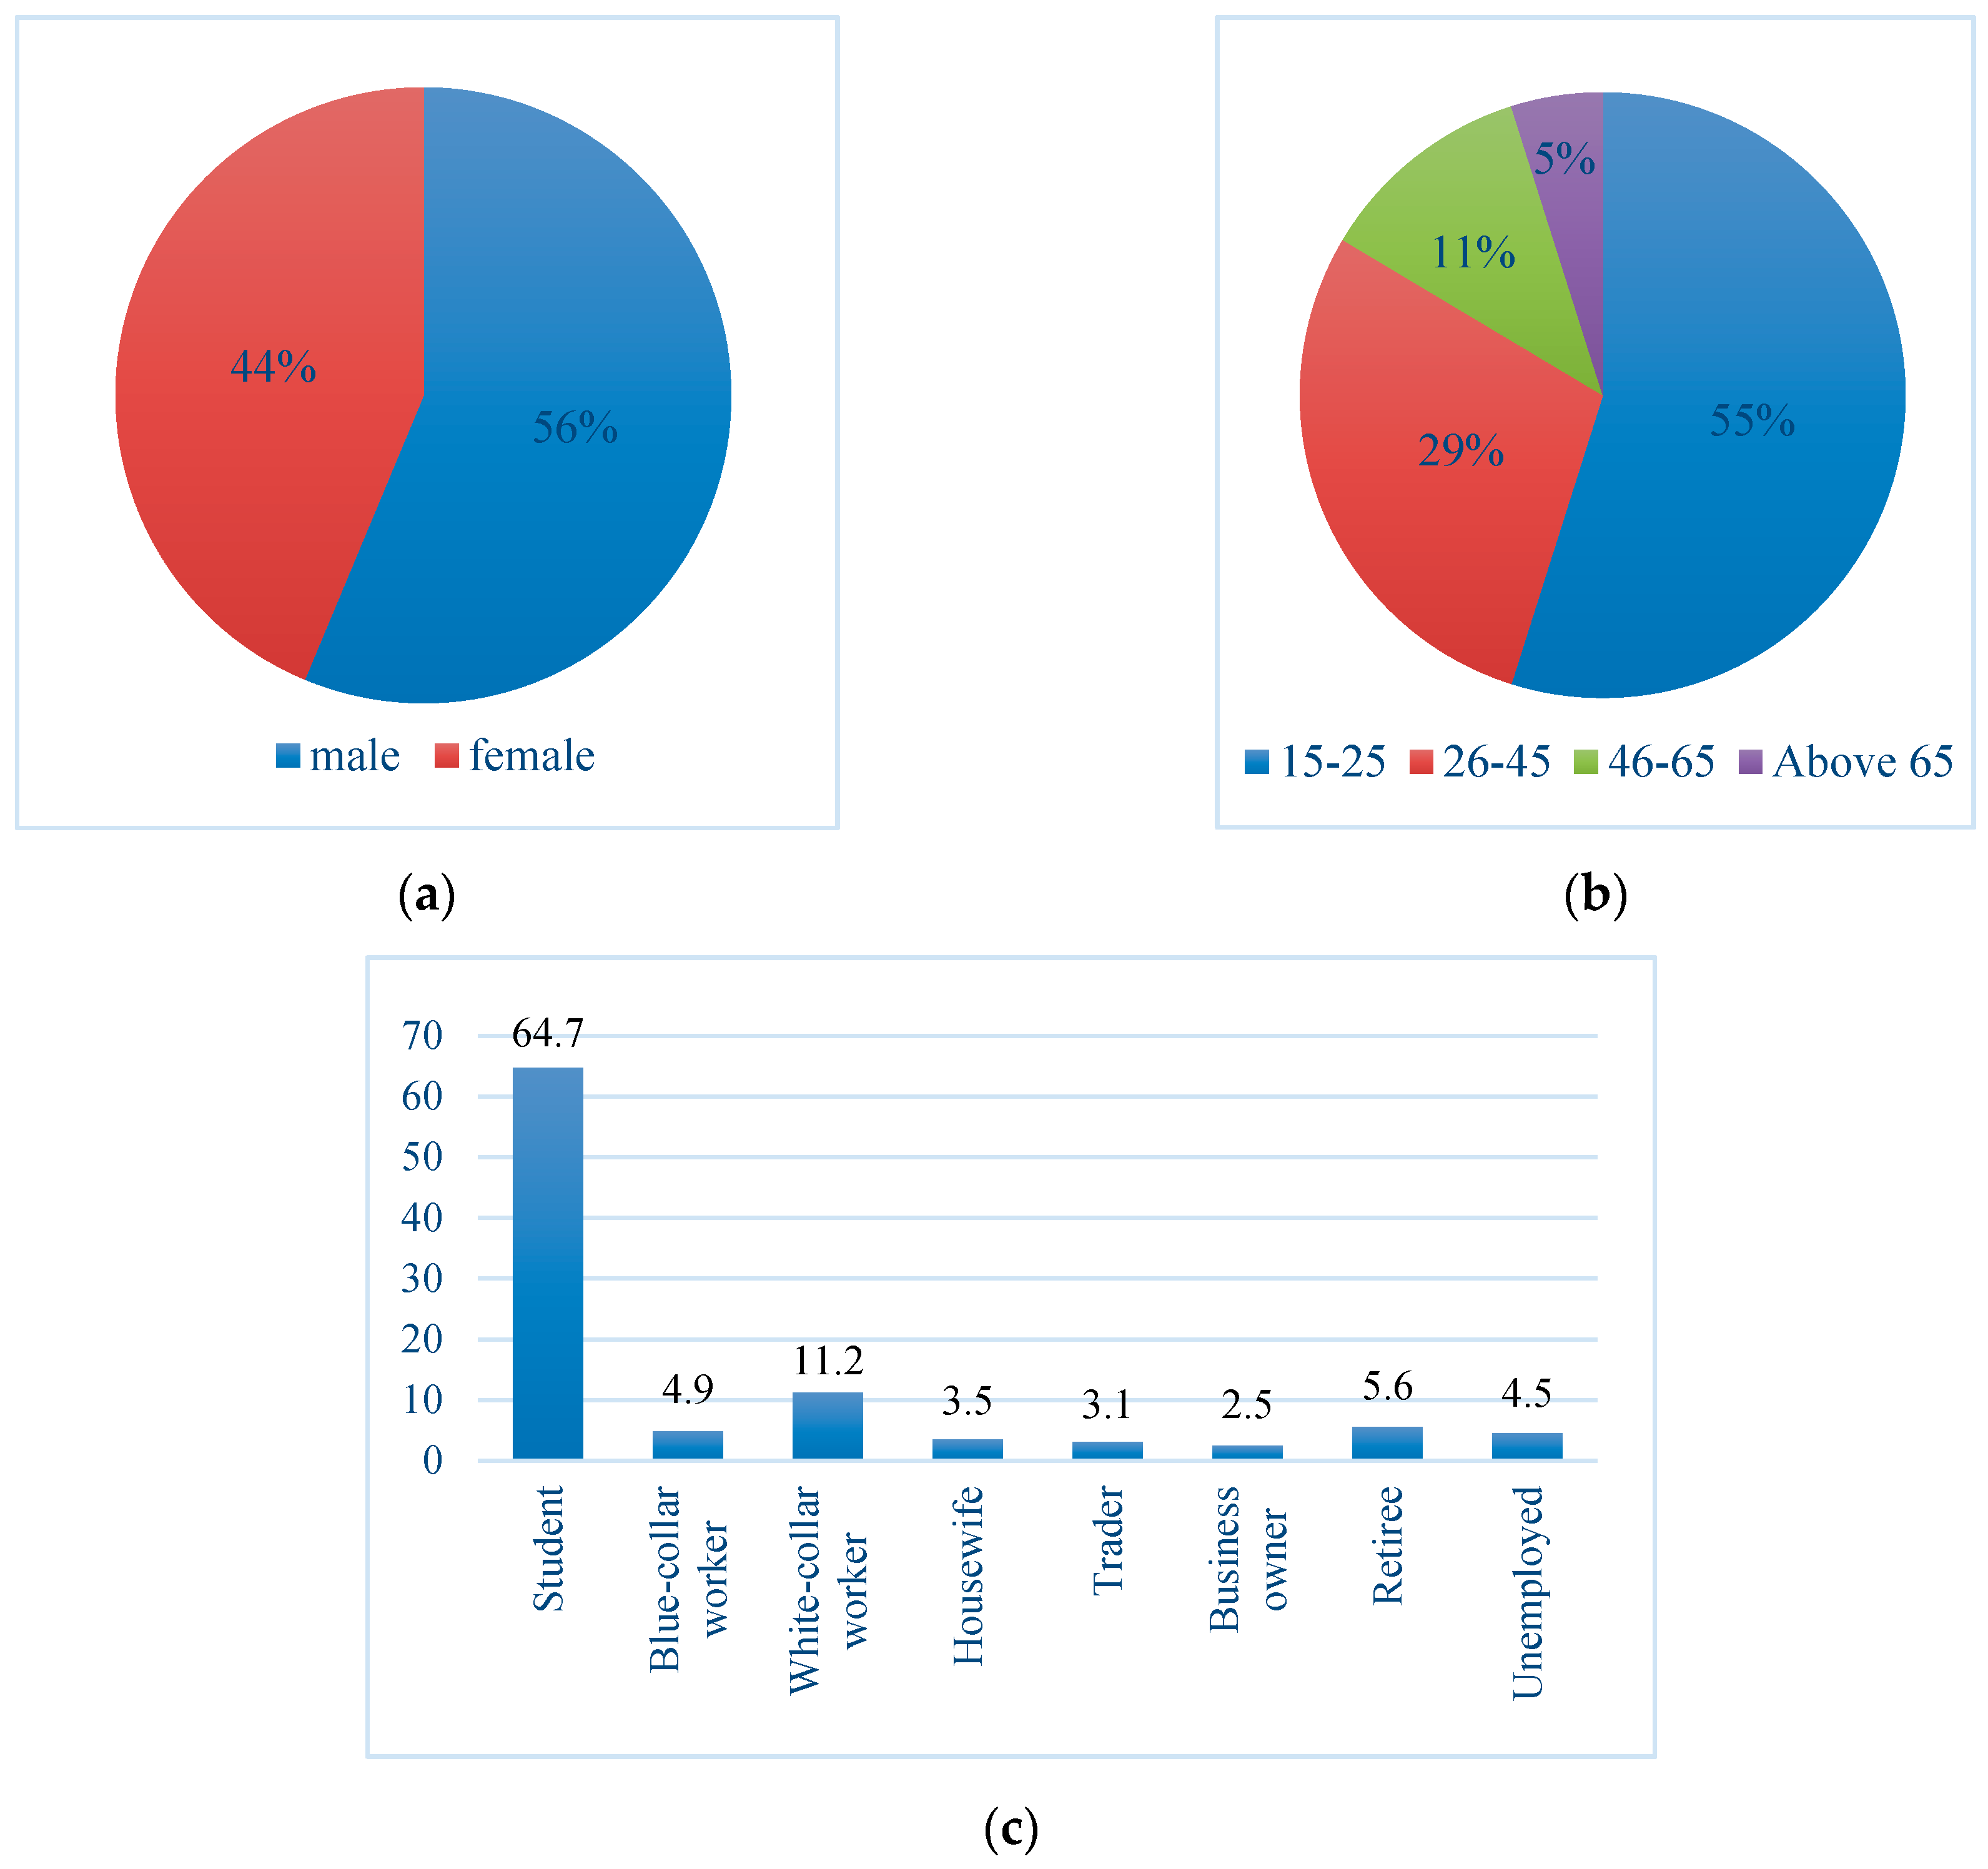
Sample socioeconomic characteristics are reported in Figure 4. Interviewed people are more male than female (161 out of 286), and are aged between 15 and 25 (157 out of 286) or between 26 and 45 (82 out of 286). Definitively, 86% of the sample is under 45 years of age; this is a not surprising result, because of the presence of the university campus and the number of students gravitating around the town. The result is confirmed by the high percentage of interviewed students (~65%). However, 62 out of 286 (~22% of the sample) are employed and 39 out of 286 (14%) are unemployed (housewives, retired or not working people).
4. Results
From the survey, 66% of the interviewed cohort does not use the bike, whereas the remaining percentage spreads between habitual users (10%) and sporadic users (24%).
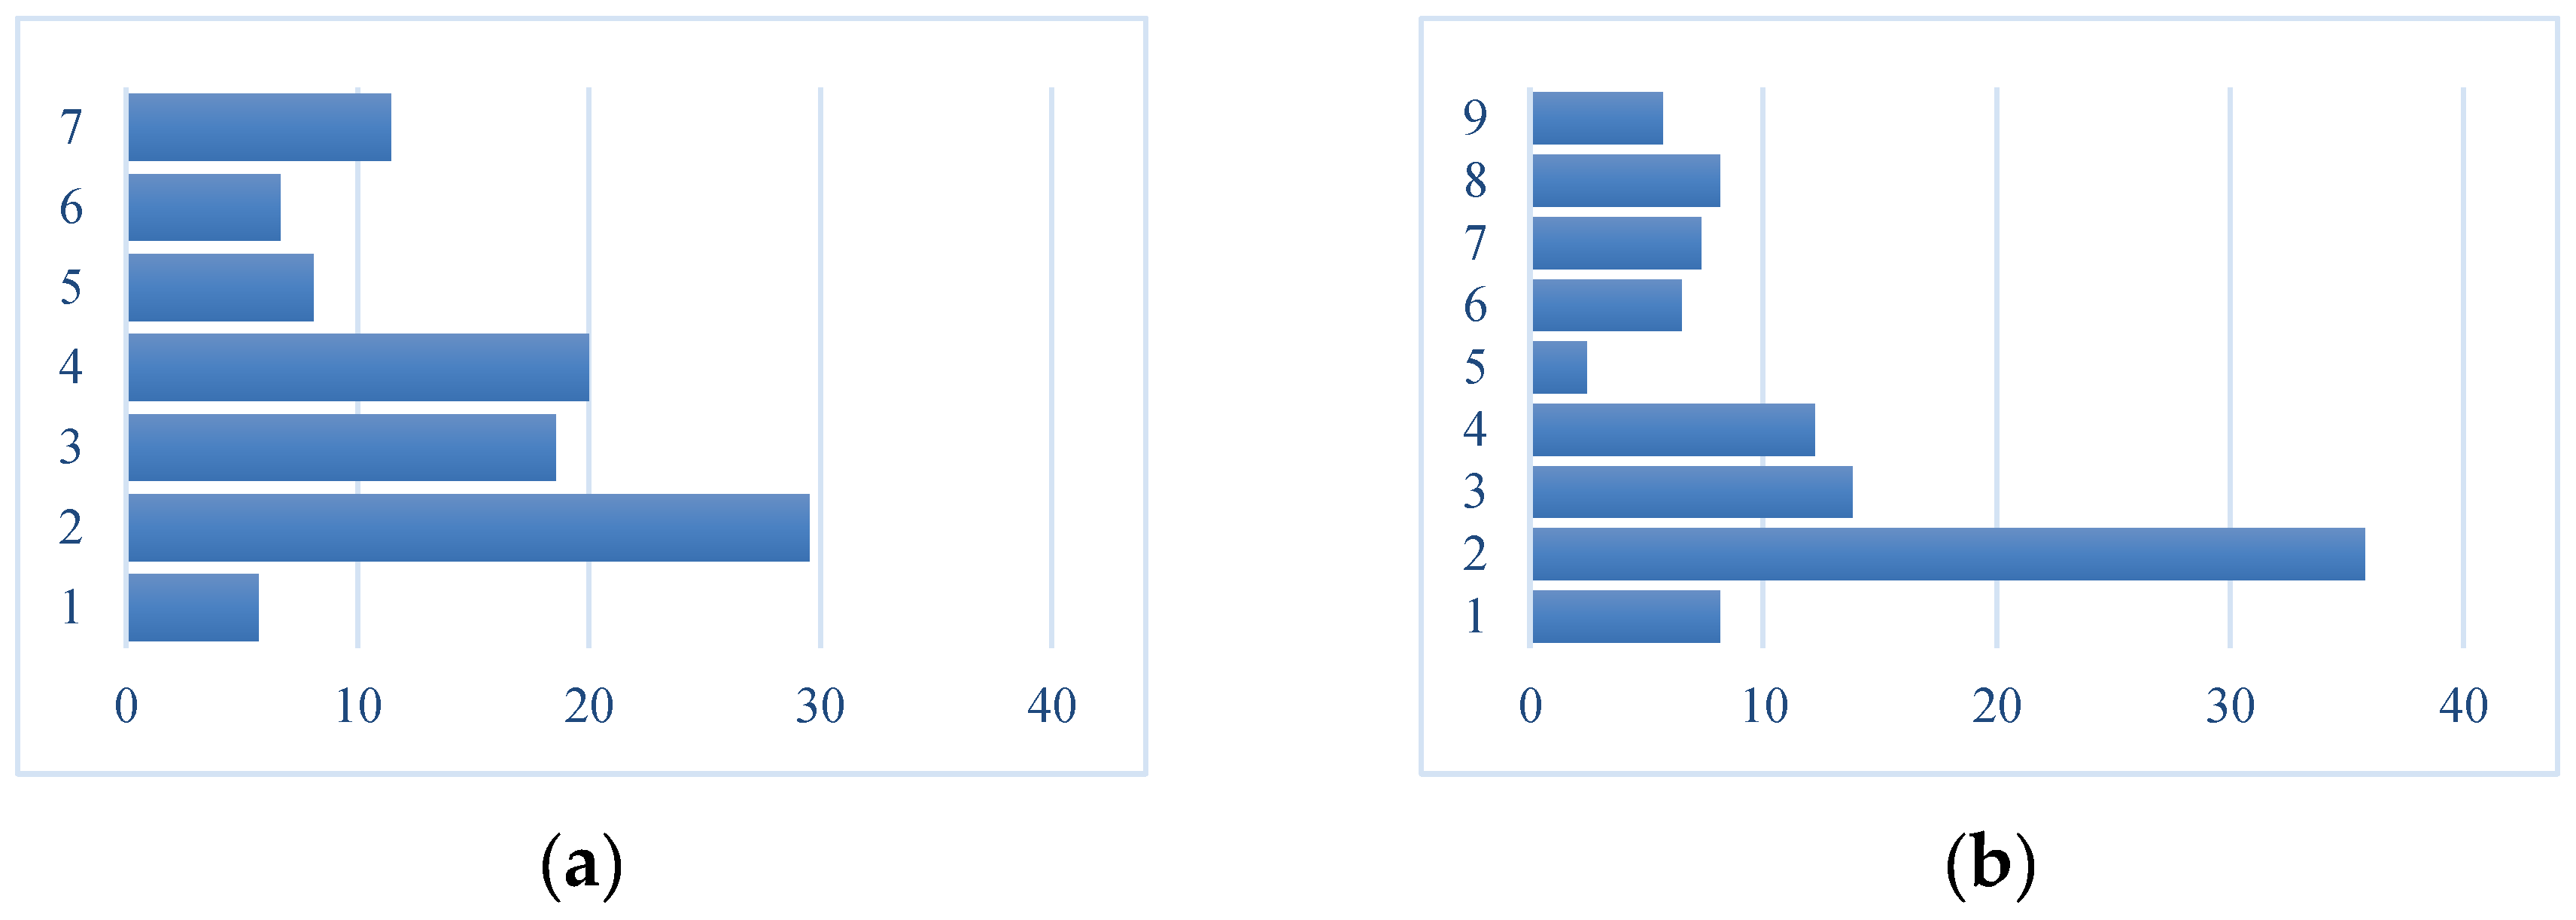
A deeper analysis was made by considering separately bike users and nonusers (see Figure 5, Table 1). Specifically, the purposes stated by bike nonusers revealed that prevalently they are conditioned by not owning the bike (~30% of the answers, by considering also multiple answers) and because they retain this transport mode not suitable with their movements (around 19%). A large amount of the answers (20%) is related to people retaining bike network insufficient, and with not enough bike racks (~7%) (see Figure 5a).
By considering bike users (see Figure 5a), it emerges that the typical user considers the bike not as a transport mode, but only an enjoyable means to do a little exercise (~36% of the answers, by considering also multiple answers) or to reduce the stress linked to the car use (~14%). However, a certain part of the answers (~19%) concerns the will to not contribute to traffic congestion and the consequent traffic pollution. A non-negligible part of the sample makes a choice towards the bike use by considering the negative performance related to car use, which is the time lost for reaching the destination and for park searching (around 14% of the multiple answers). The unexpected percentage of interviewed that do not have car availability (8%) is probably due to the large amount of young and university students in the sample.
The emerging results are confirmed by the percentages regarding the frequency in the bike use and trip purpose stated by bike users (see Figure 6). In fact, the highest percentages relate to trips for leisure (48%) and sport (20%) purpose. Although the bike use for work or study purposes is related to a not small part of the sample (24%), daily bike use is still minimal (14%). The major part of the sample uses bike mode from one to three times a week (~49%).
By crossing the information related to the bike use with socioeconomic characteristics of the sample, certain differences from bike users and nonusers can be observed (see Table 2). Firstly, bike users and nonusers are prevalently male, but nonusers are quite equally spread between male and female compared with users. Bike users are very young but also people under the age of 45, whereas nonusers are prevalently younger. Finally, bike users are mainly students but also white-collar workers, whereas two-thirds of bike nonusers are students.
By crossing the information about gender with trip purpose (see Table 3), it is evident that males compared with females use bike prevalently in trips for study purpose (76.2%). On the contrary, females compared to males use bike prevalently for leisure (45.2%). Relating the frequency use with gender, males mainly use bikes two to three times a week, whereas females use bikes one time a week.
Similar considerations can be made by combining the data of the professional condition with those relating to the trip purpose and to the frequency use (see Table 4). Interviewees aged between 15 and 25 use a bike mainly for trips made for study (61.9%), those between 26 and 45 and 46 and 65 years for work, and respondents above 65 for sport. The youngest cyclists (15–25 years) use a bike one time a week, respondents aged between 26 and 45 and 46 and 65 use a bike every working day, and the above 65 years of age cohort use a bike 1–2 times a month, comparing each age range with the others.
Observing Table 5, it emerges that students prevalently declare to use the bike for making trips for study purposes, whereas employed, retirees, and unemployed respondents claim to use bike for leisure. In relation to the frequency use, the results highlight that students and unemployed persons prevalently use a bike 2–3 times a week, whereas the employed and retired groups only used a bike one time a week.
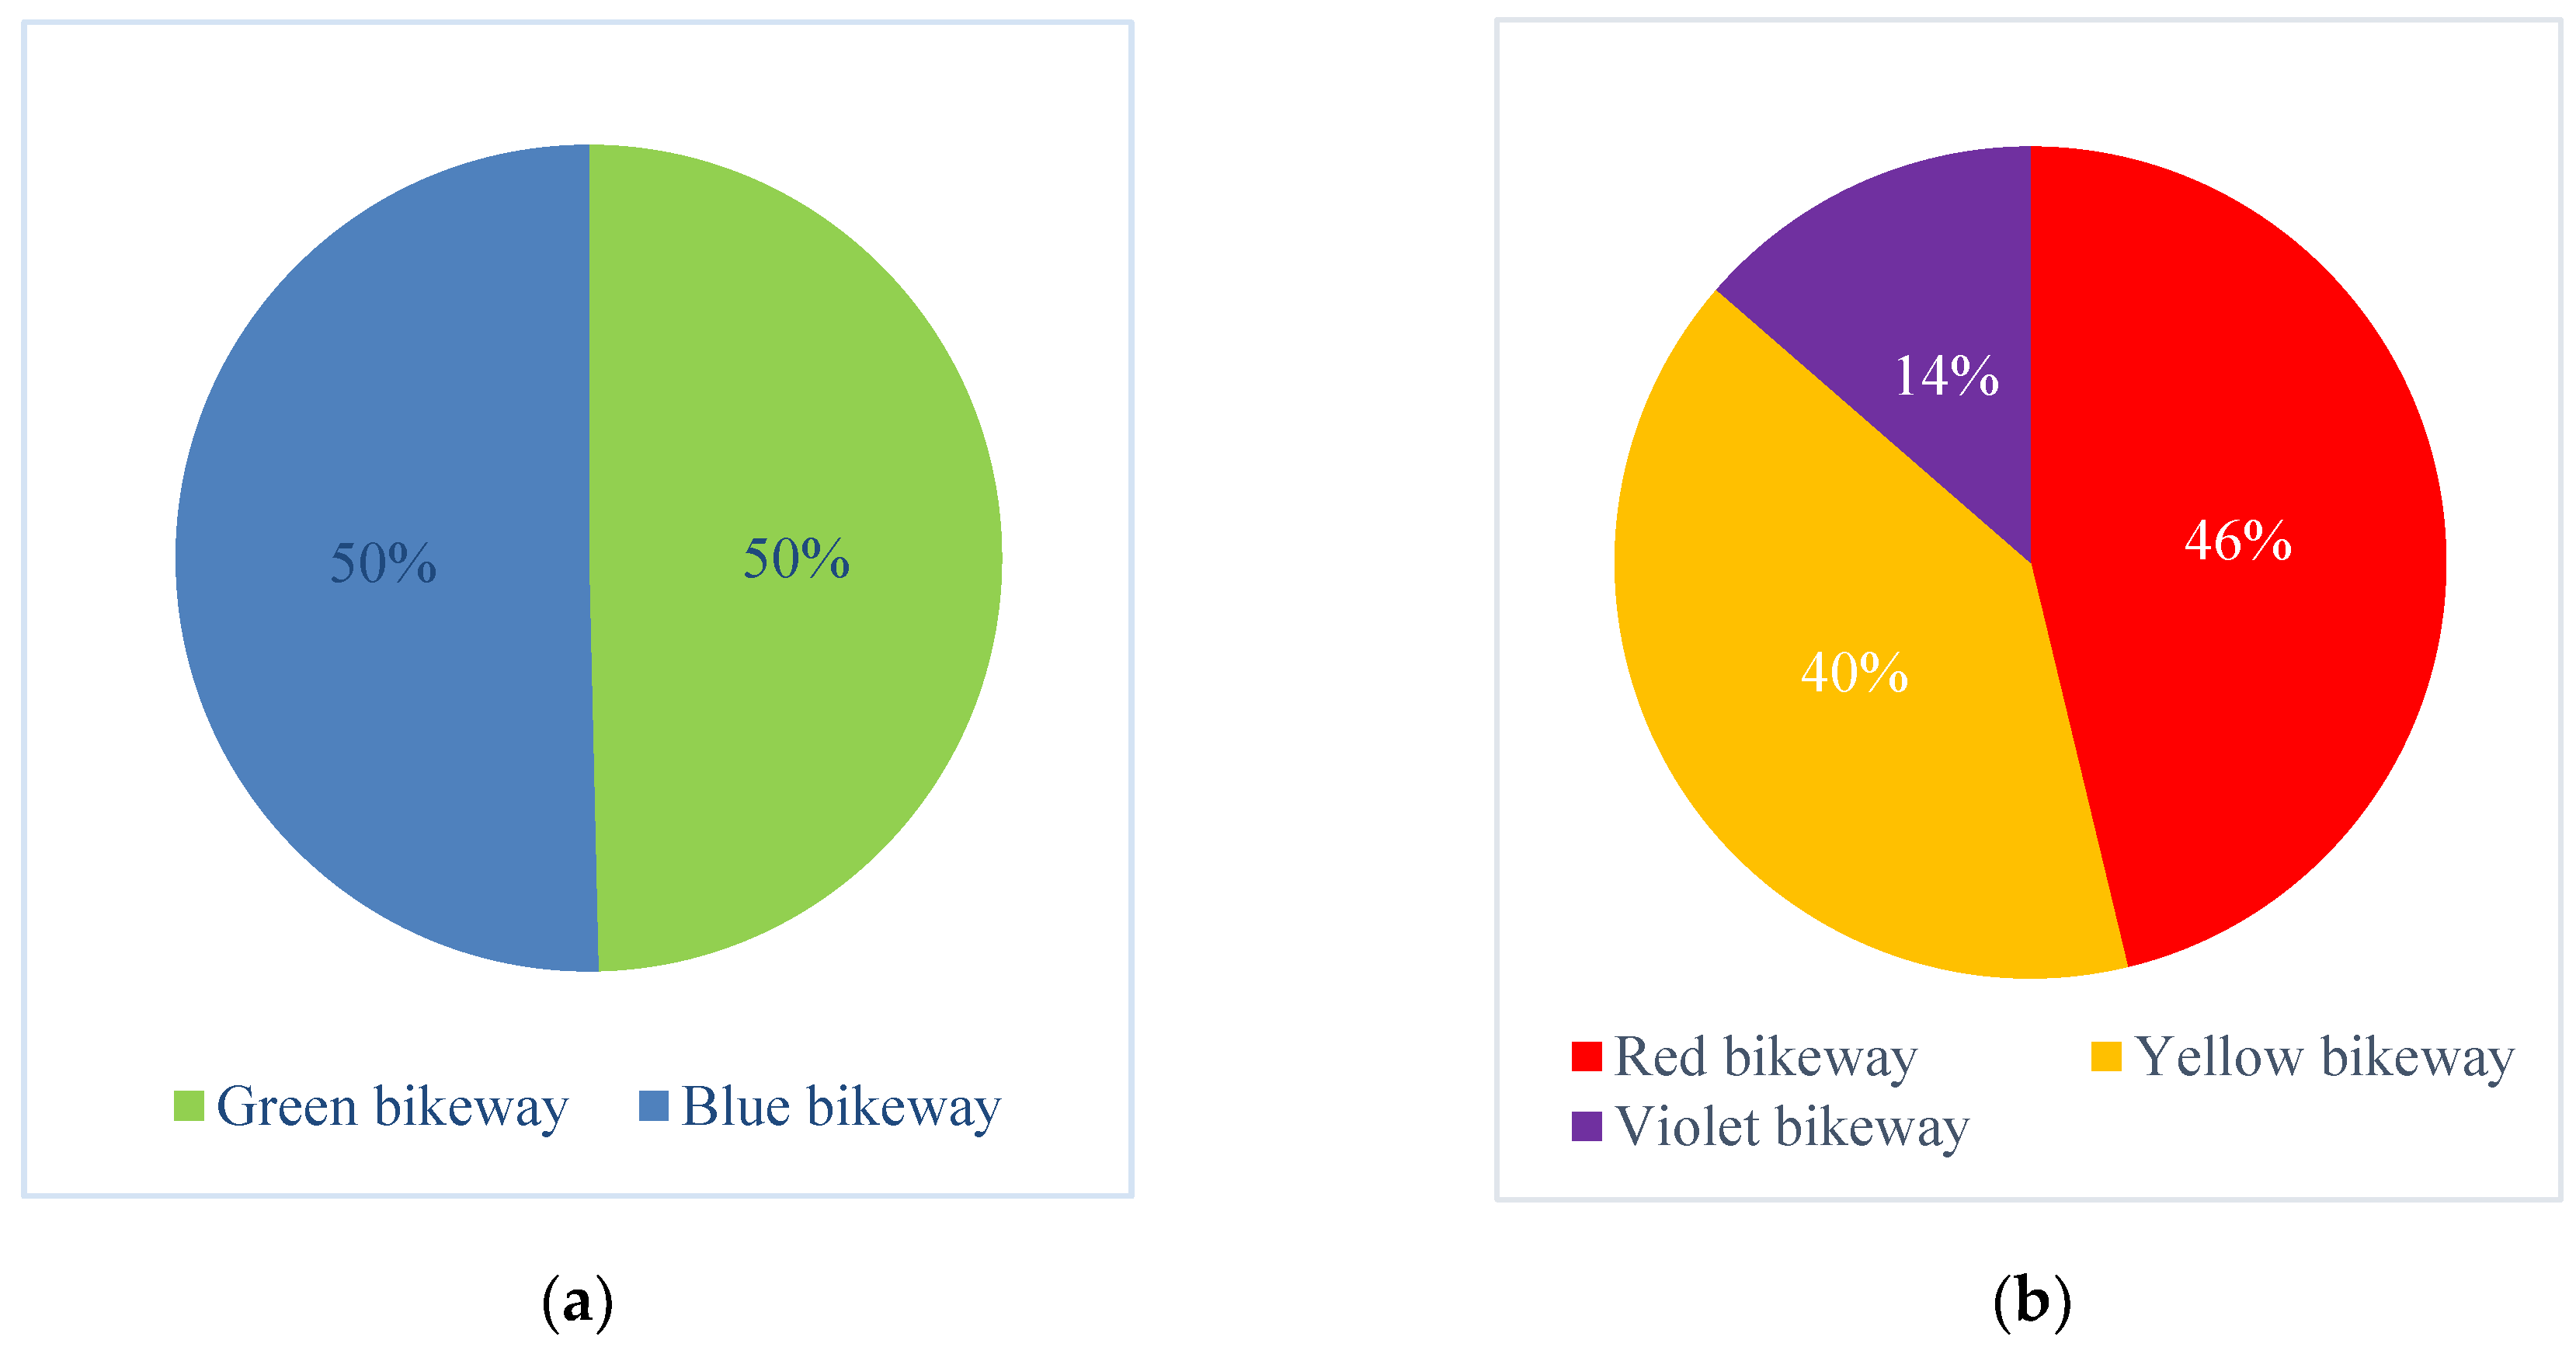
From the analysis of the use of existing and planned bikeways (see Figure 7), we can note that existing bikeways are equally used in the municipal territory, whereas certain preferences emerge from the data analysis about planned bikeways. Specifically, it is evident that red and yellow bikeways are widely preferred by the users (86%) because they connect existing bikeways placed in the residential and business centers and allow the university campus to be reached by bike. On the contrary, the violet bikeway is preferred only by 10% of the current bike users, because it connects the town center with the industrial area, and therefore it is appreciated only by a small number of people.
Relevant information can be obtained assuming the possible presence of groups of respondents having similar characteristics in the sample. In particular, the groups were established considering the socioeconomic characteristics, such as gender, age, and professional condition, considering the classes defined in the questionnaire. The objective is to understand if there are differences in the answers given according to the groups of users that can be established on the basis of these socioeconomic characteristics compared to the answers given as a whole by the interviewed sample. For verifying the statistical significance of the difference among groups, the chi-squared test was performed on data. The null hypothesis according to which the groups are equal to each other is rejected when the chi-squared test exceeds the critical value with a certain significance level (see Table 6).
Considering gender, the sample was divided into two groups: males and females. The analysis showed that a significant difference between males and females only exists in relation to the purpose of bike use. Males prefer using bikes for doing a little exercise, for having no parking problems, and because they do not have car availability. Females mainly use bikes for doing exercise, because cycling is less stressful, and for avoiding contributing to traffic pollution.
On the basis of age, the sample was divided in four groups corresponding to the age classes provided in the questionnaire. The differences among groups are significant in relation to the purpose of bike use and in relation to the use of planned bikeways. Respondents answered these questions differently depending on the age group.
The sample was also grouped according to professional condition. The differences among the eight groups are statistical significant in relation to the questions about the bike use, the trip purpose, and the use of planned bikeways.
5. Discussion
To the best of the authors’ knowledge, in the literature there are not studies carried out for outlining the bike users in the small towns of Southern Italy. However, the data available for macro-areas confirm the results obtained from the survey in the present work.
The inclination of Italians to use bikes is very low; according to reference 6, in Italy the bicycle was the most frequent mode of transport only in 6% of cases, compared to 8% in the European Union. In addition, in Italy the use of bicycles is very different depending on the geographical area. The 15th Report on Italian Mobility, published by ISFORT in 2018 [26], reports that, on average, in Italy, trips by bike account for 5.2% of the total; however, in Northern Italy, cycling trips account for ~8% of the total, in the center 3.6%, and in the South and the islands only 2.7%; Rende is located in the South.
Even the length of bikeways is lower in the South than in the rest of the country. A recent study, City MEZ Mobilità Zero Emissions of Legambiente [27], has shown that in Calabria the five provincial capital cities have a total of 435,987 inhabitants and 28.8 kilometers of bikeways, on average 0.066 kilometers on 1000 inhabitants. The town of Rende has 0.159 kilometers of bikeways on 1000 inhabitants; this value is higher than the average of the five cities, but still low. For comparison, the city of Padua, in the North of Italy, with 210,440 inhabitants, has 169 kilometers of bikeways (0.800 kilometers on 1000 inhabitants).
The survey carried out shows a low level of bike use, and the main causes of this phenomenon were identified. We can note that 66% of the interviewed do not use the bike prevalently because they cannot ride a bike or do not have a bike (35.2% of the reduced sample); a large amount of the sample (27%) retain that the bike network is insufficient and there are not enough bike racks; a certain part of current nonuser (~19%) retain bike mode not compatible with their movements. However, the most interesting result of the investigation is that the bike is not perceived as a means of transport, but rather as a means to carry out recreational or sports activities. At the same time, in the study area (as evidenced by previous surveys on mobility) there is an excessive propensity to motorized movements and, in particular, to the use of individual cars. It is therefore necessary to promote a more modern vision of mobility in the study area, moving from the current condition—in which mobility is based on the possession of the individual car—to mobility as a service [28]. In this vision, the user perceives their own displacement as unitary, but uses the most convenient mode in the various segments of the path. These modes can be bike and car, individual or shared, and the different modes of public transport, which strengthens its role as the backbone of mobility. In this framework, it is necessary to convince the user that the bike is not a poor element of the transport system, but constitutes a central element, able to allow safe and fast movements, and in general a high quality of service, both for carrying out the entire trip (in the range of a few kilometers), and for the adduction to the collective modes.
The cycle network must therefore not only be conveniently extended, connected and protected against motorized traffic, but must have a homogeneous and pleasant visual image. The elements to protect the tracks, street furniture, bike racks, parking lots, and interchanges with collective transport must have homogeneous characteristics and convey to the cyclist the sense of continuity of the route; the cyclist must perceive that, once entered the cycle path, he/she must be able to move in comfort and safety for the entire length of their journey. Furthermore, the creation of a cycle network cannot disregard the characteristics of the demand: in this case, the planned cycle paths are not equally appreciated by potential users. Since the creation of an extensive and high quality network of cycle paths still requires substantial investments and times, it may be appropriate to concentrate interventions on the connections that present the greatest potential for capturing users. Actually, the most consistent segment of users is represented by the students of the local university who, given the short length of the move between residential settlements and the university area, the possession of physical aptitude and an ecological conscience, could more easily opt for the new system. In addition, there is a substantial amount of users that could use the bike as an adduction to public transport on road and rail; therefore, mobility management actions should be concentrated on this target to promote the development of the bike mode.
By considering that a large amount of the sample (27%) retains that bike network is insufficient and there are not enough bike racks, the local administration should operate in order to enlarge the existent bike network and to equip the paths with bike racks and other amenities. However, in order to optimize the available resource, the administration should careful revise the selected extension of the current bike network by considering that one of the three planned bikeways is evaluated positively only by a little part of the interviewed bike users, although a general policy oriented towards network widening could attract new bike users. Even the provision of a bike sharing system, also equipped with electric bicycles, could prove to be very effective, as it would allow potential users currently not in possession of their own bike to approach this mode.
Finally, taking into account the possible presence of groups among users, the bike use can be encouraged responding to requests made based on gender, age and professional condition.
6. Conclusions
The survey showed that the bike use, in the city of Rende, is quite low, but in line with the values of Southern Italy, in which Rende is located. The reasons for the bike use are quite similar to those found in other realities; likewise, the demand for higher quality bikeways also emerges.
The main result of the study is the confirmation of the importance of knowing the characteristics of the mobility demand, also in the design of the cycle networks. In fact, in the case study, the group of travellers with the greatest propensity to biking is made up of students from the local university, who could use the bike for trips from the residences to the campus and within the campus. It is therefore appropriate to concentrate the new interventions on the relationship between the university and the neighboring areas with a greater student population.
In the next step of the research, we intend to deepen the propensity of university students for the bike use, developing a specific model of choice among the various available transport alternatives. We will also focus on the consequences of the realization of the planned bikeways, through a specific before and after study.
Author Contributions
D.C.F. and C.F. have equally contributed to conceptualization, methodology, formal analysis, investigation, data curation, writing—original draft preparation, writing—review and editing, and visualization.
Funding
This research received no external funding.
Acknowledgments
The authors are grateful to Giuseppe Alagia who collected the data used in this research paper during its Degree Thesis in Civil Engineering at the University of Calabria, Italy.
Conflicts of Interest
The authors declare no conflicts of interest.
References
- Meschik, M. Reshaping city traffic towards sustainability. Why transport policy should favor the bicycle instead of car traffic. Procedia Soc. Behav. Sci. 2012, 48, 495–504. [Google Scholar] [CrossRef]
- Crocco, F.; Eboli, L.; Mazzulla, G. Individual attitudes and shopping mode characteristics affecting the use of e-shopping and related travel. Transp. Telecommun. 2013, 14, 45–56. [Google Scholar] [CrossRef]
- Xing, Y.; Handy, S.L.; Mokhtarian, P.L. Factors associated with proportions and miles of bicycling for transportation and recreation in six small US cities. Transp. Res. D Transp. Environ. 2010, 15, 73–81. [Google Scholar] [CrossRef]
- Festa, D.C. Nuovo ruolo della mobilità ciclistica nei sistemi di trasporto urbani. In Mobilità ciclistica e sicurezza; Giuliani, F., Maternini, G., Eds.; Egaf edizioni srl: Forlì, Italy, 2018; pp. 35–62. [Google Scholar]
- Grava, S. Urban Transportation Systems: Choices for Community; McGraw–Hill Professional Architecture: New York, NY, USA, 2003. [Google Scholar]
- TNS Opinion & Social. Special Eurobarometer 422a—Quality of Transport; European Union: Brussels, Belgium, 2014. [Google Scholar]
- Heinen, E.; van Wee, B.; Maat, K. Commuting by bicycle: An overview of the literature. Transp. Rev. 2010, 30, 59–96. [Google Scholar] [CrossRef]
- Heinen, E. Bicycle Commuting, Sustainable Urban Areas 43; Delft Centre for Sustainable Urban Areas: Delft, The Netherlands, 2011. [Google Scholar]
- Muñoz, B.; Monzon, A.; López, E. Transition to a cyclable city: Latent variables affecting bicycle commuting. Transport. Res. Part A Policy Pract. 2016, 84, 4–17. [Google Scholar] [CrossRef]
- Fernández-Heredia, A.; Monzón, A.; Jara-Díaz, S. Understanding cyclists’ perceptions, keys for a successful bicycle promotion. Transport. Res. Part A Policy Pract. 2014, 63, 1–11. [Google Scholar] [CrossRef]
- Heinen, E.; Maat, K.; van Wee, B. The role of attitudes toward characteristics of bicycle commuting on the choice to cycle to work over various distances. Transp. Res. D Transp. Environ. 2011, 16, 102–109. [Google Scholar] [CrossRef]
- Cervero, R.; Denman, S.; Jin, Y. Network design, built and natural environments, and bicycle commuting: Evidence from British cities and towns. Transp. Policy 2019, 74, 153–164. [Google Scholar] [CrossRef]
- Bagloee, S.A.; Sarvi, M.; Wallace, M. Bicycle lane priority: Promoting bicycle as a green mode even in congested urban area. Transp. Res. Part A Policy Pract. 2016, 87, 102–121. [Google Scholar] [CrossRef]
- Cole-Hunter, T.; Donaire-Gonzalez, D.; Curto, A.; Ambros, A.; Valentin, A.; Garcia-Aymerich, J.; Martinez, D.; Braun, L.M.; Mendez, M.; Jerrett, M.; Rodriguez, D.; de Nazelle, A.; Nieuwenhuijsen, M. Objective correlates and determinants of bicycle commuting propensity in an urban environment. Transp. Res. Part D Transp. Environ. 2015, 40, 132–143. [Google Scholar] [CrossRef] [Green Version]
- Kaplan, S.; Wrzesinskac, D.K.; Pratod, C.G. The role of human needs in the intention to use conventional and electric bicycle sharing in a driving-oriented country. Transp. Policy 2018, 71, 138–146. [Google Scholar] [CrossRef]
- Kaltenbrunner, A.; Meza, R.; Grivolla, J.; Codina, J.; Banchs, R. Urban cycles and mobility patterns: Exploring and predicting trends in a bicycle-based public transport system. Pervasive Mob. Comput. 2010, 6, 455–466. [Google Scholar] [CrossRef]
- Nankervis, M. The effect of weather and climate on bicycle commuting. Transp. Res. Part A Policy Pract. 1999, 33, 417–431. [Google Scholar] [CrossRef]
- Kager, R.; Bertolini, L.; Te Brömmelstroet, M. Characterisation of and reflections on the synergy of bicycles and public transport. Transp. Res. Part A Policy Pract. 2016, 85, 208–219. [Google Scholar] [CrossRef]
- Zhao, P.; Li, S. Bicycle-metro integration in a growing city: The determinants of cycling as a transfer mode in metro station areas in Beijing. Transp. Res. Part A Policy Pract. 2017, 99, 46–60. [Google Scholar] [CrossRef]
- Yang, X.; Cheng, Z.; Chen, G.; Wang, L.; Ruan, Z.; Zheng, Y. The impact of a public bicycle-sharing system on urban public transport networks. Transp. Res. Part A Policy Pract. 2018, 107, 246–256. [Google Scholar] [CrossRef]
- Saplıoğlu, M.; Aydın, M.M. Choosing safe and suitable bicycle routes to integrate cycling and public transport systems. J. Transp. Health 2018, 10, 236–252. [Google Scholar] [CrossRef]
- Owen, N.; De Bourdeaudhuij, I.; Sugiyama, T.; Leslie, E.; Cerin, E.; Van Dyck, D.; Bauman, A. Bicycle Use for Transport in an Australian and a Belgian City: Associations with Built-Environment Attributes. J. Urban. Health 2010, 87, 189–198. [Google Scholar] [CrossRef] [PubMed] [Green Version]
- Damant-Sirois, G.; Grimsrud, M.; El-Geneidy, A.M. What’s your type: A multidimensional cyclist typology. Transportation 2014, 41, 1153–1169. [Google Scholar] [CrossRef]
- Istat Popolazione Residente al 1° Gennaio 2018. Available online: http://demo.istat.it/pop2018/index.html (accessed on 11 March 2019).
- Alagia, G. La mobilità ciclabile: Il caso del comune di Rende (CS). Degree Thesis, University of Calabria, Rende (CS), Italy, 2018. [Google Scholar]
- ISFORT. 15° Rapporto sulla mobilità in Italia; ASSTRA, ANAV: Roma, Italy, 2018. [Google Scholar]
- Legambiente; Motus-E. Città MEZ Mobilità Emissioni Zero; Legambiente: Roma, Italy, 2019. [Google Scholar]
- Goodall, W.; Fishman, D.T.; Bornstein, J.; Bonthron, B. The rise of mobility as a service. Reshaping how urbanites get around. Deloitte Rev. 2017, 20, 112–129. [Google Scholar]
Figure 1.
Territorial context (source: Google Maps and Master Plan of Rende, elaborated by authors).
Figure 1.
Territorial context (source: Google Maps and Master Plan of Rende, elaborated by authors).

Figure 2.
The green bikeway.

Figure 3.
The blue bikeway.

Figure 4.
Sample socioeconomic characteristics: (a) gender, (b) age, and (c) professional occupation,
Figure 4.
Sample socioeconomic characteristics: (a) gender, (b) age, and (c) professional occupation,

Figure 5.
Purpose of bike nonuse (a) and use (b).

Figure 6.
Frequency of bike use (a) and trip purpose (b).

Figure 7.
Used (a) and planned (b) bikeways.


Table 1.
Purpose of bike nonuse and use.
| Purpose of Bike Nonuse | n. | % | |
|---|---|---|---|
| 1 | I cannot ride a bike | 12 | 5.7 |
| 2 | I do not have a bike | 62 | 29.5 |
| 3 | It is not compatible with my movements | 39 | 18.6 |
| 4 | Bike network is not sufficient | 42 | 20.0 |
| 5 | I consider using bike unsafe | 17 | 8.1 |
| 6 | There are not enough bike racks | 14 | 6.7 |
| 7 | Other | 24 | 11.4 |
| Total | 210 | 100.0 | |
| Purpose of Bike Use | |||
| 1 | I have no parking problems | 10 | 8.1 |
| 2 | I do a little exercise | 44 | 35.8 |
| 3 | It is less stressful | 17 | 13.8 |
| 4 | I do not want to contribute to air pollution due to traffic | 15 | 12.2 |
| 5 | I have no nearby public transport | 3 | 2.5 |
| 6 | I do not contribute to traffic congestion | 8 | 6.5 |
| 7 | It takes less time | 9 | 7.3 |
| 8 | I do not have car availability | 10 | 8.1 |
| 9 | Other | 7 | 5.7 |
| Total | 123 | 100.0 |
Table 2.
Crossed statistical analysis.
| Bike Users | Bike Nonusers | Total | |||
|---|---|---|---|---|---|
| Gender | n. | % | n. | % | |
| Male | 60 | 37.3 | 101 | 62.7 | 161 |
| Female | 38 | 30.4 | 87 | 69.6 | 125 |
| Total | 98 | 34.3 | 188 | 65.7 | 286 |
| Age | |||||
| 15–25 | 48 | 30.4 | 110 | 69.6 | 158 |
| 26–45 | 35 | 42.7 | 47 | 57.3 | 82 |
| 46–65 | 11 | 34.4 | 21 | 65.6 | 32 |
| Above 65 | 4 | 28.6 | 10 | 71.4 | 14 |
| Total | 98 | 34.3 | 188 | 65.7 | 286 |
| Professional condition | |||||
| Student | 61 | 33.0 | 124 | 67.0 | 185 |
| Blue-collar worker | 5 | 35.7 | 9 | 64.3 | 14 |
| White-collar worker | 14 | 43.8 | 18 | 56.3 | 32 |
| Housewife | 4 | 40.0 | 6 | 60.0 | 10 |
| Trader | 3 | 33.3 | 6 | 66.7 | 9 |
| Business owner | 2 | 28.6 | 5 | 71.4 | 7 |
| Retiree | 5 | 31.3 | 11 | 68.8 | 16 |
| Unemployed | 4 | 30.8 | 9 | 69.2 | 13 |
| Total | 98 | 34.3 | 188 | 65.7 | 286 |
Table 3.
Crossed statistical analysis (Trip purpose-Gender; Frequency use-Gender).
| Trip Purpose | Males | % | Females | % | Total |
| Work | 5 | 62.5 | 3 | 37.5 | 8 |
| Study | 16 | 76.2 | 5 | 23.8 | 21 |
| Sport | 12 | 60.0 | 8 | 40.0 | 20 |
| Leisure | 23 | 54.8 | 19 | 45.2 | 42 |
| Other | 4 | 57.1 | 3 | 42.9 | 7 |
| Total | 60 | 61.2 | 38 | 38.8 | 98 |
| Frequency Use | Males | % | Females | % | |
| Every working day | 10 | 71.4 | 4 | 28.6 | 14 |
| 2–3 times a week | 17 | 73.9 | 6 | 26.1 | 23 |
| 1 time a week | 13 | 52.0 | 12 | 48.0 | 25 |
| 1–2 times a month | 20 | 55.6 | 16 | 44.4 | 36 |
| Total | 60 | 61.2 | 38 | 38.8 | 98 |
Table 4.
Crossed statistical analysis (Trip purpose-Age; Frequency use-Age).
| Trip Purpose | 15–25 | % | 26–45 | % | 46–65 | % | >65 | % | Total |
| Work | 1 | 12.5 | 4 | 50.0 | 3 | 37.5 | 0 | 0.0 | 8 |
| Study | 13 | 61.9 | 8 | 38.1 | 0 | 0.0 | 0 | 0.0 | 21 |
| Sport | 11 | 55.0 | 5 | 25.0 | 3 | 15.0 | 1 | 5.0 | 20 |
| Leisure | 17 | 40.5 | 16 | 38.1 | 7 | 16.7 | 2 | 4.8 | 42 |
| Other | 4 | 57.1 | 3 | 42.9 | 0 | 0.0 | 0 | 0.0 | 7 |
| Total | 46 | 46.9 | 36 | 36.7 | 13 | 13.3 | 3 | 3.1 | 98 |
| Frequency Use | 15–25 | % | 26–45 | % | 46–65 | % | >65 | % | |
| Every working day | 4 | 28.6 | 7 | 50.0 | 3 | 21.4 | 0 | 0.0 | 14 |
| 2–3 times a week | 10 | 43.5 | 9 | 39.1 | 3 | 13.0 | 1 | 4.3 | 23 |
| 1 time a week | 14 | 56.0 | 7 | 28.0 | 4 | 16.0 | 0 | 0.0 | 25 |
| 1–2 times a month | 18 | 50.0 | 13 | 36.1 | 3 | 8.3 | 2 | 5.6 | 36 |
| Total | 46 | 46.9 | 36 | 36.7 | 13 | 13.3 | 3 | 3.1 | 98 |
Table 5.
Crossed statistical analysis (Trip purpose-Professional condition; Frequency use-Professional condition).
Table 5.
Crossed statistical analysis (Trip purpose-Professional condition; Frequency use-Professional condition).
| Trip Purpose | Student | % | Employed | % | Retired | % | Unemployed | % | Total |
| Work | 1 | 12.5 | 7 | 87.5 | 0 | 0.0 | 0 | 0.0 | 8 |
| Study | 21 | 100.0 | 0 | 0.0 | 0 | 0.0 | 0 | 0.0 | 21 |
| Sport | 10 | 50.0 | 8 | 40.0 | 1 | 5.0 | 1 | 5.0 | 20 |
| Leisure | 18 | 42.9 | 18 | 42.9 | 2 | 4.8 | 4 | 9.5 | 42 |
| Other | 5 | 71.4 | 0 | 0.0 | 0 | 0.0 | 2 | 28.6 | 7 |
| Total | 55 | 56.1 | 33 | 33.7 | 3 | 3.1 | 7 | 7.1 | 98 |
| Frequency Use | Student | % | Employed | % | Retiree | % | Unemployed | % | |
| Every working day | 8 | 57.1 | 5 | 35.7 | 0 | 0.0 | 1 | 7.1 | 14 |
| 2–3 times a week | 14 | 60.9 | 6 | 26.1 | 1 | 4.3 | 2 | 8.7 | 23 |
| 1 time a week | 13 | 52.0 | 10 | 40.0 | 0 | 0.0 | 2 | 8.0 | 25 |
| 1–2 times a month | 20 | 55.6 | 12 | 33.3 | 2 | 5.6 | 2 | 5.6 | 36 |
| Total | 55 | 56.1 | 33 | 33.7 | 3 | 3.1 | 7 | 7.1 | 98 |
Table 6.
Significant differences among groups.
| Gender | Age | Professional Condition | |||||||
|---|---|---|---|---|---|---|---|---|---|
| Chi-Squared | p-Value | Chi-Squared | p-Value | Chi-Squared | p-Value | ||||
| Bike use | 2.476 | 0.290 | n.s. | 8.082 | 0.232 | n.s. | 27.154 | 0.018 | ** |
| Purpose of bike nonuse | 8.239 | 0.221 | n.s. | 11.122 | 0.889 | n.s. | 47.113 | 0.271 | n.s. |
| Purpose of bike use | 15.452 | 0.051 | * | 37.494 | 0.039 | ** | 68.663 | 0.119 | n.s. |
| Frequency in the bike use | 3.557 | 0.313 | n.s. | 6.359 | 0.704 | n.s. | 20.926 | 0.463 | n.s. |
| Trip purpose | 2.787 | 0.594 | n.s. | 14.478 | 0.271 | n.s. | 58.133 | 0.000 | *** |
| Use of existing bikeways | 2.587 | 0.108 | n.s. | 2.168 | 0.538 | n.s | 6.468 | 0.486 | n.s. |
| Use of planned bikeways | 0.016 | 0.901 | n.s. | 15.028 | 0.020 | ** | 40.528 | 0.000 | *** |
*** Significance at 1% level, ** Significance at 5% level, * Significance at 10% level, n.s. Not significant.
© 2019 by the authors. Licensee MDPI, Basel, Switzerland. This article is an open access article distributed under the terms and conditions of the Creative Commons Attribution (CC BY) license (http://creativecommons.org/licenses/by/4.0/).
Share and Cite
MDPI and ACS Style
Festa, D.C.; Forciniti, C. Attitude towards Bike Use in Rende, a Small Town in South Italy. Sustainability 2019, 11, 2703. https://doi.org/10.3390/su11092703
AMA Style
Festa DC, Forciniti C. Attitude towards Bike Use in Rende, a Small Town in South Italy. Sustainability. 2019; 11(9):2703. https://doi.org/10.3390/su11092703
Chicago/Turabian StyleFesta, Demetrio Carmine, and Carmen Forciniti. 2019. "Attitude towards Bike Use in Rende, a Small Town in South Italy" Sustainability 11, no. 9: 2703. https://doi.org/10.3390/su11092703
Note that from the first issue of 2016, this journal uses article numbers instead of page numbers. See further details here.