Integrated BIM-Parametric Workflow-Based Analysis of Daylight Improvement for Sustainable Renovation of an Exemplary Apartment in Seoul, Korea


Abstract
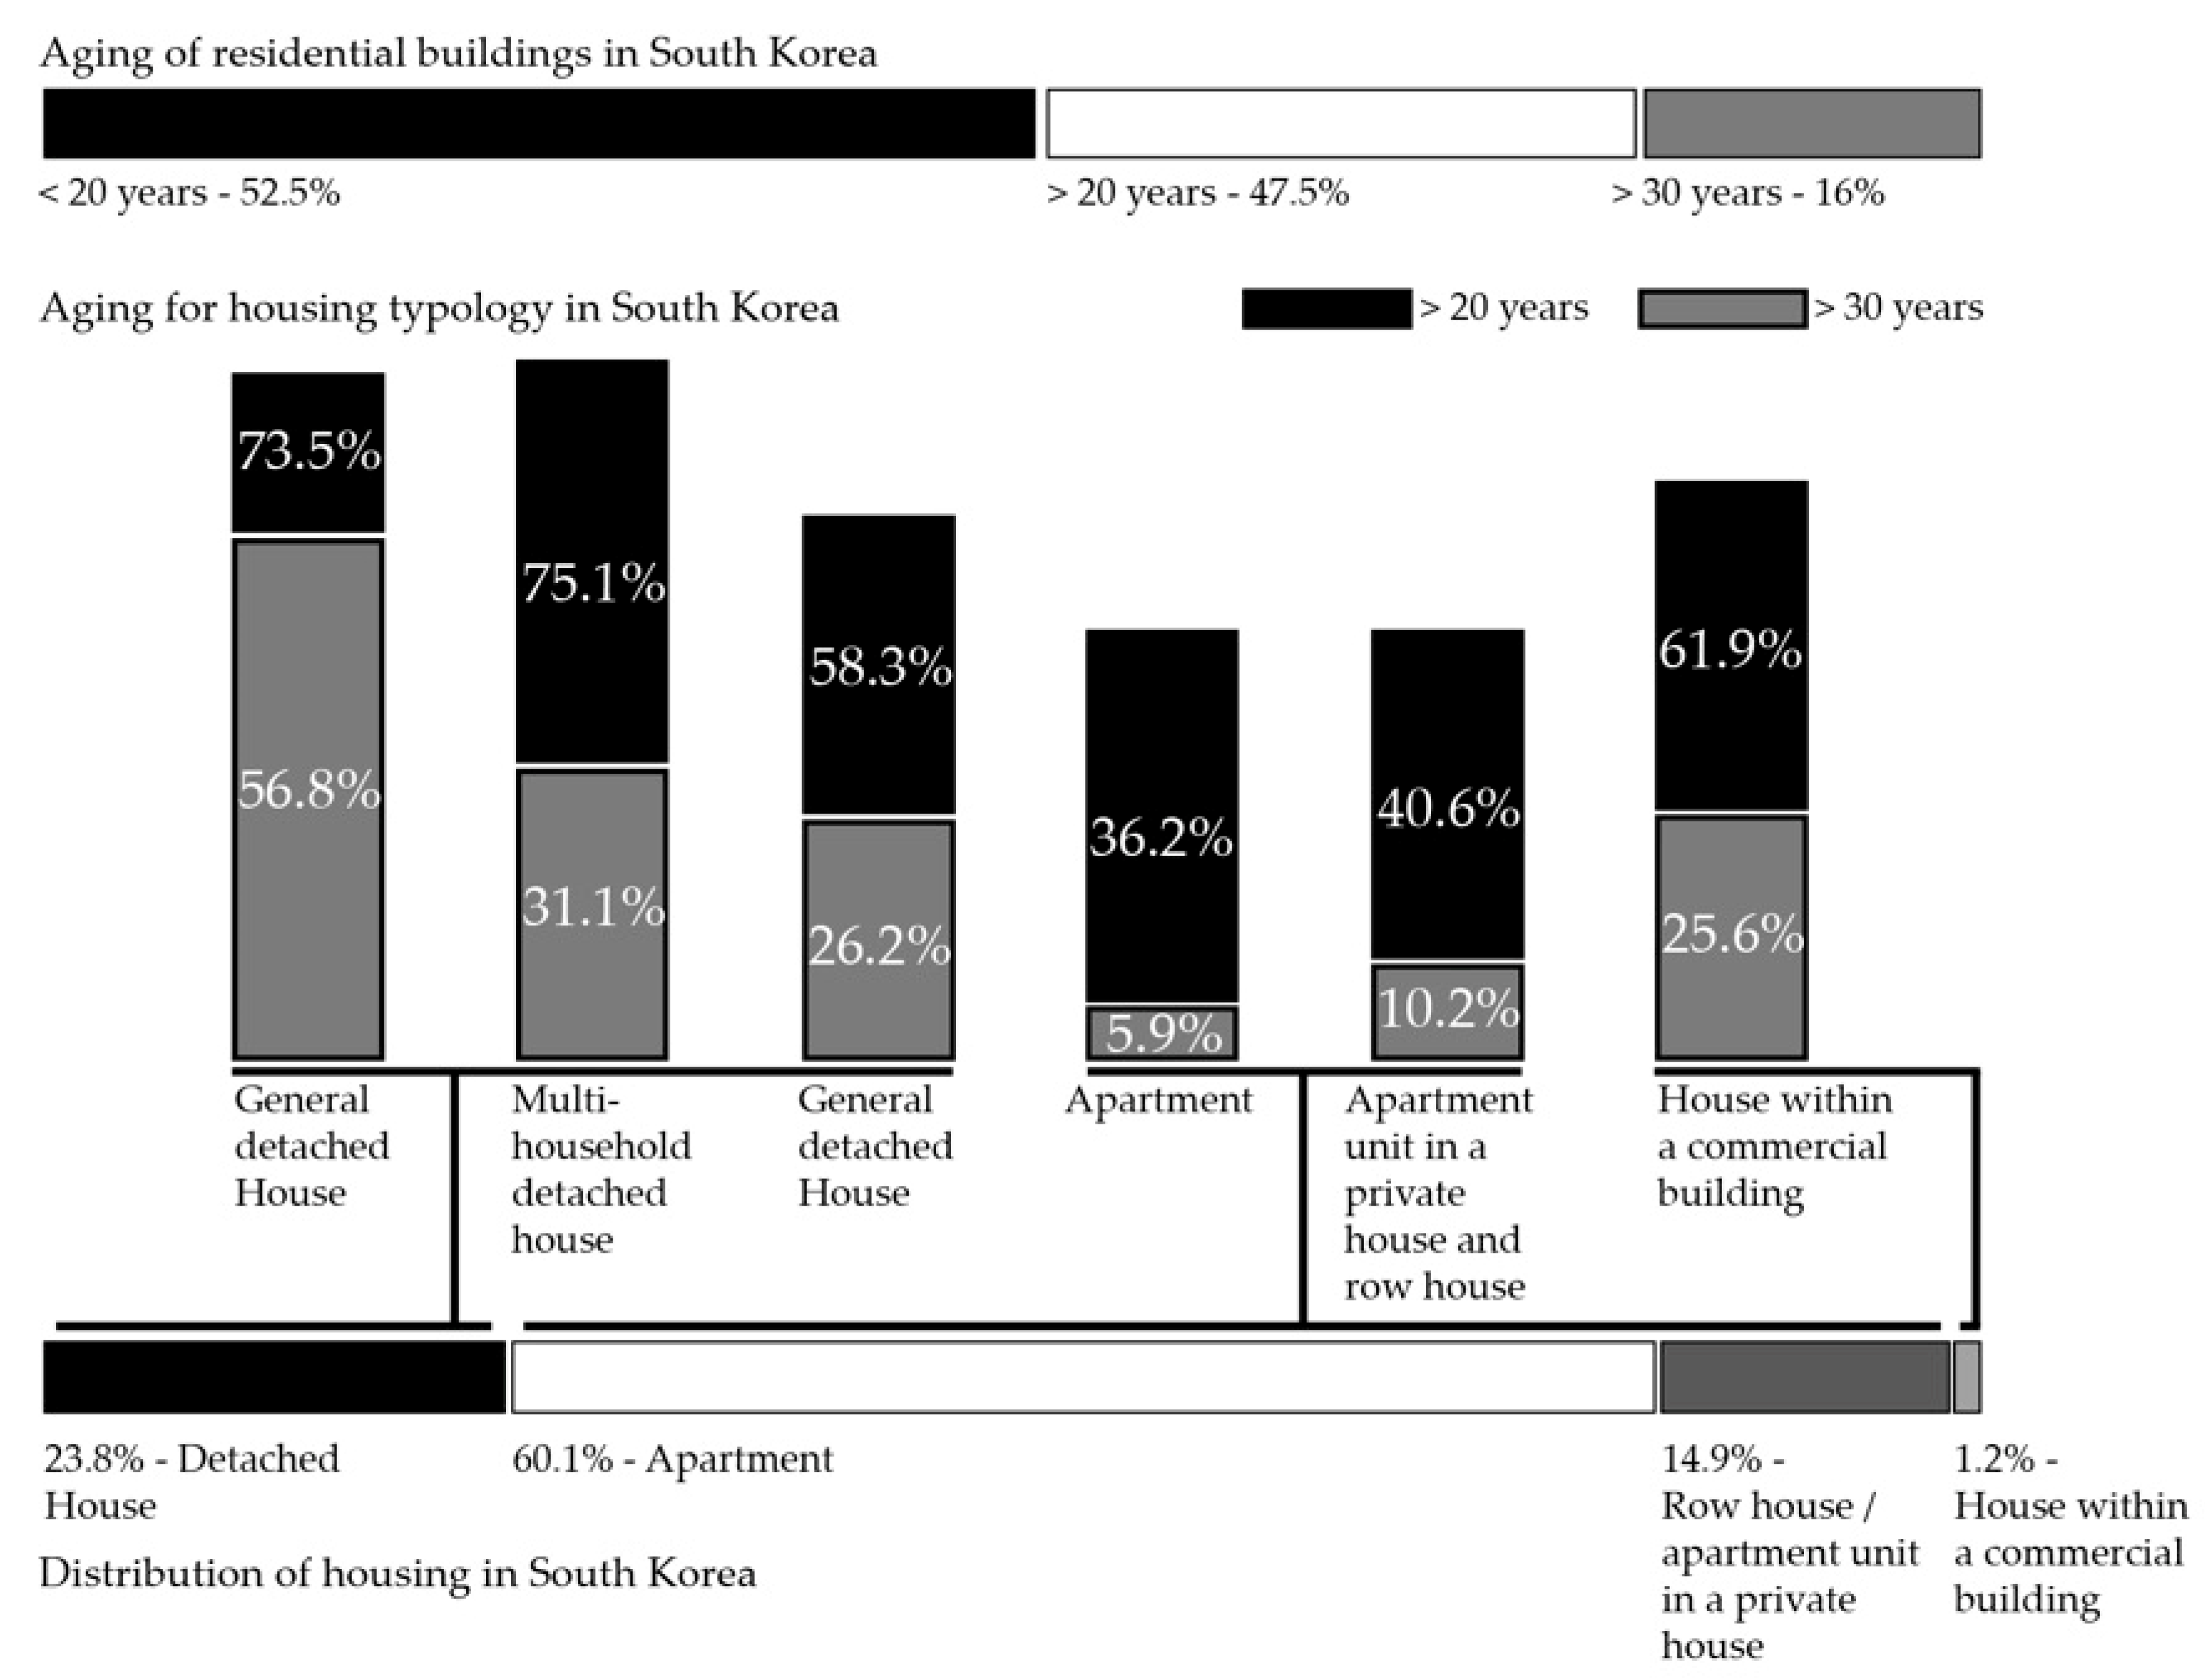
:1. Introduction
2. Materials and Methods
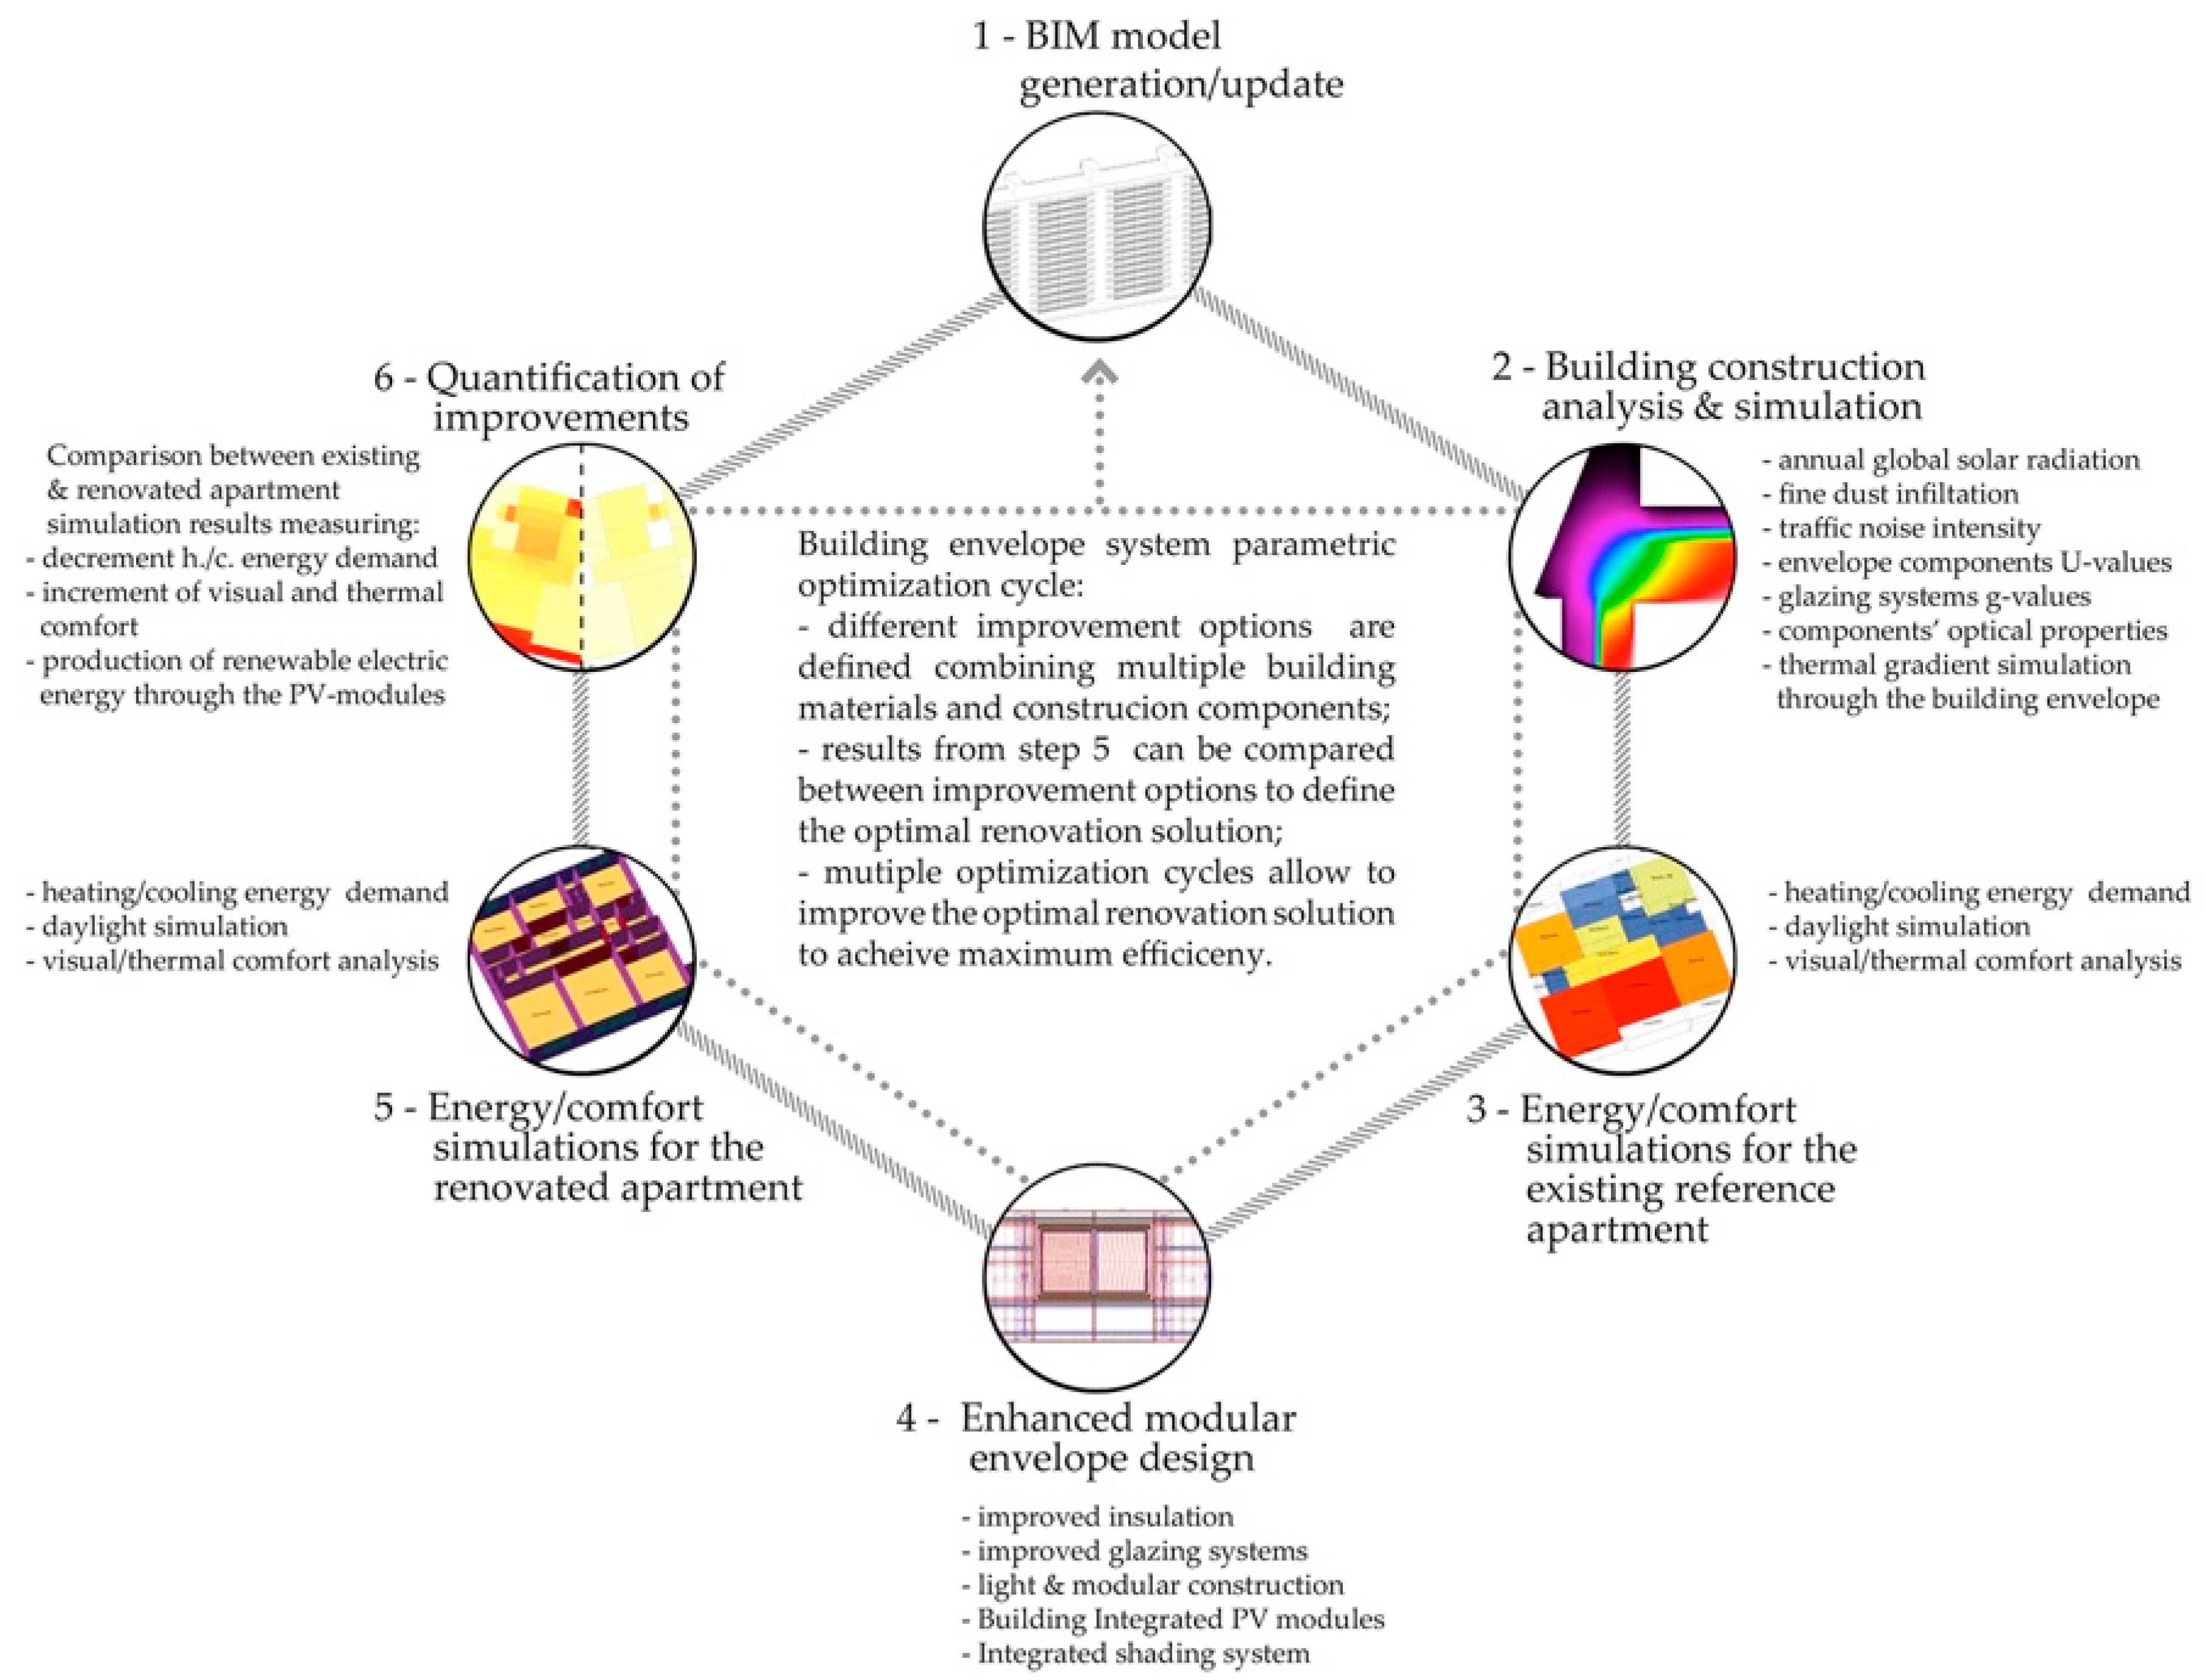
- Virtual building reconstruction using BIM: the exemplar building construction is virtually reconstructed in Revit. Accordingly, construction elements, such as windows and glazing systems, are collected in specific construction families.
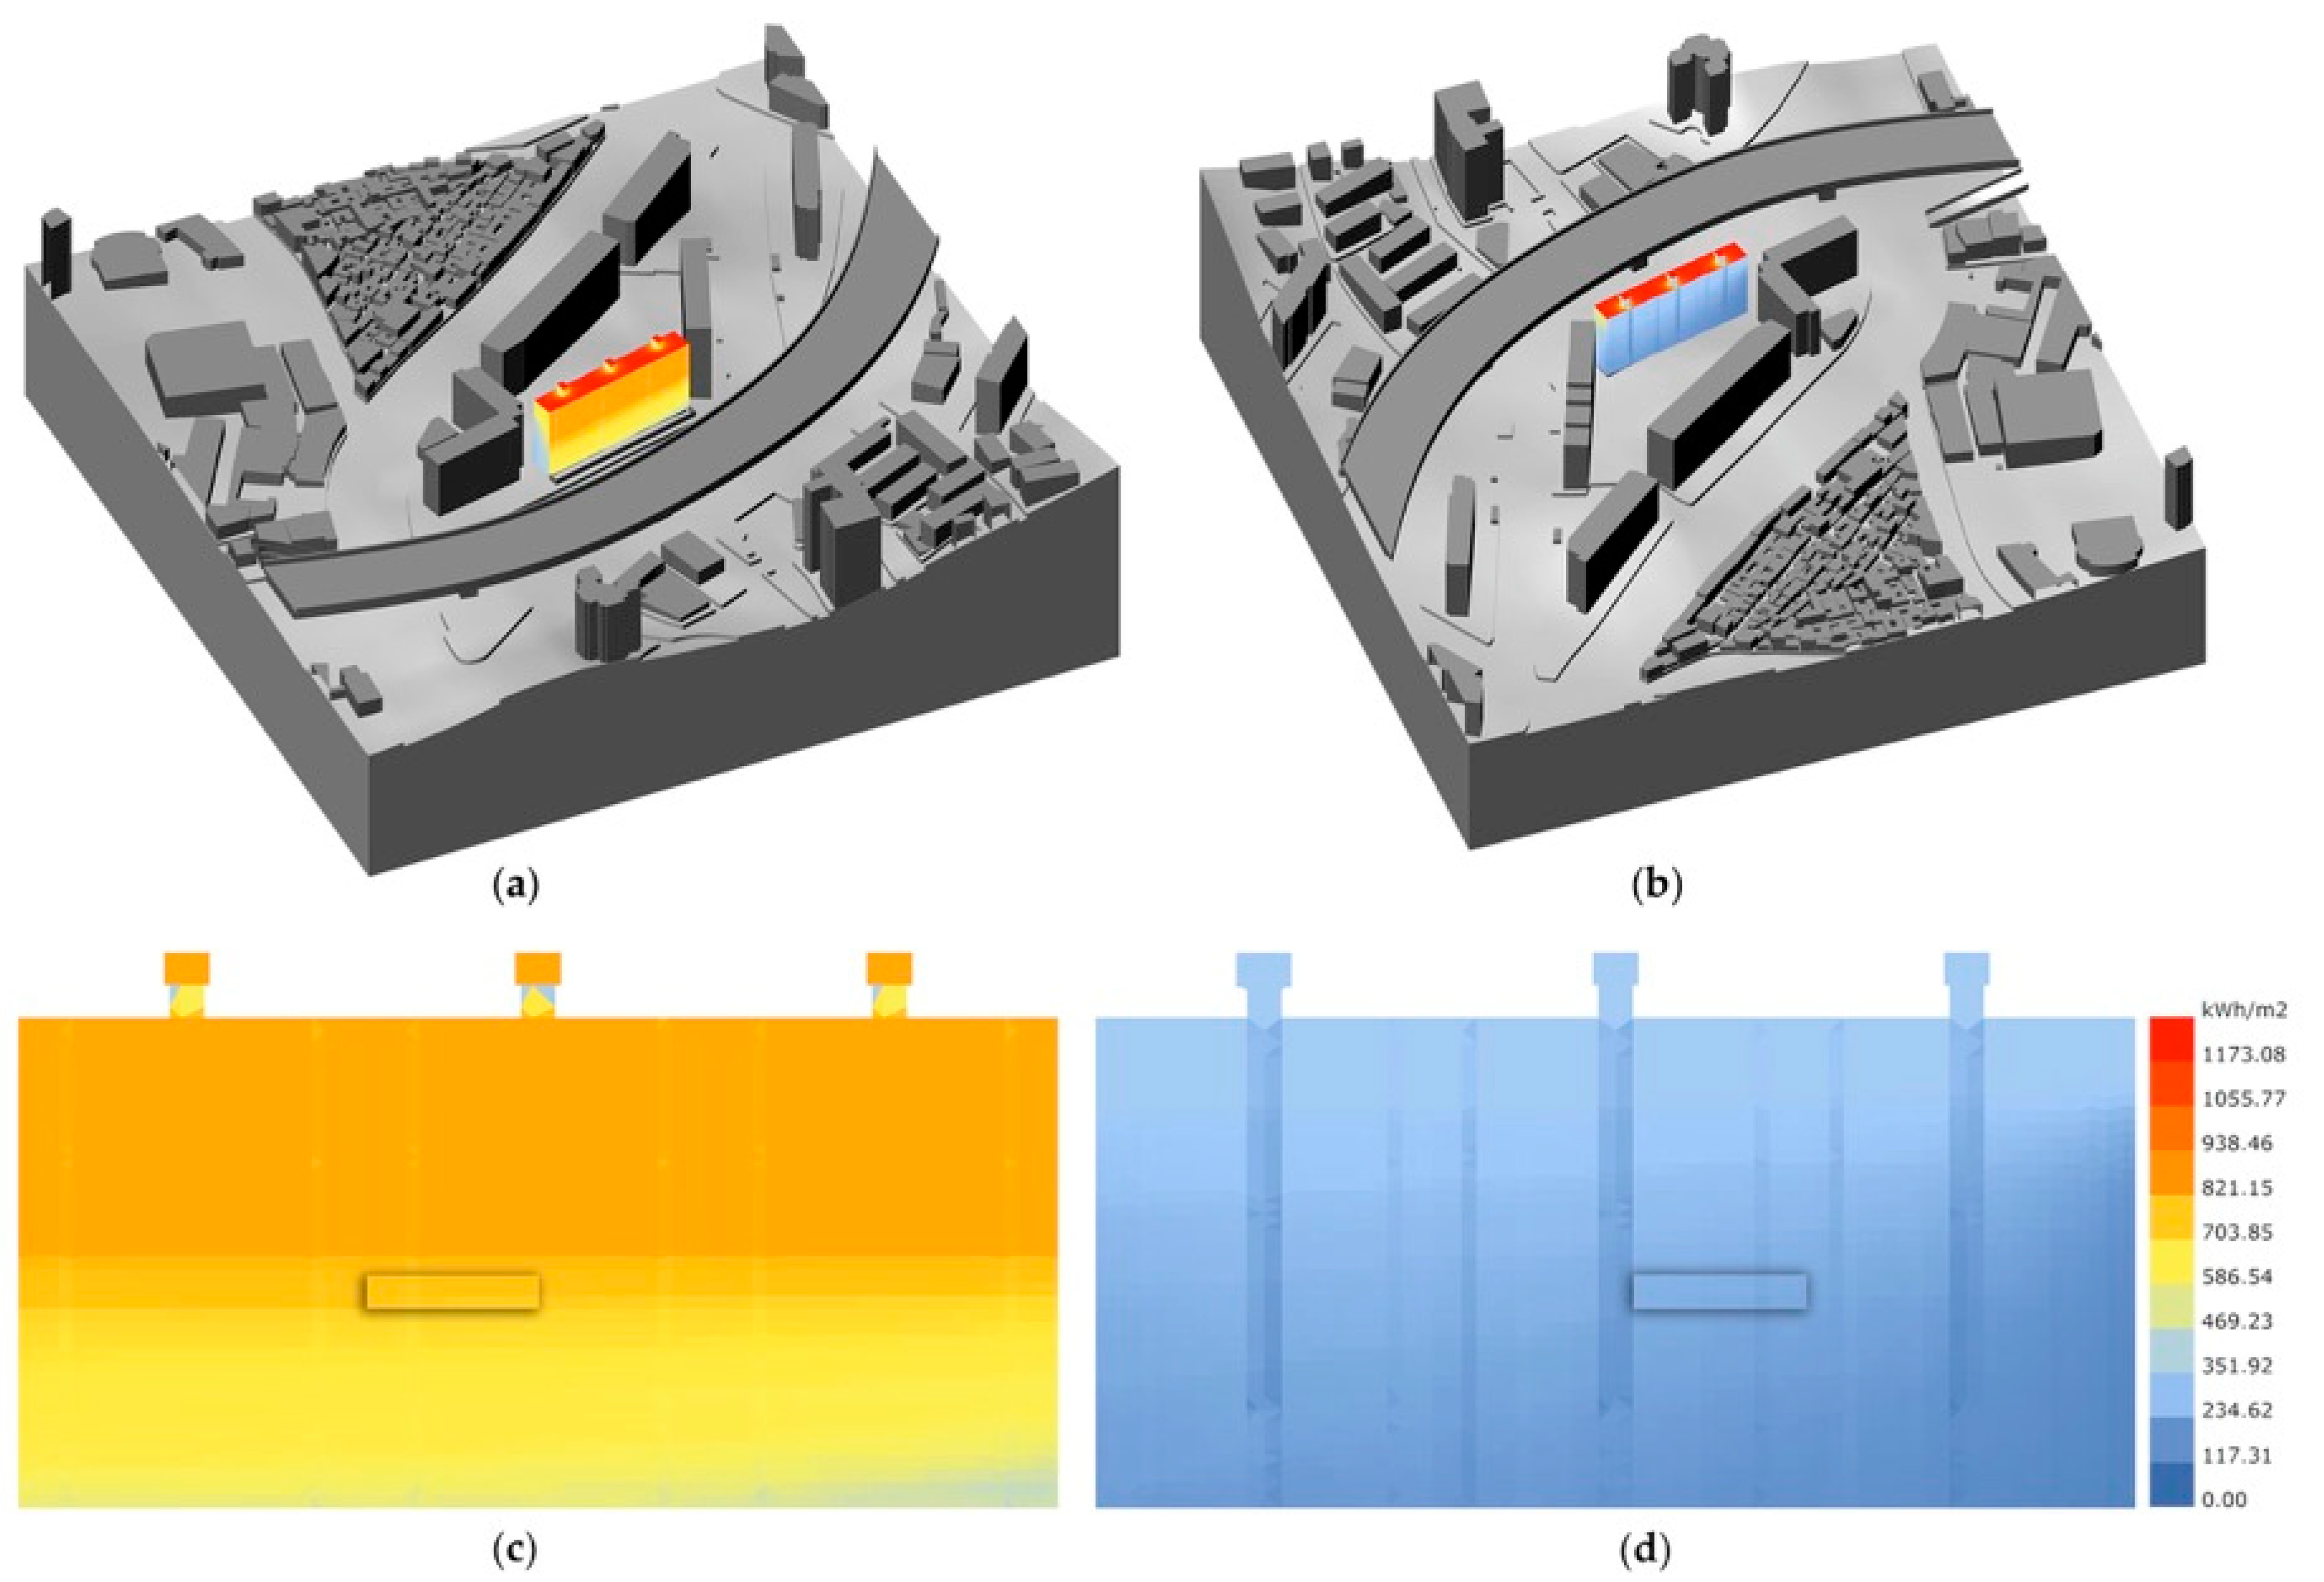
- Climate and solar radiation analysis of the building: apartment building geometries are exported from the virtual Revit model to Rhinoceros for simulation of the annual global solar incident radiation on the building envelope using Ladybug. For the purpose, the building envelope model is subdivided into single partitions measuring a maximum 100 cm × 100 cm. The solar radiation analysis allows the selection of a reference apartment unit in the building for the energy, daylight, and comfort simulations. The reference apartment unit is selected according to the average solar radiation received during a whole year, calculated for all units within the building.
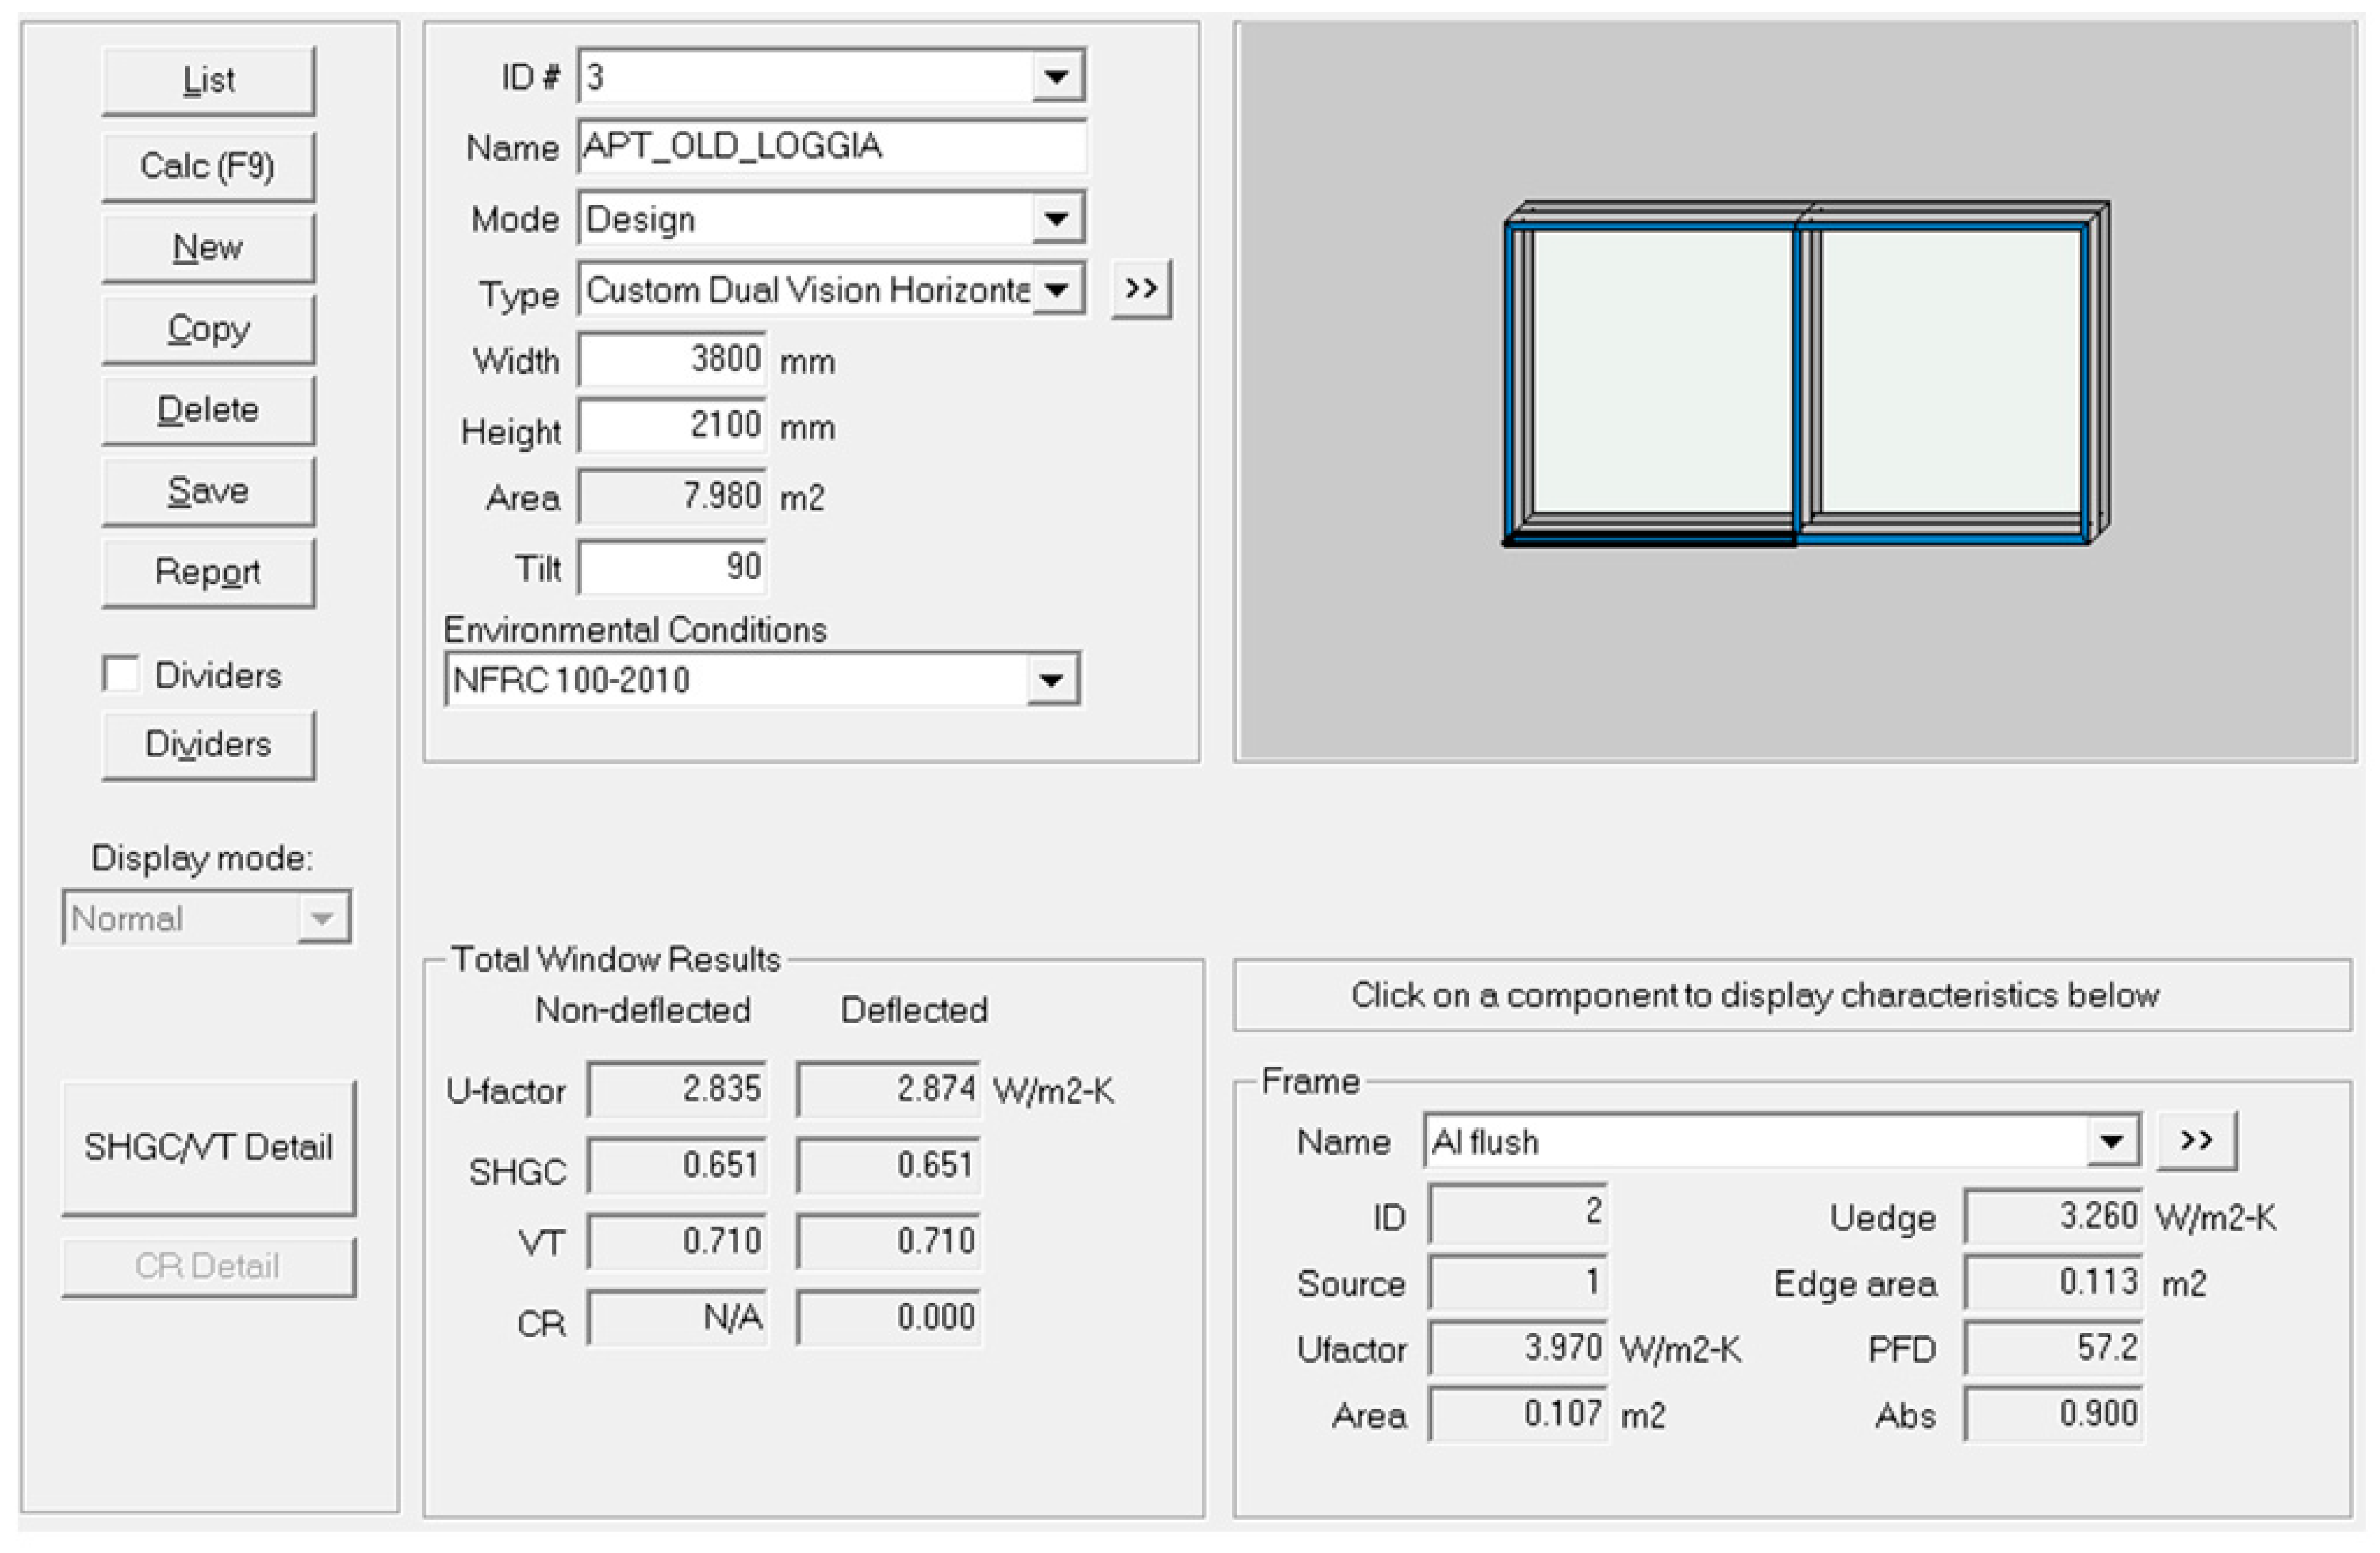
- Building envelope analysis: Through direct survey and a WINDOW simulation of window components installed in the exemplary apartment building, the transmission index of glass panes (g-value) and U-value of the entire glazing system are calculated. Additionally, optical properties of construction components, such as Red/Green/Blue (RGB) reflections, roughness, and specularity, are defined using data on common materials that are available online [63].
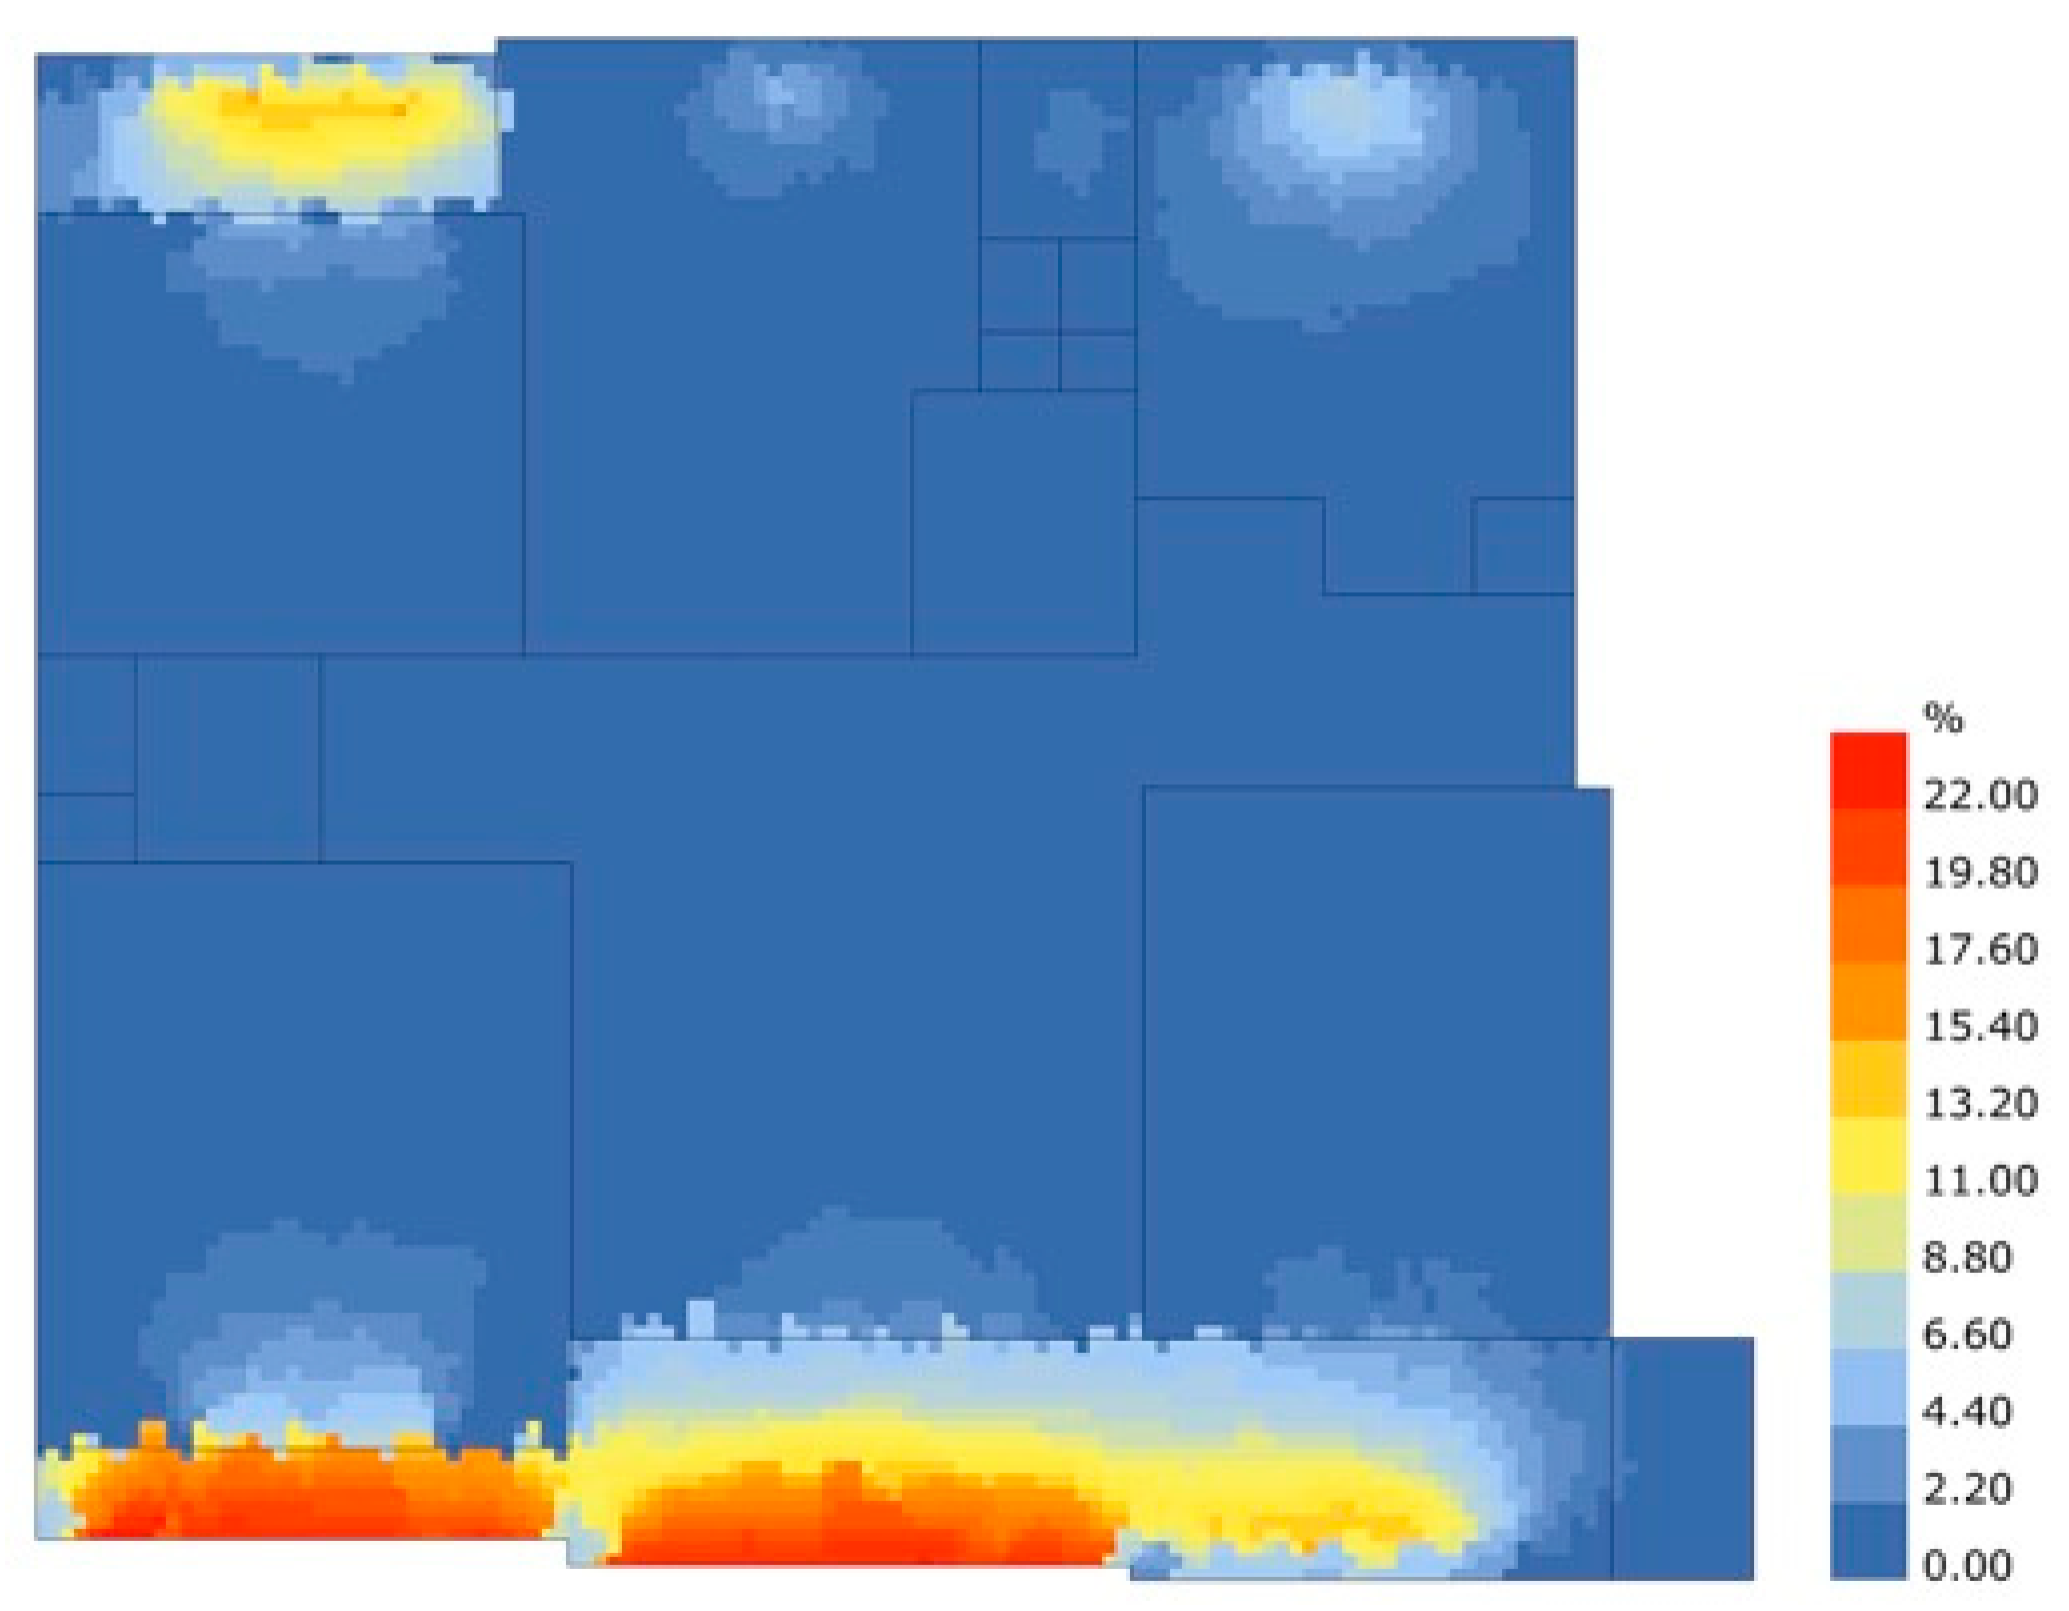
- Visual comfort analysis: A horizontal grid-based (spacing between sensors: 10 cm, grid height: 80 cm) analysis of daylight for the indoor spaces of the reference apartment is executed using Radiance. The following daylight metrics are measured.
- Daylight Factor (DF): Percentage of exterior natural light produced by a diffuse overcast sky received in indoor spaces.
- Daylight Autonomy (DA): Percentage of the time in a year, when the minimum illuminance threshold of 300 lux is exceeded in indoor spaces.
- Useful Daylight Illuminance (UDI): Percentage of the time in a year when illuminance values measured in indoor spaces range between the minimum threshold of 300 lux and the maximum threshold of 700 lux. The maximum threshold has been defined taking into account the function of the different spaces in residential buildings and the requirements for sensible user groups (the elderly, children, and so forth).
- Development of improvement strategies: Partially based on the results of the daylight simulation and the visual comfort analysis, an enhanced building envelope is developed. Additionally, the results and observations of Energyplus simulations and thermal comfort analysis of the existing apartment also affect the design of the enhanced building envelope system. The enhanced building envelope system consists in modular panels that can be attached to the existing apartment construction. The modular envelope panel construction includes improved insulation, as well as window components and WWR, a shading system, and Building Integrated Photovoltaics (PV) panels. The enhanced building envelope provides lower building envelope U-values and increased window g-values; a shading system composed by variably oriented blinds and the production of renewable electricity through the BIPV panels. Accordingly, the improved transmission index (g-value) and thermal properties of new windows modules included in the enhanced building envelope panels are calculated with the software WINDOW. Optical properties of the new window components, such as RBG reflectance, roughness, and specularity of the frame, are further determined according to the relative material properties in the online databases. Additionally, an improved apartment layout is developed to provide better daylight access for indoor spaces, and extend the usable floor space of the renovated apartment.
- Quantification of improvements: The daylight simulation and the visual comfort analysis metrics defined in phase 4 are executed using construction data from the enhanced building envelope. Results from the simulation of the renovated apartment unit are compared with the data from the simulation of the existing condition to quantify improvements in terms of daylight and visual and thermal comfort.
- Virtual building renovation construction using BIM: Modular panel families are parametrically defined in Rhinoceros according to the new geometrical, thermal, and optical properties calculated for the enhanced building envelope system. Accordingly, panel geometries are exported to Revit, and the virtual BIM building module of the existing apartment building is integrated with the modular enhanced envelope system. The result is a detailed model of the renovated apartment building, including modular panel families that can be used in other BIM projects.
- Quantification of renewable energy production: A parametric simulation is executed for the calculation of renewable electricity produced by the BIPV-panels. Parameters, such as the efficiency of BIPV-panels, soiling, snow coverage, shading, and electricity transformation losses, are calculated for new panels, and after lifetimes of 10 and 20 years.
3. Results
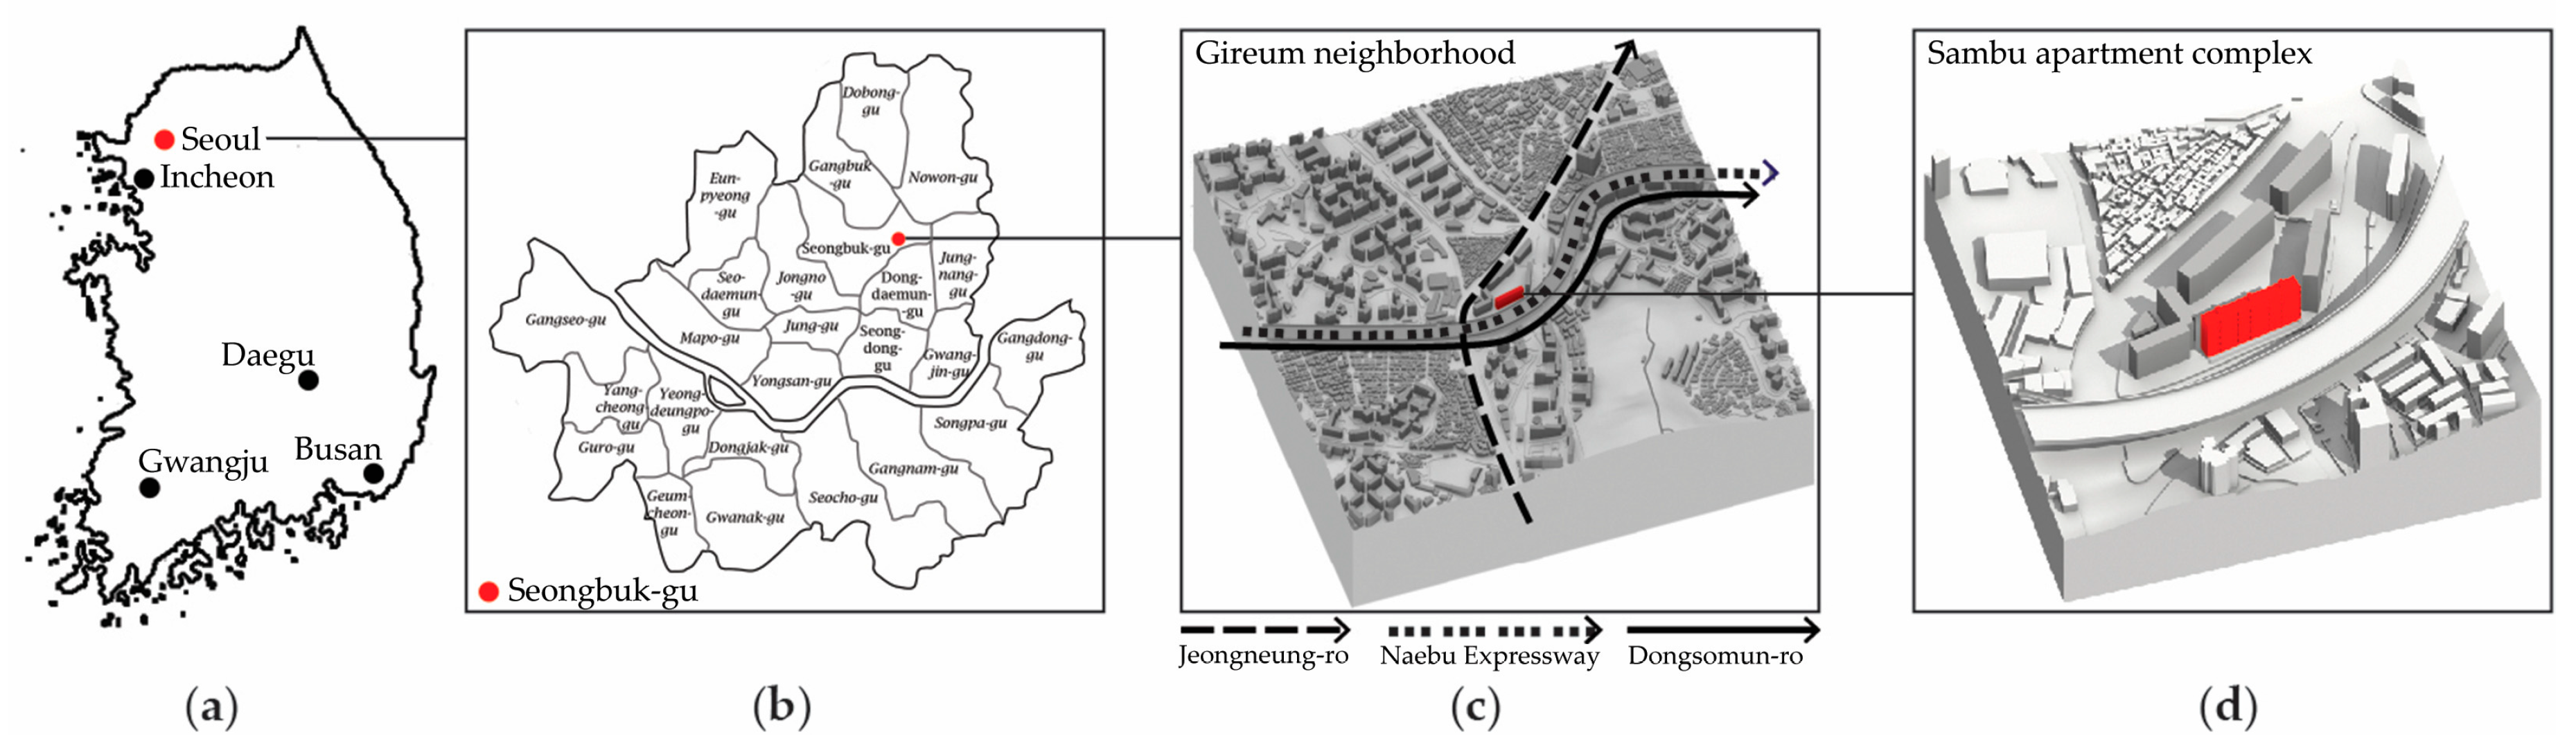
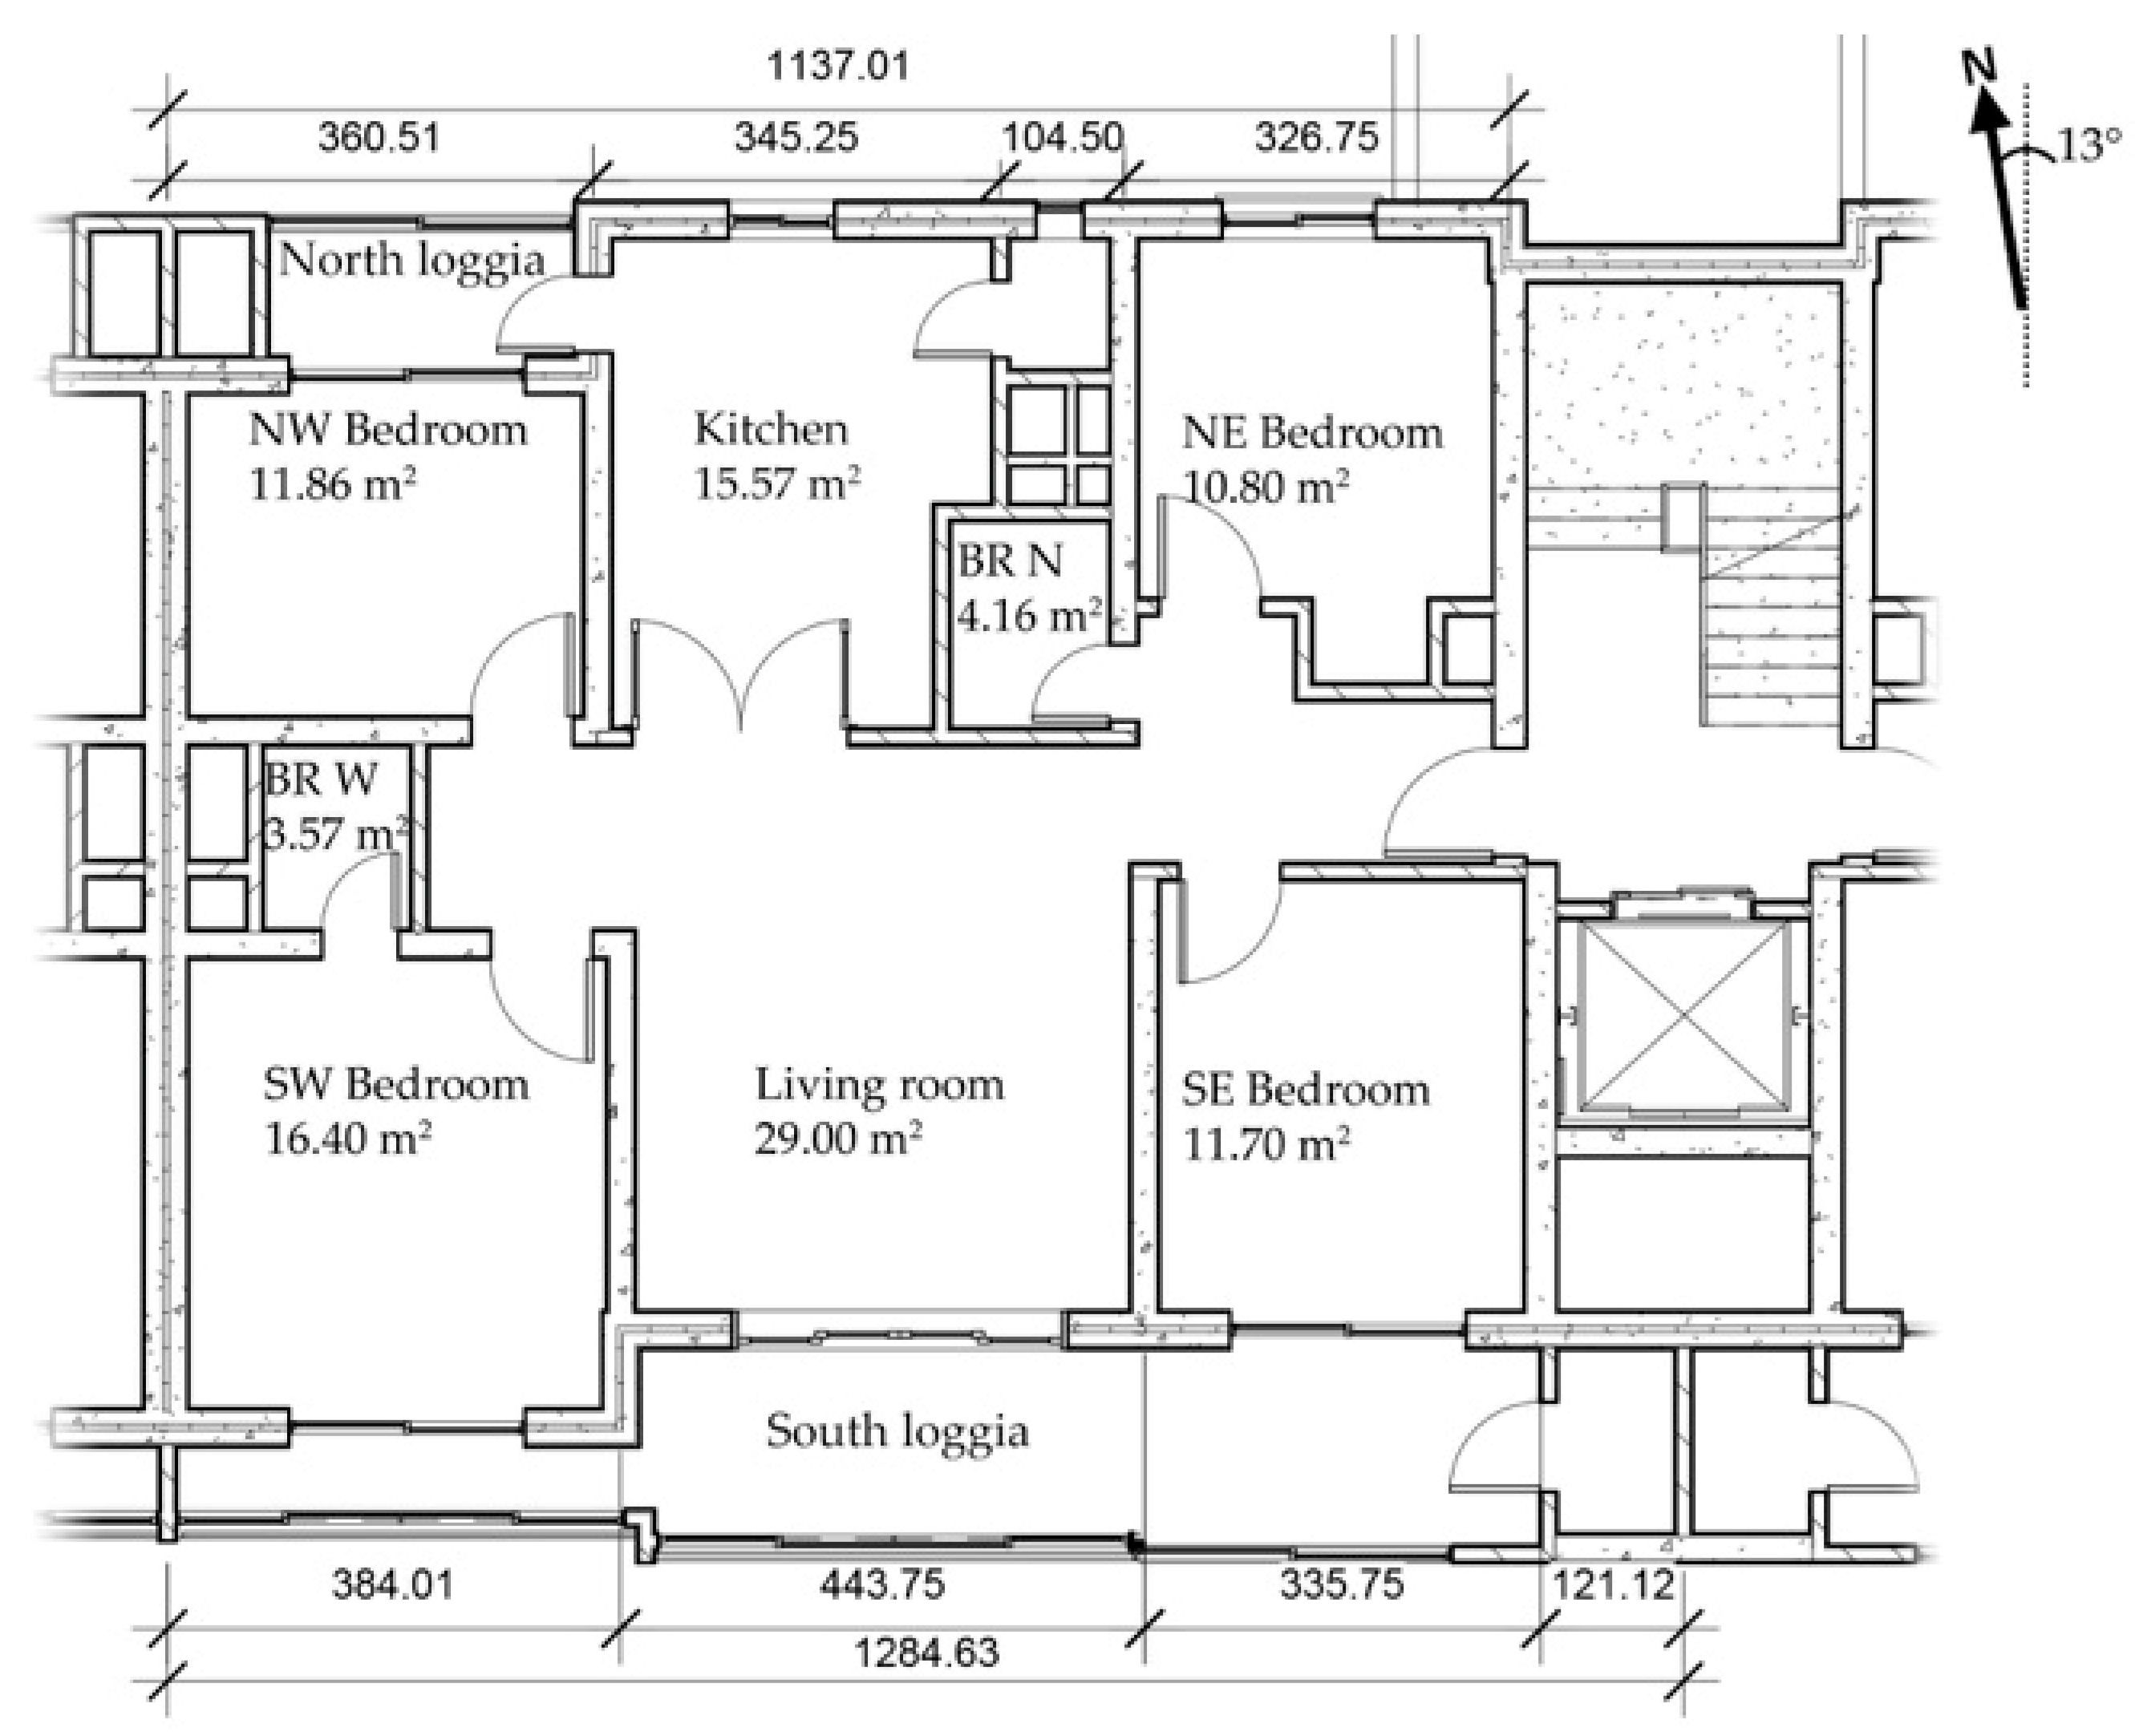
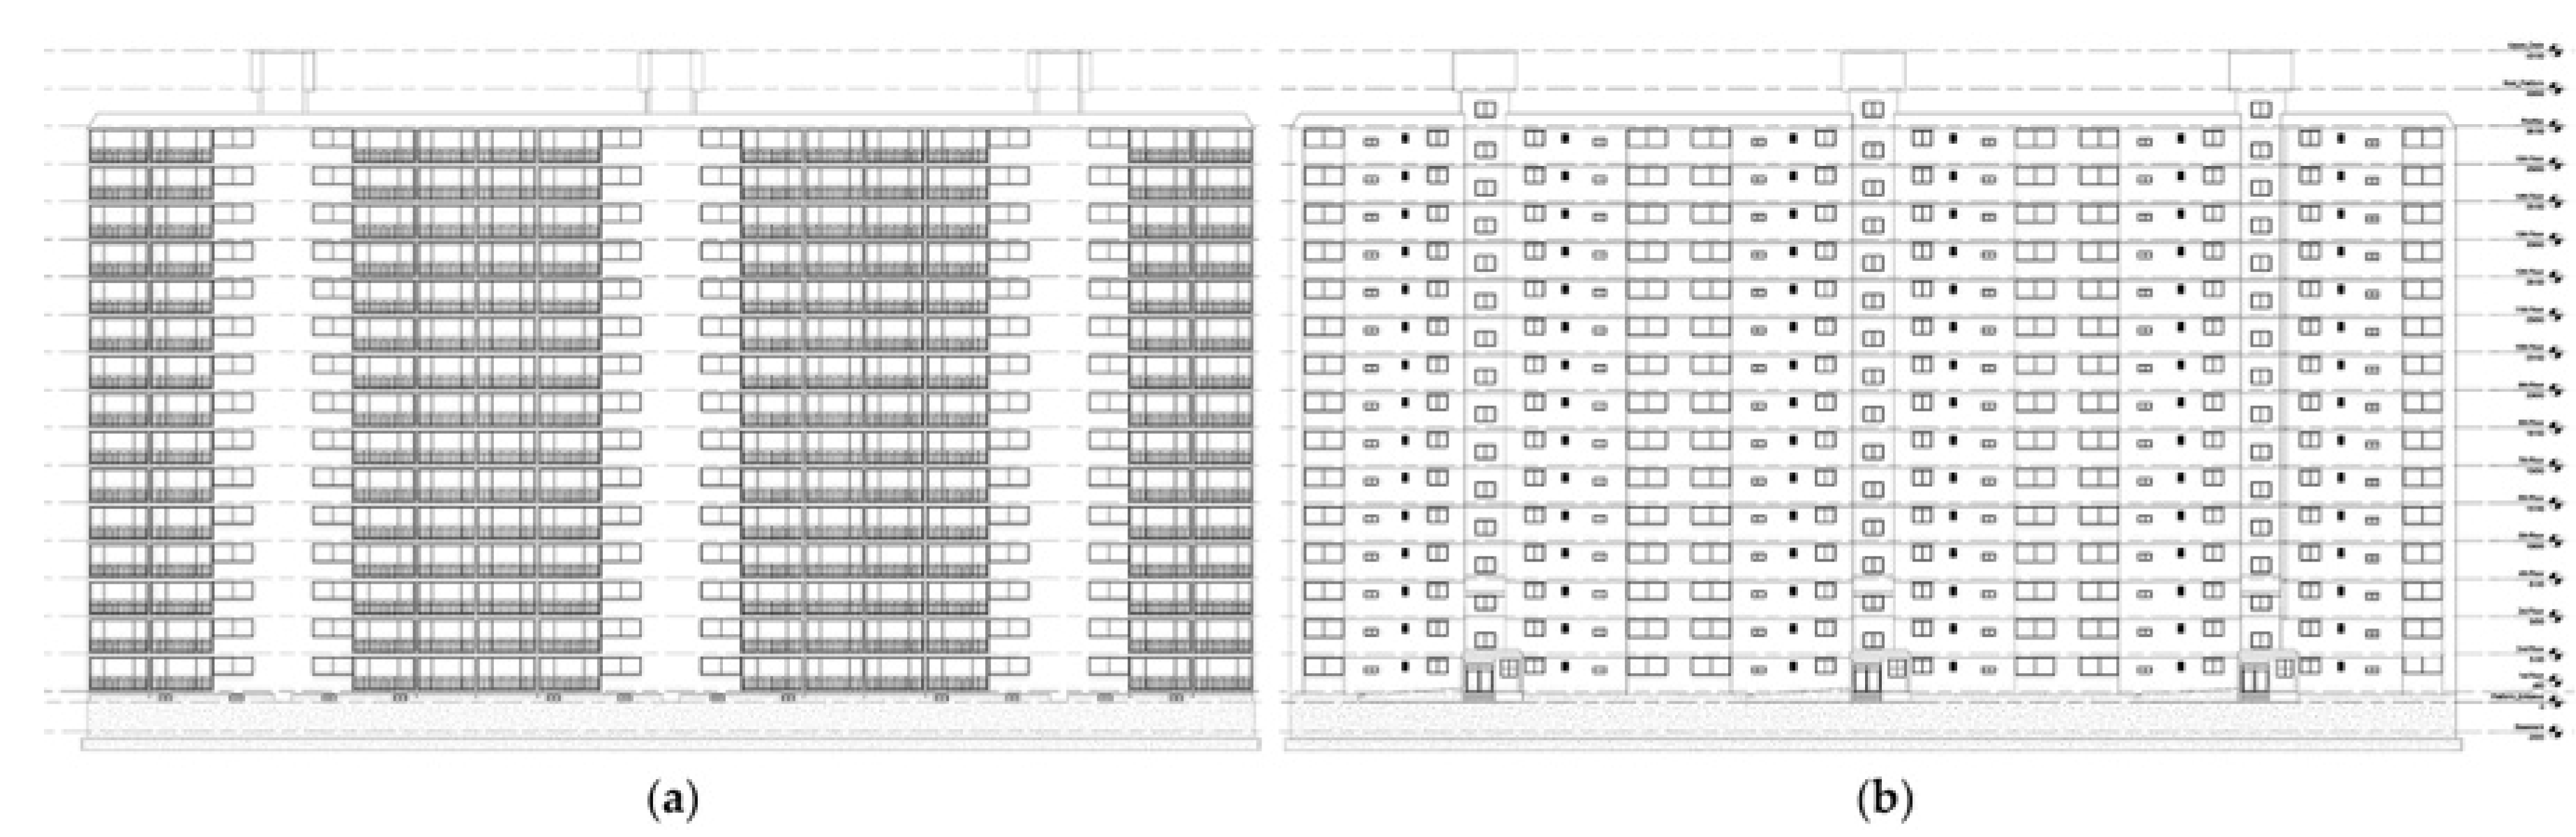
3.1. Description and Virtual BIM Reconstruction of the Exisiting Exemplary Apartment
3.2. Simulation of the Thermal and Optical Properties of Window Components in the Exisiting Building
3.3. Global Radiation Analysis of the Building Envelope and Selection of Reference Apartment Unit for Daylight Simulations
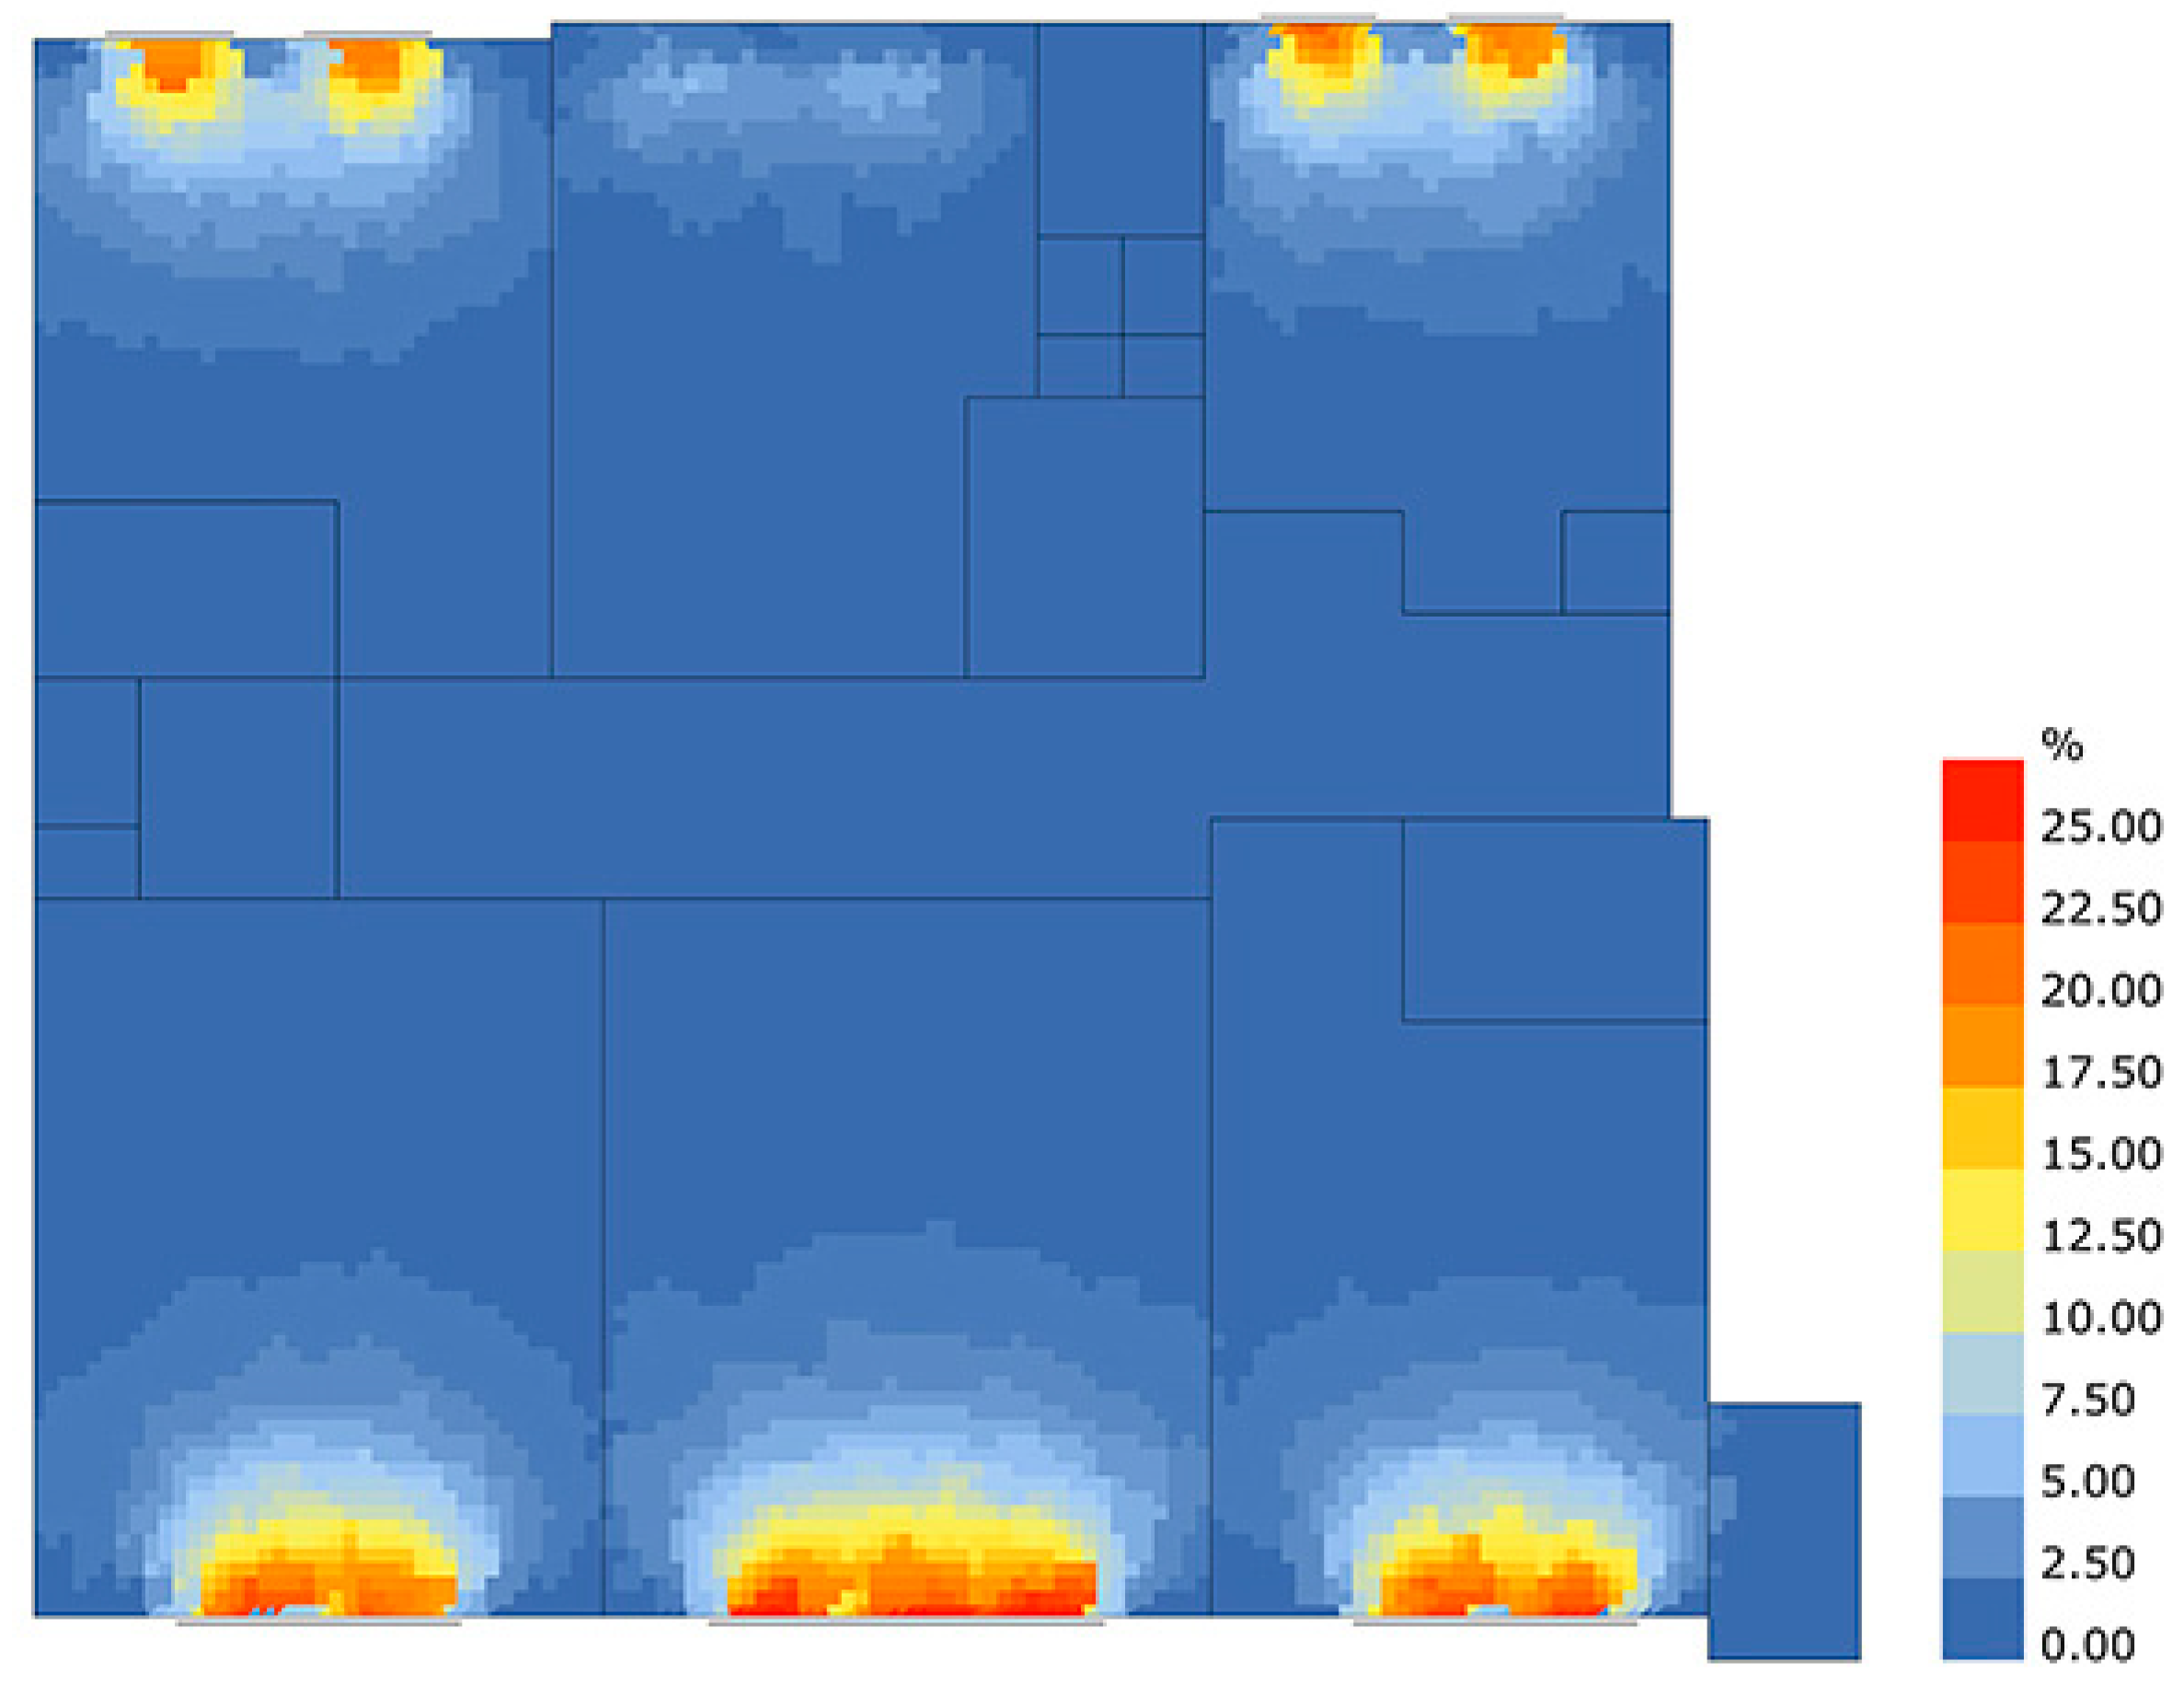
3.4. Daylight Simulation of the Existing Reference Apartment
- Double windows with comparable low g-values contribute to a constant reduction of the incoming solar radiation. The windows reduce the amount of daylight penetrating into the indoors and produce lower visual comfort due to the resulting reduced Daylight Factor. Enclosed deck spaces have a DF of 22%, while indoor zones have an average DF of 1.25%.
- The enclosed decks are nonconditioned buffer zones with higher amounts of daylight than the conditioned indoors. The DA is 99% for the enclosed deck and 12% for indoor spaces.
- The WWR is 72% for the south-oriented façade and 15%. As a result, the north-oriented rooms have a lower DA of 12% compared with the south-oriented rooms, which have a DA of 16%.
3.5. Development of the Enhanced Building Envelope Modular System and Improved Apartment Layout
- -
- An enhanced building envelope modular system that integrates increased insulation with lower U-value than for the existing condition, improved window components with lower U-values and higher g-value, Building Integrated Photovoltaic (BIPV) panels, and an exterior shading system. The definition of the enhanced envelope system has been determined on the base of the results of energy and daylight simulations, and the relative visual and thermal comfort simulations executed through the BIM-parametric renovation framework [62].
- -
- The reconfiguration of the existing apartment layout by expanding the interior rooms in the enclosed decks located both on the north and south, as well as the allocation of new storage areas in the existing central zones of the apartment that present reduced daylight (Figure 10).
- -
- Life cycle analysis (LCA) of common window frame materials: The LCA has been employed to select the optimal window frame system material with the lowest environmental impact. The LCA-based selection of window frame components has been made between unplasticized polyvinyl chloride (PVC-U), wood, and aluminum. For the evaluation of the life cycle environmental impact of the window frame materials selected, the DGNB (German: Deutsche Gesellschaft für nachhaltiges Bauen—German council for sustainable building) criteria ENV1.1 (Ecological footprint/balance) and ENV2.1 (Resources utilization) have been utilized (Table 7) [76,77]. Energy and resource utilization data for the different window frame materials have been extracted from the wecobis.de [78] and oekobau.dat [79] databases of the German Ministry for the Interiors, Land and Housing. On the basis of the LCA-based analysis, a wood window frame has been selected for the enhanced building envelope system as the material with the lowest environmental impact.
- -
- Life cycle analysis of current available technologies in South Korea: For the construction of the enhanced building envelope system, a locally produced window system has been selected to reduce the impact of transportation costs and emissions on the life cycle balance of the renovation project. Accordingly, the current window components available on the Korean market have been analyzed. The analysis resulted in the selection of a clear glass double-glazed and wood frame window system for the construction of the enhanced building envelope system modules. To evaluate the thermal performance of the window system selected, a WINDOW simulation for the different windows components installed in the enhanced building envelope modules of the renovated apartment has been conducted. Table 8 presents an overview of the window components installed for each room of the apartment, and their relative U-values and g-value.
- -
- Maximization of solar gains: To improve daylight access and solar gains through the window glass panes, a higher g-value has been defined for the double clear glass window system installed in the enhanced building envelope modules. The g-value of 0.80 has been defined according to data retrieved from the glazing system database of the software WINDOW. As the WWR of the building façades has been slightly increased for the north-oriented façade and substantially decreased for the south-oriented façade, a g-value of 0.8 could be maintained during the entire operative life of the enhanced building envelope panels. The possibility of constantly maintaining the visual performance of the window glass surfaces by preserving the same g-value during the operative life of the components is allowed by the improved access and operation of windows for maintenance purposes defined by comparably smaller cleaning surfaces, the removal of double window systems in the enclosed decks, and protection from soiling provided by the shading system.
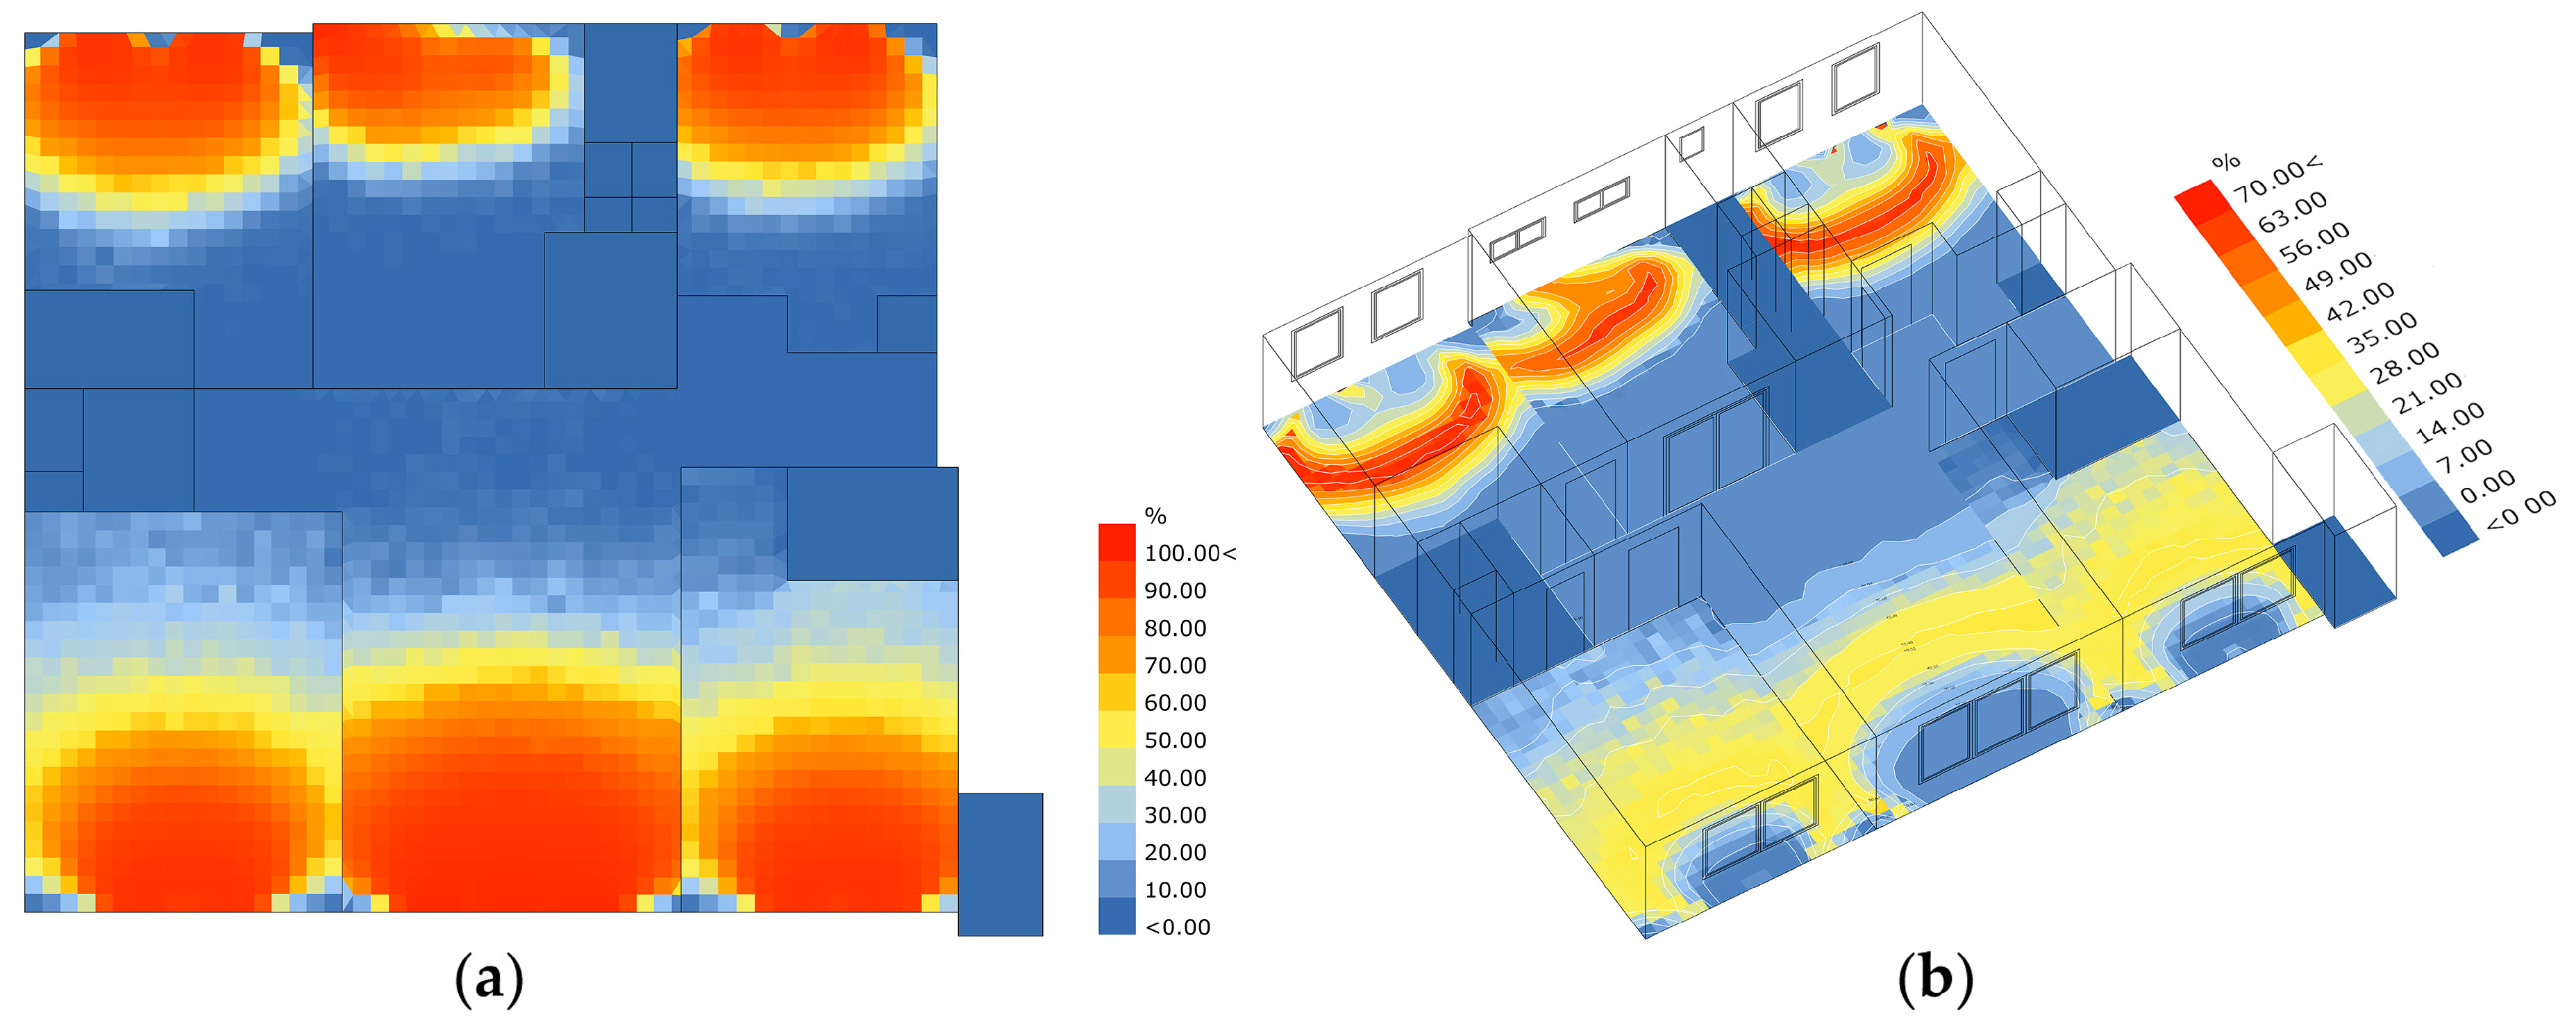
3.6. Daylight Simulation of the Renovated Reference Apartment Unit
- Luminosity levels are increased, compared with the existing apartment unit, due to the removal of enclosed decks. The increase of illuminance in certain areas of the apartment can be regarded as more comfortable than the reduced daylight in the indoors of the apartment unit before renovation. Shading systems can be operated to reduce the amount of light penetrating into the apartment.
- The introduction of shading systems causes a substantial reduction of excessive daylight levels in the south-oriented spaces. However, shading of daylight in the immediate vicinity of the outdoors from the indoors provides zones located more distantly from windows with reduced daylight. Accordingly, the available daylight autonomy for interior apartment unit zones is lower.
4. Discussion
5. Conclusions
Author Contributions
Funding
Acknowledgments
Conflicts of Interest
References
- Kim, K.-H.; Park, M. Housing Policy in the Republic of Korea Institute; Asian Development Bank Institute, Ed.; Asian Development Bank Institute: Tokyo, Japan, 2016; Volume 570. [Google Scholar]
- Ha, S.-K. Housing poverty and the role of urban governance in Korea. Environ. Urban. 2004, 16, 139–154. [Google Scholar] [CrossRef]
- Chung, I.-U. The Current Status of Old Apartments and the Remodeling Policies in Korea; LandHousing Corporation: Singapore, 2014. [Google Scholar]
- Lee, J.-W. Economic growth and human development in the Republic of Korea, 1945–1992. Reconstruction 2007, 1945, 61. [Google Scholar]
- Koh, C. Overview of Housing Policies Programs in Korea; Korea Housing Institute: Seoul, Korea, 2004. [Google Scholar]
- Choi, J. The traditional characteristics reflected in the plan of modern apartment houses in Korea. J. Archit. Plan. Res. 1999, 16, 65–77. [Google Scholar]
- Choi, K.-J.; Jihn, J. A Study on the Change of the Apartment Unit Plan in National Housing—Focused on Institutional and Social Changes. J. Korean Hous. Assoc. 2015, 26, 123–131. [Google Scholar] [CrossRef]
- Lee, K.-H.; Park, G.-S.; Chae, C.-U. A Study on the Repair Time of the Construction Type in the Apartment Housings. J. Korean Hous. Assoc. 2011, 22, 83–92. [Google Scholar] [CrossRef]
- Bak, C.C.; Son, C.B.; Shik, H.S. Study on the Analysis of Construction Period and Material Amount of Apartment; Architectural Institute of Korea: Seoul, Korea, 1990; pp. 498–501. [Google Scholar]
- Hong, J.-H.; Katano, H.; Inoue, T. A Study on the Process and the Background of High Rise and High Density of Apartment Houses in Korea. J. Archit. Plan. 2007, 72, 1–8. [Google Scholar] [CrossRef]
- Kim, S.A. Policy and Technology of Housing Remodeling in Korea; Korea Institute of Construction Technology: Ilsan, Korea, 2003. [Google Scholar]
- Yoo, H. The Sustainable Remodeling Policies in South Korea. In Proceedings of the Architecture and Civil Engineering Conference, Singapore, 13–14 April 2015; pp. 155–158. [Google Scholar] [CrossRef]
- KOSTAT. Complete Enumeration Results of the 2016 Population and Housing Census. In Statistics Korea (KOSTAT); Ministry of Strategy and Finance: Sejong, Korea, 2016. [Google Scholar]
- Kim, Y.-I.; Song, S.-Y. Energy Consumption status of Apartment Buildings and Influence of Various Factors on Energy Consumption. J. Korean Sol. Energy Soc. 2014, 34, 93–102. [Google Scholar] [CrossRef] [Green Version]
- Choi, I.Y.; Cho, S.H.; Kim, J.T. Energy consumption characteristics of high-rise apartment buildings according to building shape and mixed-use development. Energy Build. 2012, 46, 123–131. [Google Scholar] [CrossRef]
- Choi, D.-S.; Lee, M.-E. Condensation Prevention Performance Assessment Taking Into Account Thermal Insulation Performance Degradation Due to Aging for Apartment Housing. KIEAE J. 2015, 15, 11–18. [Google Scholar] [CrossRef] [Green Version]
- Lee, Y.J.; Kim, J.W.; Song, D.S. Analysis of Heating and Cooling Load Profile According to the Window Retrofit in an Old School Building. Korean J. Air-Cond. Refrig. Eng. 2017, 29, 455–462. [Google Scholar]
- Moon, K.H.; Ahn, H.T.; Kim, J.T. Evaluation Methodology of View Right Using Graphic Programs. Korea Inst. Ecol. Archit. Environ. J. 2007, 7, 9–15. [Google Scholar]
- Mainini, A.G.; Bonato, D.; Poli, T.; Speroni, A. Lean strategies for window retrofit of Italian office buildings: Impact on energy use, thermal and visual comfort. Energy Procedia 2015, 70, 719–728. [Google Scholar] [CrossRef]
- Rice, E.O. Daylight in Façade Renewal: Using New Metrics to Inform the Retrofitting of Aging Modern-Ear Façade Types. Ph.D. Thesis, Massachusetts Institute of Technology, Cambridge, MA, USA, 2006. [Google Scholar]
- Seo, J.-K. Housing Policy and Urban Sustainable Development: Evaluating the Process of High-rise Apartment Development in Korea. Urban Policy Res. 2016, 34, 330–342. [Google Scholar] [CrossRef]
- Ha, S.-K. Substandard settlements and joint redevelopment projects in Seoul. Habitat Int. 2001, 25, 385–397. [Google Scholar] [CrossRef]
- Lee, B.S.; Chung, E.-C.; Kim, Y.H. Dwelling Age, Redevelopment, and Housing Prices: The Case of Apartment Complexes in Seoul. J. Real Estate Financ. Econ. 2005, 30, 55–80. [Google Scholar] [CrossRef]
- Kim, J.; Brand, M.; Lee, H.-S.; Park, M.-S. The Role of Construction Companies in the Reconstruction Process of Apartment Buildings in Korea. In Proceedings of the Ninetheen Annaul Pacific-Rim Real Estate Society Conference, Melbourbe, Australia, 13–16 January 2013; p. 11. [Google Scholar]
- Tae, S.; Shin, S.; Woo, J.; Roh, S. The development of apartment house life cycle CO2 simple assessment system using standard apartment houses of South Korea. Renew. Sustain. Energy Rev. 2011, 15, 1454–1467. [Google Scholar] [CrossRef]
- Jeong, Y.-S.; Lee, S.-E.; Huh, J.-H. Estimation of CO2 emission of apartment buildings due to major construction materials in the Republic of Korea. Energy Build. 2012, 49, 437–442. [Google Scholar] [CrossRef]
- Kim, K. Housing Redevelopment and Neighborhood Change as A Gentrification Process in Seoul, Korea: A Case Study of the Wolgok-4 Dong Redevelopment District; Florida State University: Tallahassee, FL, USA, 2006. [Google Scholar]
- Kim, D.; Ryu, J.; Cha, J.G.; Jung, E.H. Korea’s urban regeneration project on the improvement of urban micro climate: A focal study on the case of Changwon City. Glob. J. Hum. Sci. Geogr. Geo-Sci. Environ. 2013, 13, 26–37. [Google Scholar]
- A.A.V.V. The Current Situation of Improved Regulation and Remodeling System; MOLIT—Housing Redevelopment Division: Seoul, Korea, 2014. [Google Scholar]
- Jones, R.S.; Yoo, B. Achieving the "Low Carbon, Green Growth" Vision in Korea; OECD: Paris, France, 2012. [Google Scholar]
- Lee, M.-K.; Kim, Y.-S.; Kang, S.-J.; Ryu, J.-C.; Kim, W.-D.; Han, K.-J.; Balmes, C.; Lee, Y.-H.; Kim, S.-J. Korea’s Green Growth Experience: Process, Outcomes and Lessons Learned; Global Green Growth Institute: Seoul, Korea, 2015. [Google Scholar]
- Yoon, Y.S. Zero Energy Buildings in Korea—Korea Energy Policies for Sustainable Building. In Zero Energy Building Workshop; Fraunhofer Representative Office Korea, Energy Dream Center: Seoul, Korea, 2012; Volume 1. [Google Scholar]
- Sun-Ho, C.; Jae-Sik, K.; Gyeong-Seok, C. Energy Performance Evaluation of External Insulation System for Post Remodeling in Apartment Buildings. In Proceedings of the SAREK 2016 Summer Annual Conference, Seoul, Korea, 5–7 July 2016; pp. 176–178. [Google Scholar]
- No, Sang Tae. A Case Study on Seasonal Building Thermal Load Analysis According to Apartment Balcony Extension Using Building Energy Simulation Tools. J. Korean Inst. Archit. Sustain. Environ. Build. Syst. 2012, 6, 32–37. [Google Scholar]
- Jang, H. Modelling of Existing High-Rise Apartment Buildings for Energy-Efficient Refurbishment in South Korea; University of Sheffield: Sheffield, UK, 2016. [Google Scholar]
- Seong, B.; Kim, M.; Won, P. A Study on Residential Satisfaction with Diversion of Expanded Balcony Area at Multi-family Housing through Residents’ Survey. J. Archit. Inst. Korea Plan. Des. 2011, 27, 317–324. [Google Scholar]
- Lee, Y.; Choi, J.; Kang, H.; Byun, N. Schematic Development on the Extension Remodeling Types of Apartment Building Stocks. In Proceedings of the APNHR 2007 Conference—Transformations in Housing, Urban Life, and Public Policy, Seoul, Korea, 30 August–1 September 2007. [Google Scholar]
- Wang, J.-J.; Kim, J.-H.; Lee, K.-S.; Park, I.-S. G-SEED: The Revised Korean Green Building Certification System. In Proceedings of the 3th International PLEA Conference 2014—Sustainable Habitat for Deveolping Societies Ahmedabad, CEPT University, Ahmedabad, India, 16–18 December 2014; p. 6. [Google Scholar]
- Kim, D.I.; Lee, S.H.; Choi, D.H.; Kim, G.H.; Jung, J.N. The Direction of Improvement for G-SEED in Korea, Considering Environmental Performance. J. Asian Archit. Build. Eng. 2015, 14, 483–490. [Google Scholar] [CrossRef] [Green Version]
- Lee, N.-E.; Ahn, B.-L.; Jeong, H.-G.; Jang, C.-Y. Optimum Method of Windows Remodeling of Existing Residential according to the Window Properties and Window Wall Ratio. Korea Inst. Ecol. Archit. Environ. 2013, 13, 71–78. [Google Scholar]
- Kim, J.M.; Lee, G.C.; Lee, S.G.; Kim, M.S.; Min, J.K. An Effect of the Change of Orientation and Window Area Ratio upon Building Energy Requirement in Apartment Housings. Korea Inst. Ecol. Archit. Environ. J. 2013, 13, 21–26. [Google Scholar]
- Kim, G.; Kim, J.T. Healthy-daylighting design for the living environment in apartments in Korea. Build. Environ. 2010, 45, 287–294. [Google Scholar] [CrossRef] [Green Version]
- Lee, J.-B. A study on the daylight condition of the apartment houses—Focused on the comparative analysis of the daylight condition between the plank type and tower type apartment complex. J. Korea Acad. Ind. Coop. Soc. 2007, 8, 121–129. [Google Scholar]
- Lim, T.S.; Lim, J.H.; Kim, B.S. Space study on Lighting Performance For Residential Buildings By using Simulation Analysis. Korea Inst. Ecol. Archit. Environ. J. 2013, 13, 97–104. [Google Scholar]
- Lim, T.S.; Lim, H.S.; Koo, J.-O.; Kim, G. Assessment of the Daylighting Performance in Residential Building Units of South Korea through RADIANCE simulation. Korea Inst. Ecol. Archit. Environ. J. 2012, 12, 25–32. [Google Scholar] [Green Version]
- Kim, H.-J.; Kim, J.-S. Design Methodology for Street-Oriented Block Housing Considering Daylight and Natural Ventilation. Sustainability 2018, 10, 3154. [Google Scholar] [CrossRef]
- Salim, F.D.; Burry, J. Software Openness: Evaluating Parameters of Parametric Modeling Tools to Support Creativity and Multidisciplinary Design Integration. In Proceedings of the International Conference on Computational Science and Its Applications, Fukuoka, Japan, 23–26 March 2010; pp. 483–497. [Google Scholar]
- Rosen, S.L. Using BIM in HVAC design. Ashrae J. 2010, 52, 24–32. [Google Scholar]
- Lee, K.S.; Han, K.J.; Lee, J.W. Feasibility Study on Parametric Optimization of Daylighting in Building Shading Design. Sustainability 2016, 8, 1220. [Google Scholar] [CrossRef]
- Reinhart, C.F.; Herkel, S. The simulation of annual daylight illuminance distributions—A state-of-the-art comparison of six RADIANCE-based methods. Energy Build. 2000, 32, 167–187. [Google Scholar] [CrossRef]
- Kaewunruen, S.; Rungskunroch, P.; Welsh, J. A Digital-Twin Evaluation of Net Zero Energy Building for Existing Buildings. Sustainability 2018, 11, 159. [Google Scholar] [CrossRef]
- Khemlani, L. Autodesk Revit: Implementation in Practice; White Paper; Autodesk: San Rafael, CA, USA, 2004. [Google Scholar]
- Davidson, S. Grasshopper-Algorithmic Modeling for Rhino; Lynnwood: Lynnwood, DC, USA, 2013. [Google Scholar]
- Mostapha, S.R.; Pak, M. Ladybug: A parametric Environmental Plugin for Grasshopper to Help Designers Create an Environmentally Conscious Design. In Proceedings of the 13th International IBPSA Conference, Lyon, France, 25–30 August 2013. [Google Scholar]
- McNeel, R. Grasshopper Generative Modeling for Rhino. Computer Software. 2010. Available online: http://www.grasshopper3d.com (accessed on 28 December 2018).
- Larson, G.W.; Shakespeare, R. Rendering With Radiance: The Art and Science Of Lighting Visualization; Booksurge LLC.: Charleston, SC, USA, 2004. [Google Scholar]
- Finlayson, E.; Mitchell, R.; Arasteh, D.; Huizenga, C.; Curcija, D. THERM 2.0: Program Description. A PC Program for Analyzing the Two-Dimensional Heat Transfer through Building Products; LBL-37371 Rev.; Lawrence Berkeley National Laboratory: Berkeley, CA, USA, 1998; p. 2. [Google Scholar]
- LBNL. Window 7beta: PC Program for Analyzing Window Thermal Per-Formance; LBNL: Berkeley, CA, USA, 2012. [Google Scholar]
- Crawley, D.B.; Lawrie, L.K.; Winkelmann, F.C.; Buhl, W.F.; Huang, Y.J.; Pedersen, C.O.; Strand, R.K.; Liesen, R.J.; Fisher, D.E.; Witte, M.J.; et al. EnergyPlus: Creating a new-generation building energy simulation program. Energy Build. 2001, 33, 319–331. [Google Scholar] [CrossRef]
- Fylstra, D.; Lasdon, L.; Watson, J.; Waren, A. Design and Use of the Microsoft Excel Solver. Interfaces 1998, 28, 29–55. [Google Scholar] [CrossRef]
- Mans, D. Bumblebee. Available online: https://www.grasshopper3d.com/group/bumblebee (accessed on 21 September 2018).
- Amoruso, F.; Dietrich, U.; Schuetze, T. Development of a Building Information Modeling-Parametric Workflow Based Renovation Strategy for an Exemplary Apartment Building in Seoul, Korea. Sustainability 2018, 10, 4494. [Google Scholar] [CrossRef]
- Lighting-Materials. Lighting Materials for Simulation. Available online: http://lighting-materials.com/ (accessed on 20 June 2018).
- Seijn Planning (Ed.) Apartment Encyclopedia (Seoul and Bundang/Ilsan); Seijn Planning: Seoul, Korea, 1998; Volume 1, 259p. [Google Scholar]
- Seijn Planning (Ed.) Apartment Encyclopedia (Seoul and Bundang/Ilsan); Seijn Planning: Seoul, Korea, 1998; Volume 2, 259p. [Google Scholar]
- Kang, B. History of Korean Apartment Housing Projects Community Housing Study Committee: Seoul; Seijn University: Seoul, Korea, 1999. [Google Scholar]
- Il, I.K. A Comparative Study on Apartment Unit Plans of SH Corporation and Private Construction Company in the Housing Development District; Seoul City University: Seoul, Korea, 2013. [Google Scholar]
- Kim, J.; Chun, J.; Lee, B. Study about Change of Insulation Standard in Apartment in Its Effect. J. Archit. Inst. Korea 2009, 11, 125–132. [Google Scholar]
- Tregenza, P.R.; Waters, I.M. Daylight coefficients. Lighting Res. Technol. 1983, 15, 65–71. [Google Scholar] [CrossRef]
- BREEAM. BREEAM International New Construction 2016—Technical Manual SD233 2.0; BRE Global Ltd.: London, UK, 2018. [Google Scholar] [Green Version]
- Breheny, M. Superglass Cavity wall Insulation BRA Technical Approval Certificate; Superglass Insulation Ltd.: Stirling, UK, 2017. [Google Scholar]
- Smile Plastics. Available online: https://smile-plastics.com/ (accessed on 23 July 2018).
- Goia, F. Search for the optimal window-to-wall ratio in office buildings in different European climates and the implications on total energy saving potential. Sol. Energy 2016, 132, 467–492. [Google Scholar] [CrossRef]
- Ghisi, E.; Tinker, J.A. Window Sizes Required for the Energy Efficienc of a Building Against Window Sizes Required for View. In Proceedings of the CIB World Building Congress, Toronto, TOR, Canada, 1–7 May 2004. [Google Scholar]
- Ma, P.; Wang, L.-S.; Guo, N. Maximum window-to-wall ratio of a thermally autonomous building as a function of envelope U-value and ambient temperature amplitude. Appl. Energy 2015, 146, 84–91. [Google Scholar] [CrossRef]
- DGNB. Gebaeude Nachhatlig Sanieren; Deutsche Gesellschaft Fuer Nachhaltiges Bauen: Stuttgart, Germany, 2018. [Google Scholar]
- DGNB. DGNB System—Kriterienkatalog Gebaued Neubau; DGNB: Stuttgart, Germany, 2018. [Google Scholar]
- Wecobis.de. Available online: https://www.wecobis.de/ (accessed on 15 July 2018).
- Oekobaudat.de. Available online: https://www.oekobaudat.de/ (accessed on 20 July 2018).
- Konstantoglou, M. Simulating Complex Window Systems Using BSDF Data. In Proceedings of the 26th Conference on Passive and Low Energy Architecture (PLEA), Quebec City, QC, Canada, 22–24 June 2009. [Google Scholar]


| Window Type | Dimensions (Length × Height in cm) | U-Value (W/m2K) | g-Value |
|---|---|---|---|
| Enclosed deck | 380 × 210 | 3.163 | 0.65 |
| Glass door | 200 × 200 | 3.224 | 0.65 |
| Bedroom Southeast | 250 × 110 | 3.019 | 0.65 |
| Bedroom Northwest | 250 × 110 | 3.019 | 0.72 |
| Bedroom Northeast | 130 × 100 | 3.153 | 0.72 |
| Kitchen | 90 × 50 | 3.432 | 0.72 |
| Component | Red Refl. | Green Refl. | Blue Refl. | Specularity | Roughness |
|---|---|---|---|---|---|
| Outdoor façade | 0.33 | 0.33 | 0.33 | 0.08 | 0.18 |
| Indoor ceiling | 0.15 | 0.15 | 0.15 | 0.14 | 0.06 |
| Indoor floor | 0.08 | 0.08 | 0.08 | 0.10 | 0.15 |
| Window frame/door | 0.19 | 0.40 | 0.19 | 0.12 | 0.07 |
| Daylight Factor Threshold | Percentage of Total Apartment Unit Area |
|---|---|
| ≥20% | 1% |
| ≥15% | 3% |
| ≥10% | 6% |
| ≥6% | 11% |
| ≥2% | 21% |
| 2% | 79% |
| DA Threshold | Covered Apt. Area | UDI h/year Threshold | Covered Apt. Area |
|---|---|---|---|
| 90% | 16.40% | 70% | 0.00% |
| 70% | 21.24% | 50% | 5.01% |
| 50% | 24.80% | 30% | 13.24% |
| 30% | 28.89% | 15% | 19.65% |
| 10% | 38.02% | 5% | 32.91% |
| Layer No. | Name | Component Configuration and Materials | Depth |
|---|---|---|---|
| 0 | Indoors building envelope layer | Gypsum boards wood frame | Depth: 8–10 cm |
| 1 | Support structure | Stainless steel frames | Depth: 4–6 cm |
| 2 | Construction support frame | Timber frame stainless steel rail connectors to layers 1 3 | Depth: 6–8 cm |
| 3 | Thermal insulation panel | Glass wool [71], timber frame, aluminium foil (vapor barrier) | Depth: 20 cm |
| 4 | Construction support frame | Timber frame, stainless steel connectors, plastic membrane (waterproof barrier) | Depth: 6–8 cm |
| 5 | Window component | Timber frame, double glazing rubber gasket | Depth: 10–15 cm |
| 6 | Solar blind system | Recycled plastic stainless steel | Depth: 8 cm |
| 7 | Mounting System 1. Cladding 2. Cladding | Stainless steel 1. Glass, plastic film, multicrystalline silicon (PV) aluminium frame 2. Recycled plastic panels [72] | Depth: 10 cm 1. Depth: 2 cm 2. Depth: 0.5 cm |
| Σ | Complete component window Complete component 1. cladding 1 Complete component 2. cladding 2 | Multiple (see above) Multiple (see above) Multiple (see above) | Depth: 42.5 cm 1. Depth: 55 cm 2. Depth: 43 cm |
| Component | WWR (Existing Apartment) | WWR (Renovated Apartment) |
|---|---|---|
| Southeast bedroom | 38.5% * | 28% (−18.5%) |
| Living room | 86.6% * | 35% (−51.6%) |
| Southwest bedroom | 86.3% * | 28% (−58.3%) |
| Northwest bedroom | 40.2% * | 23% (−17.2%) |
| Kitchen | 2.7% | 10% (+6.3%) |
| Northeast bedroom | 17.2% | 22% (+5.2%) |
| Building façades WWR improvement (decrease/increase) | WWR (existing apartment) | WWR (renovated apartment) |
| South-oriented façade | 70.46% | 30.33% (−40.13%) |
| North-oriented façade | 20.03% | 18.33% (−1.70%) |
| DGNB Criteria ENV1.1—Ecological Footprint/Balance | ||||||
| Material | Reference Unit | GWP (Kg-e CO2) | ODP (Kg-e R11) | PCOP (Kg-e C2H4) | AP (Kg-e SO2) | EP (Kg-e PO43-) |
| PVC-U | 1.0 m w. frame | 9.117 | 3.395*10−10 | 0.00345 | 0.0242 | 0.00290 |
| Wood | 1.0 m w. frame | 4.02 | 2.272*10−11 | 0.00350 | 0.0158 | 0.00257 |
| Aluminum | 1.0 m w. frame | 13.27 | 1.311*10−10 | 0.00346 | 0.0624 | 0.00423 |
| GWP (Global Warming Potential); ODP (Ozone Depletion Potential); PCOP (Photochemical Ozone Creation Potential); AP (Acidification Potential); EP (Eutrophication Potential) | ||||||
| DGNB Criteria ENV2.1—Resources Utilization | ||||||
| Material | Reference Unit | PEnr (MJ) | PEΣ(MJ) | PEr (MJ)(% PEΣ) | ADP (MJ) | WD (m3-equivalent) |
| PVC-U | 1.0 m w. frame | 167.70 | 183.42 | 15.72 (8.57%) | 155.6 | 0.0582 |
| Wood | 1.0 m w. frame | 85.03 | 146.67 | 61.64 (42.02%) | 71.7 | 0.0228 |
| Aluminum | 1.0 m w. frame | 176.1 | 239.05 | 62.95 (26.33%) | 149.9 | 0.156 |
| PEnr (Primary energy—non renewable); PEΣ (Primary energy—total); PEr (Primary energy—renewable); ADP (Abiotic resources Depletion Potential); WD (Water Demand) | ||||||
| Position | Dimensions (Length × Height cm) | Amount | U-Value (W/m2K) | g-Value |
|---|---|---|---|---|
| Southeast bedroom | 200 × 125 | 1 | 1.994 | 0.8 |
| Living room | 90 × 145 | 3 | 2.000 | 0.8 |
| Southwest bedroom | 200 × 145 | 1 | 1.994 | 0.8 |
| Northwest bedroom | 90 × 125 | 2 | 2.025 | 0.8 |
| Kitchen | 90 × 50 | 2 | 2.280 | 0.8 |
| Northeast bedroom | 90 × 125 | 2 | 2.025 | 0.8 |
| Apartment Room (DF Threshold) | Optimized Daylight-Factor (% Room Area for DF Threshold) | Existing Daylight-Factor (% Room Area for DF Threshold) | Improvement (% Room Area for DF Threshold) | Room Surface Ratio (Renovated/Existing) |
|---|---|---|---|---|
| Room SE | ||||
| ≥20% | 1.90 | 0.00 | +1.90 | 1.15 |
| ≥10% | 8.91 | 0.00 | +8.91 | |
| ≥5% | 20.79 | 0.00 | +20.79 | |
| ≥2% | 87.46 | 3.40 | +84.06 | |
| Living room | ||||
| ≥20% | 2.71 | 0.00 | +2.71 | 1.22 |
| ≥10% | 9.19 | 0.00 | +9.19 | |
| ≥5% | 16.04 | 0.00 | +16.04 | |
| ≥2% | 32.61 | 2.09 | +30.52 | |
| Room SW | ||||
| ≥20% | 0.10 | 0.00 | +0.10 | 1.15 |
| ≥10% | 7.75 | 0.00 | +7.75 | |
| ≥5% | 16.80 | 3.08 | +13.72 | |
| ≥2% | 82.25 | 10.93 | +72.72 | |
| Room NW | ||||
| ≥20% | 1.02 | 0.0 | +1.02 | 1.13 |
| ≥10% | 6.54 | 0.0 | +6.54 | |
| ≥5% | 16.30 | 0.0 | +16.30 | |
| ≥2% | 34.75 | 7.03 | +33.72 | |
| Kitchen | ||||
| ≥20% | 0.0 | 0.0 | 0.0 | 1.00 |
| ≥10% | 0.0 | 0.0 | 0.0 | |
| ≥5% | 0.45 | 0.0 | +0.45 | |
| ≥2% | 15.03 | 3.95 | +11.08 | |
| Room NE | ||||
| ≥20% | 0.41 | 0.0 | +0.41 | 1.00 |
| ≥10% | 6.21 | 0.0 | +6.21 | |
| ≥5% | 17.71 | 3.32 | +13.39 | |
| ≥2% | 37.08 | 18.45 | +18.63 | |
| Construction Specifics of the Shading Blind System | Operation Conditions |
|---|---|
| Type and orientation: External vertical blinds Thickness: 0.55 mm Solar Reflectance: 0.65; Solar Transmittance: 0; Emittance: 0.9 Conductivity: 221 W/mK Distance from glass exterior surface: 0.12 cm Single shade dimensions (l × h cm): 12 × 125 | Four conditional operative states for illuminance values above 700 luxThe simulation program progresses from condition 1 (completely open) to condition 4 (completely closed) until illuminance levels measured by a sensor positioned 1.20 m from the center of the window(s) at 1 m height are lower or equal to 700 lux. |
| Room (DA/UDI Threshold) | DA—Existing (% of Room Area for Threshold Value) | DA—Renovated (% of Room Area for Threshold Value) | DA—Renovated (% of Room Area for Threshold Value) | UDI—Existing (% of Room Area for Threshold Value) | UDI—Renovated (% of Room Area for Threshold Value) | UDI Improvement (% of Room Area for Threshold Value) | Comfort Hours Added with Blinds (300 ill 700) |
|---|---|---|---|---|---|---|---|
| Room SE | |||||||
| ≥80% | 2.64 | 25.82 | +23.18 | 0.00 | 0.00 | 0.00 | 768 |
| ≥50% | 8.52 | 48.64 | +40.12 | 5.29 | 0.00 | −5.29 | |
| ≥30% | 12.94 | 71.47 | +58.53 | 11.76 | 34.53 | +22.77 | |
| ≥10% | 24.41 | 88.58 | +64.17 | 23.23 | 80.48 | +57.25 | |
| Living room | |||||||
| ≥80% | 7.14 | 44.01 | +36.87 | 0.00 | 0.00 | 0.00 | N.A. |
| ≥50% | 14.76 | 63.15 | +48.39 | 8.33 | 8.37 | +0.04 | |
| ≥30% | 20.00 | 75.11 | +55.11 | 18.88 | 42.34 | +23.46 | |
| ≥10% | 37.14 | 93.30 | +56.16 | 36.42 | 74.40 | +37.98 | |
| Room SW | |||||||
| ≥80% | 15.47 | 21.20 | +5.73 | 0.00 | 0.00 | 0.00 | 720 |
| ≥50% | 24.28 | 44.20 | +19.92 | 8.33 | 0.00 | −8.33 | |
| ≥30% | 30.27 | 63.60 | +23.27 | 23.09 | 33.40 | +10.31 | |
| ≥10% | 59.71 | 95.20 | +35.49 | 53.33 | 88.00 | +34.67 | |
| Room NW | |||||||
| ≥80% | 5.90 | 21.78 | +15.80 | 0.00 | 0.00 | 0.00 | 432 |
| ≥50% | 12.84 | 37.62 | +24.78 | 12.84 | 17.82 | +4.98 | |
| ≥30% | 16.31 | 48.51 | +32.20 | 16.31 | 35.64 | +19.33 | |
| ≥10% | 21.18 | 58.74 | +37.56 | 21.18 | 55.11 | +33.93 | |
| Kitchen | |||||||
| ≥80% | 0.00 | 14.41 | +14.41 | 0.00 | 0.00 | 0.00 | N.A. |
| ≥50% | 3.84 | 26.68 | +22.84 | 2.88 | 10.42 | +7.54 | |
| ≥30% | 6.00 | 33.12 | +27.12 | 6.00 | 23.31 | +17.31 | |
| ≥10% | 9.13 | 42.33 | +33.20 | 9.13 | 39.26 | +30.13 | |
| Room NE | |||||||
| ≥80% | 11.81 | 23.90 | +12.90 | 0.00 | 0.0 | 0.00 | 312 |
| ≥50% | 21.32 | 40.74 | +19.42 | 14.40 | 21.88 | +7.48 | |
| ≥30% | 30.83 | 48.82 | +17.99 | 30.83 | 35.69 | +4.86 | |
| ≥10% | 42.36 | 57.23 | 14.87 | 42.07 | 53.87 | +11.8 | |
© 2019 by the authors. Licensee MDPI, Basel, Switzerland. This article is an open access article distributed under the terms and conditions of the Creative Commons Attribution (CC BY) license (http://creativecommons.org/licenses/by/4.0/).
Share and Cite
Amoruso, F.M.; Dietrich, U.; Schuetze, T. Integrated BIM-Parametric Workflow-Based Analysis of Daylight Improvement for Sustainable Renovation of an Exemplary Apartment in Seoul, Korea. Sustainability 2019, 11, 2699. https://doi.org/10.3390/su11092699
Amoruso FM, Dietrich U, Schuetze T. Integrated BIM-Parametric Workflow-Based Analysis of Daylight Improvement for Sustainable Renovation of an Exemplary Apartment in Seoul, Korea. Sustainability. 2019; 11(9):2699. https://doi.org/10.3390/su11092699
Chicago/Turabian StyleAmoruso, Fabrizio M., Udo Dietrich, and Thorsten Schuetze. 2019. "Integrated BIM-Parametric Workflow-Based Analysis of Daylight Improvement for Sustainable Renovation of an Exemplary Apartment in Seoul, Korea" Sustainability 11, no. 9: 2699. https://doi.org/10.3390/su11092699