Article

Homogeneity-PMU-Based Method for Detection and Classification of Power Quality Disturbances

by
Jose R. Razo-Hernandez
1,
Martin Valtierra-Rodriguez
1,*,
Juan P. Amezquita-Sanchez
1,
David Granados-Lieberman
2,
Jose F. Gomez-Aguilar
3 and
Jose de J. Rangel-Magdaleno
4
1
ENAP-Research Group, Facultad de Ingeniería, Universidad Autónoma de Querétaro (UAQ), Campus San Juan del Río, Río Moctezuma 249, Col. San Cayetano, San Juan del Río C. P. 76807, Mexico
2
ENAP-Research Group, Departamento de Ingeniería Electromecánica, Instituto Tecnológico Superior de Irapuato (ITESI), Carr. Irapuato-Silao km 12.5, Colonia El Copal, Irapuato C. P. 36821, Mexico
3
CONACYT—Centro Nacional de Investigación y Desarrollo Tecnológico (CENIDET), Tecnológico Nacional de México, Interior Internado Palmira S/N, Col. Palmira, Cuernavaca C. P. 62490, Mexico
4
Instituto Nacional de Astrofísica, Óptica y Electrónica (INAOE), Luis Enrique Erro # 1, Col. Tonantzintla, Puebla C. P. 72840, Mexico
*
Author to whom correspondence should be addressed.
Electronics 2018, 7(12), 433; https://doi.org/10.3390/electronics7120433
Submission received: 24 November 2018 / Revised: 10 December 2018 / Accepted: 10 December 2018 / Published: 12 December 2018
(This article belongs to the Special Issue Power Quality in Smart Grids)

Abstract

:
Over the past few years, power quality (PQ) monitoring has become of paramount importance for utilities and users since poor PQ generates negative consequences. In monitoring, fast detection and accurate classification of PQ disturbances (PQDs) are desirable features. In this work, a new method to detect and classify PQDs is proposed. The proposal takes advantage of the low computational resources of both a phasor measurement unit (PMU)-based signal processing scheme and the homogeneity approach. To classify the PQDs, if–then–else rules are used. To validate and test the proposal, synthetic and real signals of sags, swells, interruptions, notching, spikes, harmonics, and oscillatory transients are considered. For the generation of real signals, a PQD generator based on a power inverter is used. In the proposed method, the PMU information is directly used to classify sags, swells, and interruptions, whereas the homogeneity index is used to distinguish among the remaining PQDs. Results show that the proposal is an effective and suitable tool for PQ monitoring.

1. Introduction

The topic of power quality (PQ) is of paramount importance for utilities and users [1,2,3], since poor PQ negatively affects both electric network infrastructure and equipment connected to the power line. In general, poor PQ is associated with the presence of different electromagnetic phenomena, commonly called PQ disturbances (PQDs), in the voltage or current signals [4,5]. In order to apply proper solutions, fast detection and accurate classification of PQDs have become fundamental features in PQ monitoring tasks. Although many efforts have been presented in the literature for these tasks [4,6,7], there is still need of further research. On one hand, there are several problems associated with modern power systems, such as a massive proliferation of non-linear loads that generate harmonic content and a distributed generation that produces intermittent and variable power [8,9,10,11]. These require the development of both new technologies to reduce their negative impact, such as compensators, active filters, and energy storage systems, among others [9,11,12], and PQ monitoring systems that provide information about the voltage and current waveforms for further processing and analysis of the measured signals [13,14]. For the latter, the proposal of efficient and reliable methodologies in terms of computational resources and performance, respectively, to detect and classify PQDs is desirable [3,13,14,15]. On the other hand, the needs, requirements, capabilities, and improvements of existing measurement equipment in electric power networks have to be taken into consideration [16,17,18,19], since they can be exploited for many applications, even those that are different from their original design. In particular, phasor measurement units (PMUs) are powerful monitoring tools [18,20], which provide amplitude, phase, and frequency of electric signals in a synchronized way, that have been rapidly integrated in many applications of power systems [18], making them suitable and promising to perform monitoring in a PQ context.
Regarding the methodologies proposed in the literature for detection and classification of PQDs, it should be pointed out that many signal processing techniques, waveform indices, and artificial intelligence-based algorithms have been already presented. In particular, the short-time Fourier transform (STFT) [21], wavelet transform (WT) [22], tunable-Q-wavelet transform [23], generalized empirical wavelet transform [24], S-transform [25,26], double resolution S-transform and directed acyclic graph support vector machines [27], Gabor-Wigner transform [28], Kalman filter [29], and empirical mode decomposition (EMD) methods [15,30], among others, have been reported as signal processing methods. Although promising results have been obtained, some aspects have to be taken into consideration. For instance, STFT degrades its performance in the analysis of transient phenomena because the analyzed time window has a fixed size. Although the WT can adequately analyze transient phenomena, its performance depends on the used mother wavelet. In a similar way, the Gaussian window has to be calibrated in the S-transform in order to obtain the most suitable results. Other issues and limitations that have to be considered in the aforementioned techniques (Gabor, Wigner, and Gabor-Wigner transforms) have been mentioned in [31]. For the Kalman filter, the measurement noise and a harmonic model have to be defined a priori; in practice, they cannot be known accurately. Unlike the Kalman filter, EMD-based methods are adaptive techniques, i.e., information of the input signal is not required; however, the mode-mixing effect in the EMD method and the high computational burden in the ensemble EMD method can compromise their performance and applicability for PQ monitoring.
On the other hand, some indices and well-established parameters such as root-mean-square (RMS)-based parameters (RMS value, variation rate of the RMS values, oscillation number of the RMS values, total harmonic distortion factor, and lower harmonic distortion factor) [32], a PQ deviation index based on principal curves [33], higher order statistics (mean, variance, skewness, and kurtosis) [34], and a derivative factor with some threshold-based rules [35], have been reported to characterize PQDs. Although characterization of PQDs has been achieved, research to reduce both the number of indices needed to perform this task and their complexity is required since the computational resources would be significantly reduced as well. Regarding intelligent algorithms, artificial neural networks [36], support vector machines [37], fuzzy systems oriented by particle swarm optimization [38], a decision tree and fuzzy C-means clustering classifiers [39], and the AdaBoost algorithm [40], among many others, have been presented. In these algorithms, the training dataset, training algorithm, topology or structure (size, complexity, and elements), and designer expertise are issues that have a direct impact on their performance. Therefore, special attention and, sometimes, great effort, have to be applied in order to obtain a good enough performance. Also, the reconfiguration of some algorithms, e.g., neural networks, to include a new category can be a highly demanding task since the training has to include both the previous categories and the new ones, where even the initial topology and/or the features used as inputs may not be good enough for the new cases. From all the aforementioned facts, some opportunities of research can be highlighted, e.g., development and application of low-complexity methodologies, exploration of new indices, and proposal of simpler classification schemes, among others.
In this work, a new methodology for PQ monitoring is proposed. In general, it is based on two main approaches: (1) information provided by a PMU scheme and (2) the homogeneity index. The former is used to extract the fundamental component, i.e., the frequency component, of 50 or 60 Hz, from the original signal. Thus, the PQDs at the fundamental component (sag, swell, and interruption) are separated from those at the non-fundamental component (notching, spike, harmonic, and oscillatory transient). This separation allows for an easier classification and exploits the inherent operation of a PMU scheme, i.e., it already provides the magnitude, phase, and frequency of the fundamental component. From the magnitude information, sags, swells, and interruptions can be classified using a rule-based decision unit. On the other hand, notching, spikes, harmonics, and oscillatory transients are classified using the homogeneity index, which, to the best of the authors’ knowledge, has not been presented for this task. In order to validate and test the proposal, synthetic and real measured signals are used. Results show the effectiveness and usefulness of the proposed methodology for PQDs monitoring.

2. Theoretical Background

2.1. Power Quality Disturbances

For electric systems, a nominal voltage waveform is described in a general way by [35,41,42]:
x ( t ) = X m sin ( ω t + θ )
where Xm is the peak voltage or amplitude, ω = 2πf is the angular frequency, f is the frequency for the fundamental component (50 or 60 Hz), and θ is the phase angle. Deviations of these parameters from their nominal values during a time interval are commonly known as disturbances that affect the PQ, i.e., PQDs. In this regard, a non-ideal voltage signal, e.g., a real voltage signal measured in the electric network, is presented in [35] as:
x R ( t ) = x ( t ) + x P Q D ( t )
where xPQD(t) represents the PQDs.
According to the IEEE Standard 1159 [2], there are different categories for the PQDs. Correct identification and classification play an important task since there are different solutions depending on the PQD of concern. In this Standard [2], sags, swells, and interruptions are categorized by their RMS values; for instance, interruptions present amplitudes lower than 0.1 pu, sags present amplitudes from 0.1 to 0.9 pu, and swells present amplitudes greater than 1.1 pu. The quantity pu refers to per unit, which is dimensionless and corresponds to 100% of a nominal value [2]. On the contrary, oscillatory transients, harmonics, and notching are considered as non-fundamental frequency components, i.e., frequency components different from 50/60 Hz. More detailed information about categories and typical characteristics of PQDs can be found in [2].
In different studies, several mathematical models have been reported to generate different waveforms that represent the dynamic behavior of PQDs [42,43]. These waveforms are commonly used to test new methods for PQ monitoring since their parameters are known a priori; thus, numerical and classification errors can be assessed.

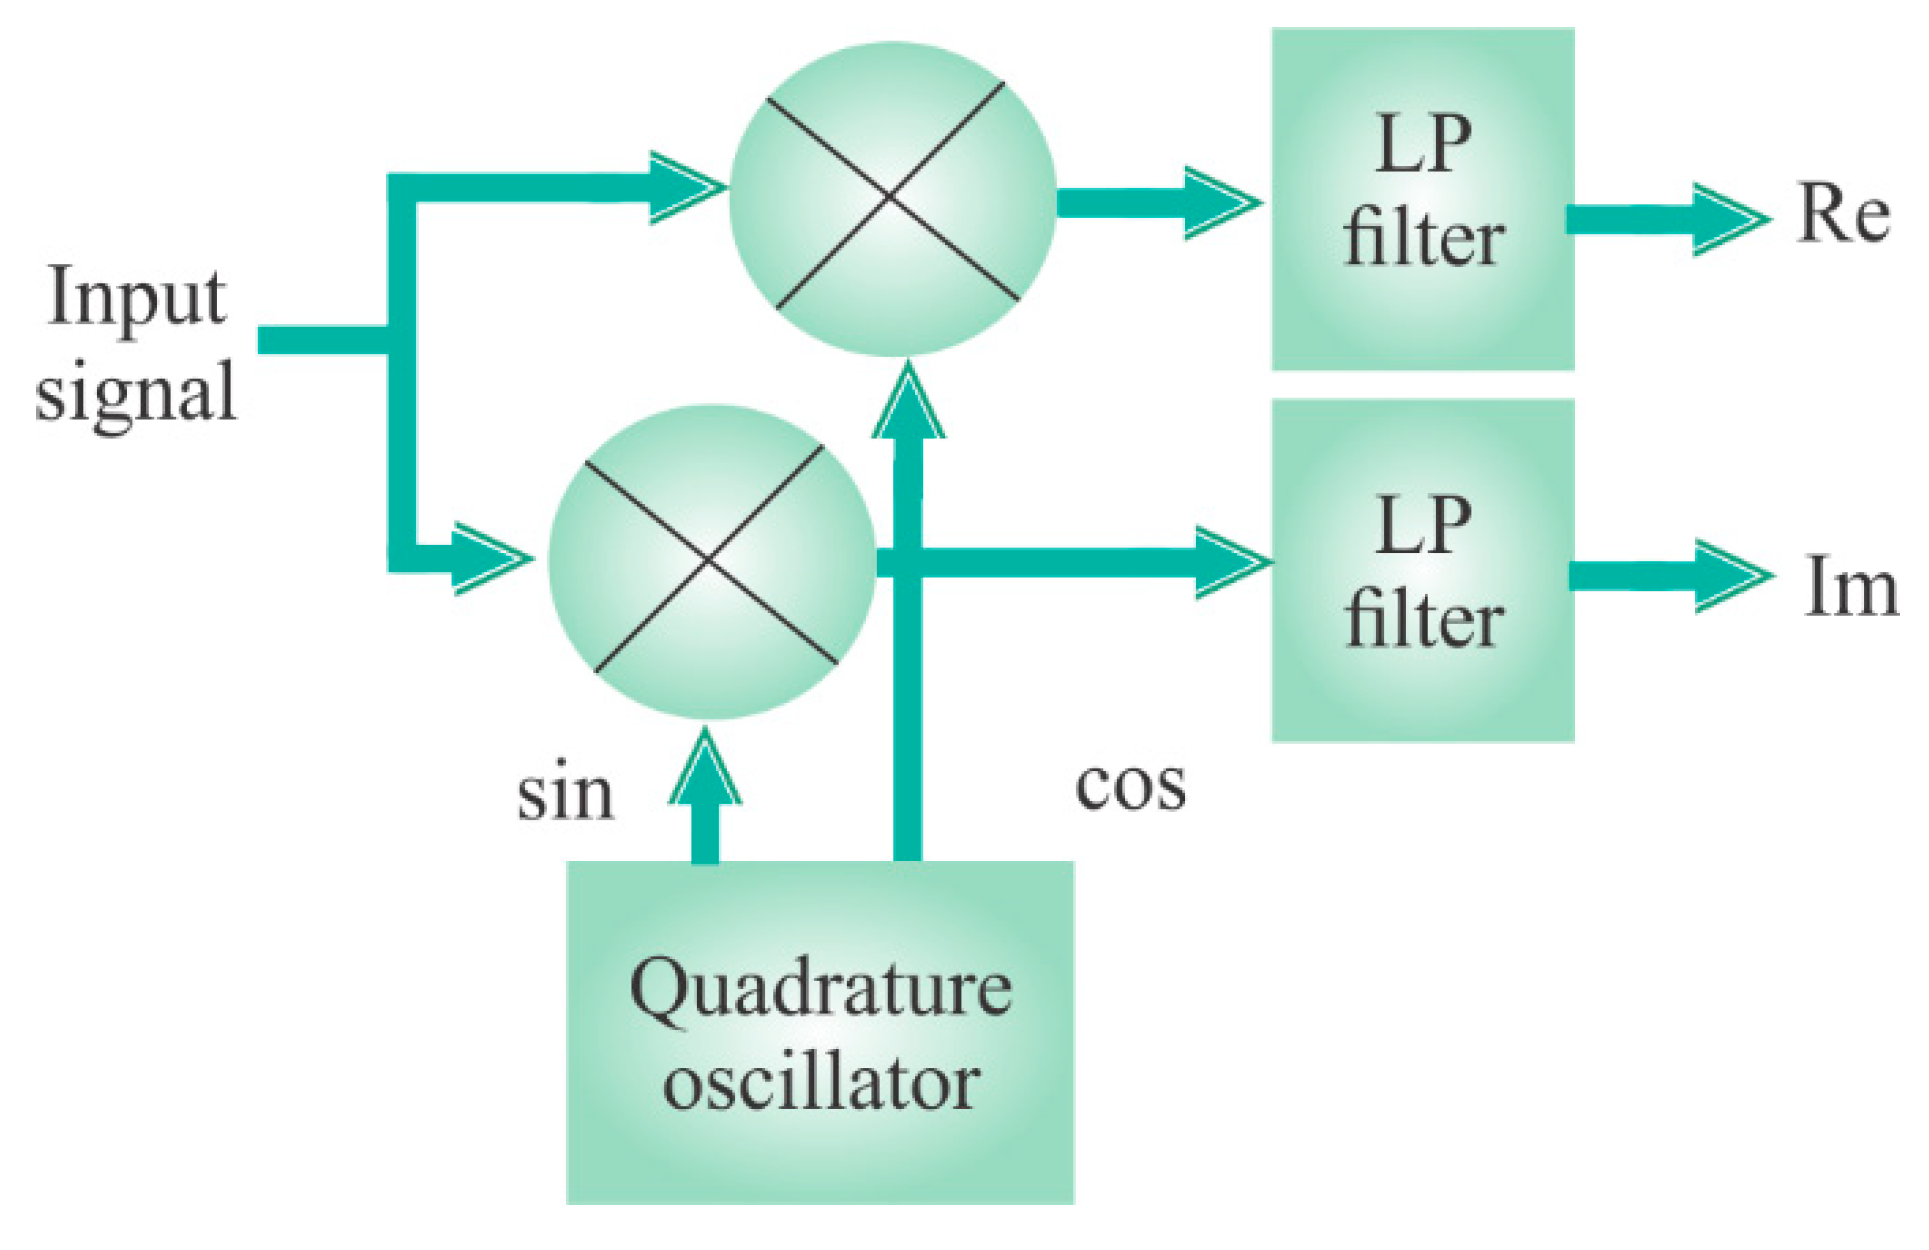
2.2. Phasor Measurement Unit
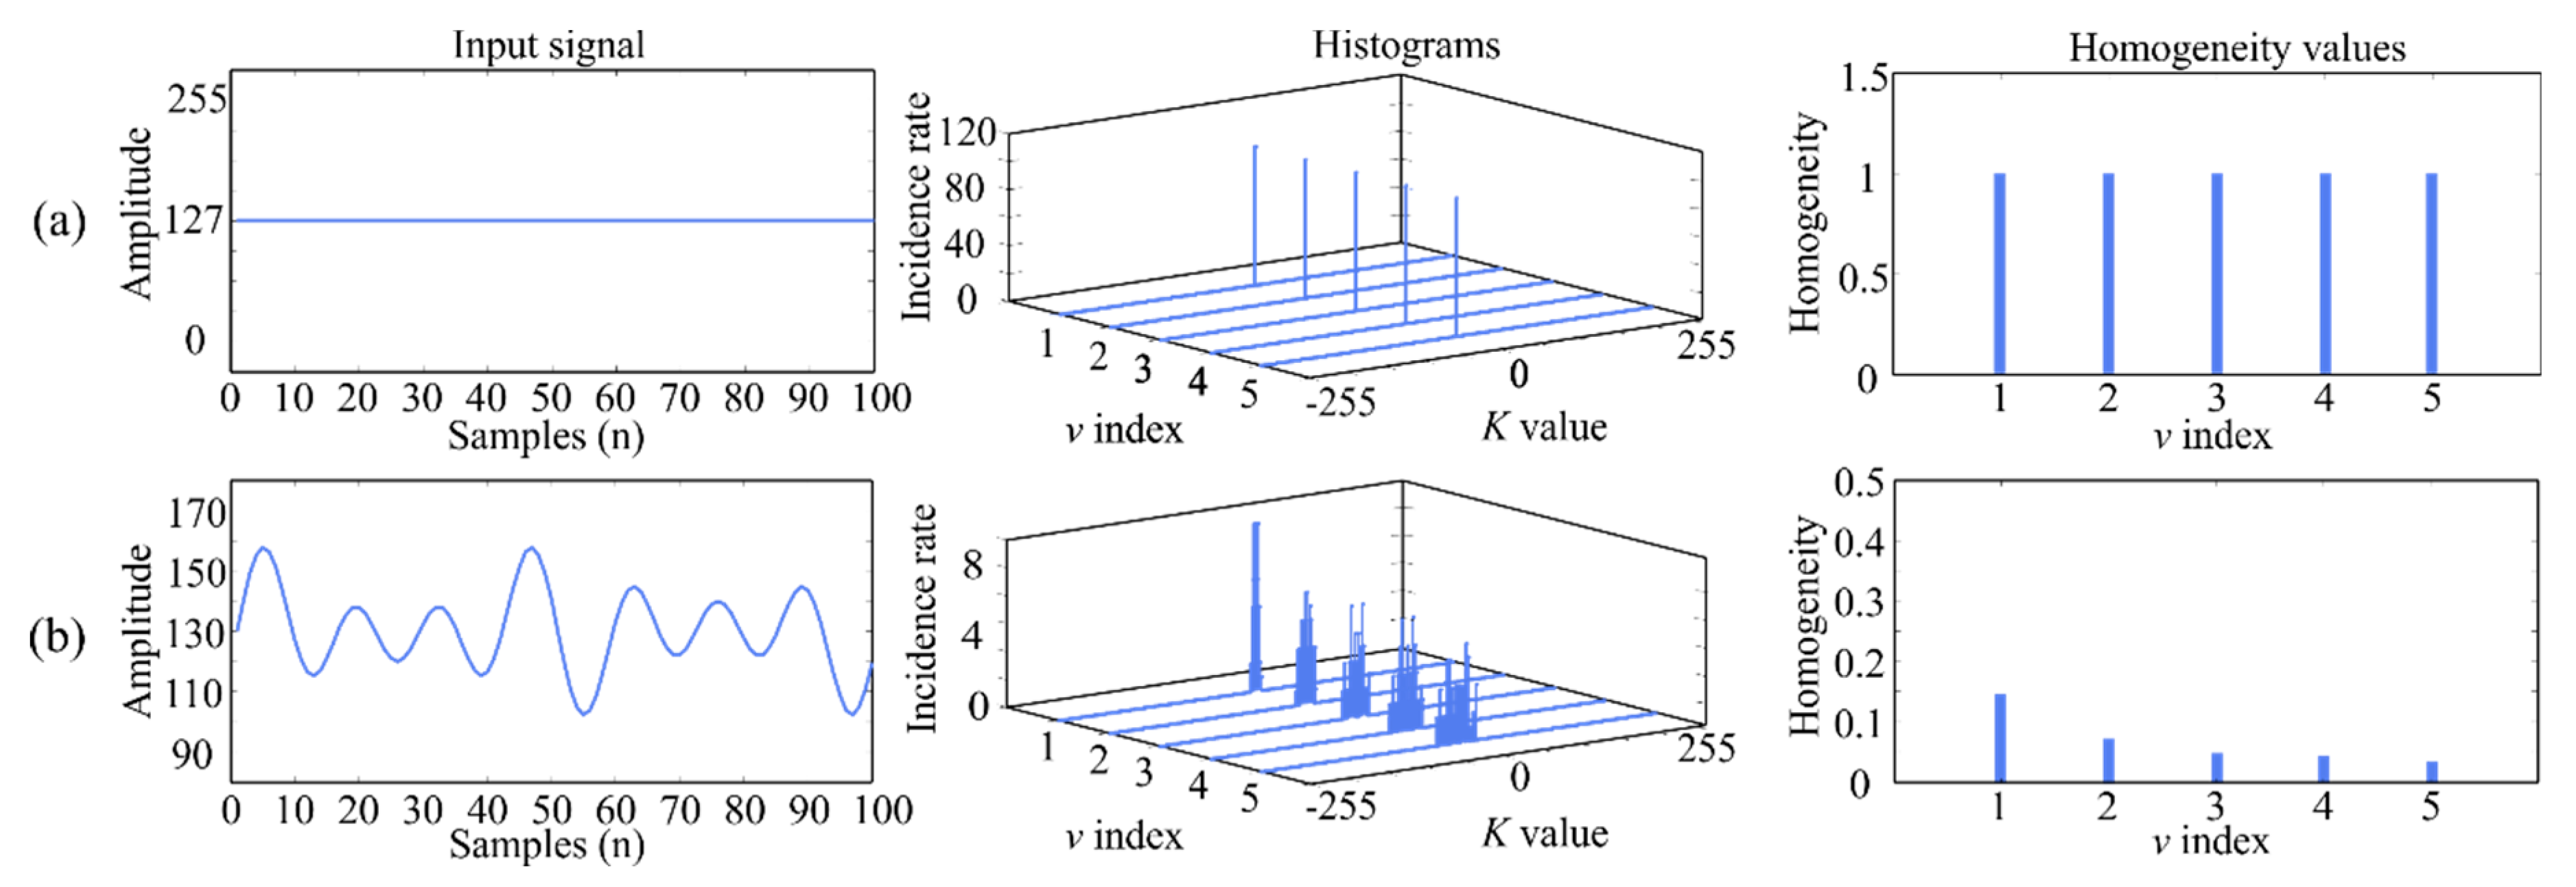
A PMU is an increasingly used monitoring tool in power systems [18]. In general, this tool uses both a phasor estimator to obtain magnitude, phase, and frequency of voltage and current signals, and a global positioning system to synchronize the measurements to an absolute time reference [44,45]. The IEEE Standard C37.118.1 establishes the steady-state and dynamic requirements that have to be achieved by a PMU and presents a reference phasor estimation model that satisfies them [41]. This model is shown in Figure 1. In this figure, it is observed that the input signal is modulated by a quadrature oscillator, i.e., sine and cosine functions. Then, a demodulation process is carried out using two low-pass (LP) filters, resulting in two signals in quadrature, the real one, Re, and the imaginary one, Im. These signals allow the phasor representation of x(t) = Xmcos(ωt + θ) as follows [45]:
X = ( X m / 2 ) e j θ = ( X m / 2 ) ( cos θ + j   s i n θ ) =   Re   +   j   Im
where Xm and θ are the amplitude and phase of the signal, respectively. Re and Im are used to compute the magnitude and phase as follows:
X m = Re 2 + Im 2
θ = tan 1 ( Im Re )
In addition, the frequency can be obtained from ϕ(t) = ωt + θ as follows:
f ( t ) = 1 2 π d ϕ d t
The abovementioned parameters are given by a PMU at different reporting rates, e.g., 60 frames per second (fps). This reporting rate implies that the parameters of magnitude, phase, and frequency are provided each period for electric systems with a fundamental frequency of 60 Hz.
It is important to mention that the IEEE Standard C37.118.1 establishes the P class and the M class of performance for a PMU. In this regard, two different LP filters are presented [41], i.e., one for each class. In this work, the filter for the P class is selected since it offers a faster response [41]; however, other filters that satisfy the PMU requirements could be used in the proposal. The P-class filter coefficients are given by [41]:
W ( k ) = ( 1 2 N + 2 | k | )
where k = −N/2:N/2 (integer values only) and N represents the filter order.

2.3. Homogeneity

The homogeneity approach is presented in [46] as a texture feature in the analysis of images. Recently, it has been also presented as a diagnosis index for a time-series signal [47]. In this index, a signal with soft changes presents a high homogeneity since it presents a high regularity; on the other hand, if the signal presents abrupt changes, e.g., the changes associated with PQDs, its homogeneity value will be low; in fact, it could change in a different way for each kind of PDQ. In this regard, the homogeneity approach can be a useful index to characterize different PQDs.
The homogeneity index can be computed using the following steps:
  • Compute the vector of differences for a signal, x, as follows:
    D v ( n ) = x ( n ) x ( n v )
    where v is a fixed integer and n ranges from 0 to N − 1. N is the number of samples in x. These samples are quantized into K different values.
  • For Dv(n), compute its histogram, hv(j). j can take values from −K + 1 to K − 1.
  • By considering a total number of differences, A, compute the probability function as:
    P D ( j ) = h v ( j ) A
  • Finally, compute the homogeneity index using PD(j) as follows:
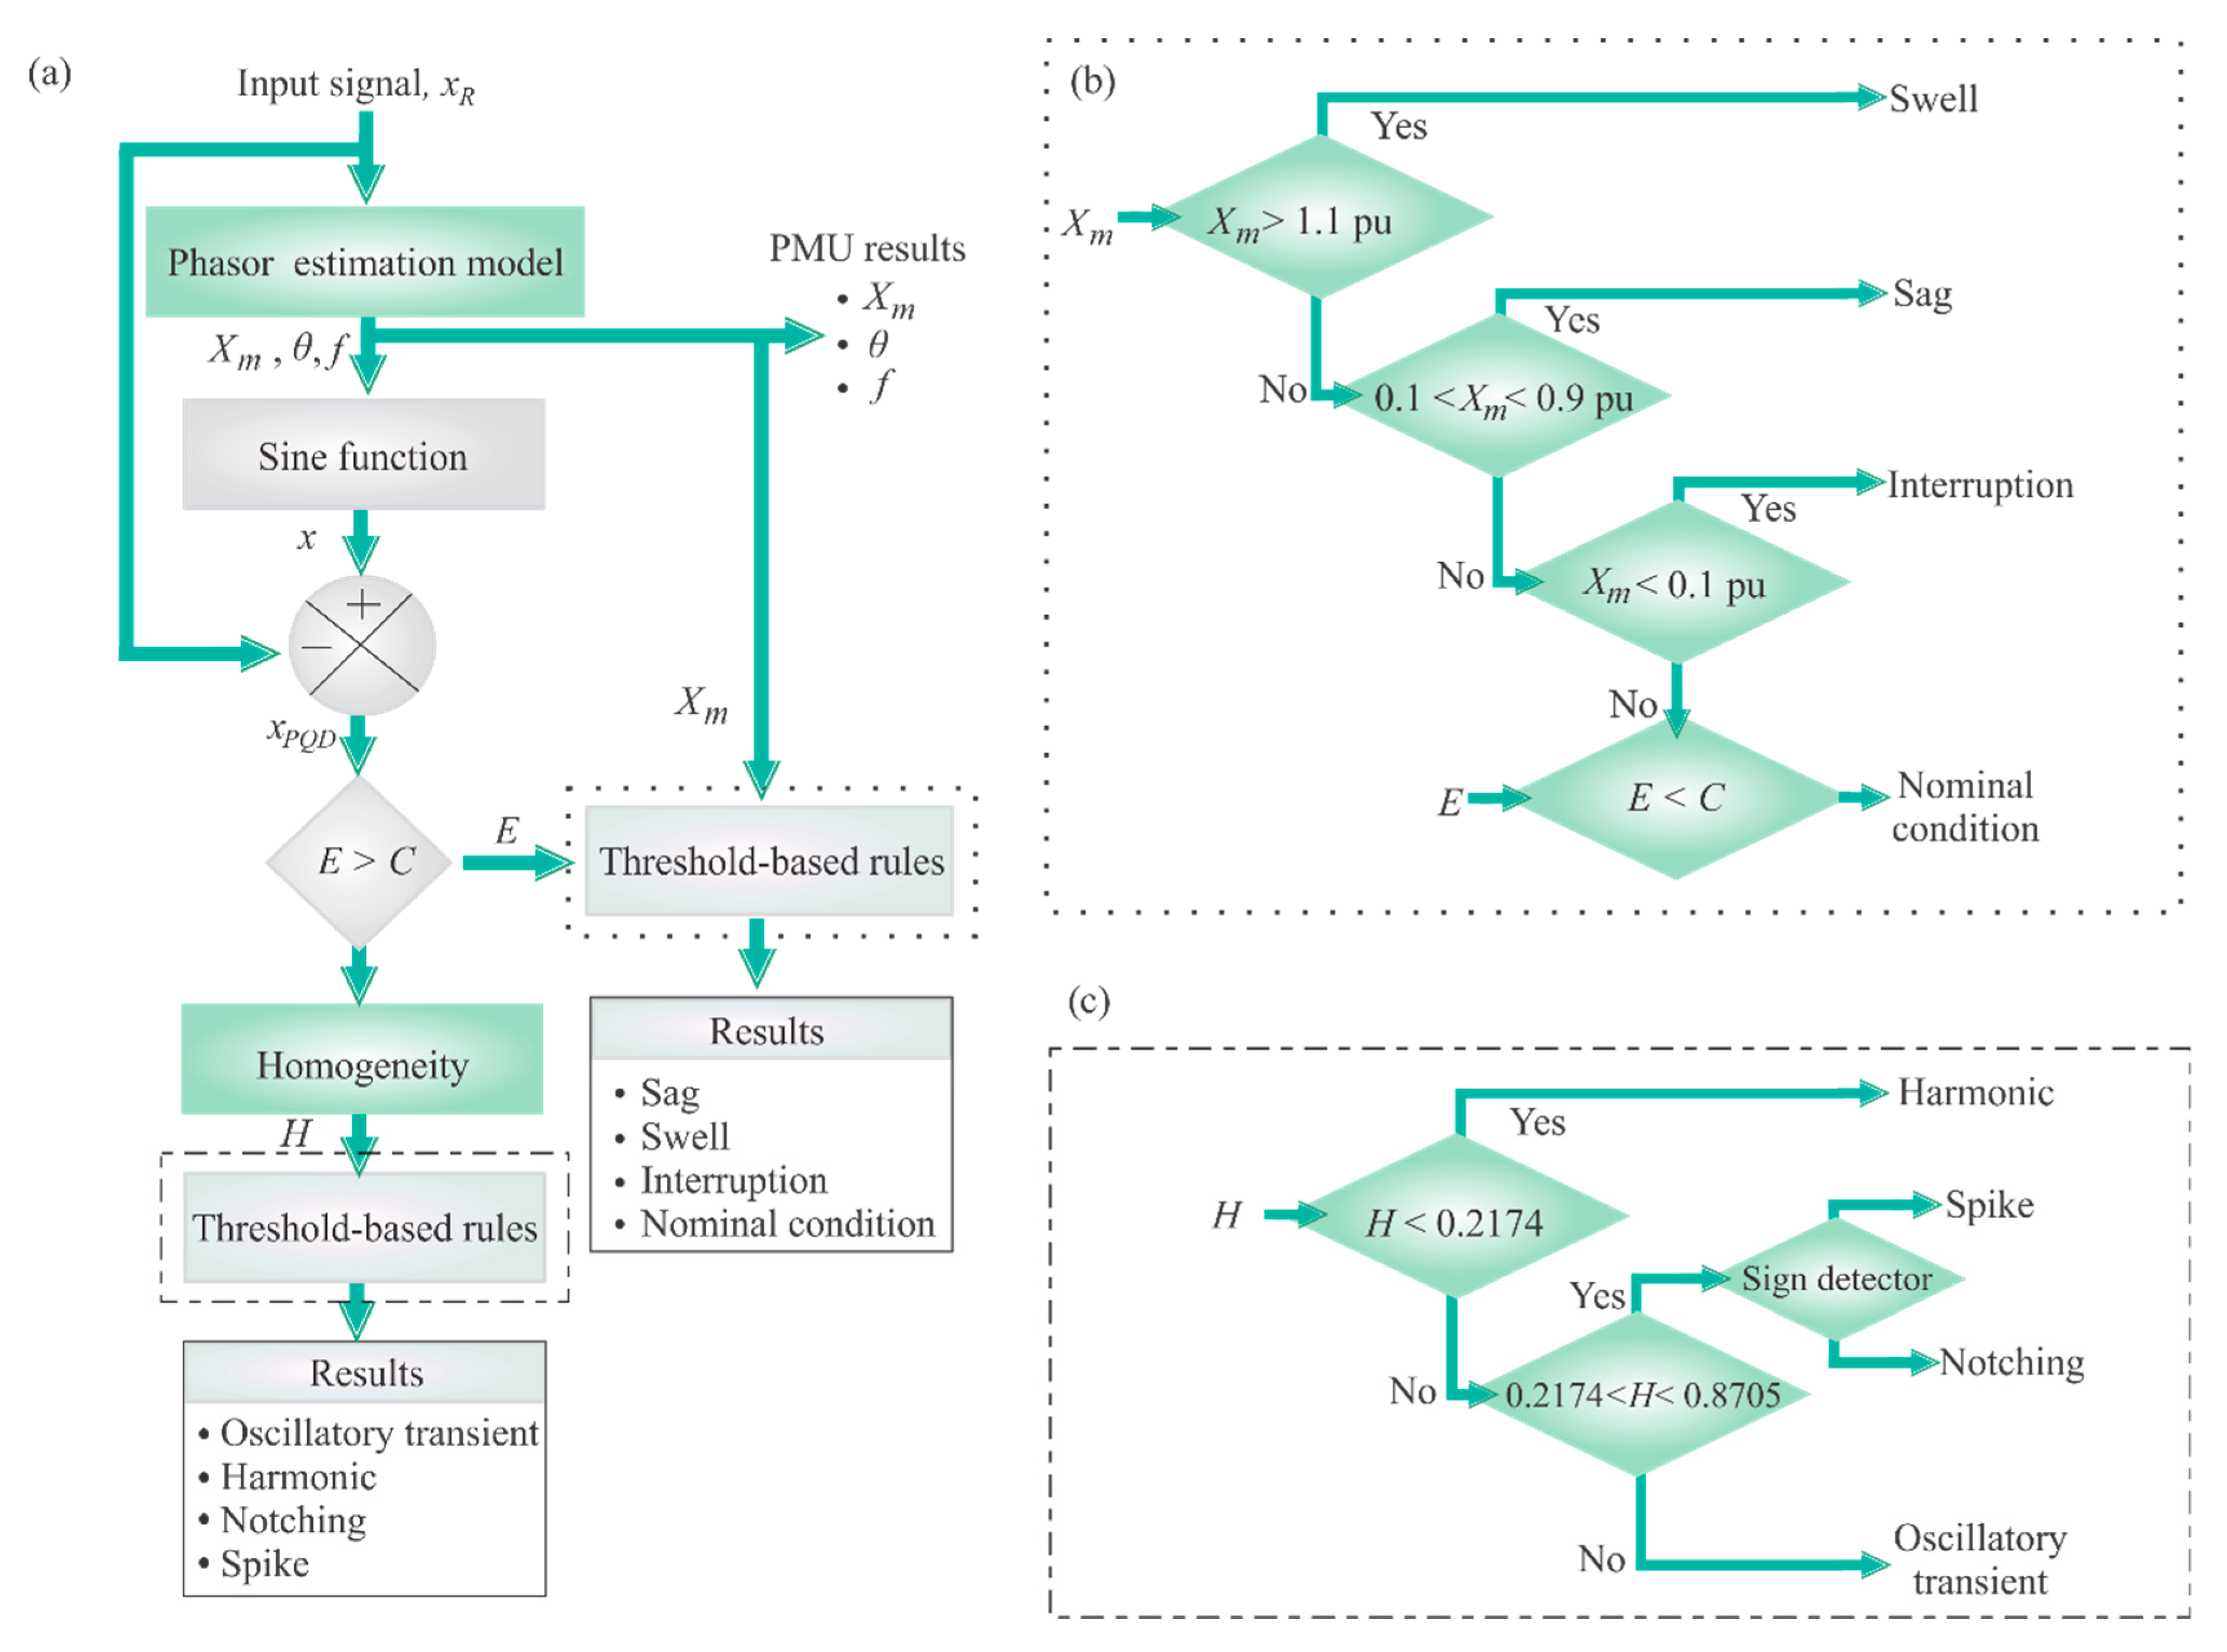
    H = j 1 1 + j 2 P D ( j )
It should be pointed out that H can take values from 0 to 1. A constant signal leads to the maximum value of H, i.e., H = 1, regardless of the value of v as shown in Figure 2a. If the signal is constant, the histograms using different values of v are identical; hence, H does not change. For a time-varying signal, the value of H changes for different values of v as shown in Figure 2b; as can be observed in this figure, a higher number of v may imply both a more dispersed histogram and a lower value of H.

3. Proposed Method

The proposed methodology to detect and classify PQDs is shown in Figure 3a. In the first step, the input signal, xR, is processed by the phasor estimation model shown in Figure 1. As a result, the amplitude, phase, and frequency of the fundamental component are obtained using Equations (4)–(6). It should be pointed out that these parameters are intrinsic information of a PMU, implying no further computational resources. From these parameters, the amplitude, Xm, is seized to classify sags, swells, and interruptions, since these PQDs depend on the RMS values. Therefore, the block of “Threshold-based rules” (Figure 3a, right side) implements if–then–else rules by considering the limits stated in [2] as shown in Figure 3b. An example of one rule is: if Xm is greater than 1.1 then the PQD is a Swell else another rule has to be explored. As can be observed in Figure 3b, the last block considers the energy, E [13,48], of the non-fundamental component, xPQD, in order to determine the nominal condition, i.e., if there is neither swell, sag, nor interruption and there is not enough E at xPQD, the input signal presents a nominal condition. This restriction is necessary because the nominal condition cannot be assured since a PQD can exist at xPQD. The limit of E is set to C = 1% of the nominal voltage value, as the noise typically ranges from 0 to 1% [2].
On the other hand, the PMU parameters (Xm, θ, f) are also used to construct a fundamental sinusoidal signal, x, using Equation (1), which is extracted from the input signal in order to separate the signal that contains the PQDs at the non-fundamental component, xPQD, i.e., notching, spikes, oscillatory transients, and harmonics. For this signal, and by considering that its E is greater than C, its homogeneity value is computed in order to classify the PQD. In a similar way to sags, swells, and interruptions, the non-fundamental PQDs are classified using the block of threshold-based rules (Figure 3a, left side). The threshold values are obtained by analyzing synthetic signals that represent the different PQDs. In order to do so, the mathematical models presented in [42] for oscillatory transients, spikes, notching, and harmonics are used, where 100 signals for each disturbance are constructed. The numerical parameters for these signals are randomly selected by considering the limits in [42]. Figure 4 shows the obtained results. In this figure, an example of the constructed signal for notching/spike, oscillatory transient, and harmonics is shown (see Figure 4a–c), where the fundamental component is not shown because it is extracted in the previous step. It should be pointed out that one cycle of the signal is only constructed since the PMU results are considered for a reporting rate of 60 frames per second, i.e., the classification results are computed per period. This classification rate is useful for an online monitoring system since the time that a specific PQD lasts or exists would be both tracked and determined. For the homogeneity, the notching and spike are considered as the same PQD, since they only change in sign [42]. In Figure 4d–f, the homogeneity results for the PQDs by testing different values of v are shown (each bar in these figures represents the H index for the signal under test using a specific value of v). As can be observed, the homogeneity value remains almost constant for the notching and spike regardless of the v value. For the oscillatory transient, the homogeneity value oscillates around 0.5, whereas it oscillates around 0.1 for harmonics. In order to have a wider separation among the homogeneity values for each kind of PQD, a v value of 5 is selected. Figure 4g shows the homogeneity results for the 100 tests of each disturbance, remembering that the PDQs are randomly generated using the mathematical models presented in [42]. As can be observed in Figure 4g, the homogeneity values are separated from each other. In order to observe their differences in a quantitative way, their probability density functions are computed and shown in Figure 4h, where 3 standard deviations, σ, are considered; therefore, the Gaussian functions are centered on the mean, μ, and have a width of ±3 σ. It is important to mention that the interval given by μ − 3σ, μ + 3σ in a Gaussian distribution contains approximately 99.7% of the data; therefore, if there is no overlap among the Gaussian functions, a discrimination rate of almost 100% is obtained. Table 1 shows the numerical values obtained. Regarding the threshold values, the limits of 0.2174 and 0.8705 are selected since they separate completely the Gaussian functions (see Figure 4h). With these values, the block of threshold-based rules computes the if–then–else rules shown in Figure 3c; in this block, a sign detector for xPQD is used to differentiate between spike and notching.

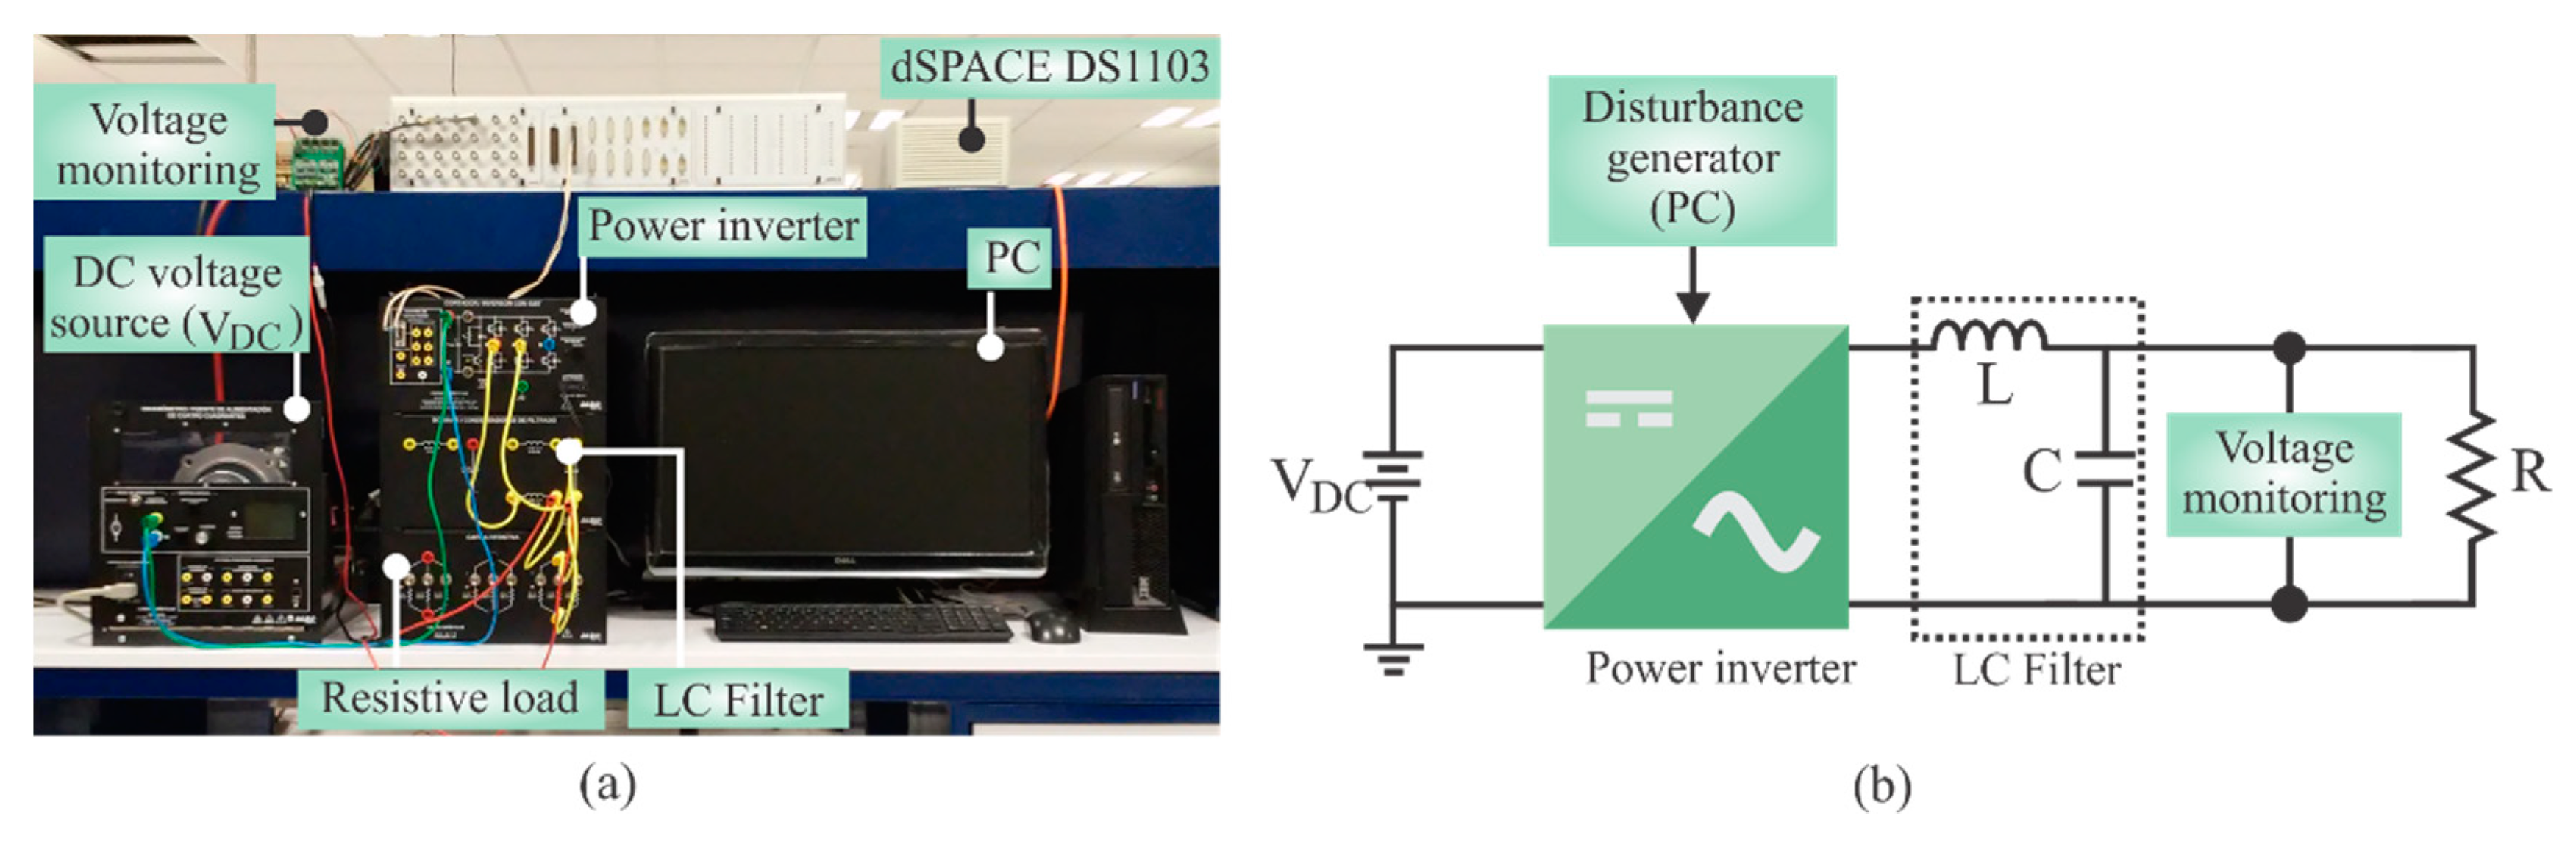
4. Experimentation and Results
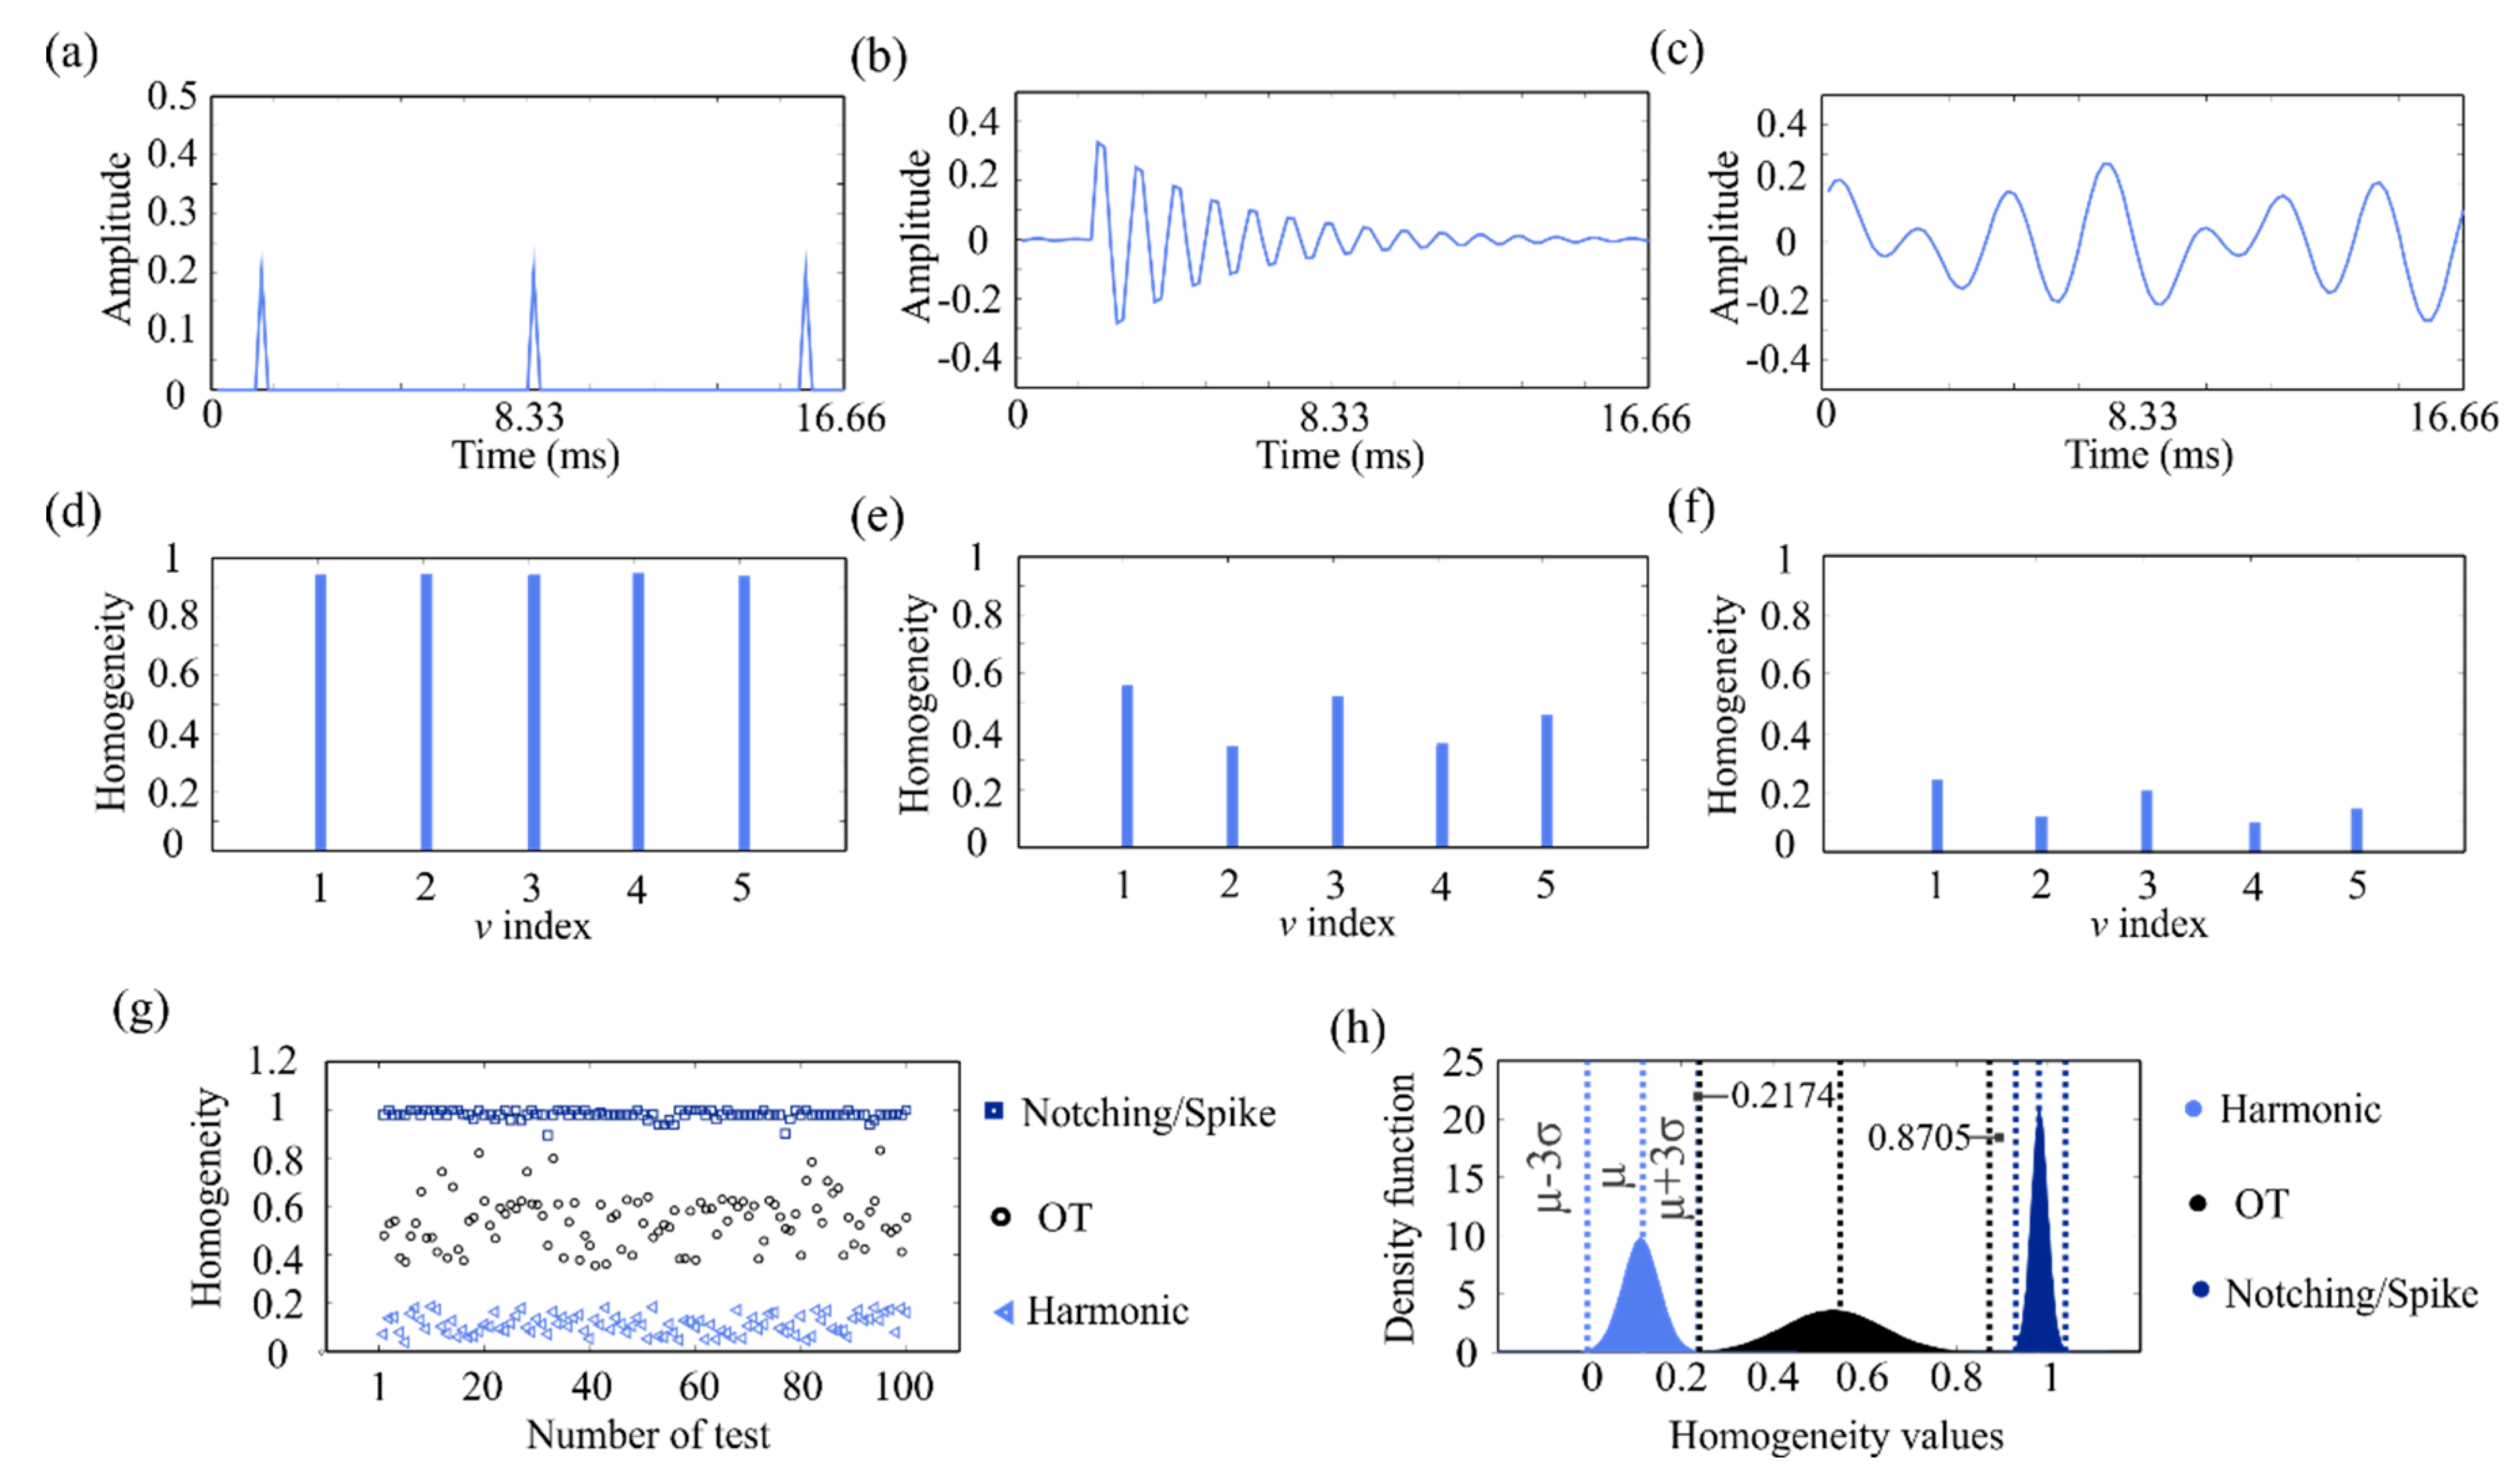
4.1. Validation

Synthetic signals are used in many applications to validate and test new algorithms [42,47,48]; as the reference values are known a priori, errors or deviations from the expected values can be measured. In this regard, synthetic signals based on the mathematical models presented in [42] are used to validate the proposal. In this work, sags, swells, interruptions, harmonics, notching, spikes, and oscillatory transients, as well as the healthy condition, are considered. In total, 100 signals with random parameters that contain all the aforementioned conditions (PQDs and nominal signals) are generated using both a sampling frequency of 6000 samples/s and a nominal frequency of 60 Hz. Figure 5a shows an example of one constructed signal; as can be observed, the PQDs are present at different time intervals. Following the proposed methodology, the PMU scheme computes Xm, θ, and f, where the tracking of Xm is presented in Figure 5b, allowing the classification of Sag, Swell, and Interruption. From the PMU parameters, the signal shown in Figure 5c is constructed and subtracted from the input signal. Figure 5d shows the resulting signal, i.e., the signal with the PQDs at the non-fundamental component. The homogeneity tracking is presented in a red color; as can be noted, its value changes according to the type of PQD. With the homogeneity tracking and the threshold-based rules, the harmonics, oscillatory transients, and notching/spikes can be classified. In addition, the duration of each PQD can be monitored. The classification results for all the synthetic signals are shown as a confusion matrix in Table 2, where all the correct classifications are located in the diagonal. For nominal conditions, 100% of effectiveness is obtained, i.e., 100 signals in nominal conditions are classified as nominal conditions; also, no false positives are generated, i.e., PQD conditions are not confused with a nominal condition. For sags, swells, and interruptions, a minimum effectiveness of 99% is obtained, where a sag is confused with an interruption. On the other hand, the PQDs at the non-fundamental component present a minimum effectiveness of 98%. Some signals with notching are confused with spikes and vice versa, which might be expected since these PQDs only differ in sign [42].

4.2. Results for Real Signals

The performance of the proposed methodology is also tested in a more real scenario. In order to do so, the PQD generator shown in Figure 6a is used. It consists of a personal computer (PC) with MATLAB software which is used to generate the PQD signals and implement the overall methodology. These signals are sent to the dSPACE DS1103 board to control DC/AC power converters. The dSPACE is also used for the acquisition of the voltage signals. The power inverter based on IGBTs is in a full-bridge configuration; for this work, the inverter is implemented using both a unipolar voltage switching at 3 kHz and a DC voltage source of 200 V. An inductor of L = 2 mH and a capacitor of C = 4 μF are used in the LC filter to cut off the switching frequency in the generated signals; also, a resistor of R = 600 Ω is connected in order to have a constant load. Figure 6b shows the electric circuit for the aforementioned elements. Using the PQD generator, five signals for each PQD condition are generated. These conditions are sag, swell, interruption, oscillatory transient, harmonics, notching, spikes, and the combination of two PQDs, such as a sag, a swell, or an interruption with an oscillatory transient, harmonics, notching, or spikes, resulting in 95 signals as shown in Table 3. As mentioned above, sags, swells, and interruptions are mutually exclusive; therefore, they cannot be combined with each other but can be combined with other disturbances. For this condition, the proposal is not negatively affected as it can separate PQDs at the fundamental component and PQDs at the non-fundamental component. Figure 7 shows some of the generated signals. Figure 7a shows a signal with notching, Figure 7b shows a signal with a sag plus an oscillatory transient, and Figure 7c shows a signal with a sag plus harmonics and a swell. As can be observed, the homogeneity index (H tracked in red color) allows classifying PQDs at the non-fundamental component and the magnitude of the PMU (Xm tracked in black color) allows classifying PQDs at the fundamental component. Results of Table 3 show that most of the PQDs are accurately classified (five from five), but in the notching and the spike some errors are obtained, e.g., for “One PQD” in Table 3, only four signals with notching are accurately classified (4/5) whereas the other notching signal is confused with a signal with spikes (6/5). These results corroborate the point observed in the synthetic signals. A similar scenario is observed for “Two PQDs” in Table 3, where two tests of notching are confused with two tests of spikes. It should be pointed out that this test scenario is more demanding since, on the one hand, the noise generated by both the inverter and the acquisition system (quantization process, sensors, and signal conditioning) increases the complexity of the monitoring and, on the other hand, the classification of two combined PQDs is more difficult, mainly for notching and spikes where their waveform differences are not so evident.

4.3. Discussion

Based on recent studies that have published methodologies for classification of PQDs, this proposal presents some features that have to be highlighted. Firstly, the present proposal does not require a space transformation unlike other works [15,22,23,24,25,26,27,28,30,31]; as the proposal uses both a PMU scheme based on filters and a time-domain index, low computational resources are required. Secondly, the proposal only uses the H index to classify PQDs, unlike other approaches that compute more than two indices [32,34]. This fact simplifies the proposed methodology, reduces the computational burden, and shows the effectiveness of the H index for detection of PQDs. In [35], similar to the present proposal, periodic or aperiodic disturbances are separated from the nominal voltage signal in the time domain; however, the proposed PMU-based scheme exploits its inherent operation to compute the parameters of the fundamental component in a synchronized way. Synchronization is very important in the subtraction process of the fundamental component. In addition, the advantages of the PMU algorithm under dynamic and steady state conditions are already presented [41]. Finally, in [33], a PQ index based on principal curves is presented. It is a general index that determines how much the voltage signal has deviated from its nominal value according to the kind of disturbance, allowing the classification of PQDs according to the obtained value. Similar to that work, the proposed H index allows determining the kind of PQD presented in the voltage signal, but the fusion with the PMU scheme allows differentiating when some PQDs appear simultaneously, which is desirable in order to apply a proper solution for each kind of disturbance. Although the simultaneous appearance of PQDs in both the fundamental component and the non-fundamental component (a single PQD) is considered in this work, the behavior of the H index for the simultaneous presence (more than one PQD) of notching, spikes, harmonics, and oscillatory transients has to be firstly characterized.

5. Conclusions

In this work, a new method to detect and classify PQDs is presented. It is based on the phasor estimation model for P-class PMUs and the homogeneity approach. The magnitude of the fundamental component, which is estimated by the PMU model, allows the classification of sags, swells, interruptions, and the nominal condition. On the other hand, the homogeneity index allows the classification of notching, spikes, harmonics, and oscillatory transients. In the H index, v = 5 provides the most discriminant information for PQD classification; in fact, non-overlapped intervals from μ − 3σ to μ + 3σ for each disturbance are obtained. These intervals imply data discrimination of approximately 99.7%. As the proposal separates PQDs at the fundamental component (sags, swells, and interruptions) from PDQs at the non-fundamental component (notching, spikes, harmonics, and oscillatory transients), two main advantages arise. On the one hand, the classification task is easier since the different types of PQDs are separated into two groups, requiring fewer features in each group to discriminate them; on the other hand, the correct classification of simultaneous PQDs (sags, swells, or interruptions with notching, spikes, harmonics, or oscillatory transients) is possible. In order to test the proposal, synthetic and real signals are analyzed, where mathematical models and a PDQ generator based on power electronics are used to generate them. It is important to mention that the proposal requires low computational resources to be implemented since it is based on filters and a time-domain index. In addition, the proposal considers a period of the signal as the time window of analysis unlike other studies that consider several periods of the analyzed time window, implying a higher required time resolution for the proposal. The time window is directly determined by the reporting rate of the PMU; in this work, 60 fps is used.
In a future work, a hardware implementation of the proposal will be developed in order to provide an online and real-time monitoring tool. Also, the analysis of combined PQDs at the non-fundamental component using the H index will be explored. Last but not least, the proposal will be also adapted and/or expanded to contribute to other regulations, such as the IEC 61000 series and EN-50160 for PQ measurement methods.

Author Contributions

Conceptualization, J.R.R.-H. and M.V.-R.; Data curation and formal analysis, J.R.R.-H.; Funding acquisition, J.P.A.-S. and D.G.-L.; Methodology, J.R.R.-H, M.V.-R. and J.P.A.-S.; Investigation, Resources and Visualization, D.G.-L., J.F.G.-A. and J.R.-M; Writing – original draft, review & editing, all the Authors.

Funding

This research was funded by the “Consejo Nacional de Ciencia y Tecnología (CONACYT)” and the “Programa para el Desarrollo Profesional Docente (PRODEP), para el tipo Superior de México”.

Conflicts of Interest

The authors declare no conflict of interest.

References

  1. Bollen, M.H.J. What is power quality? Electr. Power Syst. Res. 2013, 66, 5–14. [Google Scholar] [CrossRef]
  2. IEEE Recommended Practice for Monitoring Electric Power Quality; IEEE Standard 1159; IEEE Inc.: Piscataway, NJ, USA, 2009.
  3. Bollen, M.H.; Das, R.; Djokic, S.; Ciufo, P.; Meyer, J.; Rönnberg, S.K.; Zavodam, F. Power quality concerns in implementing smart distribution-grid applications. IEEE Trans. Smart Grid 2017, 8, 391–399. [Google Scholar] [CrossRef]
  4. Granados, D.; Romero, R.; Osornio, A.; Garcia, A.; Cabal, E. Techniques and methodologies for power quality analysis and disturbances classification in power systems: A review. IET Gener. Transm. Distrib. 2011, 5, 519–529. [Google Scholar] [CrossRef]
  5. Leccese, F.; Cagnetti, M.; Di Pasquale, S.; Giarnetti, S.; Caciotta, M. A new power quality instrument based on Raspberry-Pi. Electronics 2016, 5, 64. [Google Scholar] [CrossRef]
  6. Khokhar, S.; Zin, A.; Mokhtar, A.; Pesaran, M. A comprehensive overview on signal processing and artificial intelligence techniques applications in classification of power quality disturbances. Renew. Sustain. Energy Rev. 2015, 51, 1650–1663. [Google Scholar] [CrossRef]
  7. Mahela, O.; Shaik, A.; Gupta, N. A critical review of detection and classification of power quality events. Renew. Sustain. Energy Rev. 2015, 41, 495–505. [Google Scholar] [CrossRef]
  8. Nieto, A.; Vita, V.; Ekonomou, L.; Mastorakis, N. Economic analysis of energy storage system integration with a grid connected intermittent power plant, for power quality purposes. WSEAS Trans. Power Syst. 2016, 11, 65–71. [Google Scholar]
  9. Nieto, A.; Vita, V.; Maris, T. Power quality improvement in power grids with the integration of energy storage systems. Int. J. Eng. Res. Technol. 2016, 5, 438–443. [Google Scholar]
  10. Urbina-Salas, I.; Razo-Hernandez, J.R.; Granados-Lieberman, D.; Valtierra-Rodriguez, M.; Torres-Fernandez, J.E. Instantaneous power quality indices based on single-sideband modulation and wavelet packet-Hilbert transform. IEEE Trans. Instrum. Meas. 2017, 66, 1021–1031. [Google Scholar] [CrossRef]
  11. Liang, X. Emerging power quality challenges due to integration of renewable energy sources. IEEE Trans. Ind. Appl. 2017, 53, 855–866. [Google Scholar] [CrossRef]
  12. Guerrero, J.M.; Loh, P.C.; Lee, T.L.; Chandorkar, M. Advanced control architectures for intelligent microgrids—Part II: Power quality, energy storage, and AC/DC microgrids. IEEE Trans. Ind. Electron. 2013, 60, 1263–1270. [Google Scholar] [CrossRef]
  13. Bollen, M.; Gu, I. Signal Processing of Power Quality Disturbances, 1st ed.; John Wiley & Sons: Hoboken, NJ, USA, 2006; ISBN 13. [Google Scholar]
  14. Valtierra-Rodriguez, M.; Granados-Lieberman, D.; Torres-Fernandez, J.E.; Rodríguez-Rodríguez, J.R.; Gómez-Aguilar, J.F. A new methodology for tracking and instantaneous characterization of voltage variations. IEEE Trans. Instrum. Meas. 2016, 65, 1596–1604. [Google Scholar] [CrossRef]
  15. Camarena-Martinez, D.; Valtierra-Rodriguez, M.; Perez-Ramirez, C.; Amezquita-Sanchez, J.; Romero-Troncoso, R.; Garcia-Perez, A. Novel downsampling empirical mode decomposition approach for power quality analysis. IEEE Trans. Ind. Electron. 2016, 63, 2369–2378. [Google Scholar] [CrossRef]
  16. Siano, P. Demand response and smart grids—A survey. Renew. Sustain. Energy Rev. 2014, 30, 461–478. [Google Scholar] [CrossRef]
  17. Gungor, V.; Sahin, D.; Kocak, T.; Ergut, S.; Buccella, C.; Cecati, C.; Hancke, G. A survey on smart grid potential applications and communication requirements. IEEE Trans. Ind. Inform. 2013, 9, 28–42. [Google Scholar] [CrossRef]
  18. Aminifar, F.; Fotuhi, M.; Safdarian, A.; Davoudi, A.; Shahidehpour, M. Synchrophasor measurement technology in power systems: Panorama and state-of-the-art. IEEE Access 2014, 2, 1607–1628. [Google Scholar] [CrossRef]
  19. Borges, F.; Fernandes, R.; Silva, I.; Silva, C. Feature extraction and power quality disturbances classification using smart meters signals. IEEE Trans. Ind. Inform. 2016, 12, 824–833. [Google Scholar] [CrossRef]
  20. Lekshmana, R.; Padmanaban, S.; Mahajan, S.B.; Ramachandaramurthy, V.K.; Holm-Nielsen, J.B. Meter placement in power system network—A comprehensive review, analysis and methodology. Electronics 2018, 7, 329. [Google Scholar] [CrossRef]
  21. Heydt, G.; Fjeld, P.; Liu, C.; Pierce, D.; Tu, L.; Hensley, G. Applications of the windowed FFT to electric power quality assessment. IEEE Trans. Power Deliv. 1999, 14, 1411–1416. [Google Scholar] [CrossRef]
  22. Barros, J.; Apraiz, M.; Diego, R. A virtual measurement instrument for electrical power quality analysis using wavelets. Measurement 2009, 42, 298–307. [Google Scholar] [CrossRef]
  23. Thirumala, K.; Maganuru, S.; Jain, T.; Umarikar, A. Tunable-Q wavelet transform and dual multiclass SVM for online automatic detection of power quality disturbances. IEEE Trans. Smart Grid 2016, 9, 3018–3028. [Google Scholar] [CrossRef]
  24. Thirumala, K.; Jain, T.; Umarikar, A. Visualizing time-varying power quality indices using generalized empirical wavelet transform. Electr. Power Syst. Res. 2017, 143, 99–109. [Google Scholar] [CrossRef]
  25. Bhende, C.; Mishra, S.; Panigrahi, B. Detection and classification of power quality disturbances using S-transform and modular neural network. Electr. Power Syst. Res. 2008, 78, 122–128. [Google Scholar] [CrossRef]
  26. Uyar, M.; Yildirim, S.; Gencoglu, M. An expert system based on S-transform and neural network for automatic classification of power quality disturbances. Expert Syst. Appl. 2009, 36, 5962–5975. [Google Scholar] [CrossRef]
  27. Li, J.; Teng, Z.; Tang, Q.; Song, J. Detection and classification of power quality disturbances using double resolution S-transform and DAG-SVMs. IEEE Trans. Instrum. Meas. 2016, 65, 2302–2312. [Google Scholar] [CrossRef]
  28. Cho, S.; Jang, G.; Kwon, S. Time-frequency analysis of power-quality disturbances via the Gabor–Wigner transform. IEEE Trans. Power Deliv. 2010, 25, 494–499. [Google Scholar] [CrossRef]
  29. Abdelsalam, A.; Eldesouky, A.; Sallam, A. Characterization of power quality disturbances using hybrid technique of linear Kalman filter and fuzzy-expert system. Electr. Power Syst. Res. 2012, 83, 41–50. [Google Scholar] [CrossRef]
  30. Liu, Z.; Cui, Y.; Li, W. A classification method for complex power quality disturbances using EEMD and rank wavelet SVM. IEEE Trans. Smart Grid 2015, 6, 1678–1685. [Google Scholar] [CrossRef]
  31. Norman, C.; Chan, J.; Lau, W.; Lai, L. Hybrid wavelet and Hilbert transform with frequency-shifting decomposition for power quality analysis. IEEE Trans. Instrum. Meas. 2012, 61, 3225–3233. [Google Scholar] [CrossRef]
  32. Zhang, M.; Li, K.; Hu, Y. A real-time classification method of power quality disturbances. Electr. Power Syst. Res. 2011, 81, 660–666. [Google Scholar] [CrossRef]
  33. Ferreira, D.; Seixas, J.; Cerqueira, A.; Duque, C.; Bollen, M.; Ribeiro, P. A new power quality deviation index based on principal curves. Electr. Power Syst. Res. 2015, 125, 8–14. [Google Scholar] [CrossRef]
  34. Martinez, G.; Morinigo, D.; Zorita, A.; Morales, L.; Romero, R. FPGA-based smart sensor for detection and classification of power quality disturbances using higher order statistics. IEEE Access 2017, 5, 14259–14274. [Google Scholar] [CrossRef]
  35. Moreno, R.; Visairo, N.; Núñez, C.; Rodríguez, E. A novel algorithm for voltage transient detection and isolation for power quality monitoring. Electr. Power Syst. Res. 2014, 114, 110–117. [Google Scholar] [CrossRef]
  36. Ai, Q.; Zhou, Y.; Xu, W. Adaline and its application in power quality disturbances detection and frequency tracking. Electr. Power Syst. Res. 2007, 77, 462–469. [Google Scholar] [CrossRef]
  37. Janik, P.; Lobos, T. Automated classification of power-quality disturbances using SVM and RBF networks. IEEE Trans. Power Deliv. 2006, 21, 1663–1669. [Google Scholar] [CrossRef]
  38. Hooshmand, R.; Enshaee, A. Detection and classification of single and combined power quality disturbances using fuzzy systems oriented by particle swarm optimization algorithm. Electr. Power Syst. Res. 2010, 80, 1552–1561. [Google Scholar] [CrossRef]
  39. Mahela, O.; Shaik, A. Recognition of power quality disturbances using S-transform based ruled decision tree and fuzzy C-means clustering classifiers. Appl. Soft Comput. 2017, 59, 243–257. [Google Scholar] [CrossRef]
  40. Reddy, M.; Sodhi, R. A rule-based S-transform and AdaBoost based approach for power quality assessment. Electr. Power Syst. Res. 2016, 134, 66–79. [Google Scholar] [CrossRef]
  41. IEEE Std C37.118.1-2011. In IEEE Standard for Synchrophasor Measurements for Power Systems; IEEE Inc.: New York, NY, USA, 2011.
  42. Khokhar, S.; Zin, A.; Memon, A.; Mokhtar, A. A new optimal feature selection algorithm for classification of power quality disturbances using discrete wavelet transform and probabilistic neural network. Measurement 2017, 95, 246–259. [Google Scholar] [CrossRef]
  43. Rodriguez, M.; Carranza, R.; Osornio, R.; Romero, R. A novel methodology for modeling waveforms for power quality disturbance analysis. Electr. Power Syst. Res. 2017, 143, 14–24. [Google Scholar] [CrossRef]
  44. Lee, Y.; Song, H. Decentralized load shedding method based on voltage stability margin index using synchrophasor measurement technology. Electronics 2018, 7, 277. [Google Scholar] [CrossRef]
  45. Razo-Hernandez, J.R.; Valtierra-Rodriguez, M.; Granados-Lieberman, D.; Tapia-Tinoco, G.; Rodriguez-Rodriguez, J.R. A phasor estimation algorithm based on Hilbert transform for P-class PMUs. Adv. Electr. Comput. Eng. 2018, 18, 97–104. [Google Scholar] [CrossRef]
  46. Unser, M. Sum and difference histograms for texture classification. IEEE Trans. Pattern Anal. Mach. Intell. 1986, 1, 118–125. [Google Scholar] [CrossRef]
  47. Lizarraga, R.; Rodriguez, C.; Cabal, E.; Lopez, M.; Ledesma, L.; Ferrucho-Alvarez, E. Novel FPGA-based methodology for early broken rotor bar detection and classification through homogeneity estimation. IEEE Trans. Instrum. Meas. 2017, 7, 1760–1769. [Google Scholar] [CrossRef]
  48. Mejia-Barron, A.; Valtierra-Rodriguez, M.; Granados-Lieberman, D.; Olivares-Galvan, J.; Escarela-Perez, R. The application of EMD-based methods for diagnosis of winding faults in a transformer using transient and steady state currents. Measurement 2018, 117, 371–379. [Google Scholar] [CrossRef]
Figure 1. Phasor measurement model.
Electronics 07 00433 g001
Figure 2. Homogeneity: (a) time-constant signal and (b) time-varying signal.
Electronics 07 00433 g002
Figure 3. (a) Proposed methodology, (b) threshold-based rules for PQDs at the fundamental component, and (c) threshold-based rules for PQDs at the non-fundamental component.
Electronics 07 00433 g003
Figure 4. Homogeneity results: (a) notching/spikes, (b) oscillatory transient, (c) harmonics, (d) homogeneity index (H) for notch/spike, (e) H for oscillatory transient (OT), (f) H for harmonics, (g) H values for PQDs, and (h) probability density functions.
Electronics 07 00433 g004
Figure 5. (a) Synthetic signal, (b) magnitude tracking, (c) constructed signal for the fundamental component, and (d) H tracking.
Electronics 07 00433 g005
Figure 6. (a) Experimental setup and (b) electric circuit.
Electronics 07 00433 g006
Figure 7. Real signals: (a) Notching, (b) Sag + Oscillatory transient, and (c) Sag + Harmonics + Swell.
Electronics 07 00433 g007
Table 1. H values for PQDs.
PQDμσ
Harmonic0.11240.0405
Oscillatory transient (OT)0.54390.1089
Notching/Spike0.98090.0186
Table 2. Confusion matrix for synthetic signals.
WaveformNominal ConditionSagSwellInterruptionOscillatory TransientHarmonicsNotchingSpikes
Nominal condition1000000000
Sag099010000
Swell0010000000
Interruption010990000
Oscillatory transient000099100
Harmonics0000010000
Notching000000982
Spikes000000199
Table 3. Results for real signals.
One PQD
SagSwellInterruptionOscillatory TransientHarmonicsNotchingSpikes
5/55/55/55/55/54/56/5
Two PQDs
Oscillatory TransientHarmonicsNotchingSpikes
Sag + 5/55/55/55/5
Swell + 5/55/55/55/5
Interruption +5/55/53/57/5

