Is Window-Dressing around Going Public Beneficial? Evidence from Poland


Department of Corporate Finance, Poznań University of Economics and Business, al. Niepodległości 10, 61-875 Poznań, Poland
*
Author to whom correspondence should be addressed.
J. Risk Financial Manag. 2019, 12(1), 18; https://doi.org/10.3390/jrfm12010018
Submission received: 13 December 2018
/
Revised: 8 January 2019
/
Accepted: 18 January 2019
/
Published: 21 January 2019
(This article belongs to the Special Issue Empirical Finance)
Abstract
:The informativeness of financial reports has been of a great importance to both investors and academics. Earnings are crucial for evaluating future prospects and determining company value, especially around milestone events such as initial public offerings (IPO). If investors are misled by manipulated earnings, they could pay too high a price and suffer losses in the long-term when prices adjust to real value. We provide new evidence on the relationship between earnings management and the long-term performance of IPOs as we test the issue with a methodology that has not been applied so far for issues in Poland. We use a set of proxies of earnings management and test the long-term IPO performance under several factor models (CAPM, and three extensions of the Fama-French model). Aggressive IPOs perform very poorly later and earn severe negative stock returns up to three years after going public. The difference in returns in accrual quantiles is statistically significant in almost half of methodology settings. The results seem to suggest that investors might not be able to discount pre-IPO abnormal accruals and could be overoptimistic. Once the true earnings performance is revealed over time, the market makes downward price corrections.
1. Introduction
Financial statements are a very important source of information for stakeholders. Businesses are expected to follow numerous accounting standards and rules in the process of recording activities and transactions properly. Managers are given discretion to some extent in reporting a company’ situation. Managerial discretion in reporting has both benefits and disadvantages. Managers should use their unique knowledge to make financial statements more informative. However, managers may also use their judgment in reporting to mislead other stakeholders. Following a high information asymmetry between issuers and investors of initial public offering (IPO) companies at the time of the going public, investors rely heavily on financial statements. Simultaneously, IPO firms have an opportunity to manage earnings as usually little is known about market newcomers. They also have incentives to do so as the moment of going public is a very important event that attracts a lot of attention.
The key objective of this research is to assess whether the long-term performance of initial public offerings in Poland differs systematically according to the magnitude of around-the-issue earnings management. Previously published studies on Polish IPOs reported results using the event-time approach, according to the buy-and-hold abnormal returns (BHAR) or cumulative abnormal returns (CAR). They have been both very popular measures of the long-term performance. Fama (1998) and other researchers (Barber and Lyon 1997; Lyon et al. 1999; Jegadeesh and Karceski 2009) point out the deficiencies of the event-time approach such as skewness bias, violations in cross-sectional independence, or re-balancing bias. Our study is the first one that discusses the relationship between earnings management and the long-term IPO performance in Poland with the alternative methodology, namely the calendar-time portfolio approach. The method that we apply is mentioned by many researchers as mitigating many statistical problems arising in long-term event studies. Given the general lack of evidence on explanations of long-term abnormal returns with the calendar-time portfolio based on the opportunistic earnings management behavior for the Polish capital market, this is the area where this study contributes to the existing literature as it provides international insights into the discussion. Poland is an important area of economic growth in Europe which inclines academics to address many financial issues and makes possible conclusions important. The results of the long-term implications of earnings management for IPOs in Poland are not obvious. First, it is because of the theoretical background that is briefly summarized in the paper. Second, Poland has different characteristics to other markets. This country has undertaken a long journey of economic liberalization since the transition of its economy. During the period we examine, it has been classified as an emerging market by all of the leading agencies. Just recently, though, it has been ranked by FTSE Russell as a developed market. The uniqueness of studies on an emerging market that transforms into a developed economy, is a strong and motivating argument for taking empirical research. This is the only way to uncover mechanisms of capital markets based on the fact that direct comparison with US-centered research is limited. Although Poland is the eighth largest economy in the European Union (EU) and the largest among Central and Eastern European countries in the EU, Polish companies’ capitalization is much smaller in comparison to US stock markets. It has deep consequences for a methodology of empirical research as many methodological solutions have been proposed for the US, which is an incomparably larger market. Applying these solutions to much smaller markets encounters numerous practical problems. This paper is one of the pieces of the research stream that touches the uniqueness of less-developed economies and faces the difficulty of methodological issues for small capital markets. All of these arguments taken together make the research on the long-term implications of earnings management for Polish IPOs challenging and contributing to the existing literature. Under the overoptimism hypothesis, we expect that the greater the earnings management level around the time of the issue, the larger the long-term price correction.
Both earnings management and abnormal long-term market performance of IPOs cannot be measured directly so they are observed with proxies. We proxy for earnings management using discretionary accruals. Factor regressions produce intercepts for rolling IPO portfolios that proxy for abnormal long-term performance. As alternative methodologies suffer from different types of biases as well as have their strong points, we provide a broad set of robustness checks. Accruals are estimated as the difference between real accruals and non-discretionary accruals where the latter are estimated using the cross-sectional industry-year regressions under the Jones model (Jones 1991), the modified Jones model (Dechow et al. 1995), the McNichols model (McNichols 2000), and Ball–Shivakumar model (Ball and Shivakumar 2006). We also apply a broad set of asset pricing models to assess the long-term performance. Empirically, we start with the Capital Asset Pricing Model (Sharpe 1964; Lintner 1969), and extend the analysis of long-term abnormal performance with estimating monthly risk premiums under three multifactor models: the Fama-French three-factor model (Fama and French 1993), the Carhart four-factor model (Carhart 1997), and the latest innovation—namely, the Fama-French five-factor model (Fama and French 2015, 2016).
Our results show strong long-term underperformance of initial public offerings in Poland using the calendar-time portfolio approach. Alphas are statistically and economically significant for both low- and high-accrual IPO firms. Both, conservative and aggressive IPO companies experience a relative decline in market value in the long run. The magnitude of IPO negative returns is sensitive to the methodology, but it does not change the conclusions about long-term IPO underperformance. Annualized abnormal returns range from −8.2% to −13.7% for conservative IPO companies, whereas the span for aggressive IPO companies is from −12.1% up to even −20.5%. Importantly, we report that more conservative IPO firms outperform firms that managed their earnings more aggressively. The average difference between quantiles totals 5.9 percentage points annually, and it ranges from 2.0 percentage points annually up to even 10.4 percentage points per year. Average annualized alphas for conservative IPO firms equals −10.2%, whereas it is −16.1% for aggressive IPO firms. The average abnormal returns are much more negative for the aggressive IPO companies and this difference is statistically significant in almost half of methodology settings. The rest of the paper is organized as follows. Section 2 gives a brief discussion of the existing literature. Section 3 briefly describes the data sources, details earnings management proxies and methods of the long-run performance measures. Section 4 contains descriptive statistics and a short risk premium presentation. Section 5 presents evidence on the explanatory power of earnings management for the long-term abnormal performance and offers tests for robustness of results. Section 6 discusses the empirical results in the light of the existing comparable evidence on other markets and outlines future research. The last section concludes the paper.
2. Brief Theoretical Background
The question of earnings management has not been constrained solely to equity issues. Proxies of earnings management have been applied to a broad set of issues in finance which argues for the importance of earnings management for many company activities (Healy 1985; Liberty and Zimmerman 1986; McNichols and Wilson 1988; Jones 1991; Pourciau 1993; DeFond and Jiambalvo 1994; Gaver et al. 1995; Holthausen et al. 1995; Perry and Williams 1994; Teoh et al. 1998b).
The choice whether to manage or not to manage earnings when a firm is planning to sell its shares to the market for the first time is not obvious. The issue of earnings management relates to two opposite hypotheses. The first one is connected with the opportunism of IPO issuers. The second theory relates to the expected enhanced reporting quality of public companies together with regulatory limits on discretion, penalties for misreporting, or greater external monitoring.
Analyzing the importance of earnings to investors, Sloan (1996) suggests that the cash flow component may be underweighted and the accrual component may be overweighted. If an IPO firm engages in increasing earnings around going public and investors are not able to recognize the true information content of earnings as indicators of future prospects, they will raise stock prices at issue. In the long-term, when the real performance is revealed and information asymmetries between the issuer and its investors are lower, the market is expected to adjust the IPO prices down. This is one of the possible explanations for the long-term underperformance observed for the US IPOs, as well as other developed markets or emerging markets.
Reported earnings consist of cash flows and accruals. Accruals are defined as accounting adjustments to cash flows. If earnings are artificially boosted around going public, it is much easier to proceed with the accrual part than with real cash changes, which justifies accruals as a measure of earnings manipulation. According to different ideas behind the income statement and cash flow statement, earnings usually differ from cash flows. Following this, accruals appear as a natural consequence of this. However, not all the accruals have the same degree of managerial discretion. This inclines us toward decomposing accruals, as in Jones (1991). Some accruals are normal to company activities or are exposed to limited managerial discretion. They are non-discretionary components (normal or expected accruals). The discretionary part of accruals (abnormal accruals) proxies for the earnings manipulation level as these accruals are considered to have been the ‘managed’ part of the earnings.
Previous papers suggest that IPO companies manage their earnings for the moment of going public, and usually conclude that companies managing their accruals aggressively also experience strong long-term underperformance (Teoh et al. 1998a; DuCharme et al. 2001; Roosenboom et al. 2003; Chen et al. 2005; Pastor-Llorca and Poveda-Fuentes 2011; Ahmad-Zaluki et al. 2011; Xie 2001; Chan et al. 2001). However, Beneish (1998) questions systematic investor valuation errors based on inflated earnings. Along the same lines, Ball and Shivakumar (2005), Ball and Shivakumar (2006) and Ball and Shivakumar (2008) argue in favor of more conservative reporting by public companies.
The research on the links between earnings management and subsequent IPO performance in Poland is scant. Lizińska and Czapiewski (2018a) used the buy-and-hold approach and reported that more aggressive IPOs performed poorly in the long run. However, the difference in the long-term abnormal returns between firms with lower and higher discretionary accruals was not robust in all settings of methodology. Lizińska and Czapiewski (2018b) combined earnings quality around going public with the long-term price behavior and tested the puzzle with OLS regressions based on the BHAR approach. Robustness tests allowed for a conclusion that the long-term buy-and-hold abnormal returns of initial public offerings completed before the peak of the crisis were negatively related to earnings management around IPO date.
3. Sources of Data and Methodology
The research sample covers initial public offerings listed on the Warsaw Stock Exchange (WSE) from January 2002 to December 2014. We include only offerings from the main equity market, and those without prior quotation on alternative markets. The sample covers only issues with a new common stock issuance. Delisted companies are included both in the IPO sample and in the benchmark sample. Initial public offerings are restricted to the non-financial industry.
The data are derived from Notoria Serwis, the official site of the WSE and InfoStrefa.com. Market returns for companies are based on adjusted close prices and they include dividends, splits and pre-emptive rights. The list of IPOs ends in 2014 but the market data cover a longer period as it was necessary to calculate long-term adjusted returns.
The aim of the research relates to the extent to which earnings management is related to the subsequent long-term abnormal market performance of IPO firms in Poland. As none of this can be observed directly, we rely on proxies. Both, the estimates of earnings management and long-term performance have been much debated in the literature. We do not aim to expand the methodology in this research, but apply a broad set of methodology settings derived from the existing literature. The empirical modelling encompasses five time-consuming steps: earnings management proxy estimation, ranking of IPOs according to aggressive or conservative earnings management, risk premiums estimation for a set of asset pricing models, estimation of the measure of long-term risk-adjusted IPO performance according to the calendar-time portfolio approach in accrual quantiles, and estimation of an equivalent regression of the difference in intercepts between the aggressive and conservative IPOs.
In this research, the level of earnings manipulation is estimated with accrual-based methods. It is much easier to manage profits with the accrual part of earnings than with real cash changes. It is a strong argument to use accruals as a measure of earnings manipulation. We run cross-sectional regressions for every industry and every year to assess the non-discretionary part of accruals (NDACC). In the next step, we relate them to real accruals to get the discretionary part (DACC), which is an earnings manipulation estimator. Real accruals reflect the accounting meaning of adjustments and are composed of non-cash current assets change, change in current liabilities, and depreciation. A prerequisite for running industry-year regression is a minimum industry size of five companies. An embargo of two years is imposed on an IPO firm which excludes each IPO from the benchmark group for other IPO companies during this period. Cross-sectional regressions allow us to incorporate changes in economic conditions that affect a particular industry. Accruals, as well as their components, are scaled with lagged assets (A) to reduce heteroscedasticity in residuals for accruals and their components (Ronen and Yaari 2008).
We use set of accrual-based earnings management proxies. First, we use the Jones model (Jones 1991) which assumes that the level of expected accruals is largely determined by gross property, plant, and equipment (PPE) and change in revenues (ΔREV) as in the following equation
Dechow et al. (1995) extended the Jones model and proposed a modified version. They included the change in trade receivables (ΔREC) to account for the possibility of credit sales manipulation by inducing sales in certain periods without real money inflows. Thus, increases in trade receivables are excluded from the change in revenues as in the equation
We also consider other improvements to the Jones model. The Dechow and Dichev (2002) model, in the version proposed by McNichols (2000), considers extensions of the Jones model by current, past, and future cash flow from operating activities (CFO)
Ball and Shivakumar (2006) incorporate timely loss recognition in the accruals estimation process. They include DCFO which is 1 if the change in cash flows is less than zero, and 0 otherwise, and a book value of fixed assets (FASSET)
In the next research step, we rank initial public offerings by discretionary accruals into two quantiles: conservative for the smallest abnormal accruals (C) and aggressive for largest discretionary accruals (A) as in Ahmad-Zaluki et al. (2011). The ranks are given independently for each of the earnings management proxies. Next, portfolios of aggressive or conservative IPO are constructed on the basis of IPOs that went public within the past 36 months, with monthly rebalancing.
In the main research step, we estimate the long-term abnormal performance across accrual quantiles. Long-term risk-adjusted performance of IPOs is estimated according to a calendar-time portfolio approach. Given the concerns about proper measure, we use a variety of methodological settings. Thus, we deliver a broad set of robustness checks. We use the explanation for the cross-section of average returns steaming from the capital asset pricing model (Sharpe 1964; Lintner 1969), Fama and French (1993) three-factor model, the Carhart (1997) four-factor model, and the Fama and French (2015) five-factor model (CAPM, 3FF, 4C, and 5FF, hereafter).
The first model used in the study is the CAPM. Jensen’s alpha is given by the relationship between excess return and beta
where is the calendar time portfolio return, is the risk-free rate calculated with WIBOR, is the monthly market return based on the stock market index (Warsaw Stock Index, WIG), and is the error term.
Next, the estimate of alpha is derived from the Fama and French (1993) three-factor model
where is the difference in returns between portfolios of small and big companies, and is the average return on the two value portfolios minus the average return on the two growth portfolios.
As an additional check, an intercept is estimated according to the Carhart (1997) four-factor model as in
where is the average return on the two high prior return portfolios minus the average return on the two low prior return portfolios.
The last measure of abnormal performance is the intercept in the Fama and French (2015) five-factor model
where is the average return on the two robust operating profitability portfolios minus the average return on the two weak operating profitability portfolios, and is the average return on the two conservative investment portfolios minus the average return on the two aggressive investment portfolios.
We estimate monthly risk premiums for factor models by monthly intervals. Each monthly regression produces an intercept (alpha) which serves us as the abnormal long-term performance measure. Testing intercepts in accrual quantiles, allows us to discuss the relationship between the long-term abnormal IPO performance in Poland and the extent of earnings management proxied by discretionary accruals. Finally, we again run equivalent monthly factor regressions of the difference in alphas between aggressive and conservative initial public offerings. We estimate these regressions in all of the methodology settings to check the robustness of the results.
4. Descriptive Statistics and Risk Premiums
IPO activity fluctuated highly during the sample period. The peak number of initial public offerings in 2007 just before the financial crisis was followed by an enormous drop in equity issuance in the following years. Although the market conditions started to recover with the beginning of 2009, and Warsaw Stock Exchange Index (WIG Index) quotations improved substantially, IPO activity remained relatively weak. The illustration of these changes is included in Figure 1.
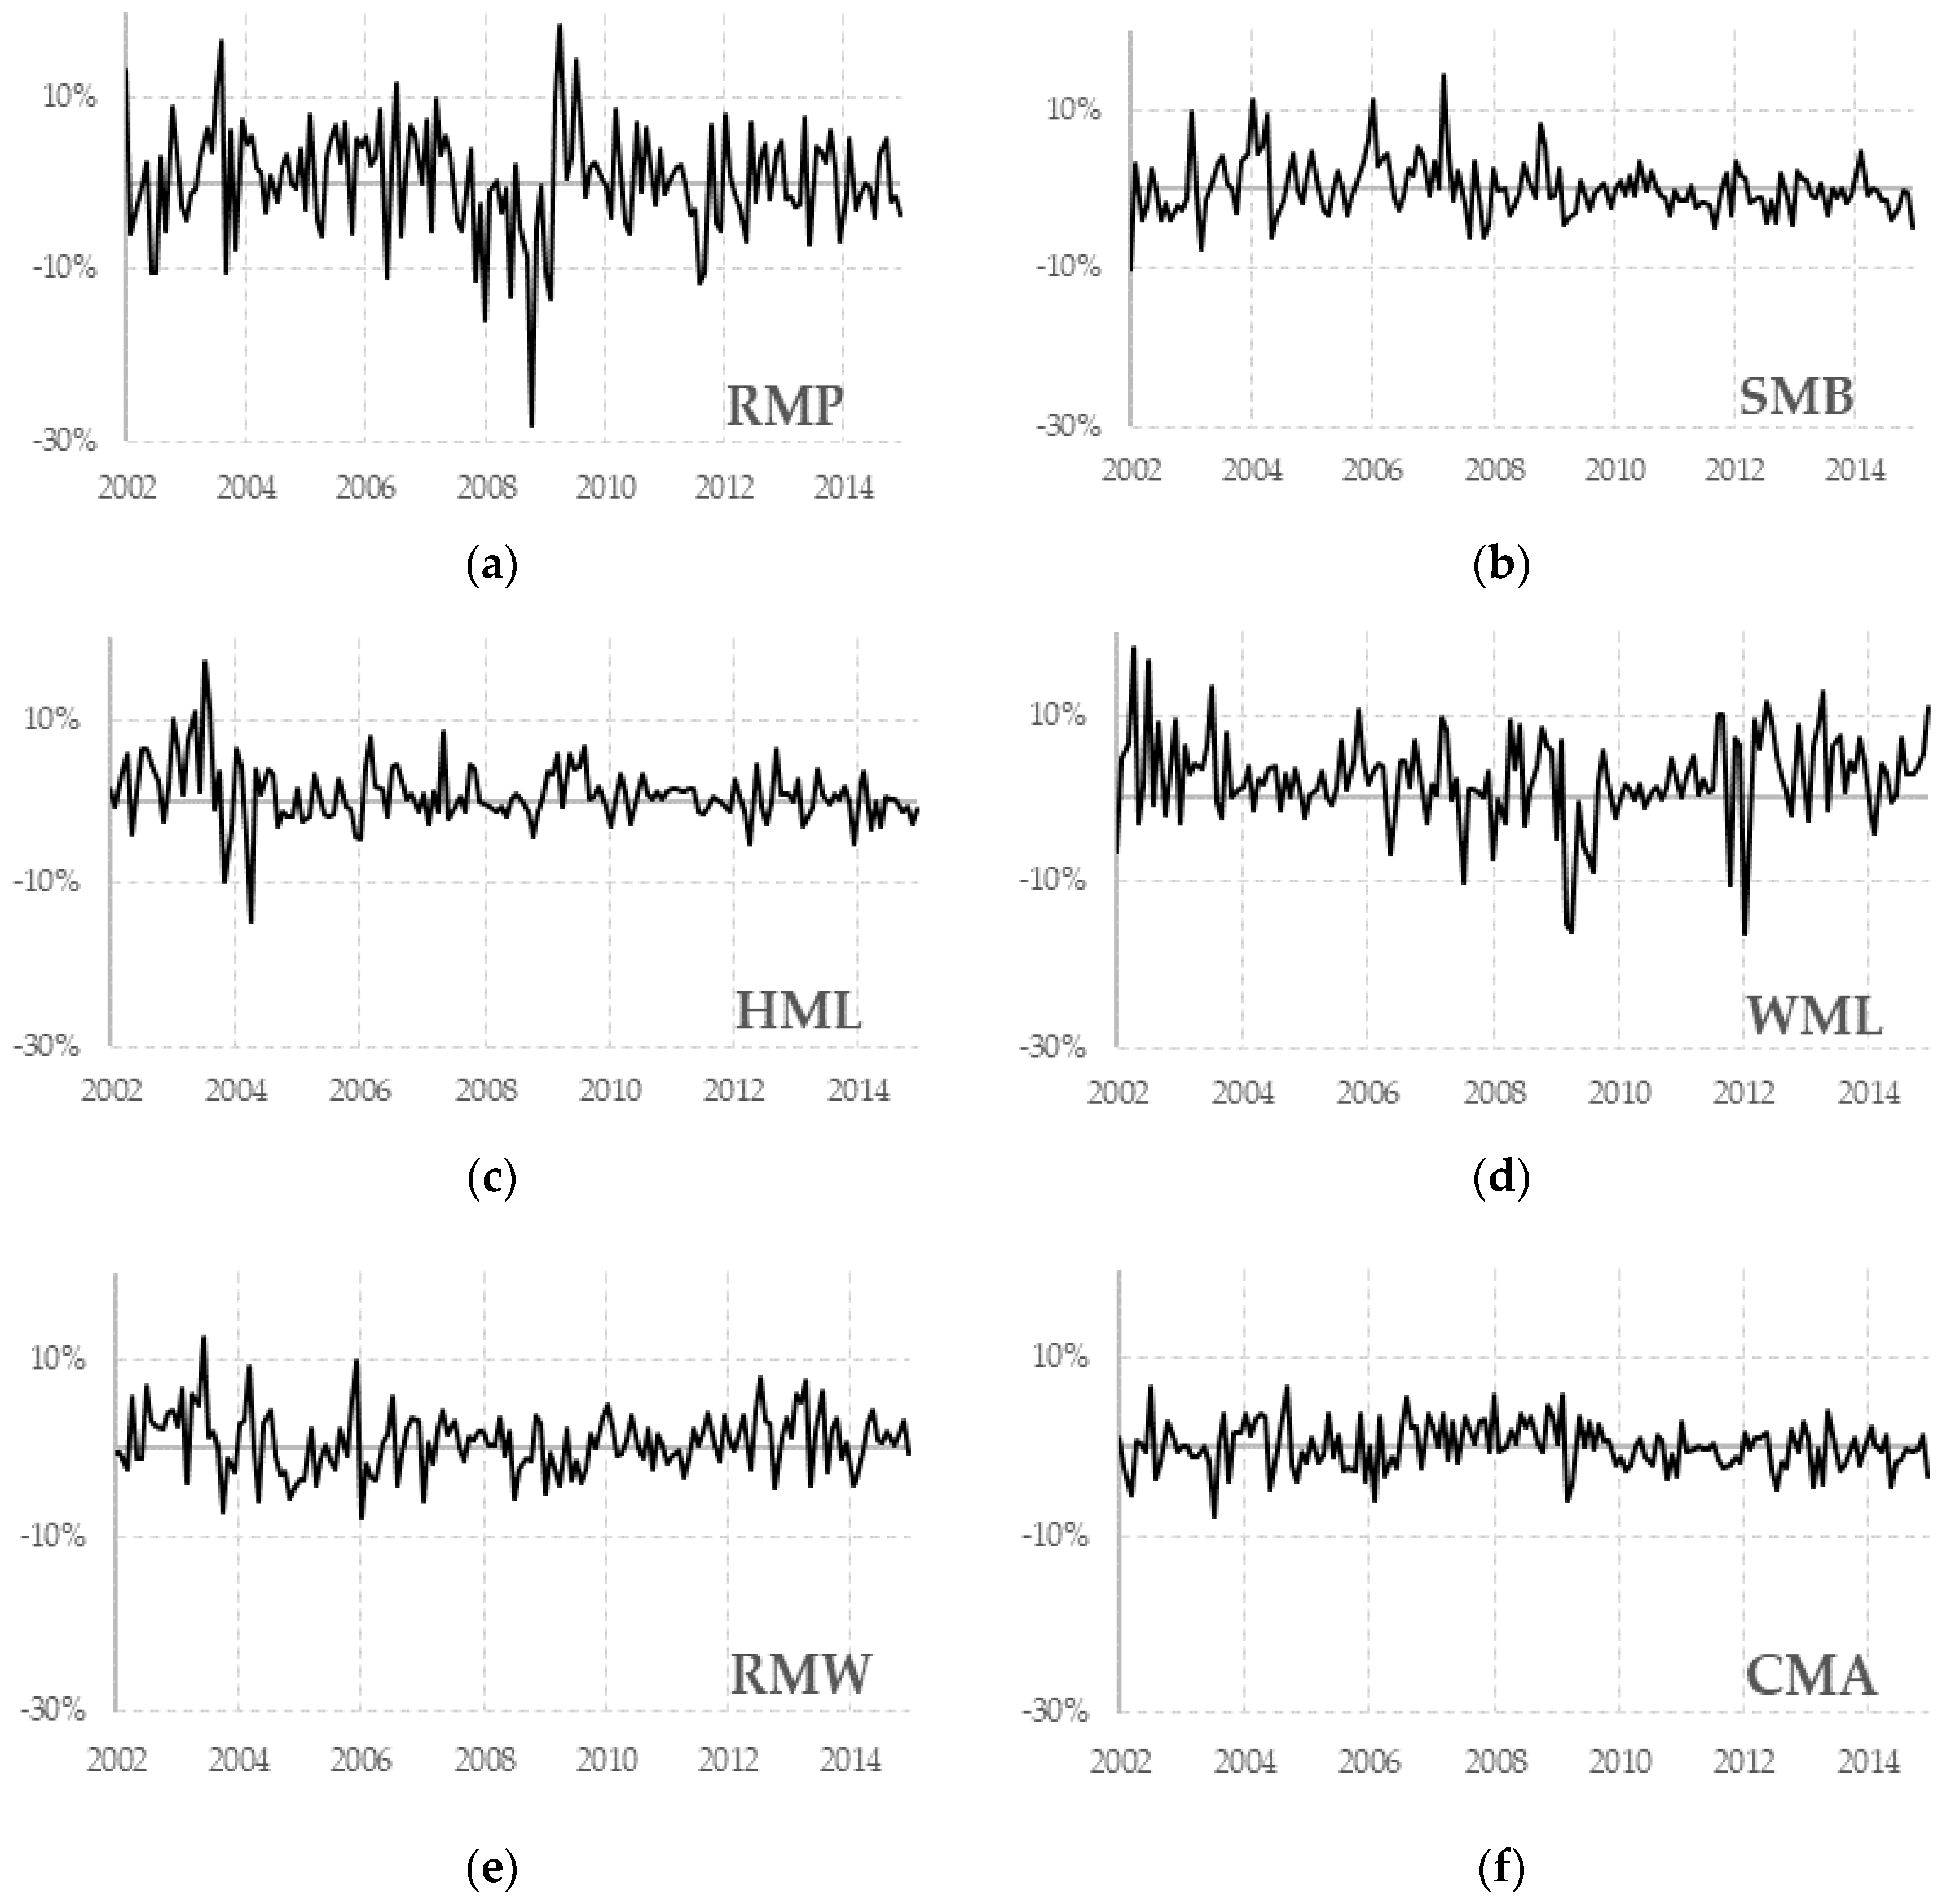
The changes in the general situation on the WSE also resulted in changes in risk premiums. We illustrate these changes with Figure 2, where part (a) presents changes of the risk market premium (RMP), part (b) describes the performance of small stocks relative to big stocks (SMB, small-minus-big risk premium), part (c) illustrates the performance of value stocks relative to growth stocks (HML, high-minus-low risk premium), part (d) presents the momentum factor (WML, winners-minus-losers risk premium), part (e) is connected with the profitability factor (RMW, robust-minus-weak risk premium), and part (f) reflects the investment factor (CMA, conservative-minus-aggressive risk premium).
Descriptive statistics are detailed in Table 1. Prior to the initial public offering, the sample firms have much lower assets in comparison to other non-financial companies listed on the WSE. While the difference measured with the mean is not so pronounced, the difference in the median values is really huge, as IPO companies were 20 times smaller than already listed non-financial companies. When we look at the median values, IPO firms almost doubled their total assets on average in the year of going public. Significant differences in size between IPO firms and already listed firms are also reported for revenues. IPO companies used the leverage to a similar extent before going public as already listed non-financial companies. However, after additional equity issuance, the leverage of IPO companies dropped substantially. IPO companies were also much more profitable around going public. Net and operating profitability before going public was substantially higher in comparison to average profitability of already listed non-financial companies. A drop in profitability of assets and equity in the year of going public is not a surprise. An additional equity financing received at IPO rarely converted into earnings immediately in the same year and probably had long-term consequence for profitability. The high relative profitability of IPO firms could be a result of high accruals around going public. If earnings are overstated above cash flows, questions about the long-term market implications of around-the-issue earnings manipulation arise.
5. Earnings Manipulation and Calendar-Time Portfolio Returns: Empirical Results
We examine whether the long-term performance of IPOs in Poland differs systematically according to the magnitude of earnings management. We rank IPOs by their abnormal accruals and test long-term market performance. We repeat the multi-step procedure in sixteen alternative methodology settings of the calendar-time portfolio approach.
IPOs are partitioned into accrual quantiles using the median value of discretionary accruals. We use the Jones model, the modified Jones model, the McNichols model, and the Ball–Shivakumar model (Table 2, Table 3, Table 4 and Table 5, respectively). Factor regressions are estimated each month for 36-month rolling portfolios in IPO quantiles based on four accrual methods (independently). A low level of abnormal accruals proxies for conservative earnings management (C) and high level of abnormal accruals represents aggressive IPO issuers (A).
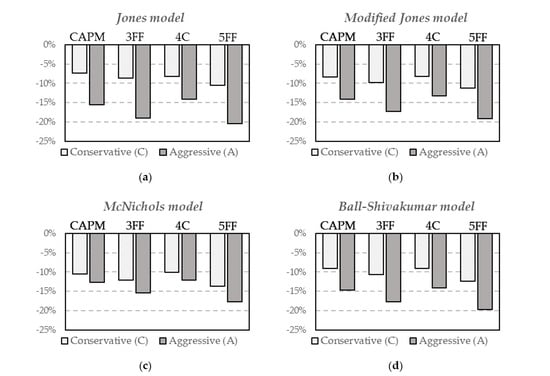
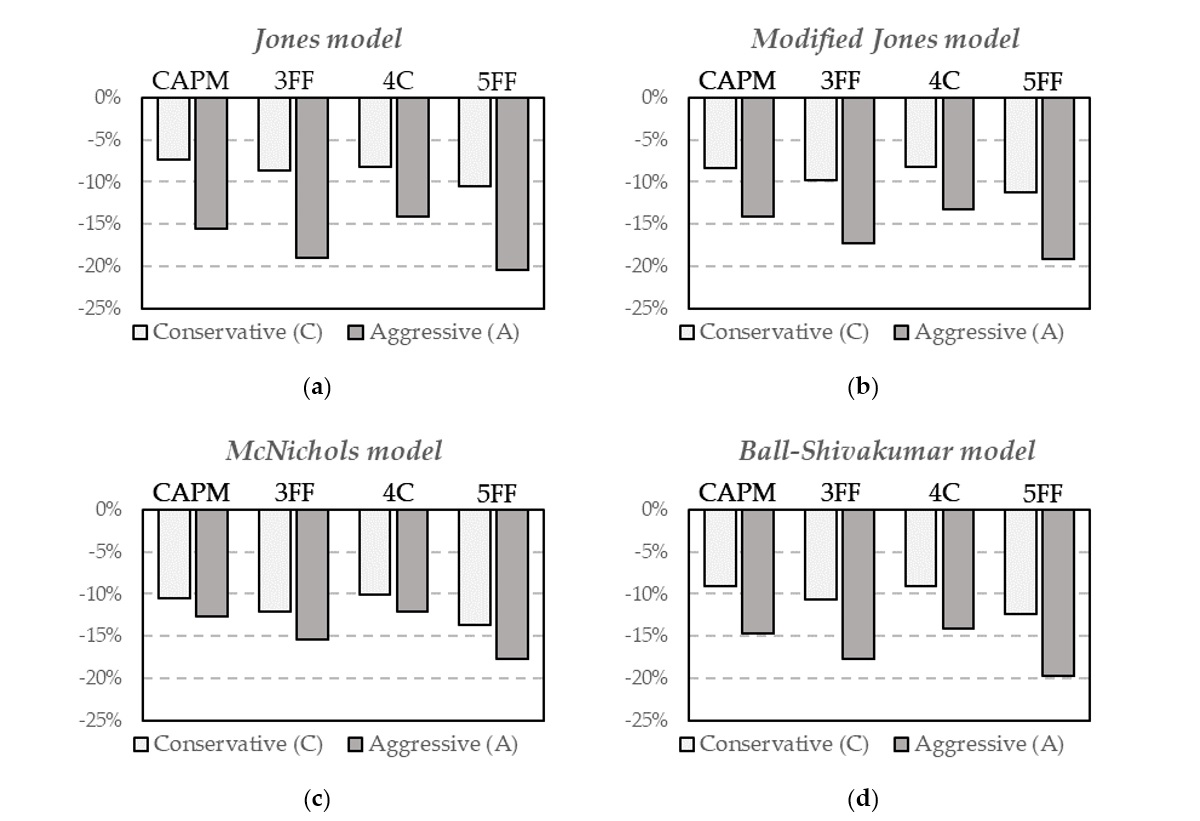
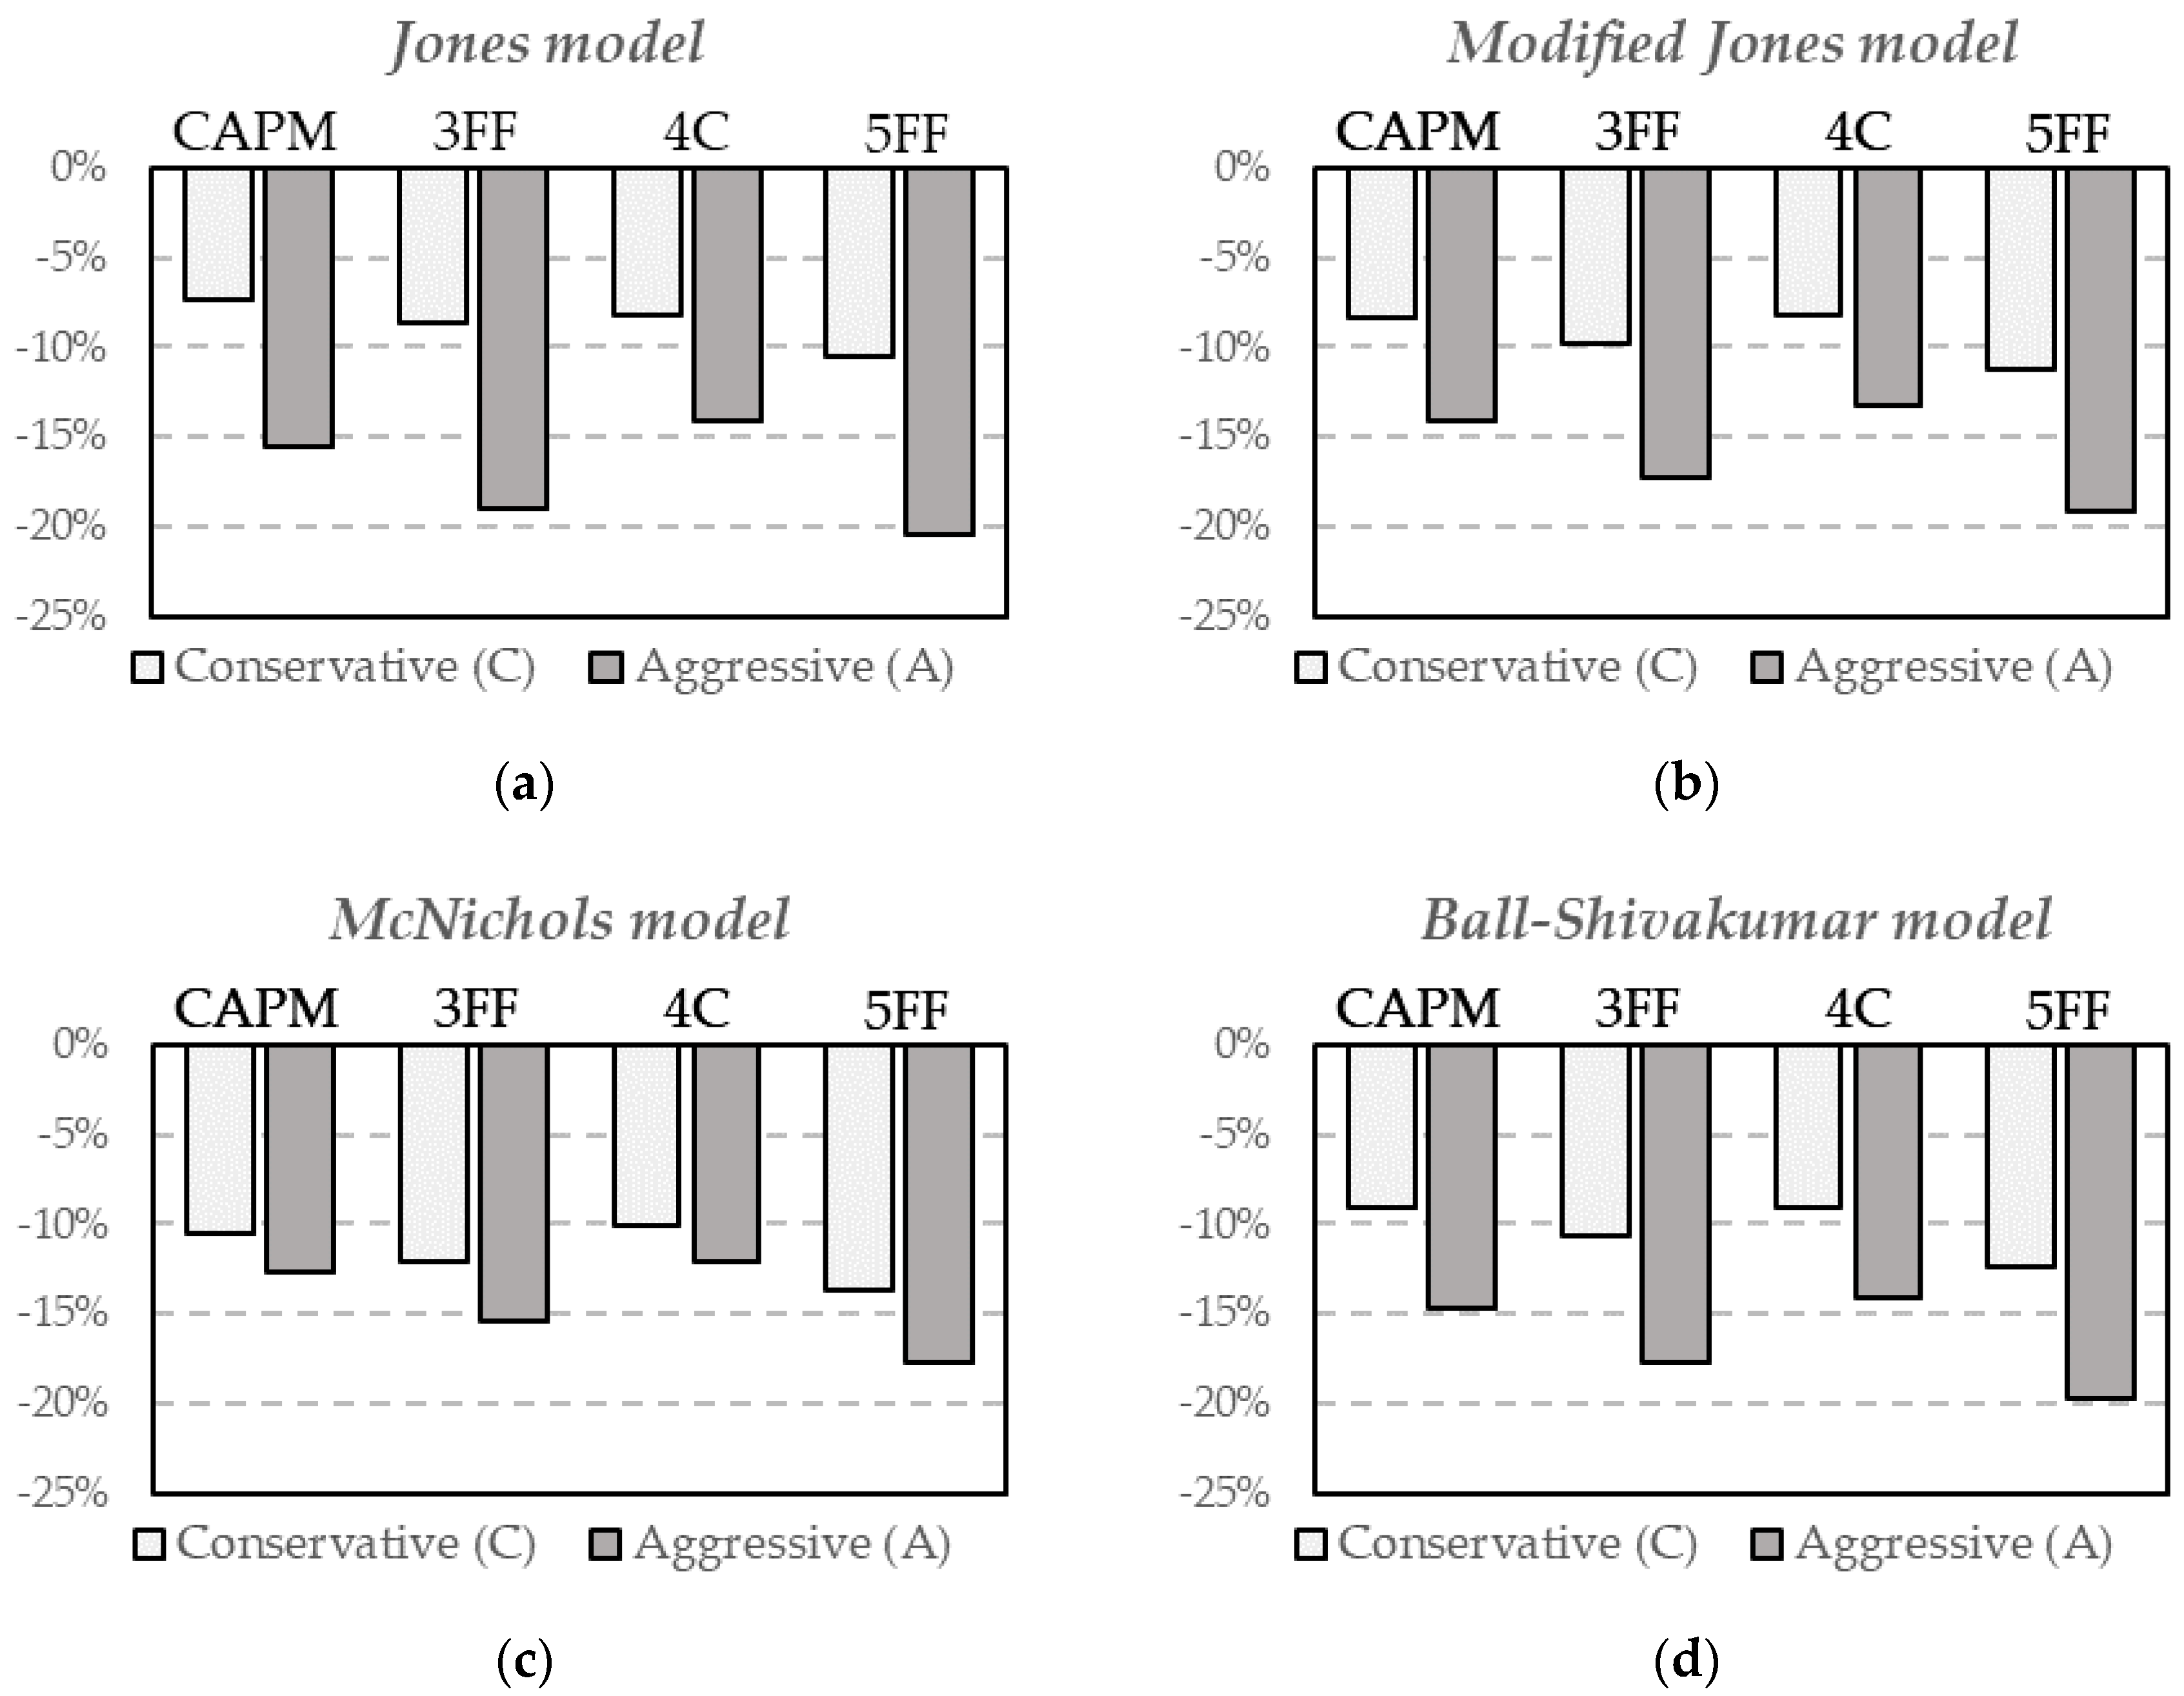
Next, we estimate factor regressions on conservative and aggressive accrual IPO quantiles, separately. For robustness, we apply the CAPM model, the Fama-French three-factor model, the Carhart four-factor model, and the Fama-French five-factor model (CAPM, 3FF, 4C, and 5FF, respectively). The dependent variable is a portfolio return in excess of the risk-free rate. Intercepts in calendar-time portfolio regressions for IPO quantiles are interpreted as a monthly measure for long-term abnormal performance. The detailed results of factor regressions according to four models are presented sequentially in four contiguous pairs (for conservative and aggressive IPOs) columns in Panel A of Table 2, Table 3, Table 4 and Table 5. The annualized abnormal returns for the conservative and aggressive IPO issuers are illustrated on Figure 3. The results of the estimation of an equivalent regression of the difference in intercepts between the aggressive and conservative IPOs are detailed in Panel B of Table 2, Table 3, Table 4 and Table 5.
In this section, we provide robustness check of empirical testing of the relationship between the level of abnormal accruals and the long-term risk-adjusted returns. Intercepts are statistically and economically significant for both low- and high-accrual IPO firms. Both, conservatively and aggressively earnings managed companies experience a relative decline in market value in the long run. Even if the magnitude of IPO long-term underperformance is sensitive to the methodology, it does not change the fact of negative returns in the prevailing number of methodology settings. The intercepts are statistically and economically significant for both low- and high-accrual IPO firms in all of the settings, except for accruals based on the Jones model in the conservative quantile.
More conservative IPO firms outperform more aggressive firms. The average difference between quantiles totals 5.9 percentage points annually and it ranges from 2.0 percentage points annually up to even 10.4 percentage points per year. Conservative IPO firms experience less severe average underperformance in the long-tun proxied with an intercept in factor regression and calendar-time approach. The average annualized intercepts for low-accrual IPOs range from −8.2% up to −13.7% with average underperformance of −10.2%. Otherwise, companies managing their earnings more aggressively report much more negative returns after going public. High-accrual companies earn large negative stock returns. The poor long-term performance of aggressive IPO companies ranges from −12.1% up to as much as −20.5% annually with an average annualized intercept totaling −16.1%. Severe long-term abnormal returns of aggressive IPOs are robust to asset pricing model choices. The difference in the abnormal long-term performance is statistically significant in almost half of 16 methodology settings (four ways of IPOs partitioning based on alternative accrual models and four alternative factor regressions).
6. Discussion of Empirical Results and Future Research
The IPO long-term anomaly and the accrual anomaly have been an important stream of research in financial management. Many previous studies reported that earnings are managed around IPO (Aharony et al. 1993; Friedlan 1994; Teoh and Wong 1997; Teoh et al. 1998a, 1998c). Contrary to that, Ball and Shivakumar (2008) showed that public firms report more conservatively. Armstrong et al. (2015) concluded that IPO companies are not systematically opportunistic. Much of the existing literature reports significant long-term IPO underperformance with some studies dissecting the long-term IPO anomaly with an accrual-based explanation for other, mostly developed, markets. A negative relationship between discretionary accruals and subsequent stock returns was found in several studies (DuCharme et al. 2001; Chan et al. 2001; Xie 2001). Teoh et al. (1998a) found a difference in performance between aggressive and conservative firms and reported that more conservative firms outperformed more aggressive firms in the long-term. They concluded that the long-term returns range from −2.23 percent to +0.94 percent per year for conservative IPOs. For aggressive IPOs, annualized intercepts imply a long-term underperformance of −6.85 percent to −10.73 percent per year. The last study is especially important in discussing our results as it was also based on the calendar-time portfolio approach. However, they tested the issue for US IPOs.
Taking together our results from the broad set of methodology settings, the conclusions about the severe underperformance of aggressive IPOs are consentaneous and robust to methodology. The results on the difference between conservative and aggressive IPOs based on a broad set of robustness checks of the calendar-time portfolio approach seem to support the conclusion about the negative relationship between around-the-issue earnings management and subsequent long-term performance of IPOs. The annualized differences in alphas between conservative and aggressive initial public offerings in Poland are economically significant in all of the cases and they are statistically significant in almost half of 16 methodology settings. However, in some settings the difference is not statistically significant so the evidence on the explanatory power of earnings management for the long-term IPO returns in Poland may be perceived as not undisputable.
The results for Poland may be specific to some extent. First, the sample period includes substantial changes of the capital market. This country has been classified as an emerging market by all of the leading agencies. Just recently, though, Poland has been ranked by FTSE Russell as a developed market. Ongoing improvements in Poland’s capital markets infrastructure and steady economic progress were the key points of the decision. Simultaneously, Poland is still perceived as an emerging market by other agencies. Poland is an important area of economic growth in Europe. Poland’s economy was the only one in the European Union to avoid a recession through the last global financial crisis from 2008–2009. It has been one of the largest economies in Europe. In the same time, Polish companies’ capitalization as well as the number of equities listed on the exchange is much smaller in comparison to US or other developed stock markets.
An important fact is that Poland has different characteristics to other markets. First, a simple comparison to results for emerging markets is difficult because of the process of recent development in Poland. Second, a direct comparison to US-centered research or studies focused on other developed markets is also limited. Finally, one of the key fundamentals of capital market development are corporate governance mechanisms which are crucial for its growth and stability (Brown et al. 2011; Krishnan et al. 2011; Hong et al. 2016). The area of corporate governance and corporate social responsibility as an extension of earnings management problem could be developed in future studies. The research on earnings manipulation around going public could also be broadened by the analysis of the role of insiders and institutional holdings in earnings manipulation around equity issues (Darrough and Rangan 2005; Wu and Yang 2018).
An important and pervasive issue in empirical corporate finance is endogeneity. It is mainly connected with the problem of correlation between explanatory variables and the error term in a regression. We do not apply a traditional regression model with earnings management as an explanatory variable and the subsequent long-term IPO performance as dependent variable. We use a different methodology which tests abnormal returns for IPO quantiles distinguished depending on the level of earnings management. Hence, the methods like instrumental variables, difference-in-difference method, or regression discontinuity design (Roberts and Whited 2005; Li 2016) have no direct application in our study. Another issue is the problem of endogenous events. We follow Dahlquist and de Jong (2008) who demonstrate that the calendar-time approach is not biased and does not suffer from the problems of traditional measures of abnormal returns, even in small samples. They also report that it is unlikely that the endogeneity of clustering of IPOs explains the long-term underperformance. The problem of testing endogenous events (not only IPOs) for small capital markets like Warsaw Stock Exchange in Poland, could be developed in a separate study in the future to continue the discussion of Schultz (2003), Viswanathan and Wei (2008), or Ang and Zhang (2015).
The issue of earnings management around initial public offerings is such a broad area of financial management that this study was not able to answer all of the arising questions. Hence, the empirical research could be extended in the future also in another way. One of the challenging directions of future research is connected with real activities manipulation around the date of going public. Influencing the level of abnormal discretionary expenses and sales-based items is an example of real activities manipulation. As the information set about market newcomers is usually limited, testing real activities manipulation is not an easy task, especially for relatively small exchanges and those that have been classified as emerging markets for a long time. There exist studies where the real activities manipulation has been tested in other settings, not especially connected with initial public offerings (Graham et al. 2005; Roychowdhury 2006; Cohen and Zarowin 2010; Kothari et al. 2016). Earnings management through real activities around IPO has been discussed in a limited setting so far (Alhadab and Clacher 2018; Wongsunwai 2013). This study could also be continued by analyzing the trade-off decision between real and accrual-based earnings manipulation (Zang 2012; Kothari et al. 2016). Another contributing research question would be to test whether IPO companies in Poland that managed accruals might have incentives to switch to real activities manipulation activities (Gunny 2010). Possible conclusions based on real activities management around going public would be important for both investors and academics. The possible future research directions connected with empirical testing of real activities management could help shed new light on possible consequences for the long-term market IPO valuation.
7. Conclusions
We provide new evidence on the relationship between around-the-issue earnings management and the long-term performance of initial public offerings (IPO) in Poland. We test this issue with a methodology that has not hitherto been applied for equities listed on the Warsaw Stock Exchange (WSE). The study gives international insights in the area of financial management, where country-specific factors may influence managers’ decisions to manipulate earnings.
The results of testing the long-term implications of earnings management are important both for investors and academics. The informativeness of financial reports has always been of a great importance to investors. Earnings quality is an important practical concern during the whole life of companies, but it is of enormous importance around important company events such as going public, when little is usually known about a company. As the information about earnings is key in evaluating the future prospects of a company and determining its value, managers have incentives to manage earnings for that moment. If buyers are misled by artificially inflated earnings, they could pay too high a price at IPO and suffer losses in the long-term when prices adjust to the real value of the market newcomers.
Accrual quantiles are built using a set of alternative proxies of earnings management. The industry-year cross-sectional regressions are run for each IPO according to four models: the Jones model, the modified Jones model, the McNichols model, and Ball–Shivakumar model. The long-term performance is tested in 36-month rolling IPO portfolios under four asset pricing models: the CAPM, the Fama-French three-factor model, the Carhart four-factor model, and the Fama-French five-factor model. The magnitude of IPO negative returns is sensitive to the methodology, but this does not change the conclusions about long-term IPO underperformance. Both conservative and aggressive companies experience a relative decline in market value in the long run. However, we report more severe long-term performance for accrual-aggressive IPO issuers, as the annualized abnormal returns range from −12.1% up to even −20.5%, whereas the span is −8.2% to −13.7% for conservative IPO companies. The average annualized intercepts for low-accrual IPOs is −10.2%. The poor long-term performance of aggressive IPO companies is much more pronounced, as the average annualized intercept totals −16.1%. This results for accrual quantiles are robust with respect to alternative accrual model specifications, and to alternative abnormal returns measures based on a set of factor models. The average difference in returns between quantiles totals 5.9 percentage points annually, and ranges from 2.0 percentage points annually even up to 10.4 percentage points. Aggressive IPO companies experience more negative abnormal returns and this difference is economically significant in all of the cases. It is also statistically significant in almost half of methodology settings. The interpretation of such results could be as follows. Investors were not able to discount the pre-IPO use of abnormal accruals. Following this, they were overoptimistic about the future prospects of the company. Once the true earnings performance is revealed over the course of time, they make downward price corrections resulting in the negative long-term performance.
Author Contributions
The authors contributed equally to the research and writing of the manuscript.
Funding
Financial support for this paper from the National Science Centre, Poland is gratefully acknowledged (the number of the research project 2015/19/D/HS4/01950).
Acknowledgments
We would like to thank three anonymous referees.
Conflicts of Interest
The authors declare no conflict of interest. The funders had no role in the design of the study; in the collection, analyses, or interpretation of data; in the writing of the manuscript, or in the decision to publish the results.
References
- Aharony, Joseph, Chan-Jane Lin, and Martin P. Loeb. 1993. Initial Public Offerings, Accounting Choices, and Earnings Management. Contemporary Accounting Research 10: 61–81. [Google Scholar] [CrossRef]
- Ahmad-Zaluki, Nurwati A., Kevin Campbell, and Alan Goodacre. 2011. Earnings management in Malaysian IPOs: The East Asian crisis, ownership control, and post-IPO performance. International Journal of Accounting 46: 111–37. [Google Scholar] [CrossRef]
- Alhadab, Mohammad, and Iain Clacher. 2018. The impact of audit quality on real and accrual earnings management around IPOs. British Accounting Review 50: 442–61. [Google Scholar] [CrossRef]
- Ang, James S., and Shaojun Zhang. 2015. Evaluating Long-Horizon Event Study Methodology. In Handbook of Financial Econometrics and Statistics. Edited by Cheng-Few Lee and John C. Lee. New York: Springer, pp. 383–411. [Google Scholar]
- Armstrong, Chris, George Foster, and Daniel J. Taylor. 2015. Abnormal accruals in newly public companies: Opportunistic misreporting or economic activity? Management Science 62: 1316–38. [Google Scholar] [CrossRef]
- Ball, Ray, and Lakshmanan Shivakumar. 2005. Earnings quality in UK private firms: Comparative loss recognition timeliness. Journal of Accounting and Economics 39: 83–128. [Google Scholar] [CrossRef]
- Ball, Ray, and Lakshmanan Shivakumar. 2006. The Role of Accruals in Asymmetrically Timely Gain and Loss Recognition. Journal of Accounting Research 44: 207–42. [Google Scholar] [CrossRef]
- Ball, Ray, and Lakshmanan Shivakumar. 2008. Earnings quality at initial public offerings. Journal of Accounting and Economics 45: 324–49. [Google Scholar] [CrossRef]
- Barber, Brad M., and John D. Lyon. 1997. Detecting long-run abnormal stock returns: The empirical power and specification of test statistics. Journal of Financial Economics 43: 341–72. [Google Scholar] [CrossRef]
- Beneish, Messod D. 1998. Discussion of “Are accruals during initial public offerings opportunistic?”. Review of Accounting Studies 3: 209–21. [Google Scholar] [CrossRef]
- Brown, Philip, Wendy Beekes, and Peter Verhoeven. 2011. Corporate governance, accounting and finance: A review. Accounting & Finance 51: 96–172. [Google Scholar] [CrossRef]
- Carhart, Mark M. 1997. On Persistence in Mutual Fund Performance. Journal of Finance 52: 57–82. [Google Scholar] [CrossRef] [Green Version]
- Chan, Konan, Louis K. Chan, Narasimhan Jegadeesh, and Josef Lakonishok. 2001. Earnings quality and stock returns. National Bureau of Economic Research. [Google Scholar] [CrossRef]
- Chen, Ken Y., Kuen-Lin Lin, and Jian Zhou. 2005. Audit quality and earnings management for Taiwan IPO firms. Managerial Auditing Journal 20: 86–104. [Google Scholar] [CrossRef]
- Cohen, Daniel A., and Paul Zarowin. 2010. Accrual-based and real earnings management activities around seasoned equity offerings. Journal of Accounting and Economics 50: 2–19. [Google Scholar] [CrossRef] [Green Version]
- Dahlquist, Magnus, and Frank de Jong. 2008. Pseudo Market Timing: A Reappraisal. Journal of Financial and Quantitative Analysis 43: 547. [Google Scholar] [CrossRef]
- Darrough, Masako, and Srinivasan Rangan. 2005. Do Insiders Manipulate Earnings When They Sell Their Shares in an Initial Public Offering? Journal of Accounting Research 43: 1–33. [Google Scholar] [CrossRef]
- Dechow, Patricia M., and Ilia D. Dichev. 2002. The Quality of Accruals and Earnings: The Role of Accrual Estimation Errors. Accounting Review 77: 35–59. [Google Scholar] [CrossRef]
- Dechow, Patricia M., Richard G. Sloan, and Amy P. Sweeney. 1995. Detecting Earnings Management. Accounting Review 70: 193–225. Available online: http://www.jstor.org/stable/248303 (accessed on 16 May 2015).
- DeFond, Mark L., and James Jiambalvo. 1994. Debt covenant violation and manipulation of accruals. Journal of Accounting and Economics 17: 145–76. [Google Scholar] [CrossRef]
- DuCharme, Larry L., Paul H. Malatesta, and Stephan E. Sefcik. 2001. Earnings Management: IPO Valuation and Subsequent Performance. Journal of Accounting, Auditing & Finance 16: 369–96. [Google Scholar] [CrossRef]
- Fama, Eugene F. 1998. Market efficiency, long-term returns, and behavioral finance. Journal of Financial Economics 49: 283–306. [Google Scholar] [CrossRef]
- Fama, Eugene F., and Kenneth R. French. 1993. Common risk factors in the returns on stocks and bonds. Journal of Financial Economics 33: 3–56. [Google Scholar] [CrossRef]
- Fama, Eugene F., and Kenneth R. French. 2015. A five-factor asset pricing model. Journal of Financial Economics 116: 1–22. [Google Scholar] [CrossRef] [Green Version]
- Fama, Eugene F., and Kenneth R. French. 2016. Dissecting Anomalies with a Five-Factor Model. Review of Financial Studies 29: 69–103. [Google Scholar] [CrossRef]
- Friedlan, John M. 1994. Accounting Choices of Issuers of Initial Public Offerings. Contemporary Accounting Research 11: 1–31. [Google Scholar] [CrossRef]
- Gaver, Jennifer J., Kenneth M. Gaver, and Jeffrey R. Austin. 1995. Additional evidence on bonus plans and income management. Journal of Accounting and Economics 19: 3–28. [Google Scholar] [CrossRef]
- Graham, John R., Campbell R. Harvey, and Shiva Rajgopal. 2005. The economic implications of corporate financial reporting. Journal of Accounting and Economics 40: 3–73. [Google Scholar] [CrossRef] [Green Version]
- Gunny, Katherine A. 2010. The Relation Between Earnings Management Using Real Activities Manipulation and Future Performance: Evidence from Meeting Earnings Benchmarks. Contemporary Accounting Research 27: 855–88. [Google Scholar] [CrossRef]
- Healy, Paul M. 1985. The effect of bonus schemes on accounting decisions. Journal of Accounting and Economics 7: 85–107. [Google Scholar] [CrossRef]
- Holthausen, Robert W., David F. Larcker, and Richard G. Sloan. 1995. Annual bonus schemes and the manipulation of earnings. Journal of Accounting and Economics 19: 29–74. [Google Scholar] [CrossRef]
- Hong, Bryan, Zhichuan Li, and Dylan Minor. 2016. Corporate Governance and Executive Compensation for Corporate Social Responsibility. Journal of Business Ethics 136: 199–213. [Google Scholar] [CrossRef]
- Jegadeesh, Narasimhan, and Jason Karceski. 2009. Long-run performance evaluation: Correlation and heteroskedasticity-consistent tests. Journal of Empirical Finance 16: 101–11. [Google Scholar] [CrossRef]
- Jones, Jennifer J. 1991. Earnings Management During Import Relief Investigations. Journal of Accounting Research 29: 193–228. [Google Scholar] [CrossRef]
- Kothari, Stephen P., Natalie Mizik, and Sugata Roychowdhury. 2016. Managing for the Moment: The Role of Earnings Management via Real Activities versus Accruals in SEO Valuation. Accounting Review 91: 559–86. [Google Scholar] [CrossRef]
- Krishnan, C. N. V., Vladimir I. Ivanov, Ronald W. Masulis, and Ajai K. Singh. 2011. Venture Capital Reputation, Post-IPO Performance, and Corporate Governance. Journal of Financial and Quantitative Analysis 46: 1295–333. [Google Scholar] [CrossRef]
- Li, Frank. 2016. Endogeneity in CEO power: A survey and experiment. Investment Analysts Journal 45: 149–62. [Google Scholar] [CrossRef]
- Liberty, Susan E., and Jerold L. Zimmerman. 1986. Labor union contract negotiations and accounting choices. Accounting Review 61: 692–712. [Google Scholar]
- Lintner, John. 1969. The Valuation of Risk Assets and the Selection of Risky Investments in Stock Portfolios and Capital Budgets: A Reply. The Review of Economics and Statistics 51: 222–24. [Google Scholar] [CrossRef]
- Lizińska, Joanna, and Leszek Czapiewski. 2018a. Earnings Management and the Long-Term Market Performance of Initial Public Offerings in Poland. In Finance and Sustainability: Proceedings from the Finance and Sustainability Conference, Wroclaw 2017. Edited by Agnieszka Bem, Karolina Daszyńska-Żygadło, Taťána Hajdíková and Péter Juhász. Springer Proceedings in Business and Economics. Cham: Springer International Publishing, vol. 62, pp. 121–34. [Google Scholar]
- Lizińska, Joanna, and Leszek Czapiewski. 2018b. Towards Economic Corporate Sustainability in Reporting: What Does Earnings Management around Equity Offerings Mean for Long-Term Performance? Sustainability 10: 4349. [Google Scholar] [CrossRef]
- Lyon, John D., Brad M. Barber, and Chih-Ling Tsai. 1999. Improved Methods for Tests of Long-Run Abnormal Stock Returns. Journal of Finance 54: 165–201. [Google Scholar] [CrossRef] [Green Version]
- McNichols, Maureen F. 2000. Research design issues in earnings management studies. Journal of Accounting and Public Policy 19: 313–45. [Google Scholar] [CrossRef]
- McNichols, Maureen F., and G. Peter Wilson. 1988. Evidence of Earnings Management from the Provision for Bad Debts. Journal of Accounting Research 26: 1. [Google Scholar] [CrossRef]
- Pastor-Llorca, María J., and Francisco Poveda-Fuentes. 2011. Earnings Management and the Long-Run Performance of Spanish Initial Public Offerings. In Initial Public Offerings (IPO): An International Perspective of IPOs. Edited by Greg N. Gregoriou. Quantitative Finance. Burlington: Elsevier Science, pp. 81–112. [Google Scholar]
- Perry, Susan E., and Thomas H. Williams. 1994. Earnings management preceding management buyout offers. Journal of Accounting and Economics 18: 157–79. [Google Scholar] [CrossRef]
- Pourciau, Susan. 1993. Earnings management and nonroutine executive changes. Journal of Accounting and Economics 16: 317–36. [Google Scholar] [CrossRef]
- Roberts, Michael R., and Toni M. Whited. 2005. Endogeneity in empirical corporate finance. Handbook of the Economics of Finance 2: 493–572. [Google Scholar] [CrossRef]
- Ronen, Joshua, and Varda Yaari. 2008. Earnings Management: Emerging Insights in Theory, Practice, and Research. Springer Series in Accounting Scholarship. New York: Springer. [Google Scholar]
- Roosenboom, Peter, Tjalling van der Goot, and Gerard Mertens. 2003. Earnings management and initial public offerings: Evidence from the Netherlands. International Journal of Accounting 38: 243–66. [Google Scholar] [CrossRef]
- Roychowdhury, Sugata. 2006. Earnings management through real activities manipulation. Journal of Accounting and Economics 42: 335–70. [Google Scholar] [CrossRef]
- Schultz, Paul. 2003. Pseudo Market Timing and the Long-Run Underperformance of IPOs. Journal of Finance 58: 483–517. [Google Scholar] [CrossRef]
- Sharpe, William F. 1964. Capital asset prices: A theory of market equilibrium under conditions of risk. Journal of Finance 19: 425–42. [Google Scholar] [CrossRef]
- Sloan, Richard G. 1996. Do stock prices fully reflect information in accruals and cash flows about future earnings? Accounting Review 71: 289–315. [Google Scholar]
- Teoh, Siew Hong, Ivo Welch, and Tak J. Wong. 1998a. Earnings Management and the Long-Run Market Performance of Initial Public Offerings. Journal of Finance 53: 1935–74. [Google Scholar] [CrossRef]
- Teoh, Siew Hong, Ivo Welch, and Tak J. Wong. 1998b. Earnings management and the underperformance of seasoned equity offerings. Journal of Financial Economics 50: 63–99. [Google Scholar] [CrossRef]
- Teoh, Siew Hong, Tak J. Wong, and Gita R. Rao. 1998c. Are Accruals during Initial Public Offerings Opportunistic? Review of Accounting Studies 3: 175–208. [Google Scholar] [CrossRef]
- Teoh, Siew Hong, and Tak J. Wong. 1997. Analysts’ Credulity about Reported Earnings and Overoptimism in New Equity Issues. SSRN Electronic Journal. [Google Scholar] [CrossRef]
- Viswanathan, S., and Bin Wei. 2008. Endogenous Events and Long-Run Returns. Review of Financial Studies 21: 855–88. [Google Scholar] [CrossRef]
- Wongsunwai, Wan. 2013. The Effect of External Monitoring on Accrual-Based and Real Earnings Management: Evidence from Venture-Backed Initial Public Offerings. Contemporary Accounting Research 30: 296–324. [Google Scholar] [CrossRef]
- Wu, Ching-Chih, and Tung-Hsiao Yang. 2018. Insider Trading and Institutional Holdings in Seasoned Equity Offerings. Journal of Risk and Financial Management 11: 53. [Google Scholar] [CrossRef]
- Xie, Hong. 2001. The Mispricing of Abnormal Accruals. Accounting Review 76: 357–73. [Google Scholar] [CrossRef]
- Zang, Amy Y. 2012. Evidence on the Trade-Off between Real Activities Manipulation and Accrual-Based Earnings Management. Accounting Review 87: 675–703. [Google Scholar] [CrossRef]
Figure 1.
IPO activity and market situation.

Figure 2.
Risk premiums.

Figure 3.
Annualized alphas for conservative and aggressive accrual quantiles according to the Jones model (a), the modified Jones model (b), the McNichols model (c), and the Ball-Shivakumar model (d).
Figure 3.
Annualized alphas for conservative and aggressive accrual quantiles according to the Jones model (a), the modified Jones model (b), the McNichols model (c), and the Ball-Shivakumar model (d).


Table 1.
Descriptive statistics.
| Company Characteristics | Mean | Median | |||
|---|---|---|---|---|---|
| IPO | WSE * | IPO | WSE * | ||
| Total assets (mln PLN) | Y-1 | 757 mln | 1.095 mln | 66 mln | 1.171 mln |
| Total assets (mln PLN) | Y0 | 906 mln | 1.226 mln | 113 mln | 1.223 mln |
| Revenues (mln PLN) | Y-1 | 544 mln | 985 mln | 95 mln | 995 mln |
| Revenues (mln PLN) | Y0 | 635 mln | 1.095 mln | 124 mln | 1.103 mln |
| Leverage | Y-1 | 56.1% | 55.9% | 58.1% | 51.6% |
| Leverage | Y0 | 39.3% | 53.3% | 39.4% | 51.6% |
| Return on assets | Y-1 | 13.0% | 3.7% | 8.3% | 4.8% |
| Return on assets | Y0 | 8.6% | 4.0% | 6.8% | 6.5% |
| Return on equity | Y-1 | 30.8% | 3.0% | 22.0% | 16.0% |
| Return on equity | Y0 | 15.2% | 9.2% | 11.8% | 15.7% |
| Operating return on assets | Y-1 | 16.6% | 6.7% | 11.2% | 8.1% |
| Operating return on assets | Y0 | 10.6% | 6.8% | 8.6% | 8.2% |
| Operating return on equity | Y-1 | 42.7% | 10.6% | 32.8% | 19.2% |
| Operating return on equity | Y0 | 19.0% | 16.4% | 14.9% | 19.2% |
Note: * only for non-financial companies listed on the Warsaw Stock Exchange.
Table 2.
Calendar-time portfolio regressions according to the Jones model.
| CAPM (C) | CAPM (A) | 3FF (C) | 3FF (A) | 4C (C) | 4C (A) | 5FF (C) | 5FF (A) | |
|---|---|---|---|---|---|---|---|---|
| Panel A: Calendar-Time Portfolio Regressions for the Conservative and Aggressive Portfolio | ||||||||
| Intercept | −0.006 | −0.013 *** | −0.007 * | −0.016 *** | −0.007 * | −0.012 *** | −0.009 ** | −0.017 *** |
| (−1.566) | (−2.955) | (−1.971) | (−3.954) | (−1.691) | (−2.748) | (−2.439) | (−4.438) | |
| RMP | 0.803 *** | 0.925 *** | 0.774 *** | 0.856 *** | 0.773 *** | 0.821 *** | 0.719 *** | 0.782 *** |
| (13.063) | (13.407) | (13.200) | (13.347) | (12.769) | (12.727) | (12.440) | (12.704) | |
| SBM | 0.537 *** | 0.581 *** | 0.560 *** | 0.603 *** | 0.699 *** | 0.764 *** | ||
| (4.759) | (4.712) | (4.786) | (4.838) | (5.939) | (6.095) | |||
| HML | 0.190 | 0.589 *** | 0.147 | 0.470 *** | 0.357 ** | 0.779 *** | ||
| (1.300) | (3.689) | (0.987) | (2.959) | (2.340) | (4.795) | |||
| WML | −0.053 | −0.221 *** | ||||||
| (−0.730) | (−2.844) | |||||||
| RMW | 0.102 | 0.024 | ||||||
| (0.844) | (0.185) | |||||||
| CMA | −0.528 *** | −0.716 *** | ||||||
| (−3.458) | (−4.401) | |||||||
| p-value for F | 0.000 | 0.000 | 0.000 | 0.000 | 0.000 | 0.000 | 0.000 | 0.000 |
| adj. R2 | 0.588 | 0.600 | 0.650 | 0.678 | 0.648 | 0.693 | 0.684 | 0.725 |
| Panel B: Equivalent Regressions of the Difference between the Conservative and Aggressive Portfolio Returns | ||||||||
| α(A)–α(C) | −0.007 ** | −0.009 ** | −0.005 | −0.008 ** | ||||
| p-value | 0.036 | 0.012 | 0.109 | 0.018 | ||||
Note: t-statistic is in parentheses. *, **, *** indicate significance at the 10, 5, and 1 percent levels, respectively.
Table 3.
Calendar-time portfolio regressions for year in quantiles according to the modified Jones model.
Table 3.
Calendar-time portfolio regressions for year in quantiles according to the modified Jones model.
| CAPM (C) | CAPM (A) | 3FF (C) | 3FF (A) | 4C (C) | 4C (A) | 5FF (C) | 5FF (A) | |
|---|---|---|---|---|---|---|---|---|
| Panel A: Calendar-Time Portfolio Regressions for the Conservative and Aggressive Portfolio | ||||||||
| Intercept | −0.007 * | −0.012 *** | −0.008 ** | −0.014 *** | −0.007 * | −0.011 ** | −0.009 ** | −0.016 *** |
| (−1.784) | (−2.652) | (−2.215) | (−3.549) | (−1.712) | (−2.513) | (−2.616) | (−4.061) | |
| RMP | 0.799 *** | 0.942 *** | 0.770 *** | 0.876 *** | 0.760 *** | 0.849 *** | 0.711 *** | 0.806 *** |
| (13.071) | (13.573) | (13.171) | (13.504) | (12.694) | (12.846) | (12.403) | (12.828) | |
| SBM | 0.529 *** | 0.583 *** | 0.564 *** | 0.598 *** | 0.684 *** | 0.774 *** | ||
| (4.713) | (4.676) | (4.874) | (4.680) | (5.856) | (6.046) | |||
| HML | 0.202 | 0.547 *** | 0.144 | 0.440 *** | 0.362 ** | 0.745 *** | ||
| (1.387) | (3.383) | (0.976) | (2.709) | (2.393) | (4.489) | |||
| WML | −0.093 | −0.189 ** | ||||||
| (−1.291) | (−2.367) | |||||||
| RMW | 0.059 | 0.072 | ||||||
| (0.492) | (0.549) | |||||||
| CMA | −0.564 *** | −0.677 *** | ||||||
| (−3.718) | (−4.073) | |||||||
| p-value for F | 0.000 | 0.000 | 0.000 | 0.000 | 0.000 | 0.000 | 0.000 | 0.000 |
| adj. R2 | 0.588 | 0.606 | 0.649 | 0.678 | 0.653 | 0.686 | 0.686 | 0.720 |
| Panel B: Equivalent Regressions of the Difference between the Conservative and Aggressive Portfolio Returns | ||||||||
| α(A)–α(C) | −0.005 | −0.006 * | −0.004 | −0.007 * | ||||
| p-value | 0.109 | 0.053 | 0.160 | 0.053 | ||||
Note: t-statistic is in parentheses. *, **, *** indicate significance at the 10, 5, and 1 percent levels, respectively.
Table 4.
Calendar-time portfolio regressions for year in quantiles according to the McNichols model.
Table 4.
Calendar-time portfolio regressions for year in quantiles according to the McNichols model.
| CAPM (C) | CAPM (A) | 3FF (C) | 3FF (A) | 4C (C) | 4C (A) | 5FF (C) | 5FF (A) | |
|---|---|---|---|---|---|---|---|---|
| Panel A: Calendar-Time Portfolio Regressions for the Conservative and Aggressive Portfolio | ||||||||
| Intercept | −0.009 ** | −0.011 ** | −0.010 ** | −0.013 *** | −0.008 ** | −0.010 ** | −0.011 *** | −0.015 *** |
| (−2.147) | (−2.579) | (−2.602) | (−3.388) | (−2.010) | (−2.463) | (−3.065) | (−4.032) | |
| RMP | 0.897 *** | 0.827 *** | 0.865 *** | 0.771 *** | 0.853 *** | 0.749 *** | 0.795 *** | 0.710 *** |
| (13.995) | (12.905) | (14.025) | (12.749) | (13.478) | (12.139) | (13.342) | (12.103) | |
| SBM | 0.533 *** | 0.529 *** | 0.562 *** | 0.549 *** | 0.704 *** | 0.729 *** | ||
| (4.498) | (4.551) | (4.598) | (4.605) | (5.792) | (6.098) | |||
| HML | 0.229 | 0.463 *** | 0.163 | 0.374 ** | 0.422 *** | 0.663 *** | ||
| (1.488) | (3.075) | (1.049) | (2.466) | (2.681) | (4.283) | |||
| WML | −0.106 | −0.156 ** | ||||||
| (−1.396) | (−2.105) | |||||||
| RMW | 0.057 | 0.141 | ||||||
| (0.459) | (1.155) | |||||||
| CMA | −0.678 *** | −0.572 *** | ||||||
| (−4.304) | (−3.691) | |||||||
| p-value for F | 0.000 | 0.000 | 0.000 | 0.000 | 0.000 | 0.000 | 0.000 | 0.000 |
| adj. R2 | 0.621 | 0.582 | 0.673 | 0.652 | 0.675 | 0.659 | 0.716 | 0.696 |
| Panel B: Equivalent Regressions of the Difference between the Conservative and Aggressive Portfolio Returns | ||||||||
| α(A)–α(C) | −0.002 | −0.003 | −0.002 | −0.003 | ||||
| p-value | 0.304 | 0.212 | 0.332 | 0.176 | ||||
Note: t-statistic is in parentheses. *, **, *** indicate significance at the 10, 5, and 1 percent levels, respectively.
Table 5.
Calendar-time portfolio regressions for year in quantiles according to the Ball–Shivakumar model.
Table 5.
Calendar-time portfolio regressions for year in quantiles according to the Ball–Shivakumar model.
| CAPM (C) | CAPM (A) | 3FF (C) | 3FF (A) | 4C (C) | 4C (A) | 5FF (C) | 5FF (A) | |
|---|---|---|---|---|---|---|---|---|
| Panel A: Calendar-time portfolio regressions for the conservative and aggressive portfolio | ||||||||
| Intercept | −0.008 * | −0.012 *** | −0.009 ** | −0.015 *** | −0.008 * | −0.012 *** | −0.010 *** | −0.016 *** |
| (−1.810) | (−2.953) | (−2.222) | (−3.965) | (−1.737) | (−2.908) | (−2.632) | (−4.526) | |
| RMP | 0.851 *** | 0.884 *** | 0.818 *** | 0.822 *** | 0.809 *** | 0.797 *** | 0.750 *** | 0.762 *** |
| (12.922) | (13.584) | (12.790) | (13.790) | (12.296) | (13.148) | (12.020) | (13.140) | |
| SBM | 0.515 *** | 0.611 *** | 0.543 *** | 0.629 *** | 0.683 *** | 0.794 *** | ||
| (4.186) | (5.334) | (4.276) | (5.375) | (5.371) | (6.718) | |||
| HML | 0.237 | 0.511 *** | 0.179 | 0.409 *** | 0.428 ** | 0.683 *** | ||
| (1.488) | (3.441) | (1.106) | (2.742) | (2.594) | (4.460) | |||
| WML | −0.092 | −0.177 ** | ||||||
| (−1.163) | (−2.421) | |||||||
| RMW | 0.060 | 0.095 | ||||||
| (0.462) | (0.787) | |||||||
| CMA | −0.659 *** | −0.565 *** | ||||||
| (−3.995) | (−3.683) | |||||||
| p-value for F | 0.000 | 0.000 | 0.000 | 0.000 | 0.000 | 0.000 | 0.000 | 0.000 |
| adj. R2 | 0.582 | 0.607 | 0.632 | 0.692 | 0.634 | 0.700 | 0.675 | 0.729 |
| Panel B: Equivalent regressions of the difference between the conservative and aggressive portfolio returns | ||||||||
| α(A)–α(C) | −0.005 | −0.006 * | −0.004 | −0.006 * | ||||
| p-value | 0.120 | 0.071 | 0.173 | 0.071 | ||||
Note: t-statistic is in parentheses. *, **, *** indicate significance at the 10, 5, and 1 percent levels, respectively.
© 2019 by the authors. Licensee MDPI, Basel, Switzerland. This article is an open access article distributed under the terms and conditions of the Creative Commons Attribution (CC BY) license (http://creativecommons.org/licenses/by/4.0/).
Share and Cite
MDPI and ACS Style
Lizińska, J.; Czapiewski, L. Is Window-Dressing around Going Public Beneficial? Evidence from Poland. J. Risk Financial Manag. 2019, 12, 18. https://doi.org/10.3390/jrfm12010018
AMA Style
Lizińska J, Czapiewski L. Is Window-Dressing around Going Public Beneficial? Evidence from Poland. Journal of Risk and Financial Management. 2019; 12(1):18. https://doi.org/10.3390/jrfm12010018
Chicago/Turabian StyleLizińska, Joanna, and Leszek Czapiewski. 2019. "Is Window-Dressing around Going Public Beneficial? Evidence from Poland" Journal of Risk and Financial Management 12, no. 1: 18. https://doi.org/10.3390/jrfm12010018