Article

Symplectic Entropy as a Novel Measure for Complex Systems

1
Institute of Vibration, Shock and Noise, State Key Laboratory of Mechanical System and Vibration, Shanghai Jiao Tong University, Shanghai 200240, China
2
Department of Mechanical Engineering, Vanderbilt University, Box 1592B, Nashville, TN 37235, USA
*
Authors to whom correspondence should be addressed.
Entropy 2016, 18(11), 412; https://doi.org/10.3390/e18110412
Submission received: 6 October 2016 / Revised: 13 November 2016 / Accepted: 15 November 2016 / Published: 17 November 2016
(This article belongs to the Section Complexity)

Abstract

:
Real systems are often complex, nonlinear, and noisy in various fields, including mathematics, natural science, and social science. We present the symplectic entropy (SymEn) measure as well as an analysis method based on SymEn to estimate the nonlinearity of a complex system by analyzing the given time series. The SymEn estimation is a kind of entropy based on symplectic principal component analysis (SPCA), which represents organized but unpredictable behaviors of systems. The key to SPCA is to preserve the global submanifold geometrical properties of the systems through a symplectic transform in the phase space, which is a kind of measure-preserving transform. The ability to preserve the global geometrical characteristics makes SymEn a test statistic for the detection of the nonlinear characteristics in several typical chaotic time series, and the stochastic characteristic in Gaussian white noise. The results are in agreement with findings in the approximate entropy (ApEn), the sample entropy (SampEn), and the fuzzy entropy (FuzzyEn). Moreover, the SymEn method is also used to analyze the nonlinearities of real signals (including the electroencephalogram (EEG) signals for Autism Spectrum Disorder (ASD) and healthy subjects, and the sound and vibration signals for mechanical systems). The results indicate that the SymEn estimation can be taken as a measure for the description of the nonlinear characteristics in the data collected from natural complex systems.

1. Introduction

Complex systems have been widely studied in various fields, such as mathematics, physics, engineering, economics, biomedical engineering, etc. Due to the unknown structures of systems and the complicated and disordered forms of measured time series, it has always been challenging to explore the characteristics of complex systems (such as the brain) [1,2]. The essential problem for a complex system is differentiating between nonlinearity and linear stochastics, because a complex system—especially with chaos—is often very similar to a random process. Symplectic geometry is a geometry in an even dimensional phase space with a closed nondegenerate skew-symmetric bilinear form. Due to the measure-preserving capability of symplectic similar transform in phase space, symplectic geometry can preserve the system structure—even non-linear structure. The global submanifold geometrical properties in the system, or the data from the system, can keep unchanged through symplectic transforms in phase space [3,4,5]. The aim of this study is to employ the measure-preserving characteristics of symplectic geometry to propose an entropy measure for complex systems. As a statistical measure, entropy can distinguish complex systems from linear stochastic processes. Symplectic geometry has been used to study complex systems in two areas: solving symplectic differential equations for various nonlinear dynamical systems [6,7,8,9,10,11], and analyzing a time series in phase space geometry to test the nature of complex systems [3,4,12]. However, there has been little research on the entropy estimation in the symplectic theory.
In fact, the studies and applications of symplectic geometry have mainly been used to solve symplectic differential systems in mathematics, physics, and theoretical and classical mechanics since Feng and his research group first developed symplectic approach to accurately solve some nonlinear dynamical systems constructed using Hamiltonian models [9]. The mathematical fundamentals of symplectic geometry are based on the symplectic space that is different from Euclidean space, although the two spaces could deal with the Hamiltonian system. The symplectic similarities in the symplectic space can preserve the structures of the Hamiltonian matrices [13,14,15]. Some numerical algorithms based on symplectic geometry—such as symplectic Householder transformations, symplectic QR-like decomposition [16], or the symplectic Gram–Schmidt algorithm [17]—are proposed and modified to solve the eigenvalues of the Hamiltonian matrices, particularly for sparse and large structured matrices [18]. Symplectic eigensolutions are proposed to perform the energy band analysis for a periodical waveguide by introducing symplectic mathematics into the electro-magnetic waveguide theory [19]. A novel method based on symplectic mathematics and finite element analysis is developed to deduce the dispersion relations for some typical cellular structures [20]. For some basic problems in solid mechanics and elasticity, many of the research works of symplectic elasticity are attributed to Lim, C.W. et al. [9], Zhong, W. et al. [20], Yao, W. [21] and Lü, C.F. et al. [22]. Subsequently, the symplectic analysis has been applied to solve other applied engineering problems, such as control problems [23], piezoelectric materials [24], bending problems of corner-supported rectangular thin plates [25,26], and so on.
Recently, symplectic geometry theory has been applied to analyze the time series from complex systems through the reconstructed phase space [4]. According to the Takens’ embedding theorem, the reconstructed phase space is equivalent (diffeomorphic) to the attractor of the original dynamical system generating the data, so it can reflect the dynamical characteristics of the dynamic system [27]. It is on this basis that our previous works extended the symplectic geometry theory into the analysis of the time series [28,29]. The dimension of a nonlinear dynamic system has been estimated based on symplectic geometry [4]. The symplectic principal component method has been developed to reduce noise in nonlinear systems [12,28]. Subsequently, some researchers have used and further developed the applications of symplectic theory on time series. Sprinter’s surface electromyography EMG signals have been evaluated based on symplectic geometry [29]. The determinism characteristics in a time series have been detected by using the symplectic geometry method [30]. The symplectic geometry spectrum regression method has been proposed to predict noisy time series [3]. The above research works have shown that symplectic principal component analysis (SPCA)-based methodologies are superior to singular value decomposition SVD-based methods for complex systems. However, little work has been done to quantify the disorder or the randomness of a system from the point of view of the symplectic theory.
According to Boltzmann’s definition, the interpretation of entropy is a measure of the number of possible microstates of a system. Entropy is used to describe and quantify the disorder, uncertainty, or randomness of a system, or the lack of information existing in a system. At present, many entropy estimation approaches—such as Shannon entropy, approximate entropy, sample entropy, fuzzy entropy, etc.—have been proposed and widely used to quantify the complexity of time series in various fields [31,32,33,34,35,36]. As a broad and general concept, Shannon entropy has been widely used in information theory and in thermodynamics since Claude Shannon devised it in 1948 [37]. This paper presents a symplectic entropy (SymEn) approach based on SPCA and Shannon entropy. The SymEn approach measures the energy distribution of a dynamic system in symplectic space. To test the utility of the SymEn approach, we chose several typical time series (including noise data and three chaotic time series) and four kinds of engineering signals (electroencephalogram (EEG) signals from the brain systems of healthy subjects, Autism Spectrum Disorder (ASD) subjects, and the sound and vibration signals from the mechanical systems).

2. Materials and Methods

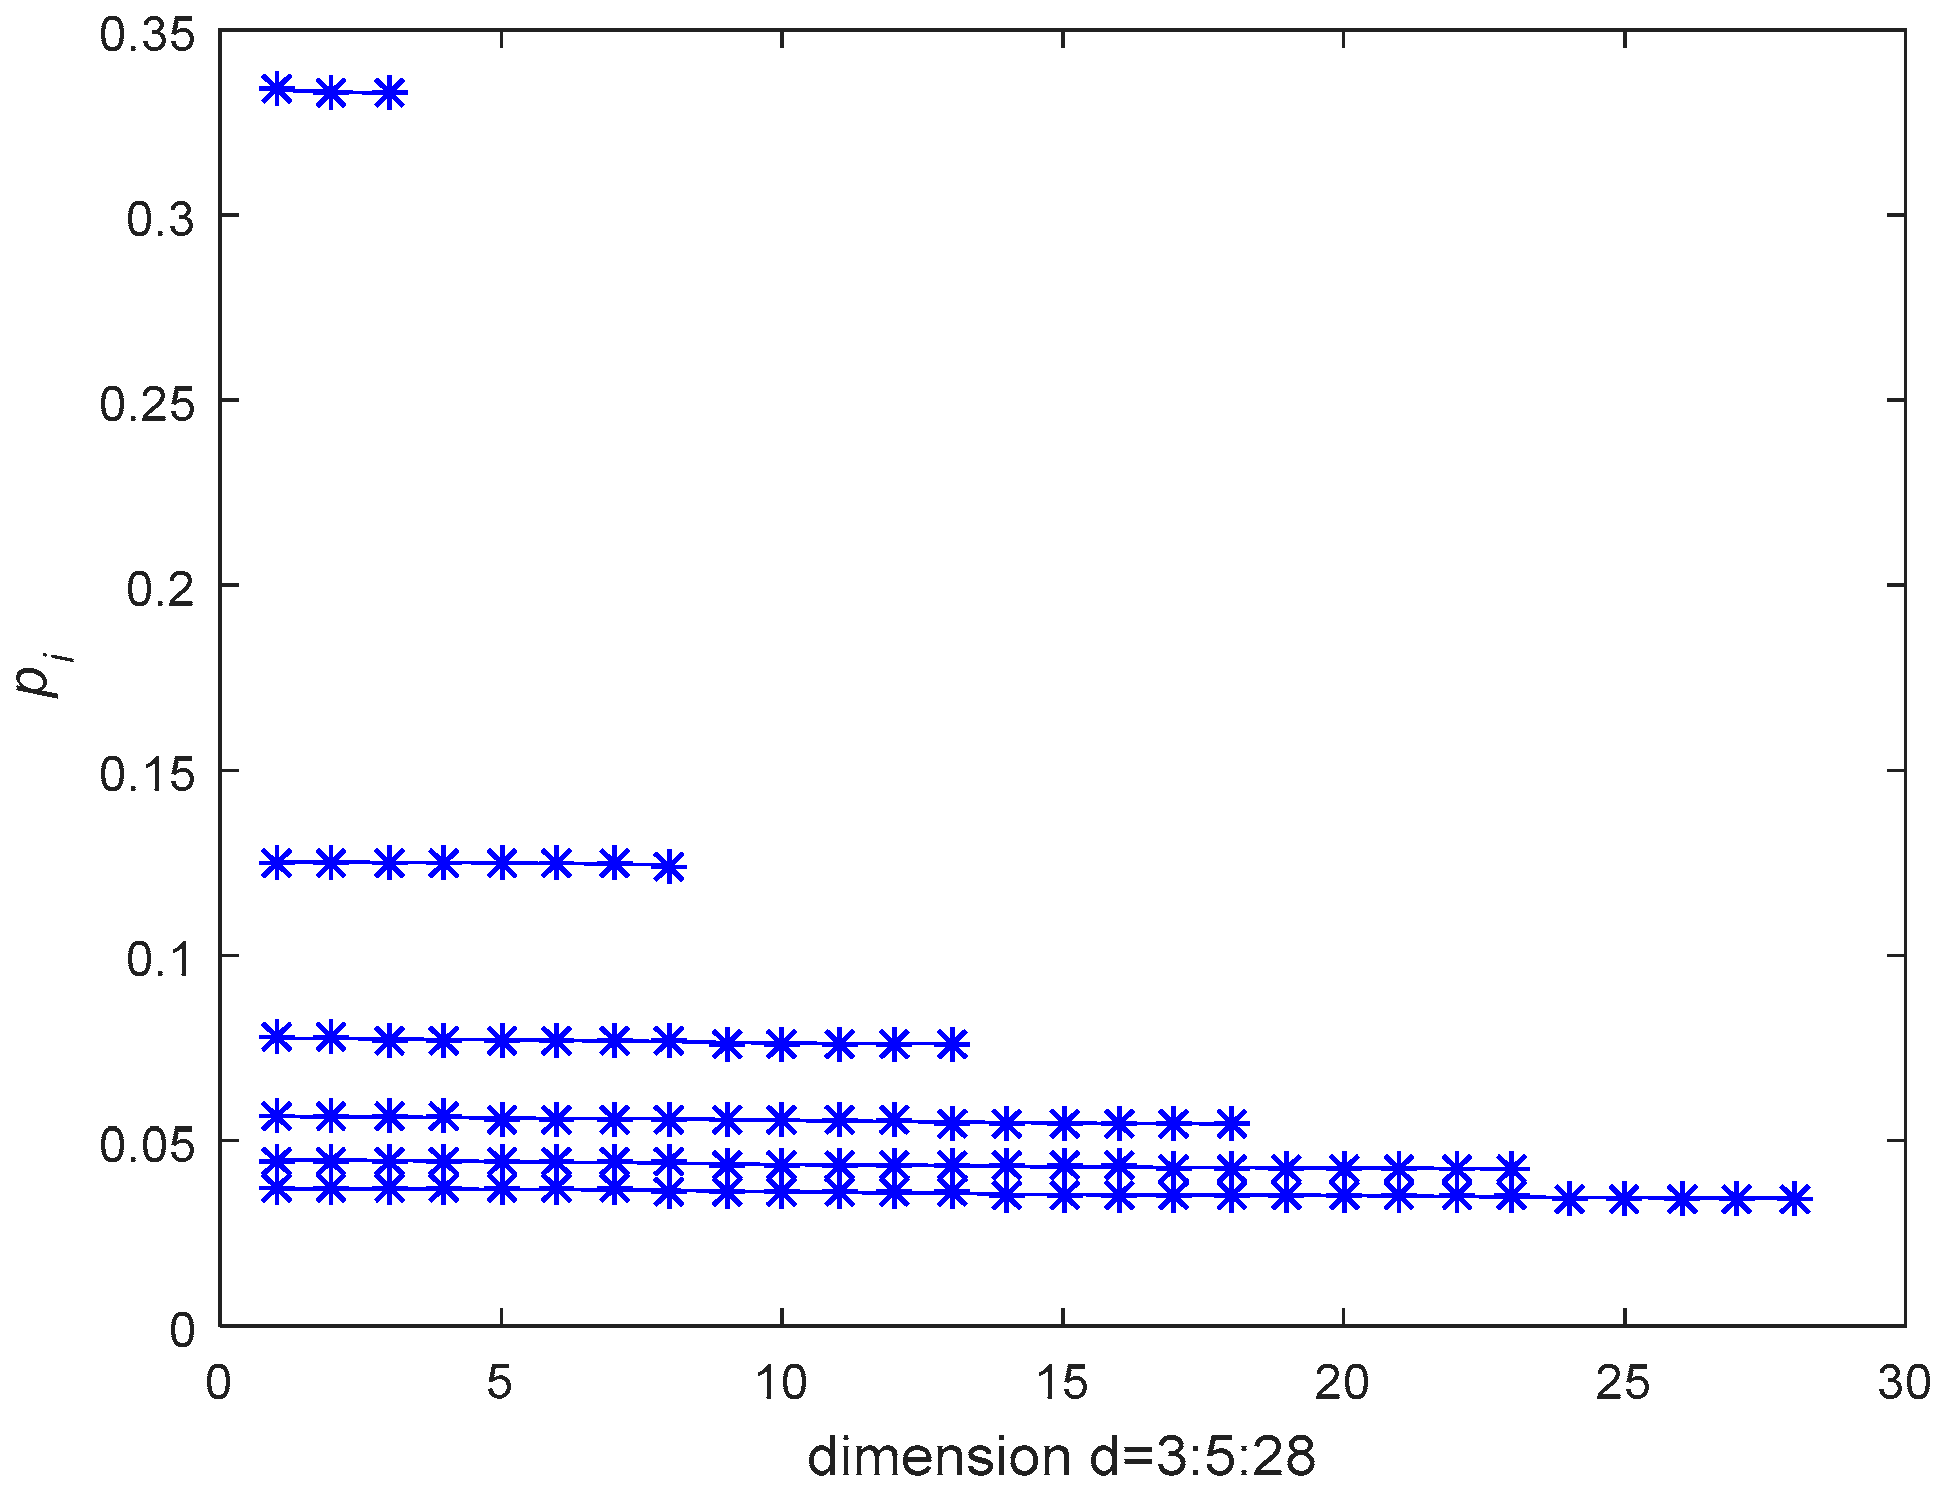
2.1. Symplectic Entropy

Given N sampled time series x 1 , x 2 , , x N coming from a system f ( x ) , an attractor Xm×d in phase space can be reconstructed by time delay coordinates method:
X = [ X ¯ 1 T X ¯ 2 T X ¯ m T ] = [ x 1 x 2 x d x 2 x 3 x d + 1 x m x m + 1 x N ]
where d is the embedding dimension, m = Nd + 1 is the number of dots in the d-dimension reconstruction vector, and X ¯ i T , ( i = 1 , , m ) denotes a dot in the phase space. According to Takens’ embedding theorem, X reflects the characteristics of the system. Then, a Hamilton matrix M of the system f ( x ) can be built from X:
M = ( A 0 0 A T )
where A = X T X . Meanwhile, any Hamilton matrix can remain unchanged at symplectic similar transform in symplectic geometry theory. The related proofs refer to the proofs of Appendix A in [4]. In symplectic geometry, the symplectic similar transform is a regular transform. Its essence is dependent on a bilinear antisymmetric nonsingular cross product—the symplectic cross product:
[ x , y ] = x , J y
where x and y are 2n-dimension vectors.
J = J 2 n = [ 0 + I n I n 0 ]
There are also some properties, as follows:
Theorem 1.
The product of symplectic matrices is also a symplectic matrix.
Theorem 2.
Suppose Household matrix H is:
H = H ( k , ω ) = ( P 0 0 P )
where
P = I n 2 ϖ ϖ * ϖ * ϖ ,   ϖ = ( 0 , , 0 ; ω k , , ω n ) T 0
so, H is a symplectic unitary matrix. ϖ * is ϖ conjugate transposition.
Theorem 3.
Let S C 2 n × 2 n as a symplectic matrix, then S can be decomposed as S = Q R , where Q is a symplectic unitary matrix and R is an upper triangle matrix.
Here, the Household matrix H can be used as the matrix Q. Then, the Hamilton matrix M can be transformed into an upper Hessenberg matrix by the Household matrix H,
H T M H = ( B R 0 B T )
where B is upper Hessenberg matrix (bij = 0, i > j + 1). Meanwhile, H can be obtained from the matrix A [4]. The eigenvalues of matrix B are given as λ ( B ) = { μ 1 , μ 2 , , μ d } . The eigenvalues λ(A) of matrix A are equal to those of matrix B; i.e., μ = λ ( B ) = λ ( A ) . The eigenvalues μ = { μ 1 , μ 2 , , μ d } are sorted in descending order; that is,
μ 1 > μ 2 > > μ k > > μ k + 1 μ d
The μ values are called the symplectic principal components of A with relevant symplectic orthonormal bases. They reflect the distribution of the energy of the system in different symplectic directions. The probability of the energy distribution in each direction can be defined, respectively, as p 1 , p 2 , , p d , and the probability space of the equation can be expressed as:
[ M P ] = { M : μ 1 , μ 2 , , μ d P : p 1 , p 2 , , p d
p i = μ i / i = 1 d μ i ,   i = 1 , , d
where d is the embedding dimension, i = 1 d p i = 1 , 0 p i 1 . It represents the uncertainty of the entropy in each direction. Then, an entropy can be defined as follows:
SymEn = i = 1 d p i log ( p i )
SymEn gives the statistical average and measures the degree of uncertainty of energy about the underlying probability distribution in different directions of a system in terms of the Shannon entropy, called Symplectic Entropy.

2.2. Materials

A complex system—especially with chaos—is often random-like. Detecting the nonlinearity of a time series is one of the inverse problems for a complex system, particularly for a chaotic dynamical system. Here, to assess the utility of the SymEn method as a measure for complex systems, the SymEn method is used to test the nonlinearity in the data from both synthetic and real experiments. In Section 2.2.1, we illustrate the four synthetic time series from the Gaussian white noise processing and three chaotic systems whose underlying dynamics are known. In Section 2.2.2, we consider several real time series from practical systems. In Section 2.2.3, we introduce the null hypothesis technique in order to test the difference between the raw data and its surrogate data based on the entropy measures, including SymEn, approximate entropy (ApEn), sample entropy (SampEn), and fuzzy entropy (FuzzyEn) methods.

2.2.1. Synthetic Time Series

In practical systems, noise is generally regarded as Gaussian white noise having an independent and identical probability distribution. Its probability distribution of each direction is even in the dimension d (see Figure 1). The probability value is calculated by Equation (10). For an equiprobable distribution, the entropy should increase with the number of the embedding dimension d. Here, the Gaussian white noise with mean 0 and variance 1 is used to test if the SymEn estimate is suitable to evaluate the noise. In order to determine if the SymEn method can reflect the nonlinear characteristics of a time series, three typical chaotic systems are applied to generate the corresponding nonlinear time series.
The three chaotic systems are given as follows:
  • Lorenz chaotic system:
    x ˙ = 10 ( y x ) y ˙ = 28 x y x z z ˙ = x y 8 3 z
  • Rössler chaotic system:
    x ˙ = y z y ˙ = x + 0.15 y z ˙ = 0.2 + z ( x 10 )
  • Van der Pol chaotic system:
    x ¨ 5 ( 1 x 2 ) x ˙ + x = 5 cos ( 2.466 t )

2.2.2. Real Time Series

To further illustrate the application of the SymEn method to real data sets, we employ several real data sets, including two bioelectric signals (electroencephalogram (EEG) data from children with ASD and healthy subjects), and two mechanical signals (vibration signals of an air compressor and engine sound signals).
The brain system is extremely complicated. The EEG data are the electrical signals from the brain when the brain is at work. Therefore, brain function analysis based on EEG has been of enormous interest. A number of studies have also studied the nonlinear behavior of the brain dynamics in the EEG analysis. However, the EEG signals are complicated and random-like. It has been challenging to detect the nonlinear properties of EEG data [38]. Here, the EEG signals at the right (O2) are collected during the resting state with open eyes for the children with ASD and healthy subjects, respectively. The sampling conditions are detailed in previous papers [39,40].
In the mechanical engineering field, there are many complex mechanical systems, such as air compressors and car engines [41,42]. Here, the nonlinear characteristics in the abnormal vibration signals of the air compressor and the sound data of faulty diesel engines are detected by the SymEn method. For the air compressor, the vibration acceleration data are collected at a 25,600 Hz sampling frequency. The length of the measured data is 32,768 points. For the diesel engine, the sound time series are given by a 48 kHz sampling frequency.

2.2.3. Surrogate Data and Null Hypothesis

Surrogate data has been widely employed to discriminate the nonlinear dynamics in real data and typical chaotic time series [36,43,44]. The idea of surrogate data is to first specify a stochastic process with some linear properties which are consistent with the original data as a null hypothesis, then generate surrogate data sets according to this hypothesis, and calculate a test statistic for the original data and its surrogate data, respectively. If the statistic value of the original data is obviously different from those of its surrogate data, this null hypothesis is rejected, and nonlinearity is detected. Here, we apply a linear autocorrelated Gaussian noise process as a null hypothesis. This null hypothesis can generate the surrogate data with the same mean, variance, and spectrum power as the original data. The algorithm of this null hypothesis has been detailed in our early work [44]. In this study, the SymEn measure is used as a test statistic, as are the ApEn, SampEn, and FuzzyEn measures. In order to give the degree of difference between the original data and its surrogate data, the z value is given:
z = | Q o r i g Q s | σ s
where Qorig is the test statistic value for the original data, and Q s is the mean of the statistic values for the surrogates. σs is the standard deviation (SD) of the statistic values for the surrogates. z > 1.96 means that the null hypothesis can be rejected for two-sided testing at a 95% (α = 0.05) confidence level. For α = 0.05, the number of surrogates is B = 2/α − 1 = 39 [36,38,45]. For this, 39 sets of surrogate data are generated for each analyzed data in this study.
Besides, it is necessary to note that the analysis length of each data analysis is 1000 points in this study.

3. Results

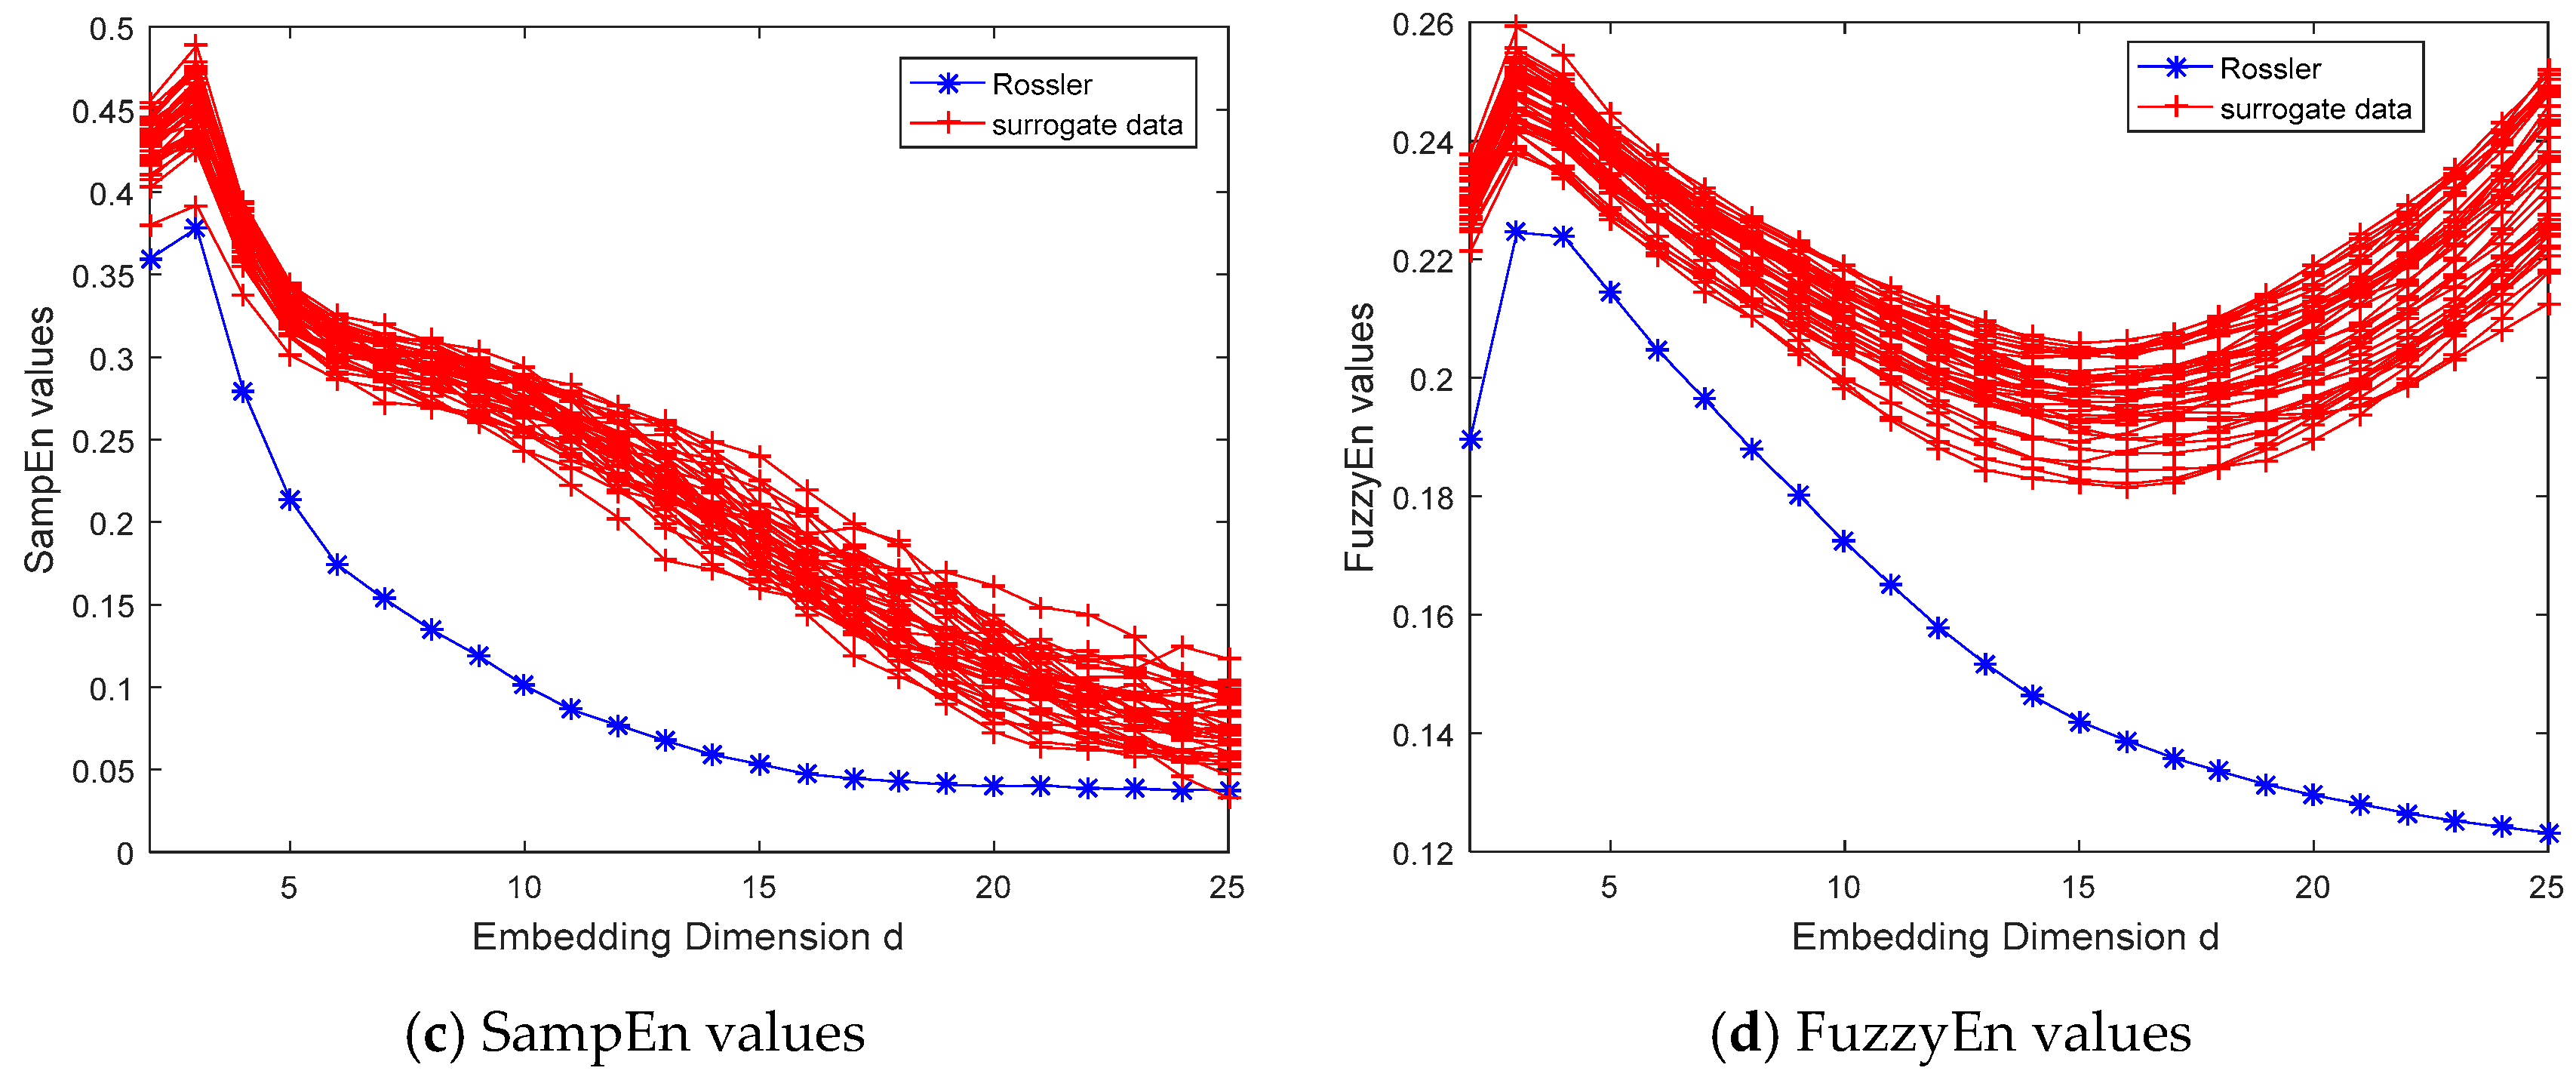
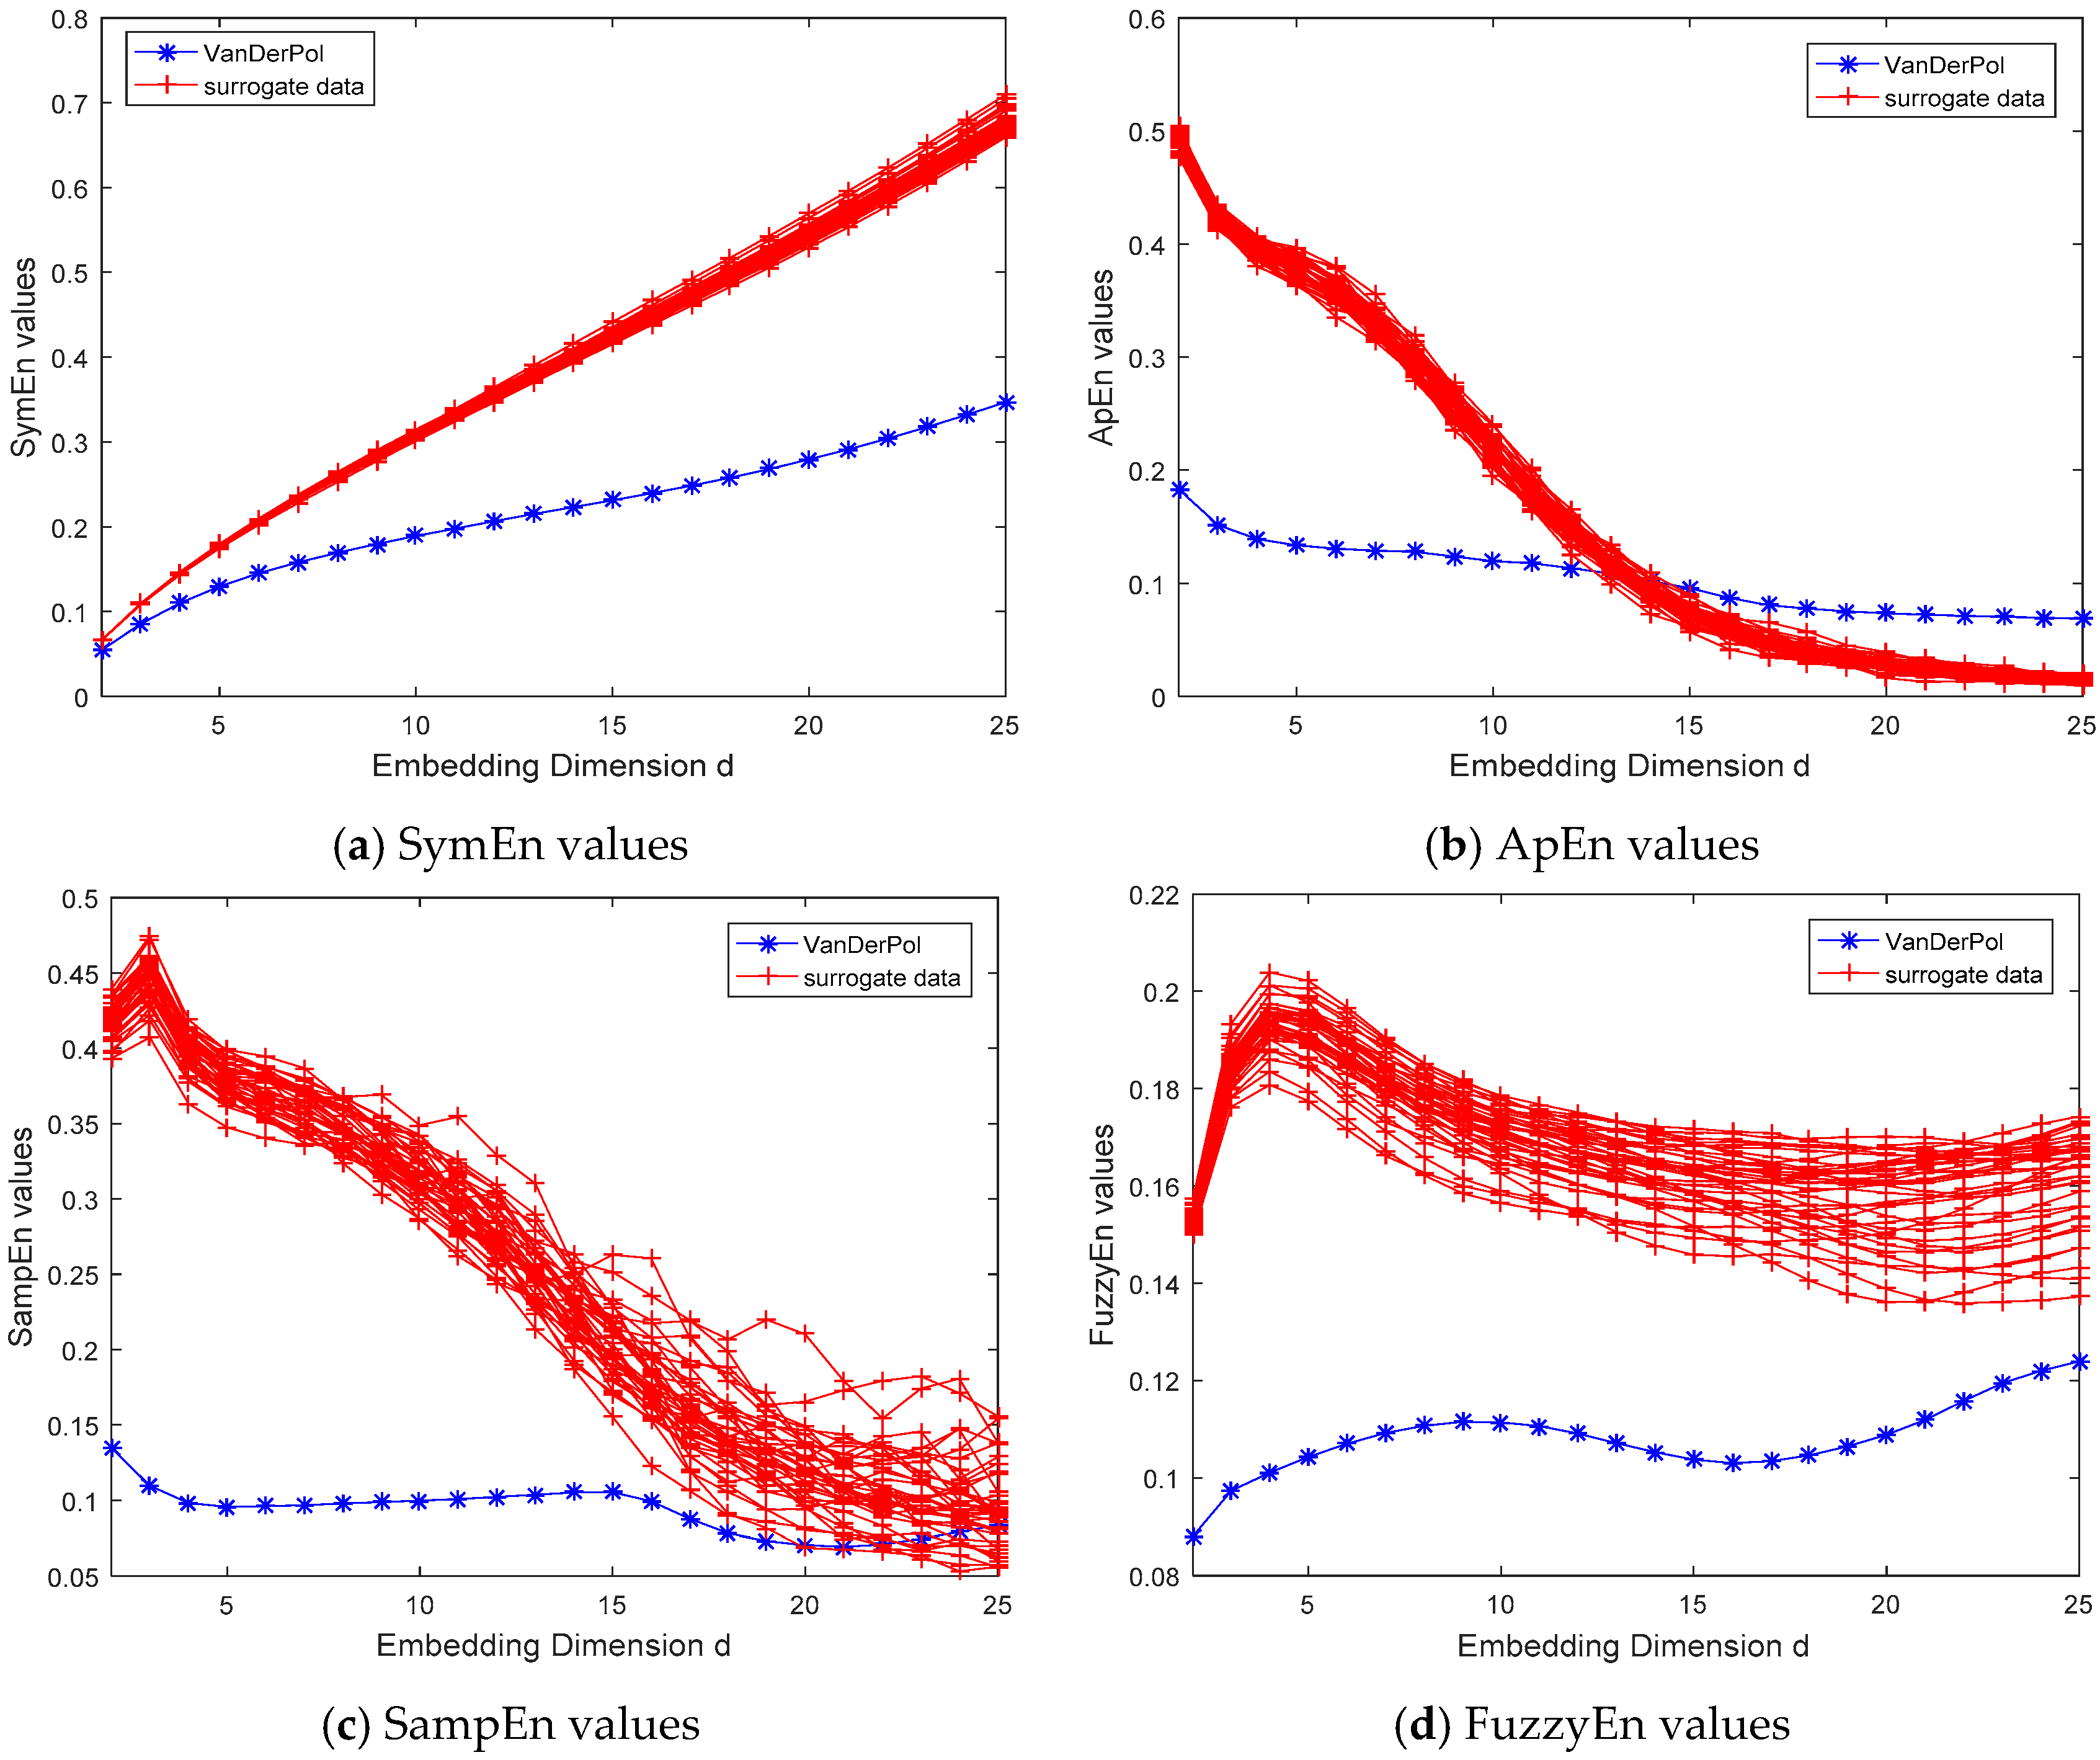
3.1. Applicantion to Synthetic Time Series

In this section, the proposed SymEn method is applied to analyze several synthetic time series (Gaussian white noise and three chaotic time series) in Section 2.2.1. Meanwhile, the reported results are compared with those given by the ApEn, SampEn and FuzzyEn methods.

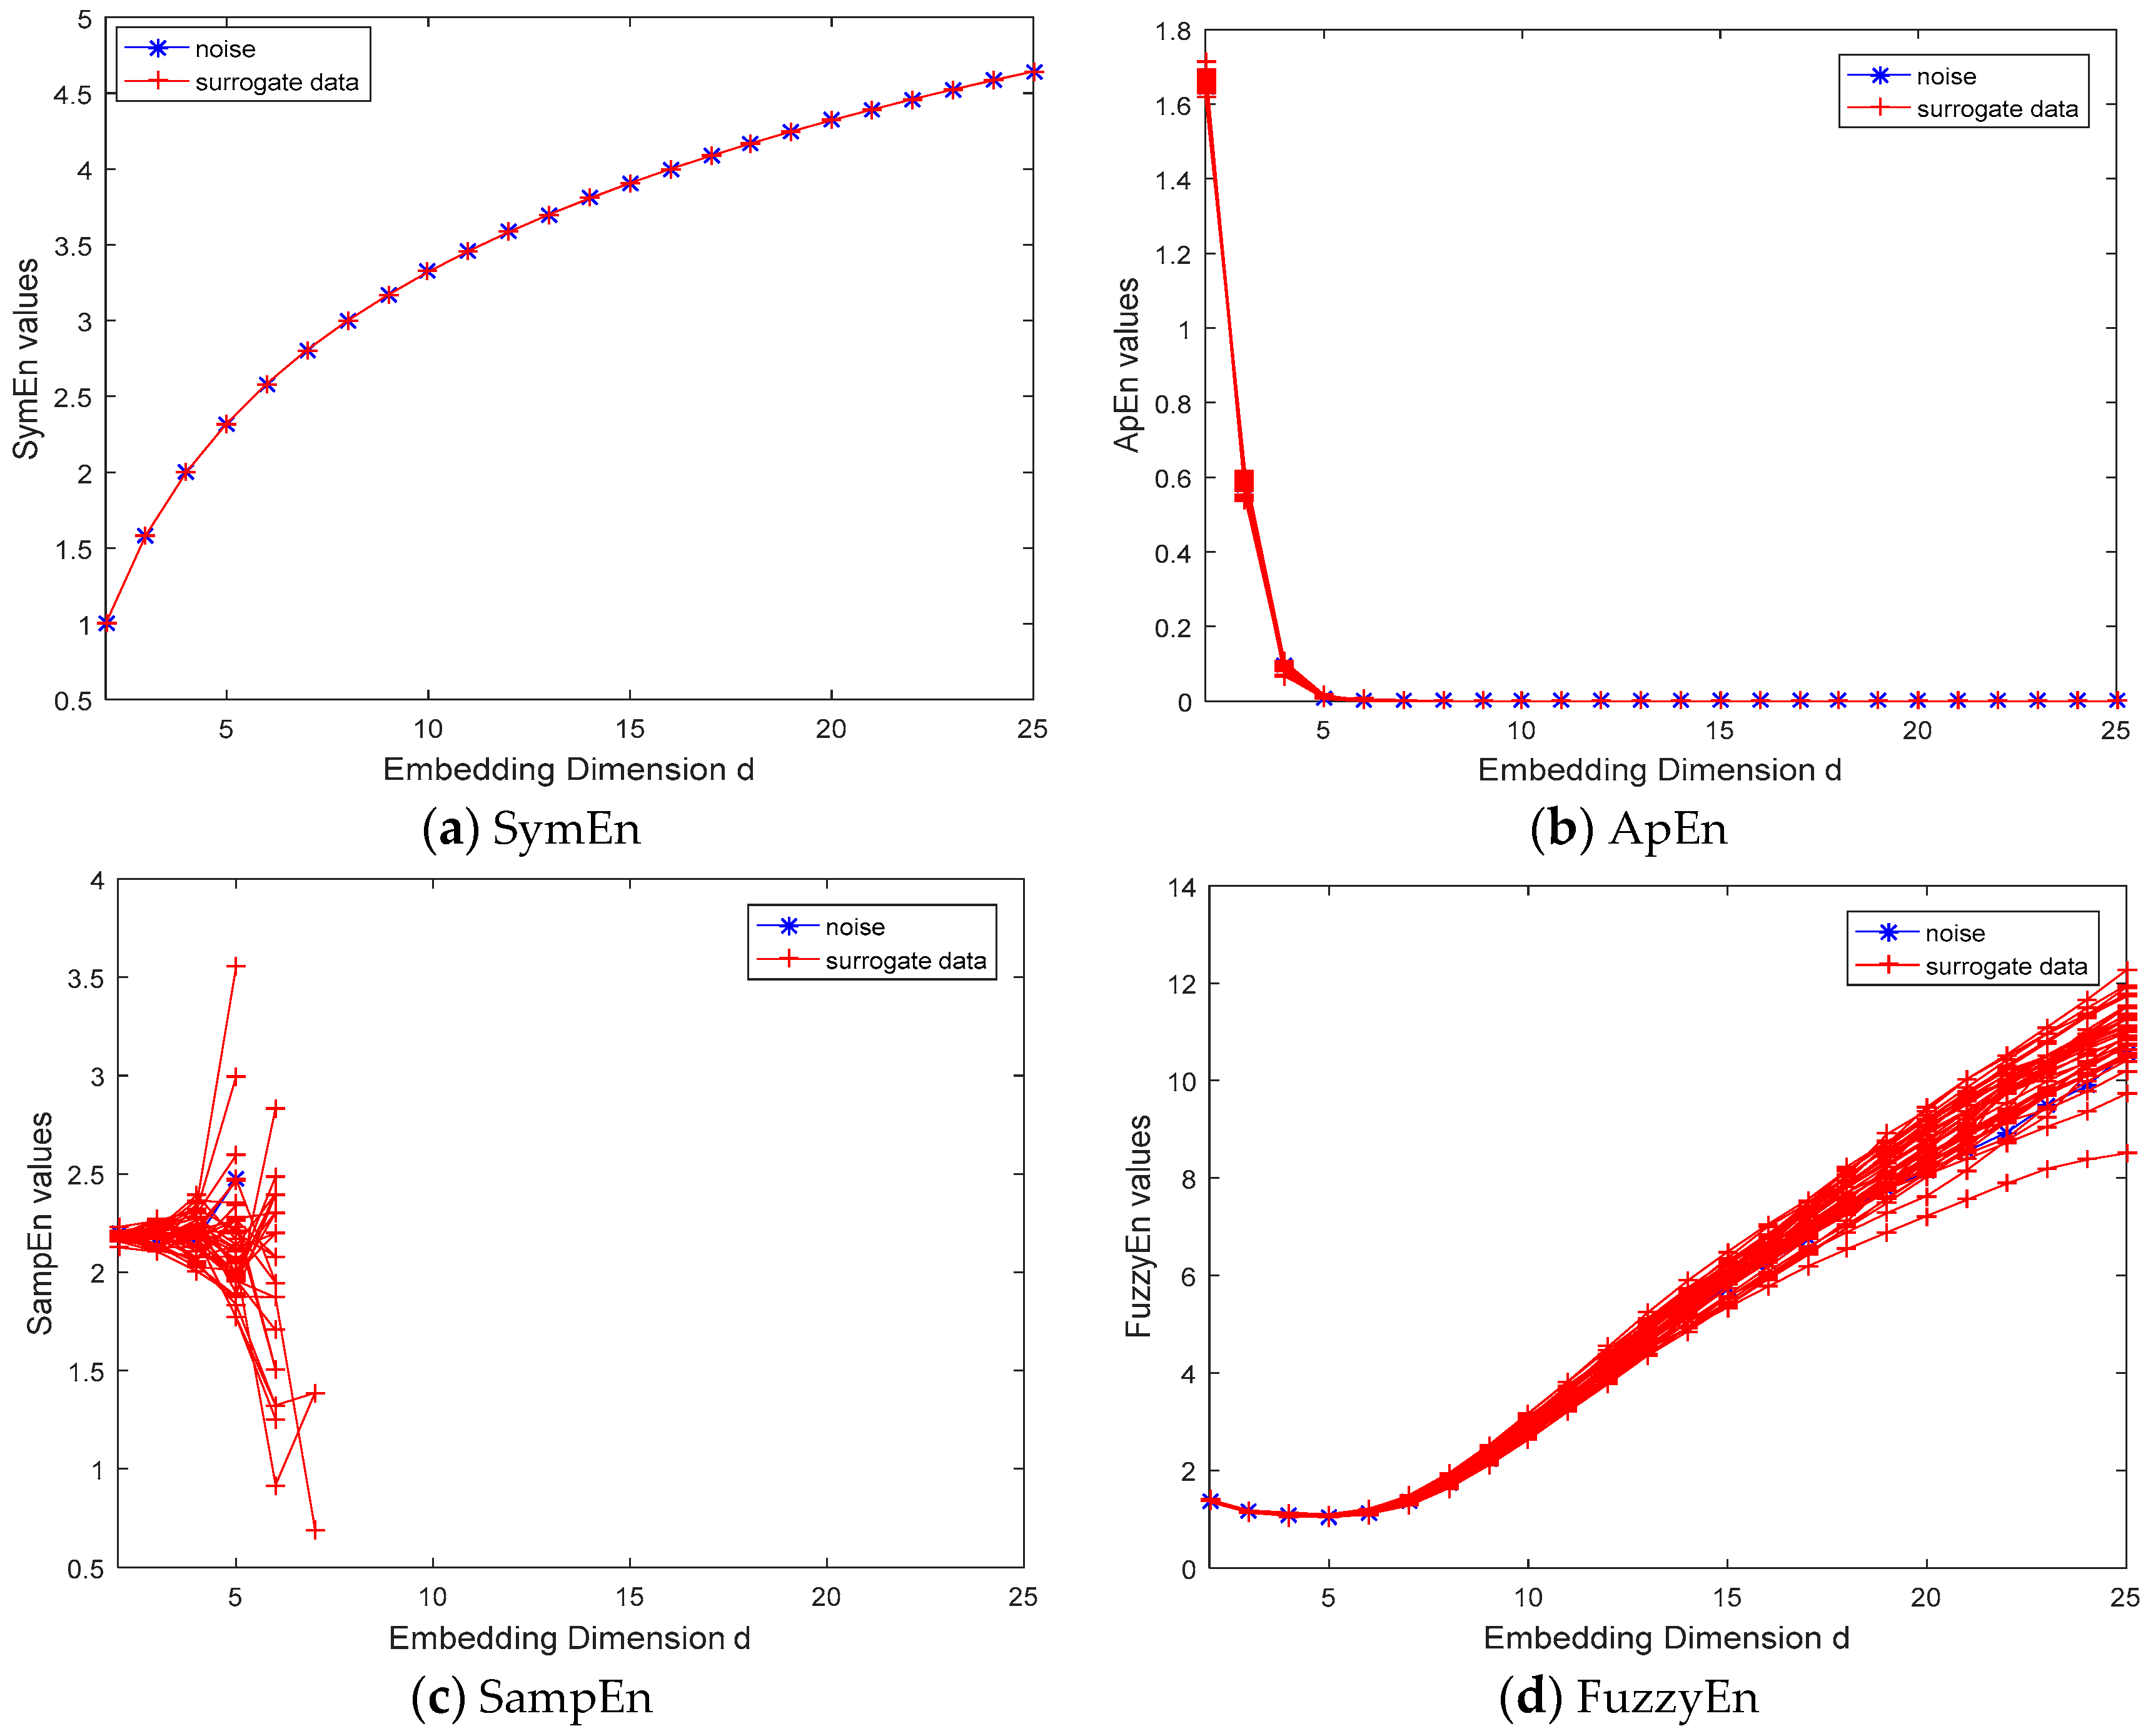
3.1.1. Tests on Gaussian White Noise Process

For the noise data from the Gaussian white noise process, we note that its surrogates—which are generated according to the null hypothesis of a linear autocorrelated Gaussian noise process—should give negative results. In other words, the null hypothesis should not be rejected. Figure 2 gives the analysis of the noise time series and its surrogate data on the embedding dimension d = 2:25 for four entropy methods. The results show that the entropy values are different for the different methods (see Figure 2). However, there is no difference between the noise and its surrogate data for the four entropy methods. These results indicate that the null hypothesis is accepted at the 95% confidence level. In other words, the noise data is from the same dynamical process as its surrogates from the null hypothesis. Considering that the dynamical property of the noise is an equiprobable distribution in different embedding dimension d (see Figure 1), its entropy values should increase with the number of the embedding dimension. The symplectic entropy method presents that the SymEn values of the noise and its surrogates increase with the increase of the embedding dimensions (see Figure 2a). However, for the approximate entropy, the values decrease with the increase of the embedding dimensions (see Figure 2b). For the sample entropy, the values vary with the increase of the embedding dimensions, especially no values in the higher dimensions (see Figure 2c). For the fuzzy entropy, with the increase of the dimension, the values decrease a little in the lower dimensions and then increase rapidly in the higher dimensions (see Figure 2d).

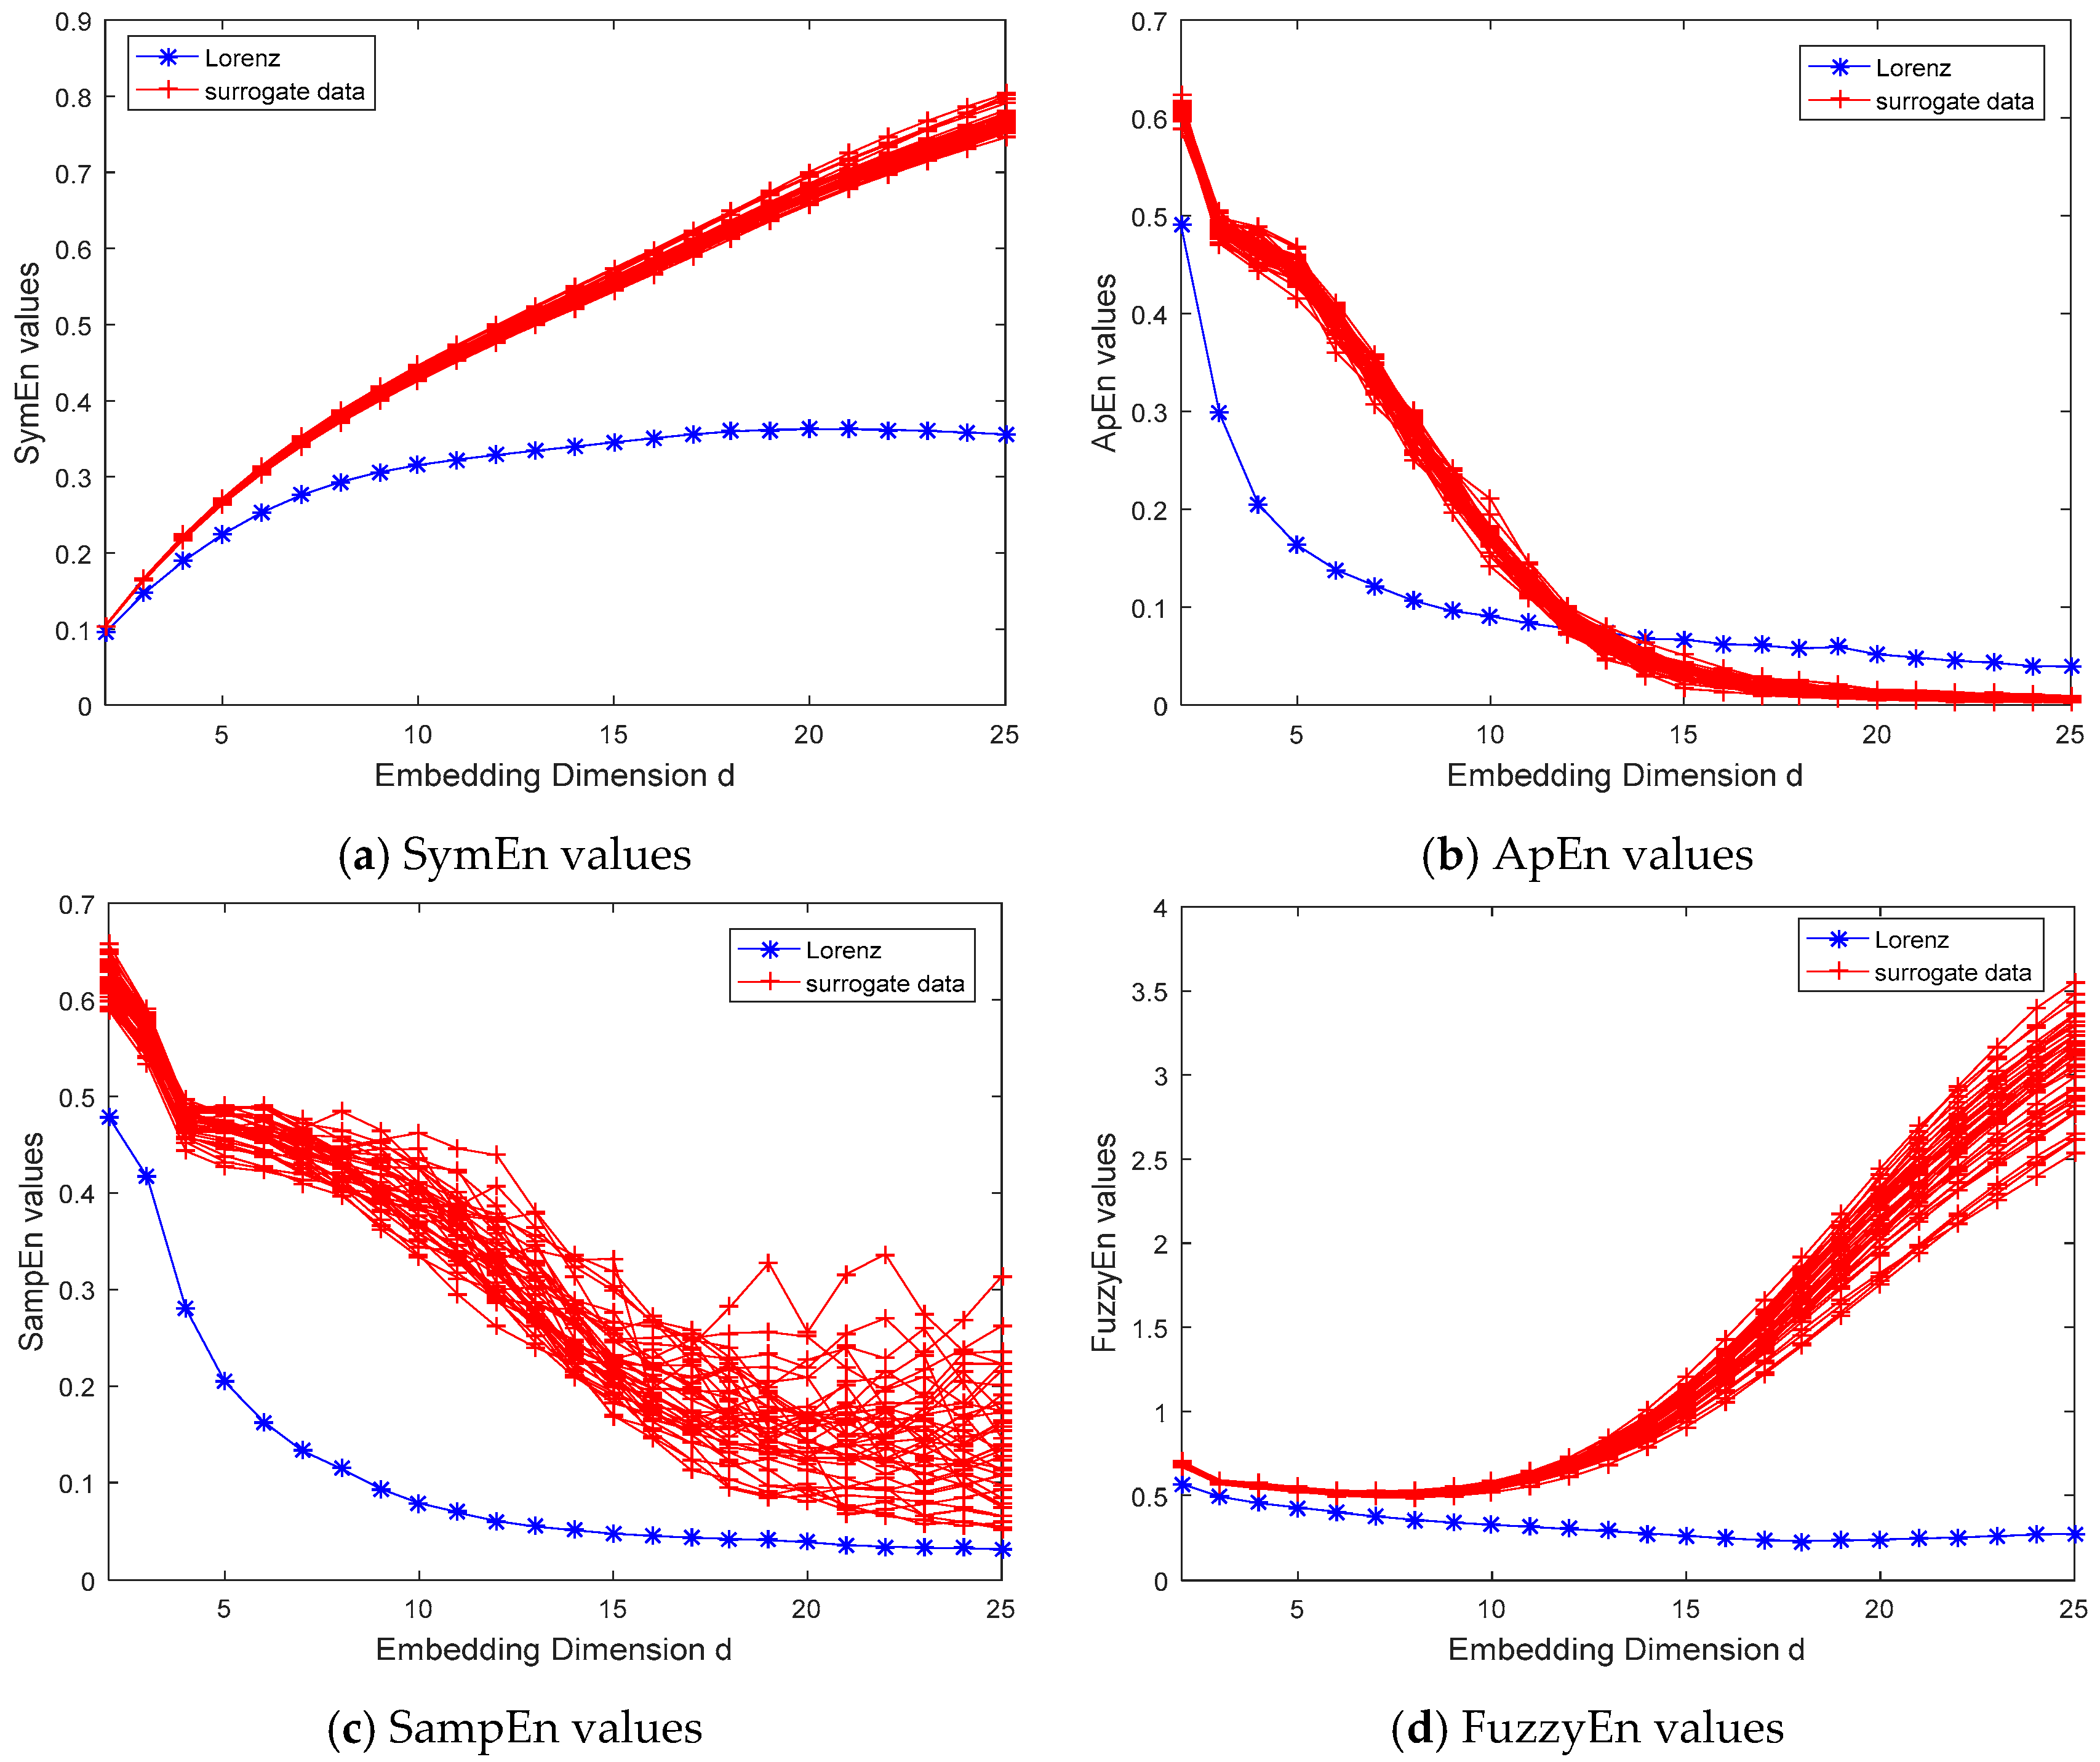
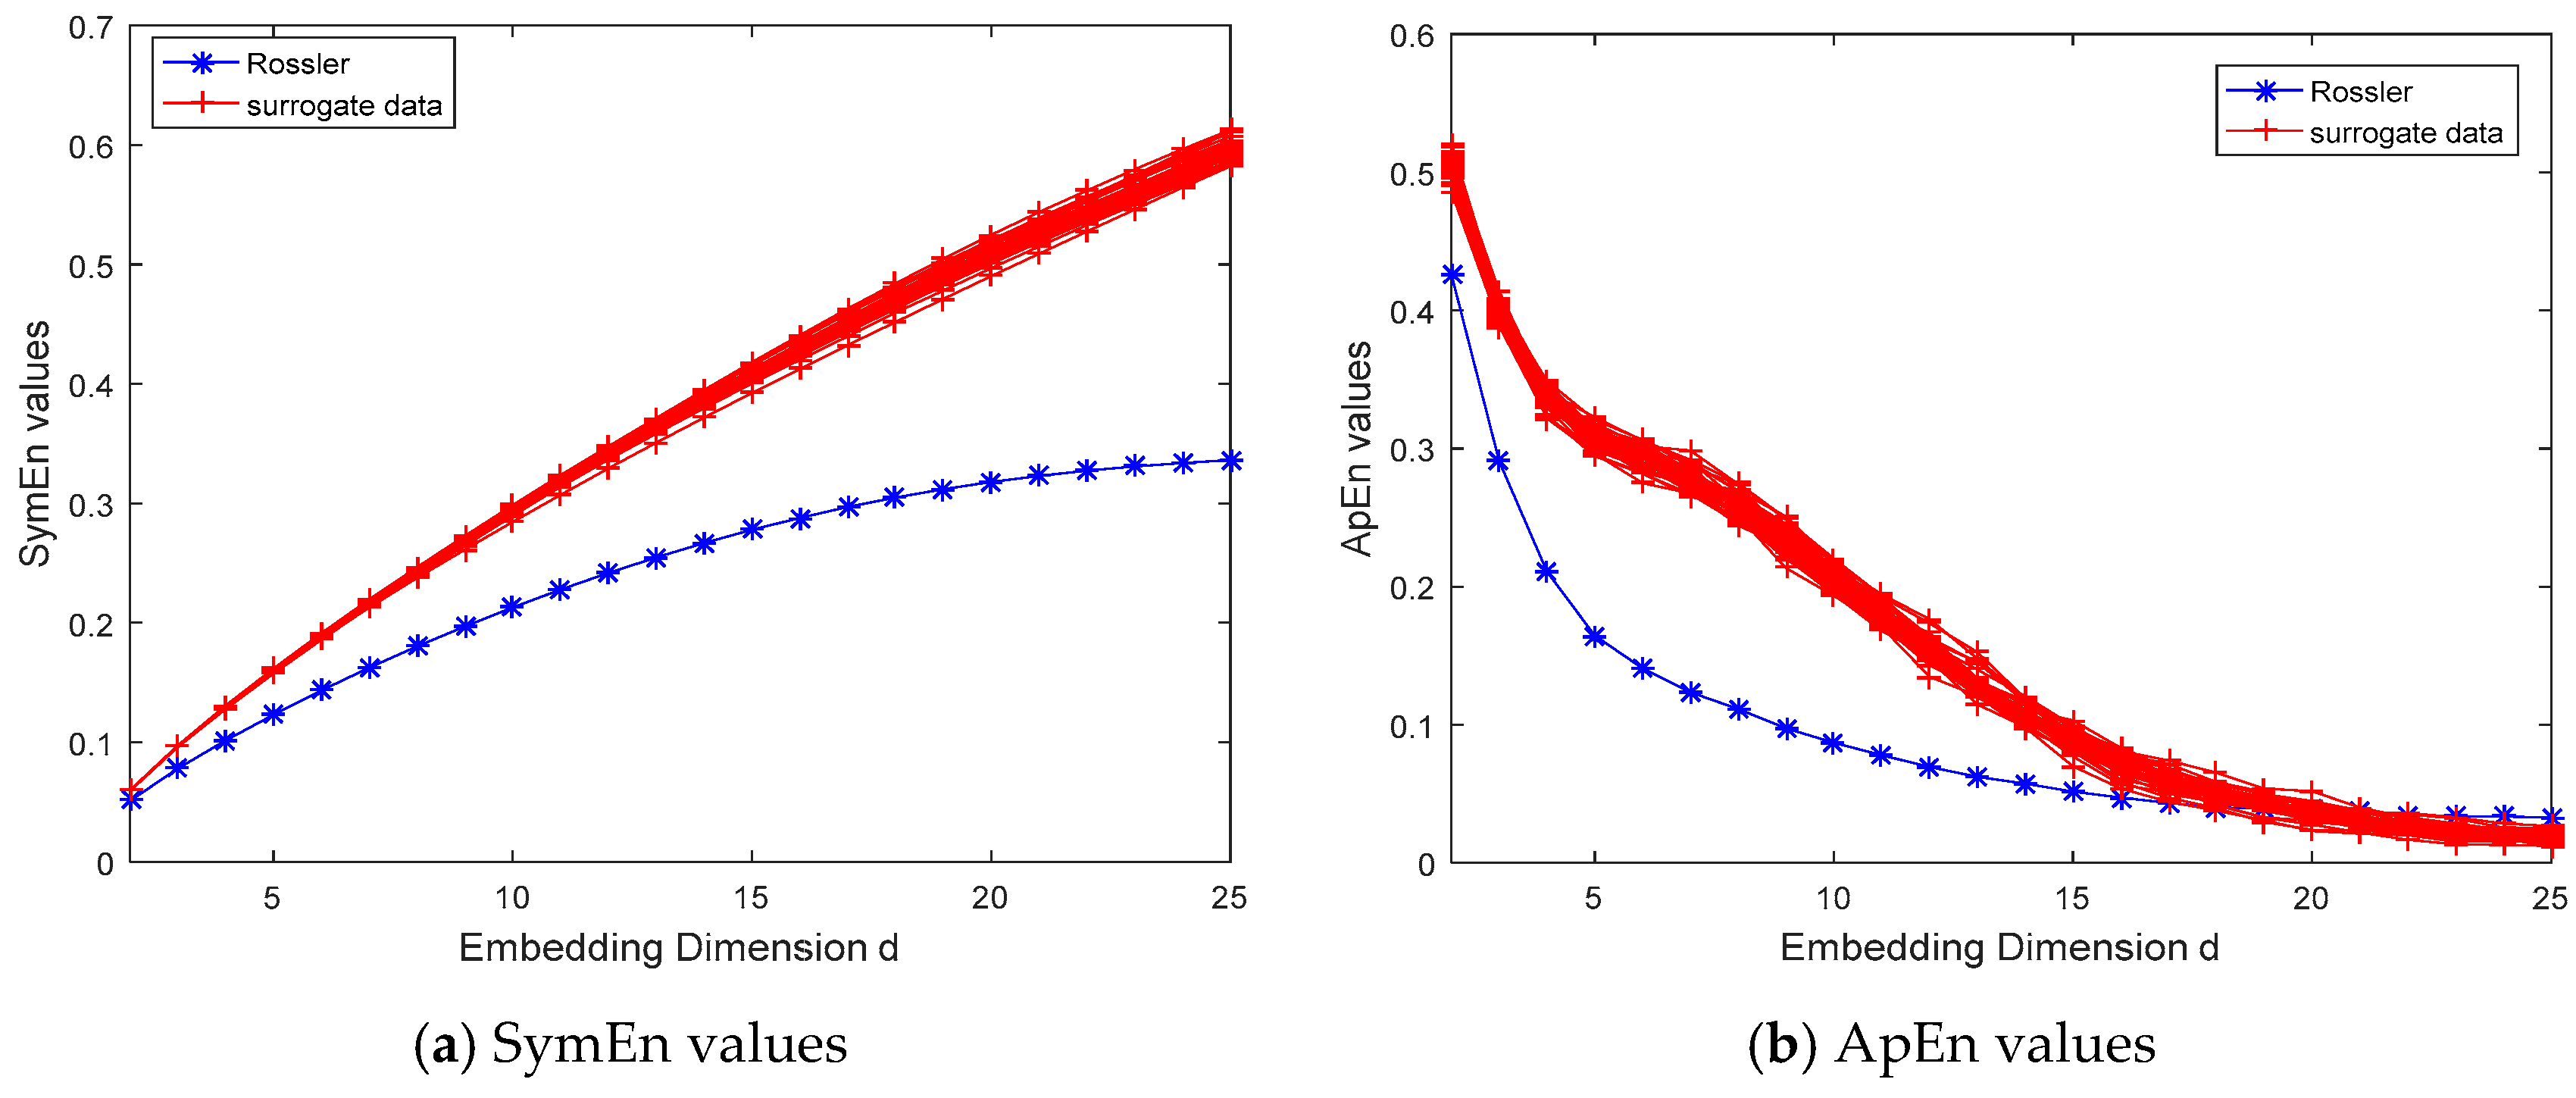
3.1.2. Tests on Chaotic Dynamical Systems

Three chaotic time series coming from three chaotic dynamical systems are analyzed by the SymEn, ApEn, SampEn, and FuzzyEn methods, respectively. Figure 3, Figure 4 and Figure 5 give the results of four entropy methods for these time series and their surrogate data. Figure 3 shows that the Lorenz time series is different from its surrogate data in the embedding dimension d = 2:25. The SymEn values of the original data increase and tend to be flat with the increase of the embedding dimension, while those of its surrogate data only increase. The difference between the original data and its surrogates becomes widened with the increase of the dimension. Moreover, the results of the ApEn, SampEn, and FuzzyEn methods are similar to that of the SymEn method, although these values are dissimilar for different methods. That is, the entropy values of the raw data are also different from those of its surrogate data for the ApEn, SampEn, and FuzzyEn methods. The results indicate that the null hypothesis is rejected at the 95% level for four entropy methods. The Lorenz chaotic time series is not a random signal generated from a linear autocorrelated Gaussian process. The dynamical properties of the Lorenz chaotic time series are not the same as the dynamic characteristics of the surrogate data. The raw data should contain some nonlinear components. Furthermore, the chaotic time series from Rössler and Van der Pol chaotic dynamical systems are analyzed by the SymEn, ApEn, SampEn, and FuzzyEn methods (see Figure 4 and Figure 5). We can see that there is a significant difference between the entropy values of the raw Rössler and Van der Pol chaotic data and those of their surrogate data, respectively. The null hypothesis is rejected at the 95% confidence level for the raw Rössler and Van der Pol chaotic data, respectively. The results indicate that there are the nonlinear characteristics in the raw Rössler and Van der Pol chaotic data. By comparison with the ApEn, SampEn, and FuzzyEn methods, the SymEn method is able to detect the nonlinearity of the chaotic time series whose underlying dynamic property is known.

3.2. Application to Real Time Series

To further test the application of the SymEn method to the real data, some results are reported on experimental time series from several sources. We attempt to illustrate that the SymEn can be regarded as a measure to reflect the dynamic characteristics of time series from real complex systems by comparison with the ApEn, SampEn, and FuzzyEn methods.

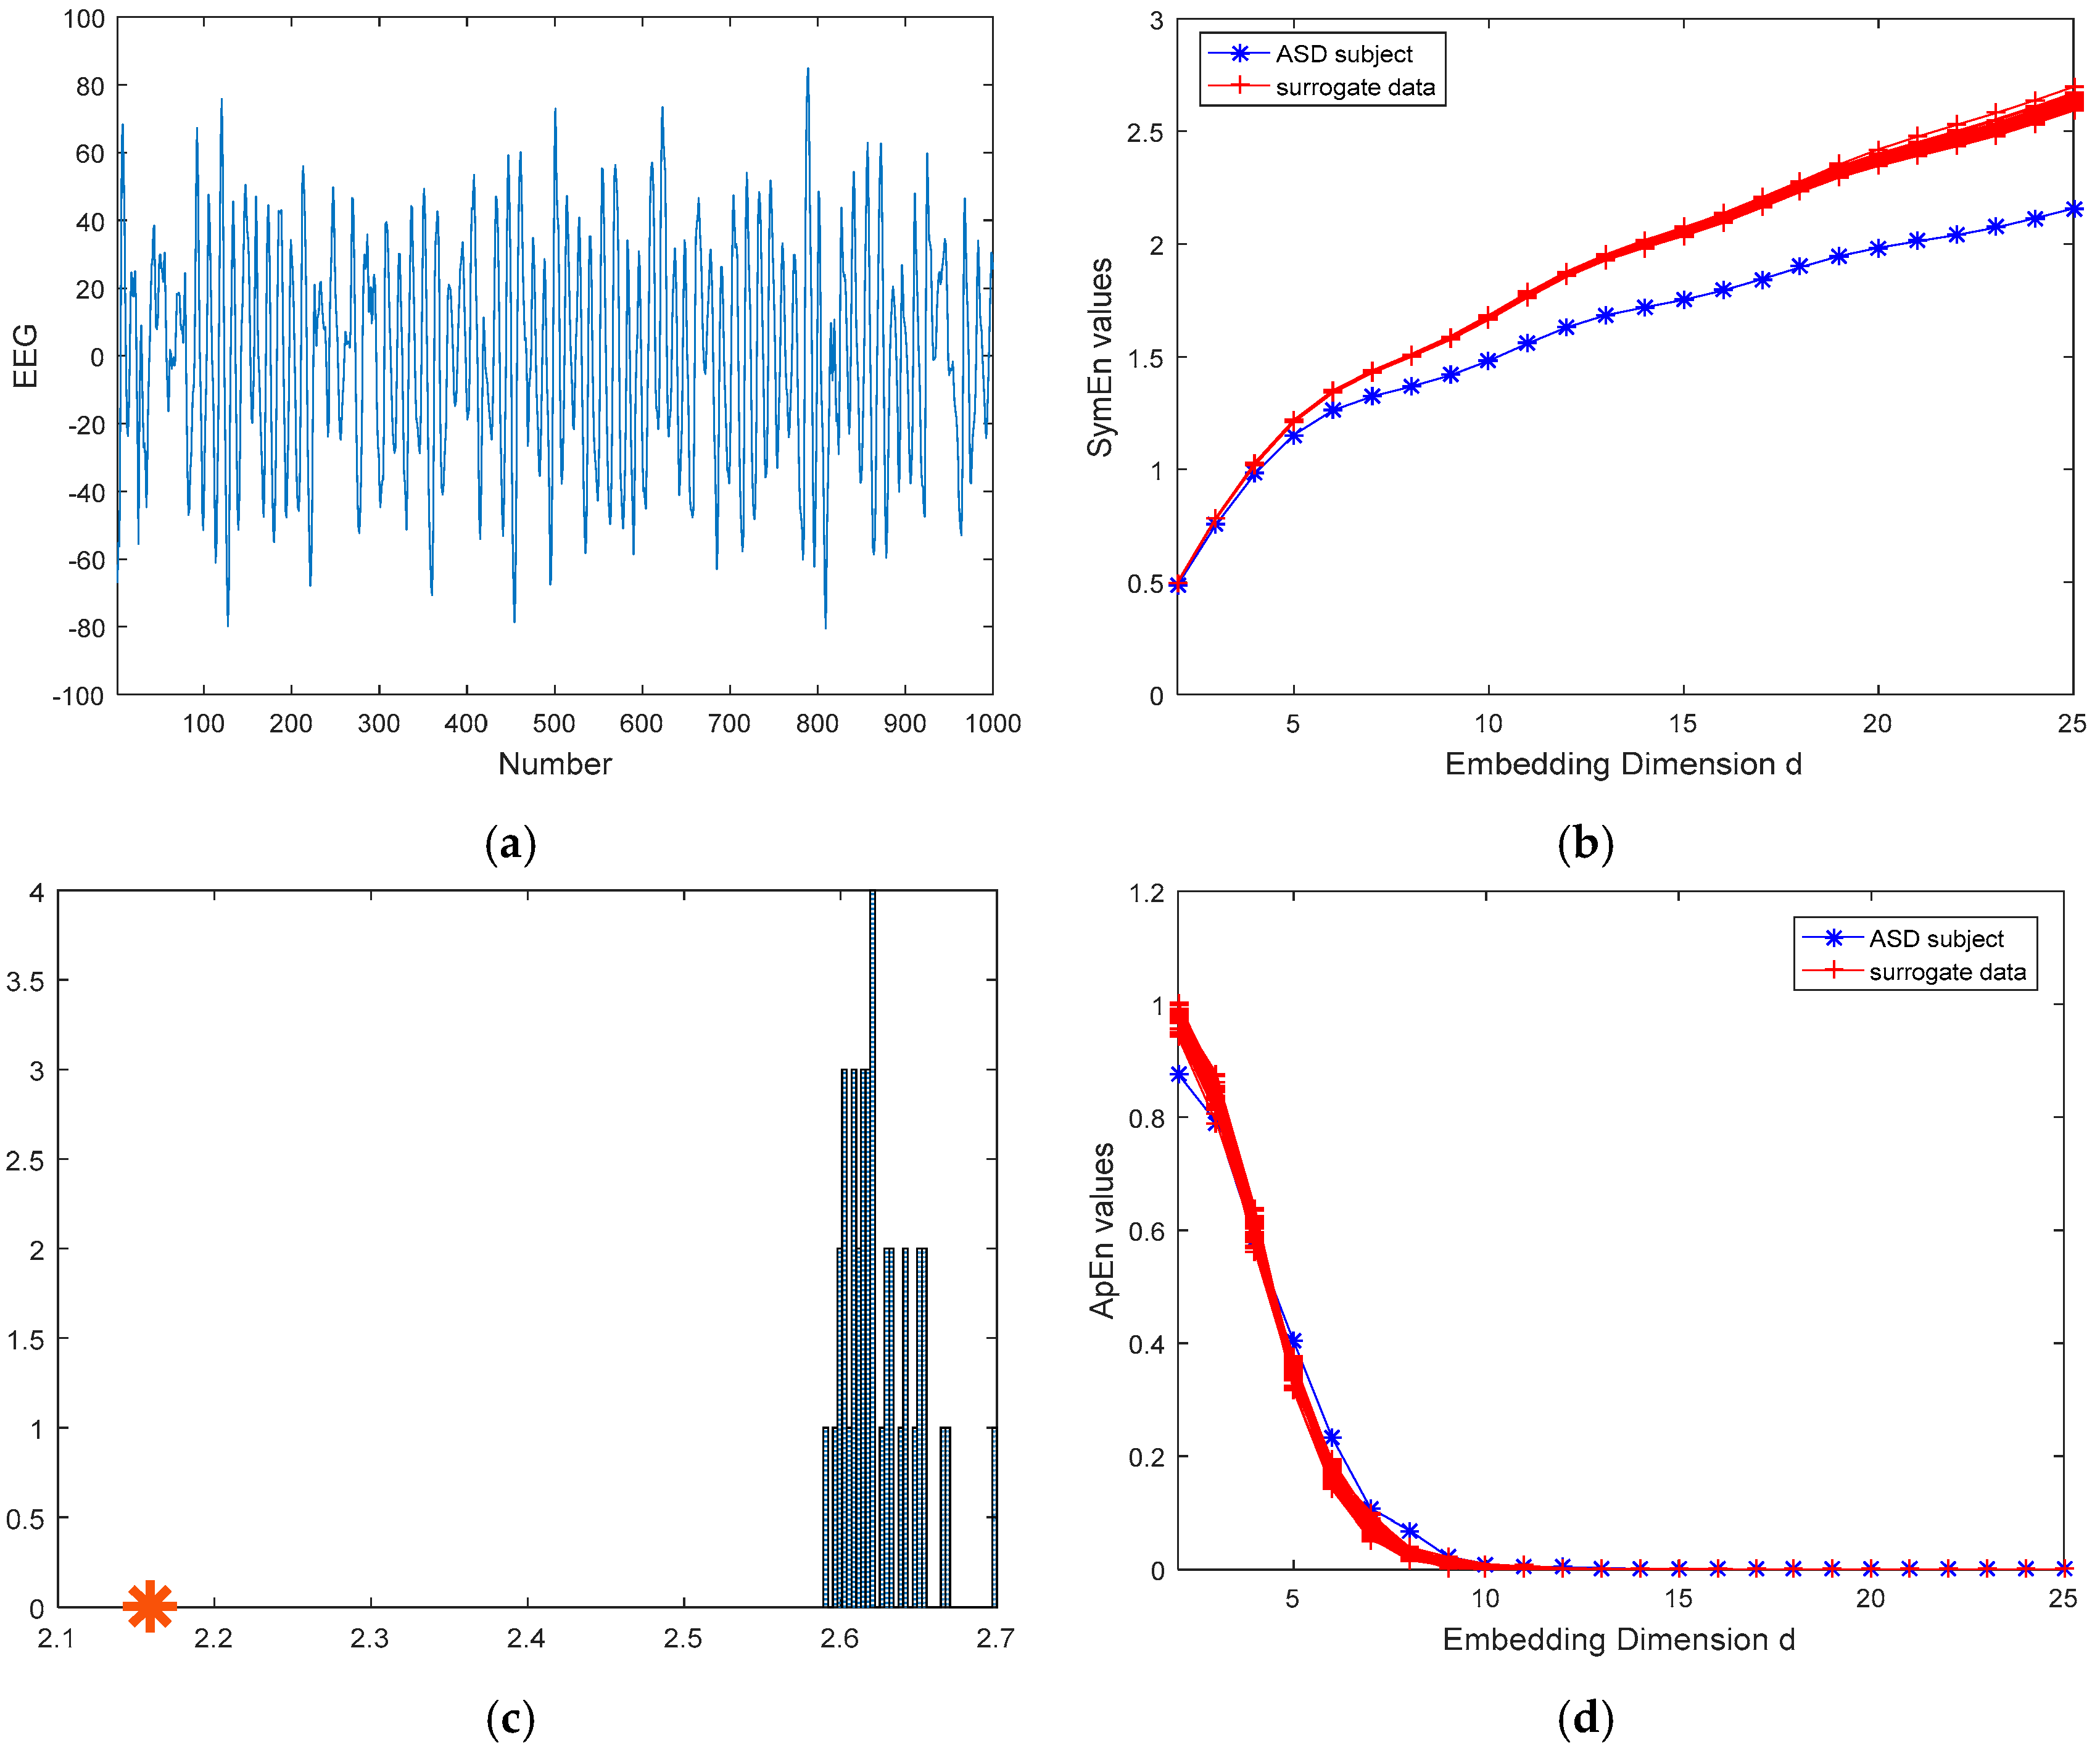
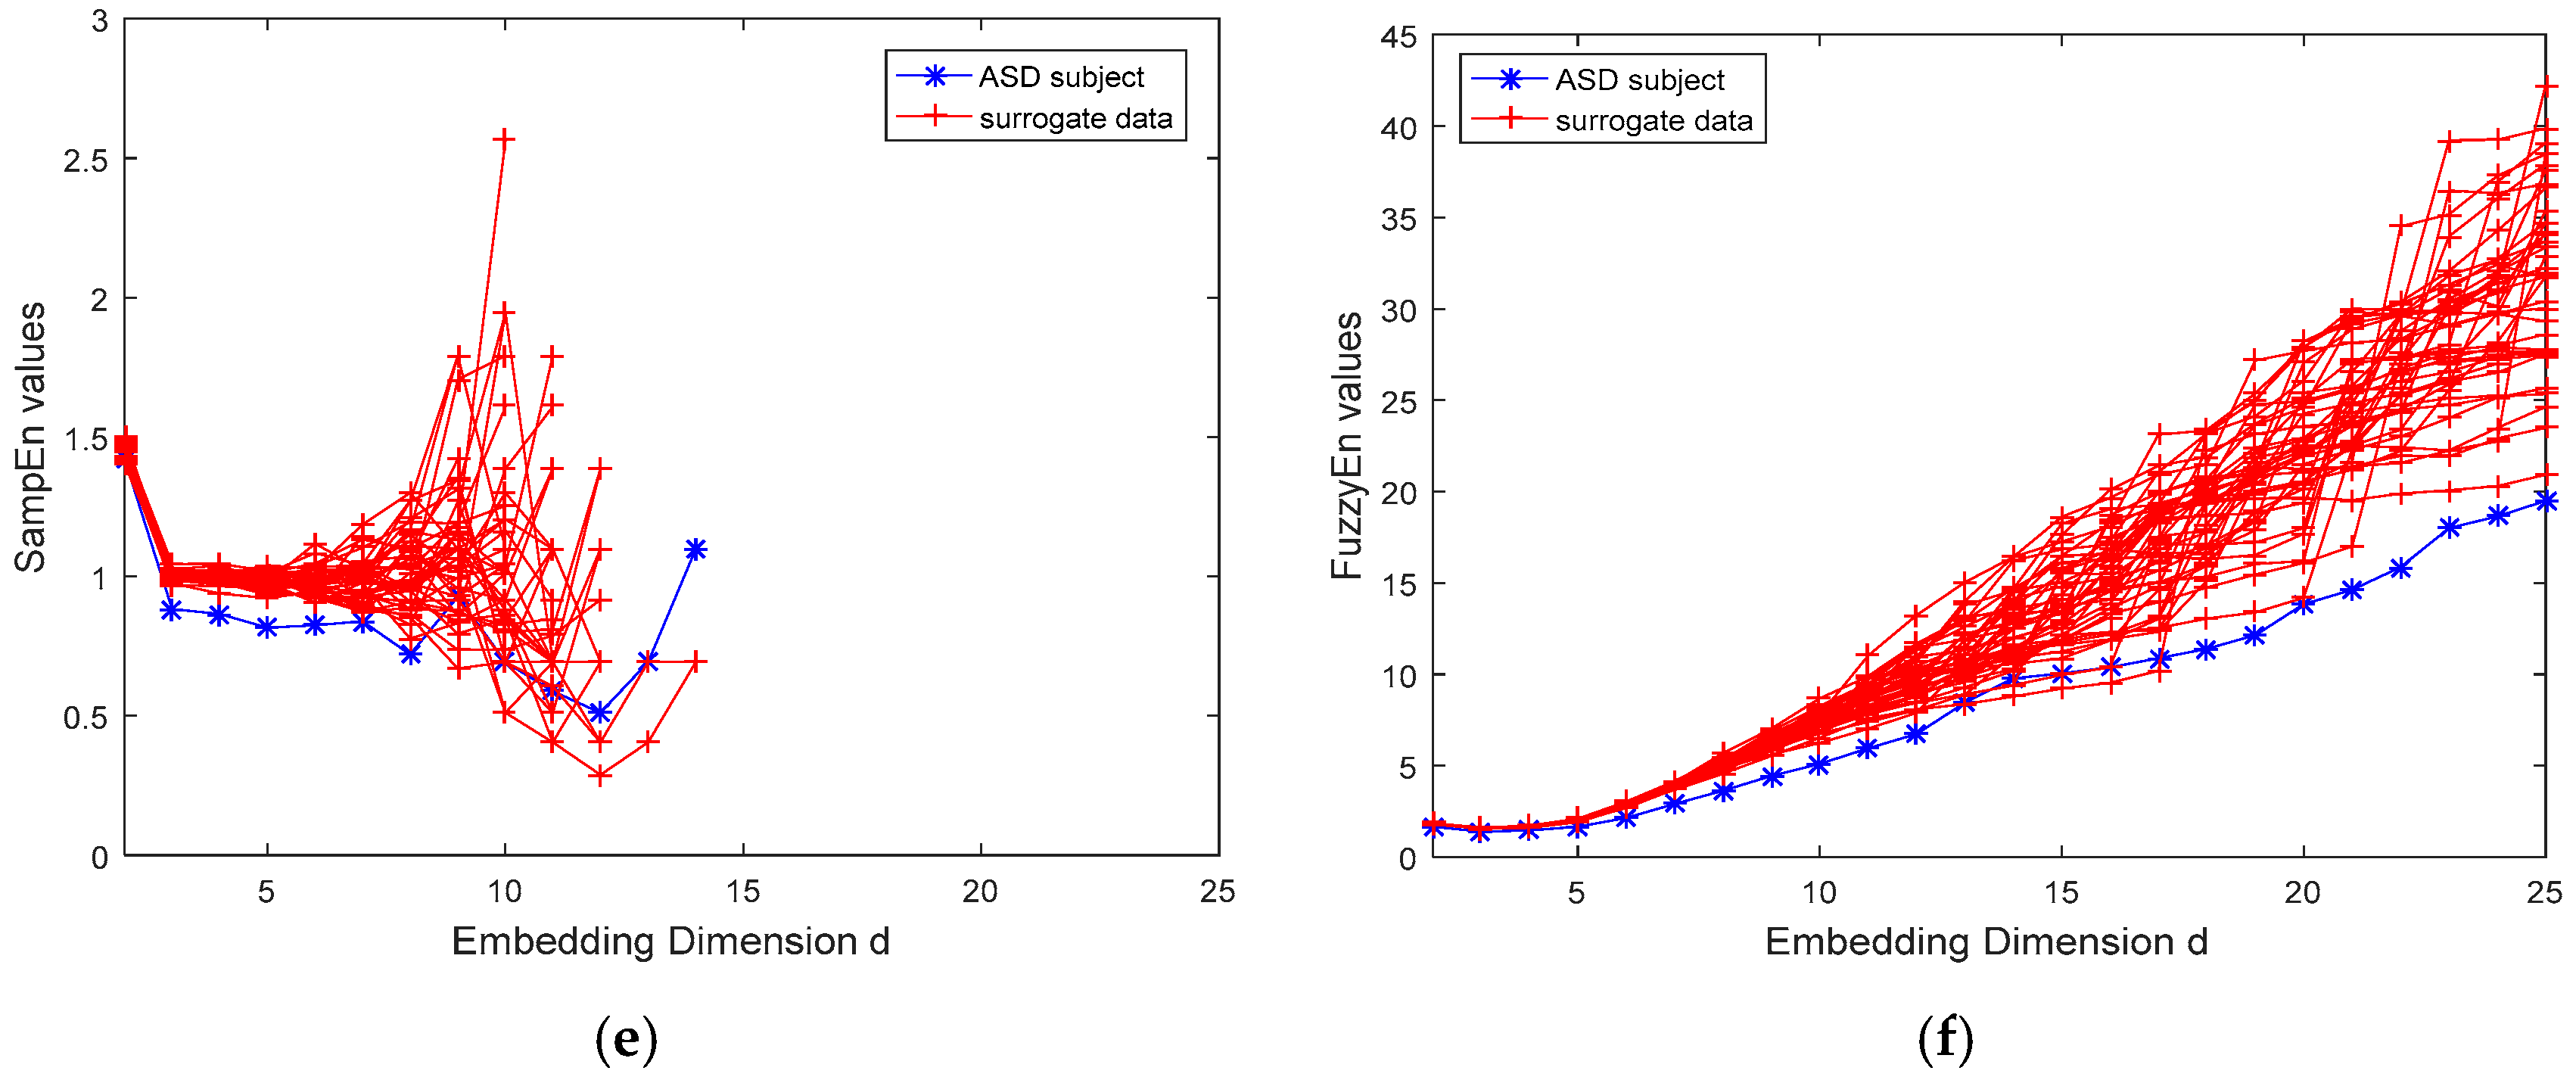
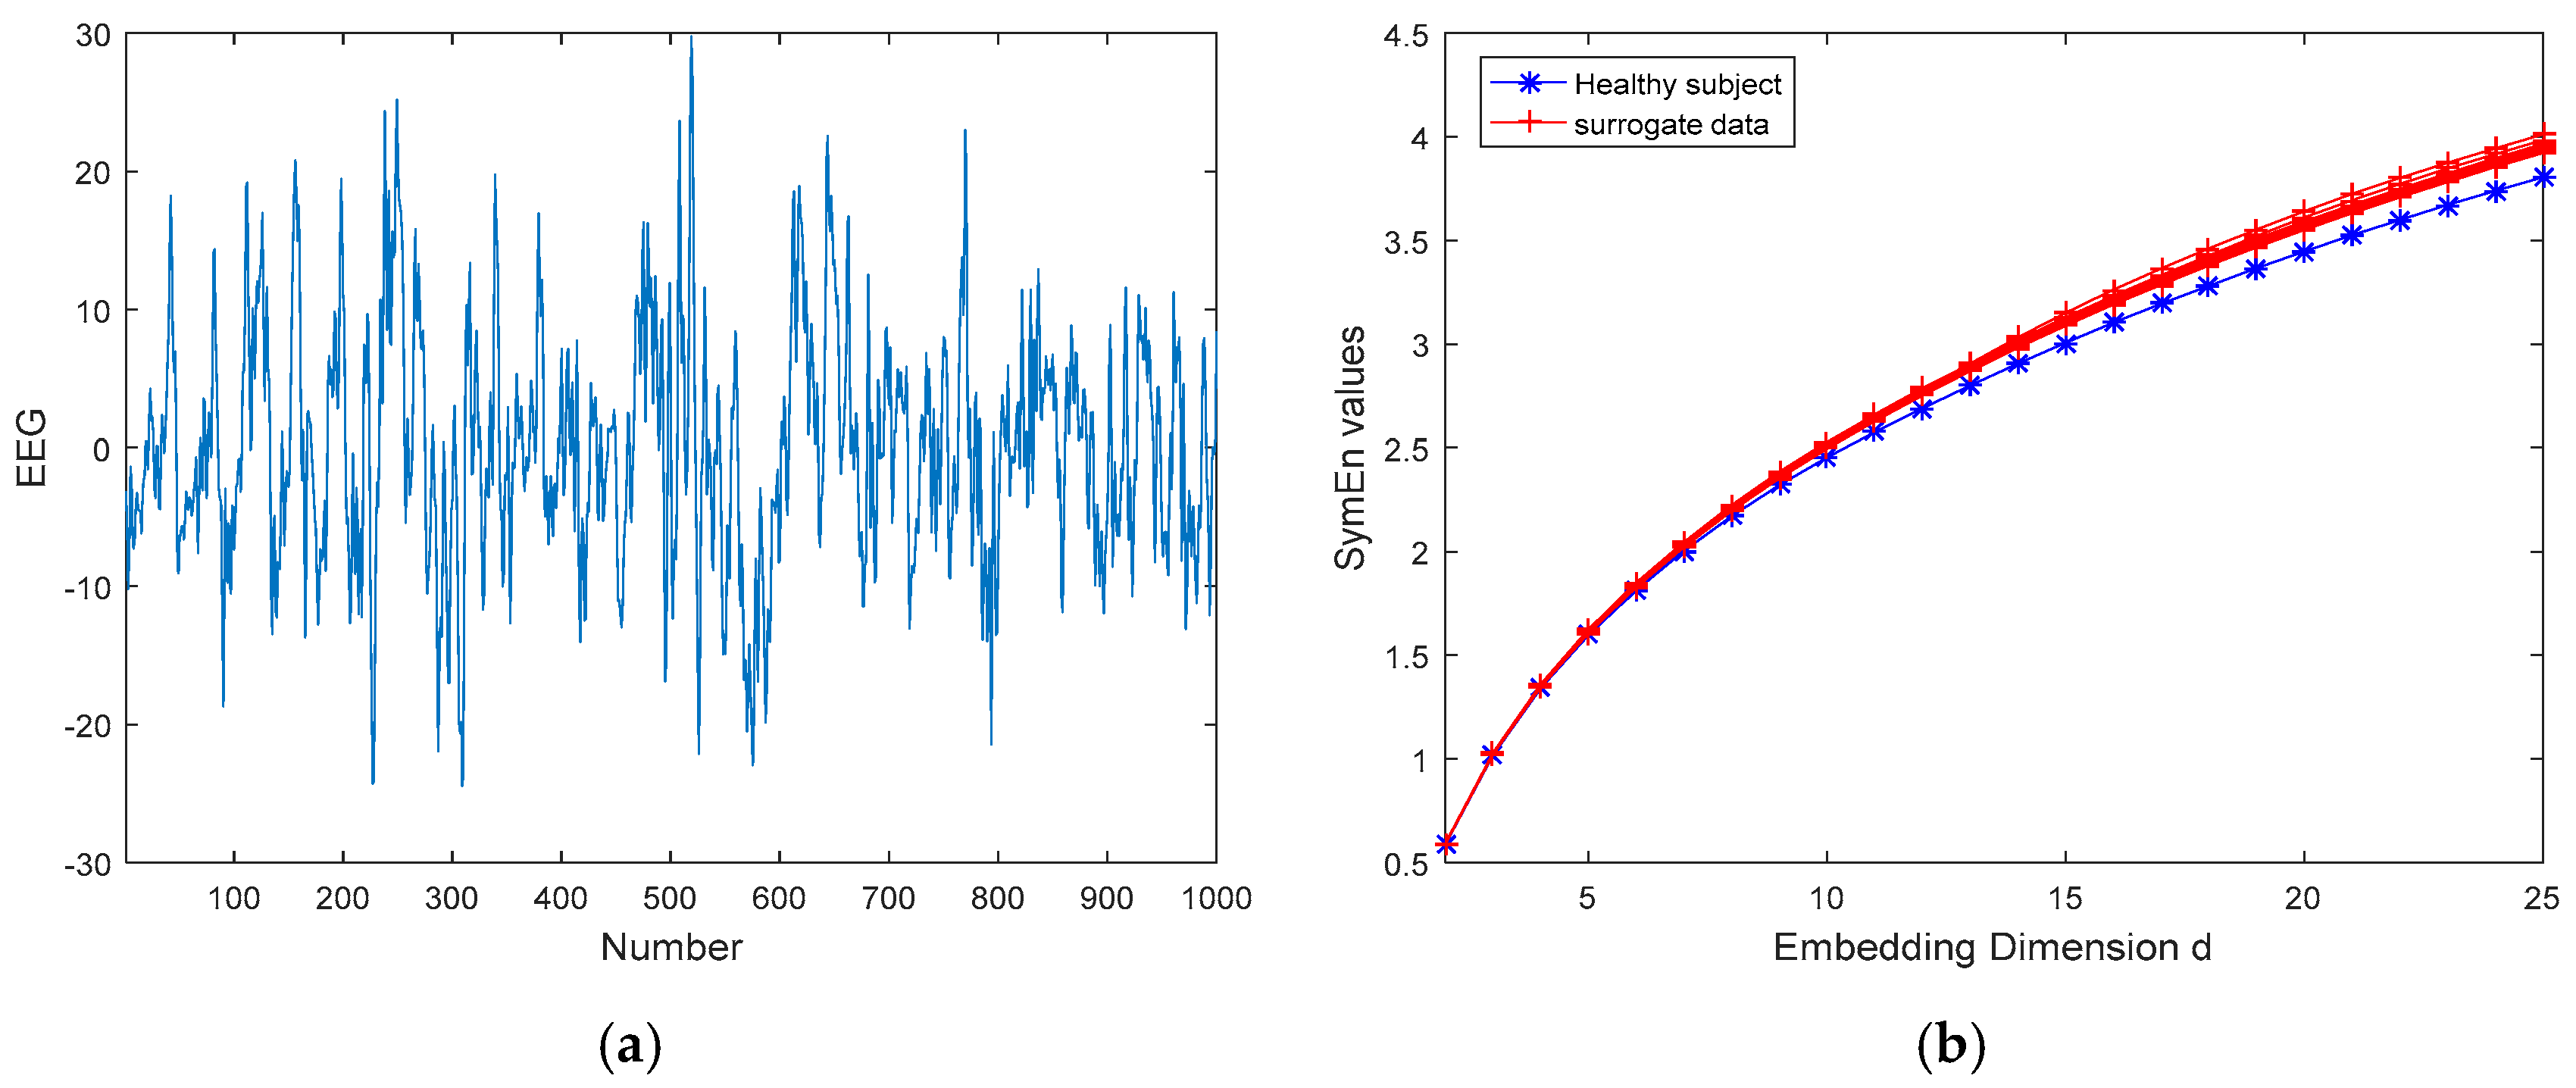
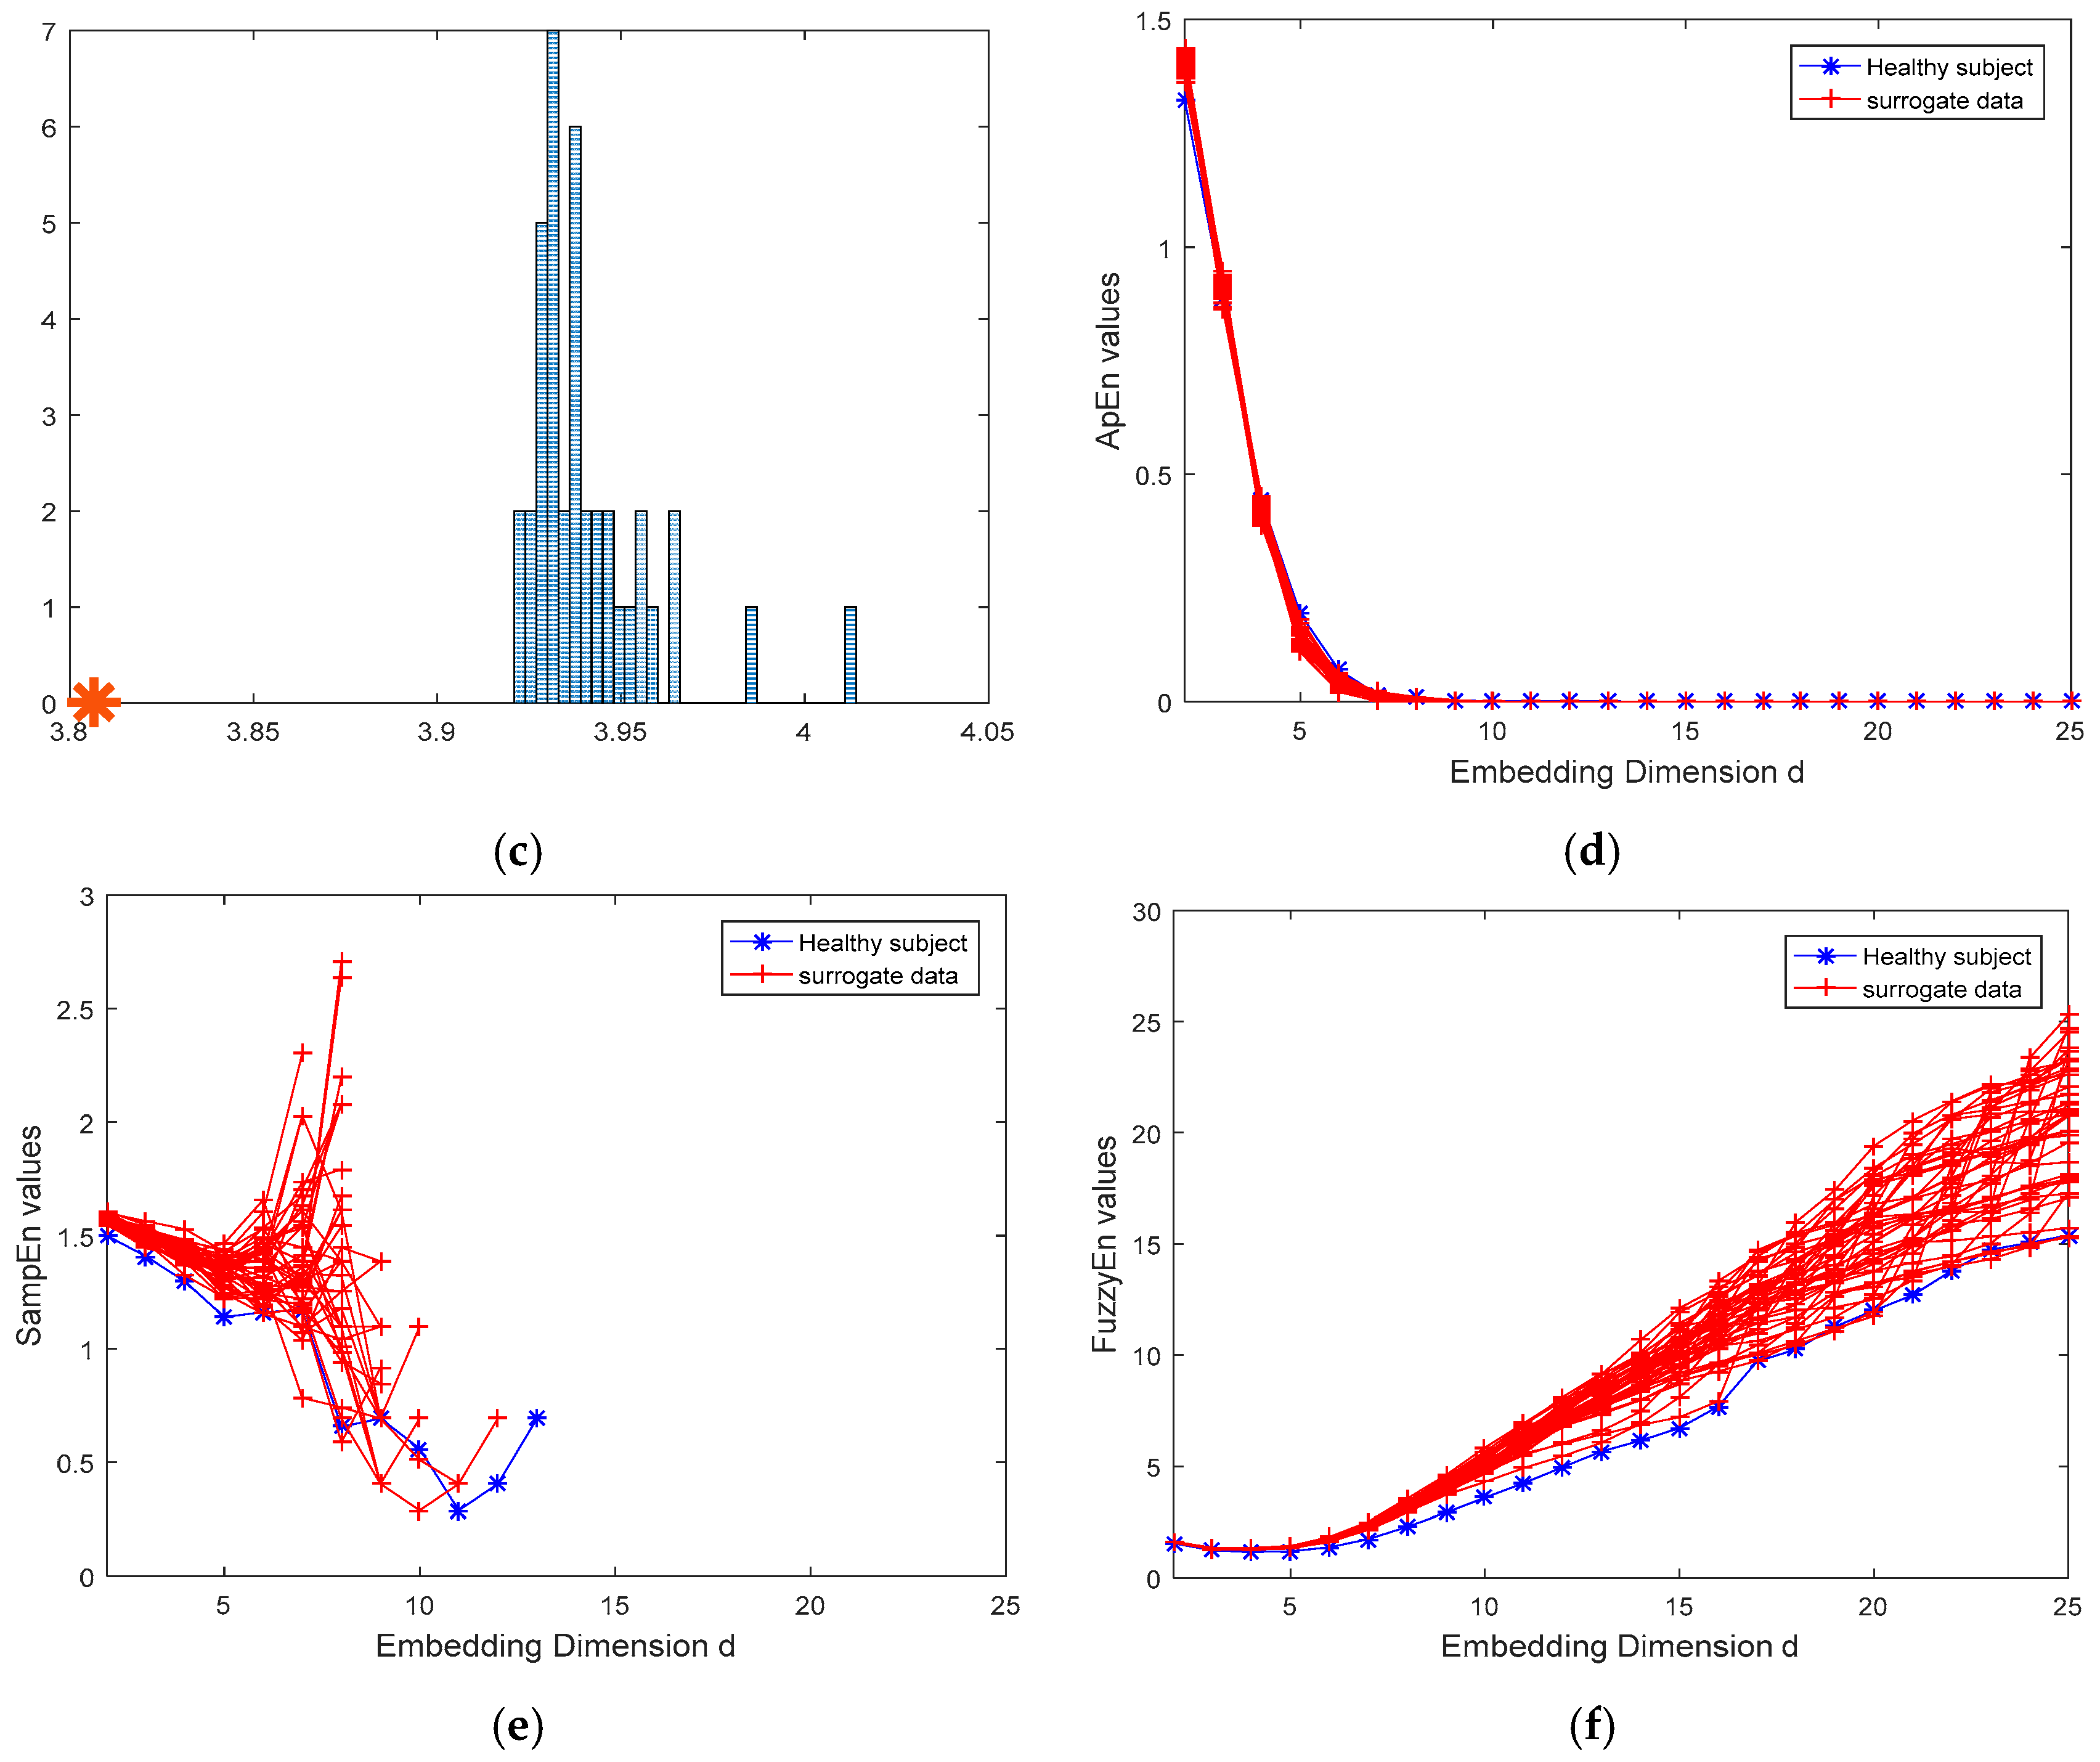
3.2.1. The EEG for ASD and Healthy Subjects

EEG signals have been widely used to investigate electrical brain activity. Although many nonlinear measures have been employed to deal with the EEG signals (such as ApEn and SampEn [32,46]), the research has mostly focused on the classification analysis of EEG signals. However, an exploration of the nonlinearity in the EEG data is lacking. In particular, few studies detect the nonlinearity of the raw EEG data of ASD. For children with ASD, some nonlinear measures have been applied to directly analyze the corresponding EEG data in the resting state in order to explore the brain mechanics of ASD [40]. In this paper, we perform nonlinearity tests based on the SymEn measure on the EEG signals (O2) of ASD and healthy subjects. Figure 6 shows the raw EEG data for ASD subject in resting state with open eyes along with the SymEn functions of the raw EEG data and its surrogates. The SymEn values of the raw EEG are distinctly different from those of its surrogates—particularly in the higher dimensions (Figure 6b,c). The test of the raw EEG data can reject the null hypothesis of a linear stochastic process at the 95% level (z > 1.96). Meanwhile, the results of the ApEn, SampEn, and FuzzyEn methods are also shown in Figure 6. For the ApEn method, there is some difference between the raw data and its surrogate data in the low dimensions (see Figure 6d). The discrepancies also exist in the SampEn values of the raw data and its surrogate data in some embedding dimensions (see Figure 6e). The result of the FuzzyEn method is similar to that of the SampEn method (see Figure 6f). However, the differences between the raw data and its surrogates for the ApEn, SampEn, and FuzzyEn methods are not more obvious than that for the SymEn method, particularly in the higher embedding dimensions.
For the healthy subject, the results are similar to those of the ASD subject. Figure 7 presents the raw EEG signal as well as the SymEn, ApEn, SampEn, and FuzzyEn measures of the raw data and its surrogates. It can be observed that the SymEn values of the raw data do not belong to the distribution of the SymEn functions of the surrogates (see Figure 7b). Particularly in the dimension d = 25 (z > 1.96), the test of the raw data rejects the hypothesis of belonging to the same distribution as all 39 surrogates (see Figure 7b,c). The result indicates that the raw EEG data contains the nonlinear dynamical properties. The raw EEG data should come from a nonlinear dynamical system. However, the results for the ApEn, SampEn, and FuzzyEn methods are not better than that of the SymEn method (see Figure 7b,d–f).

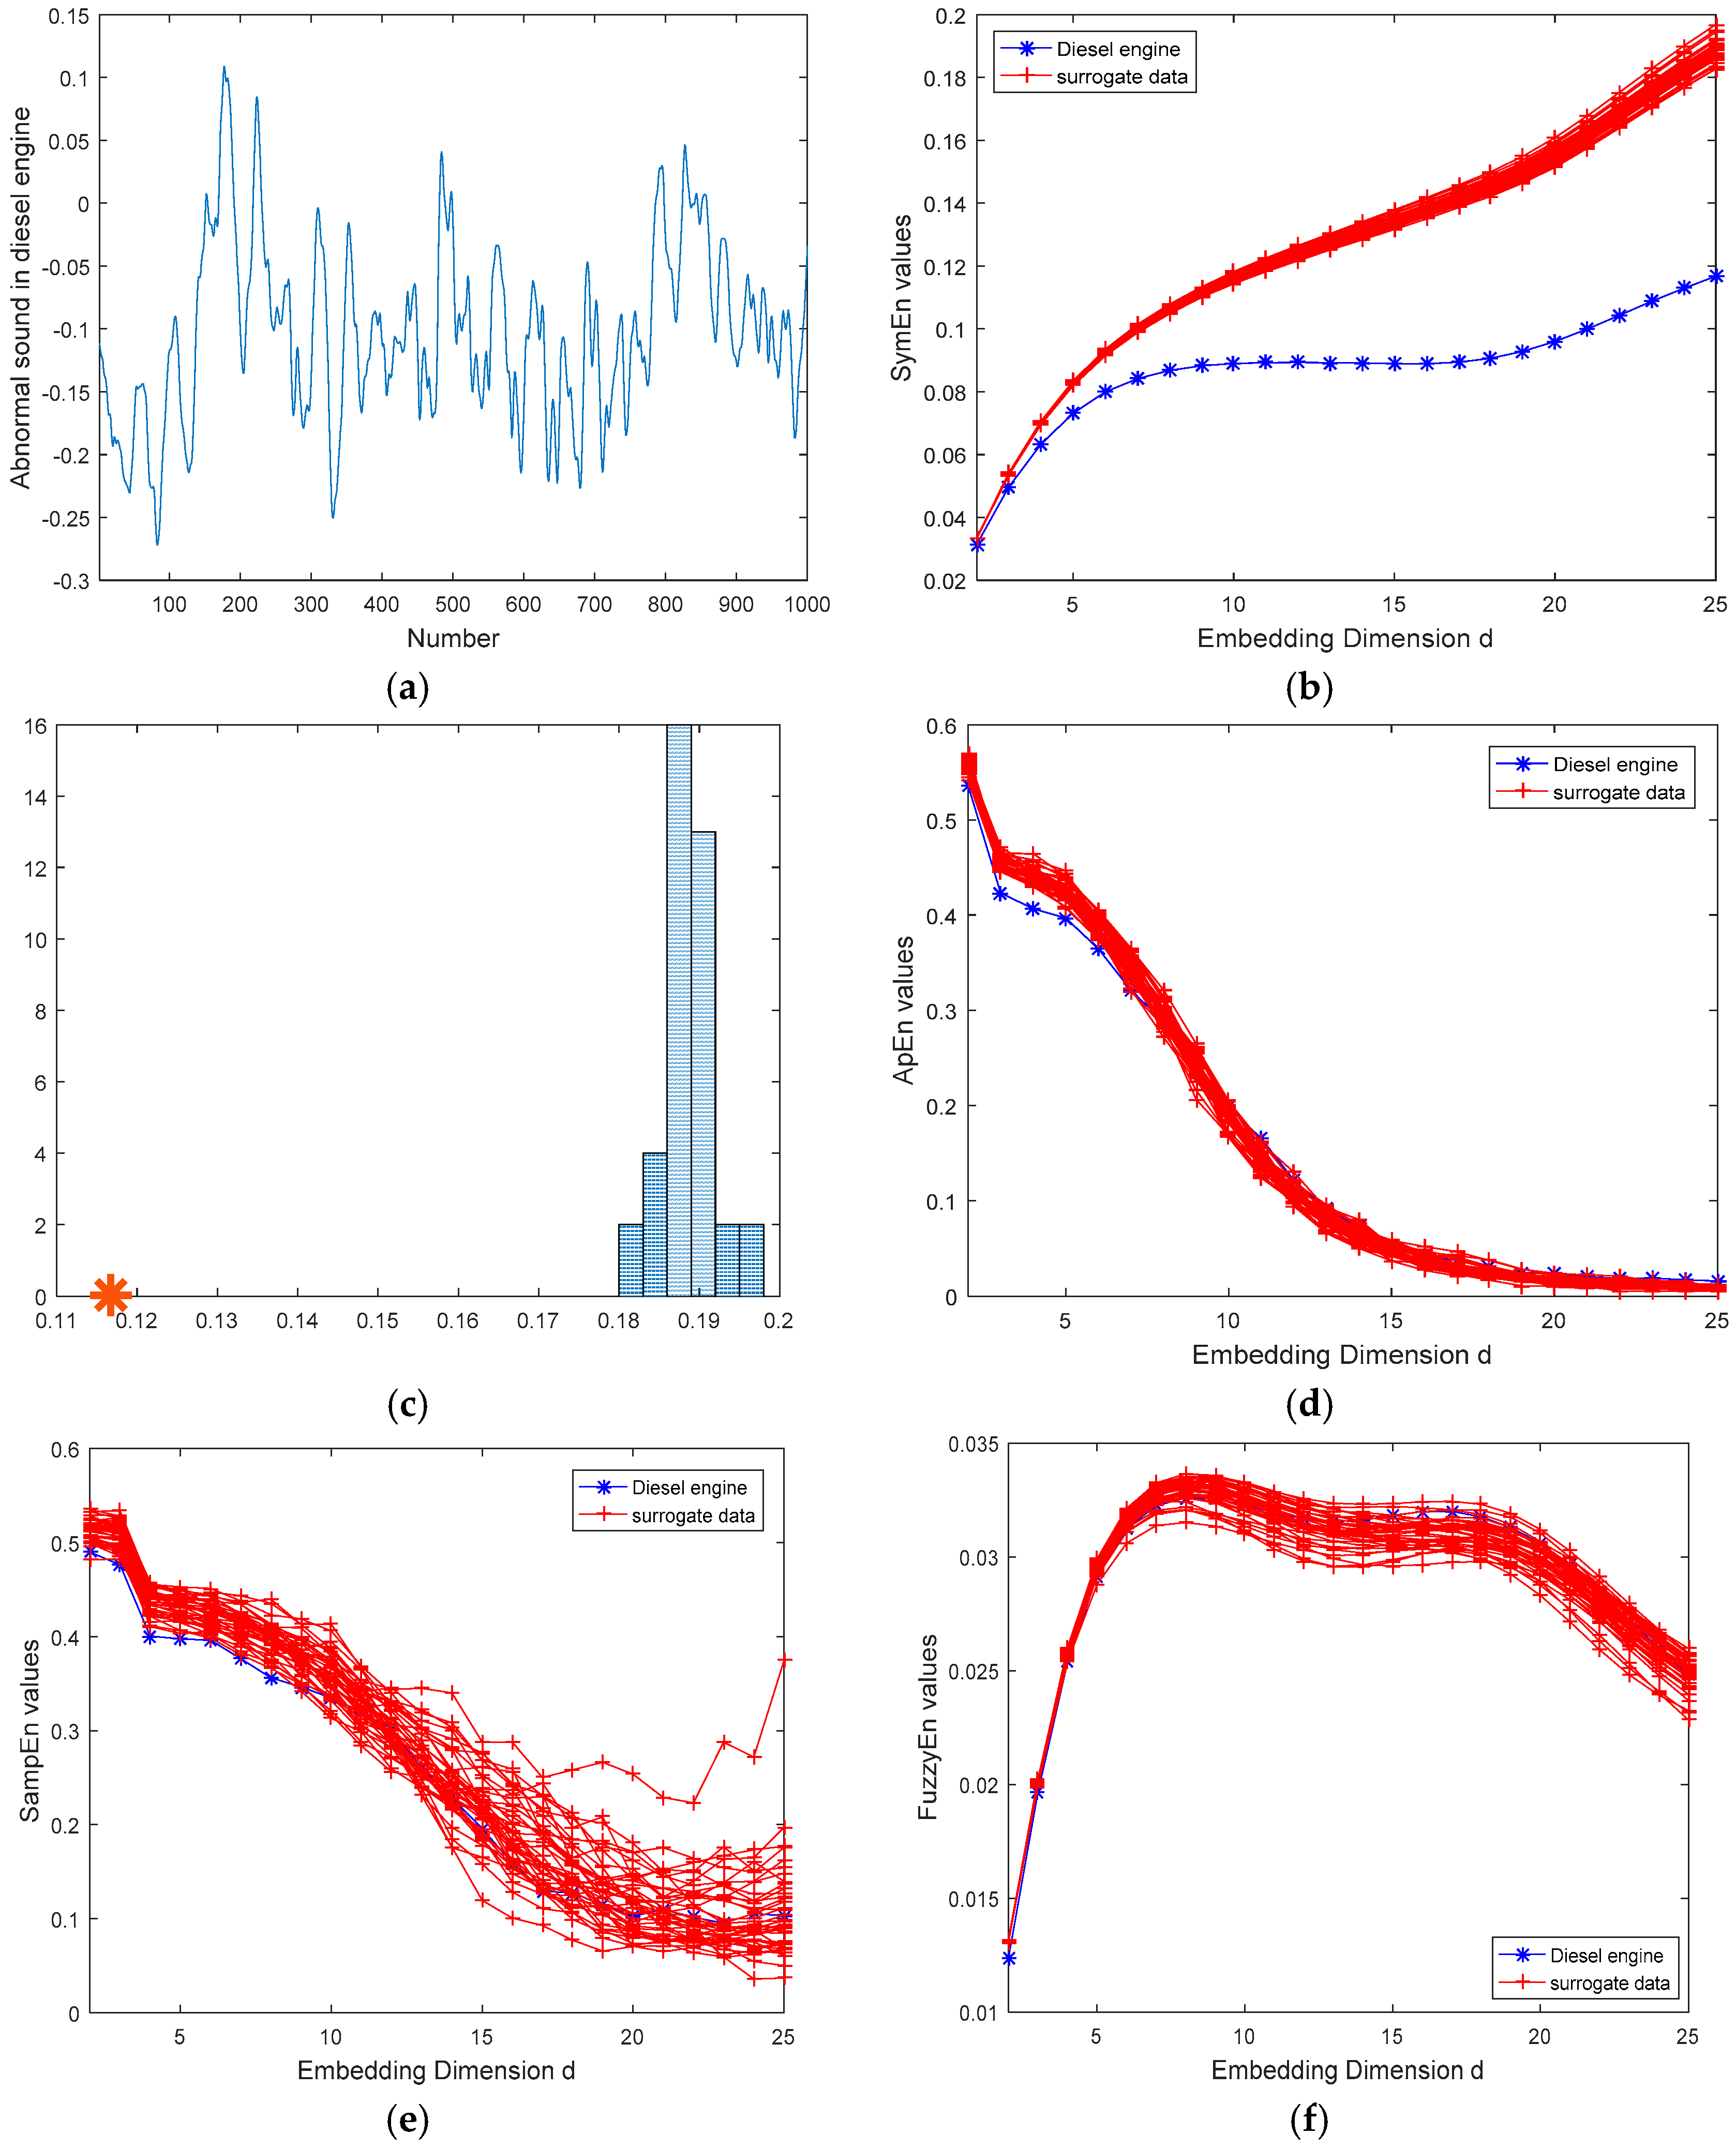
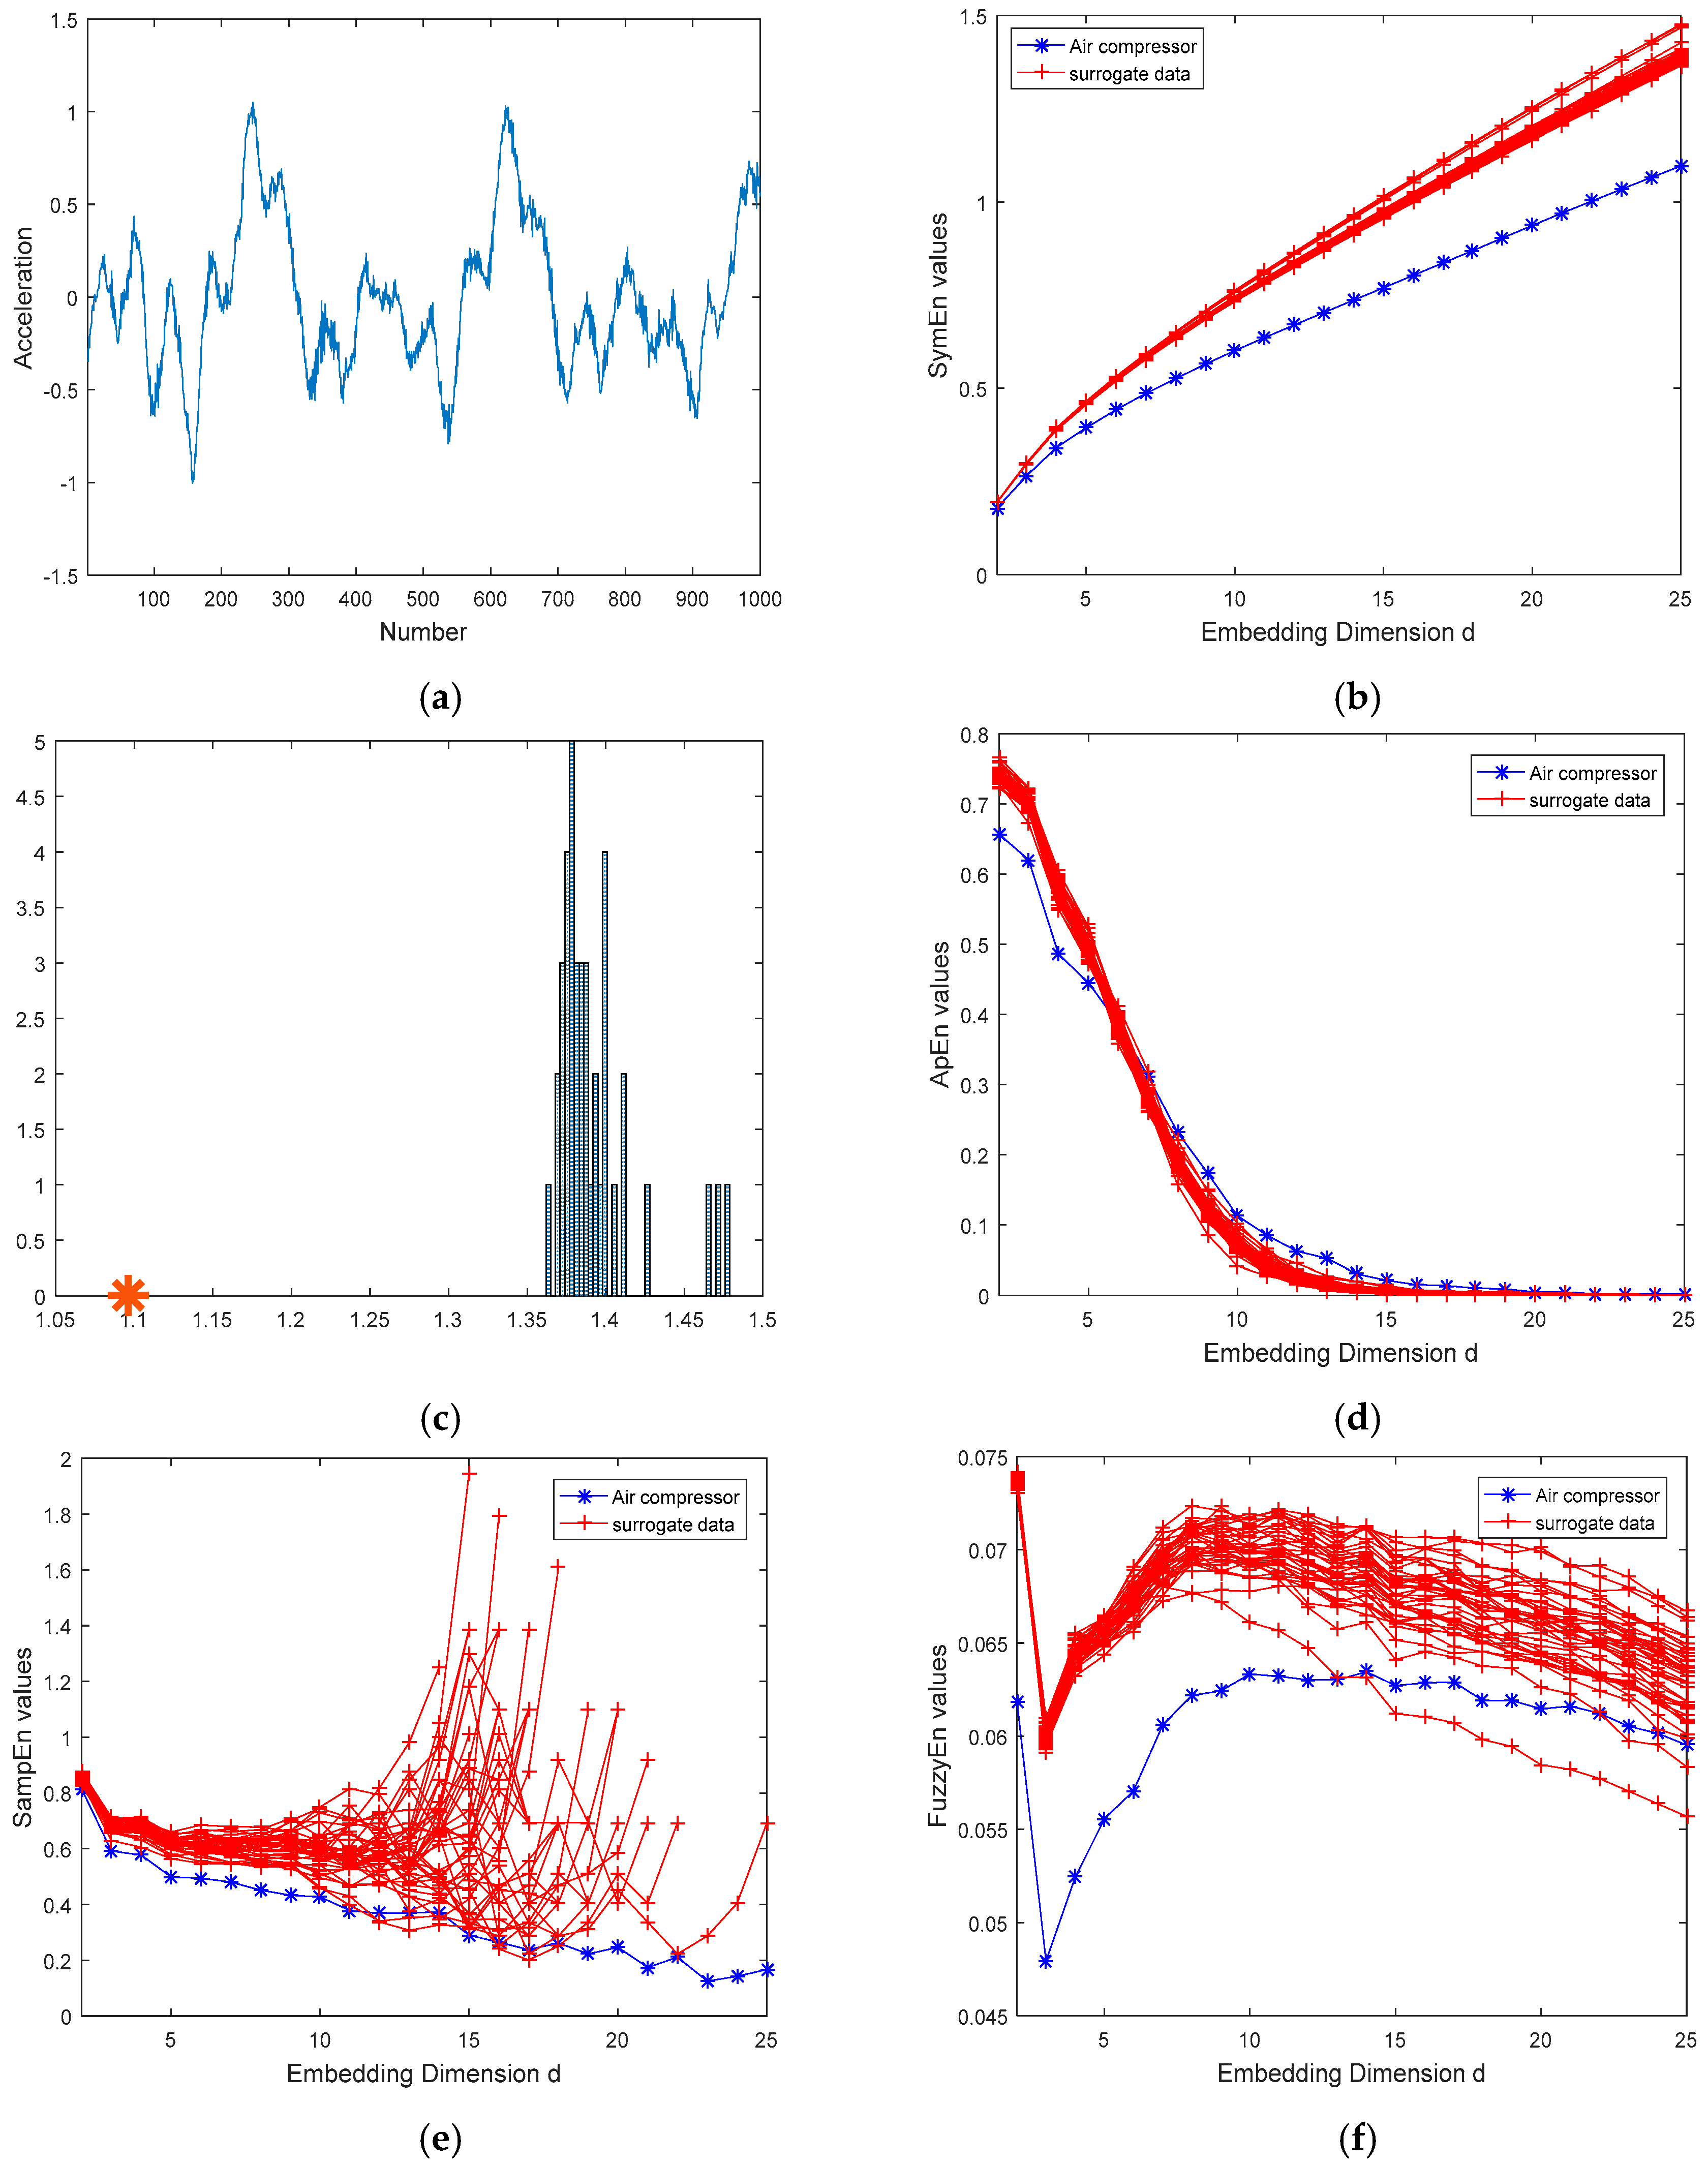
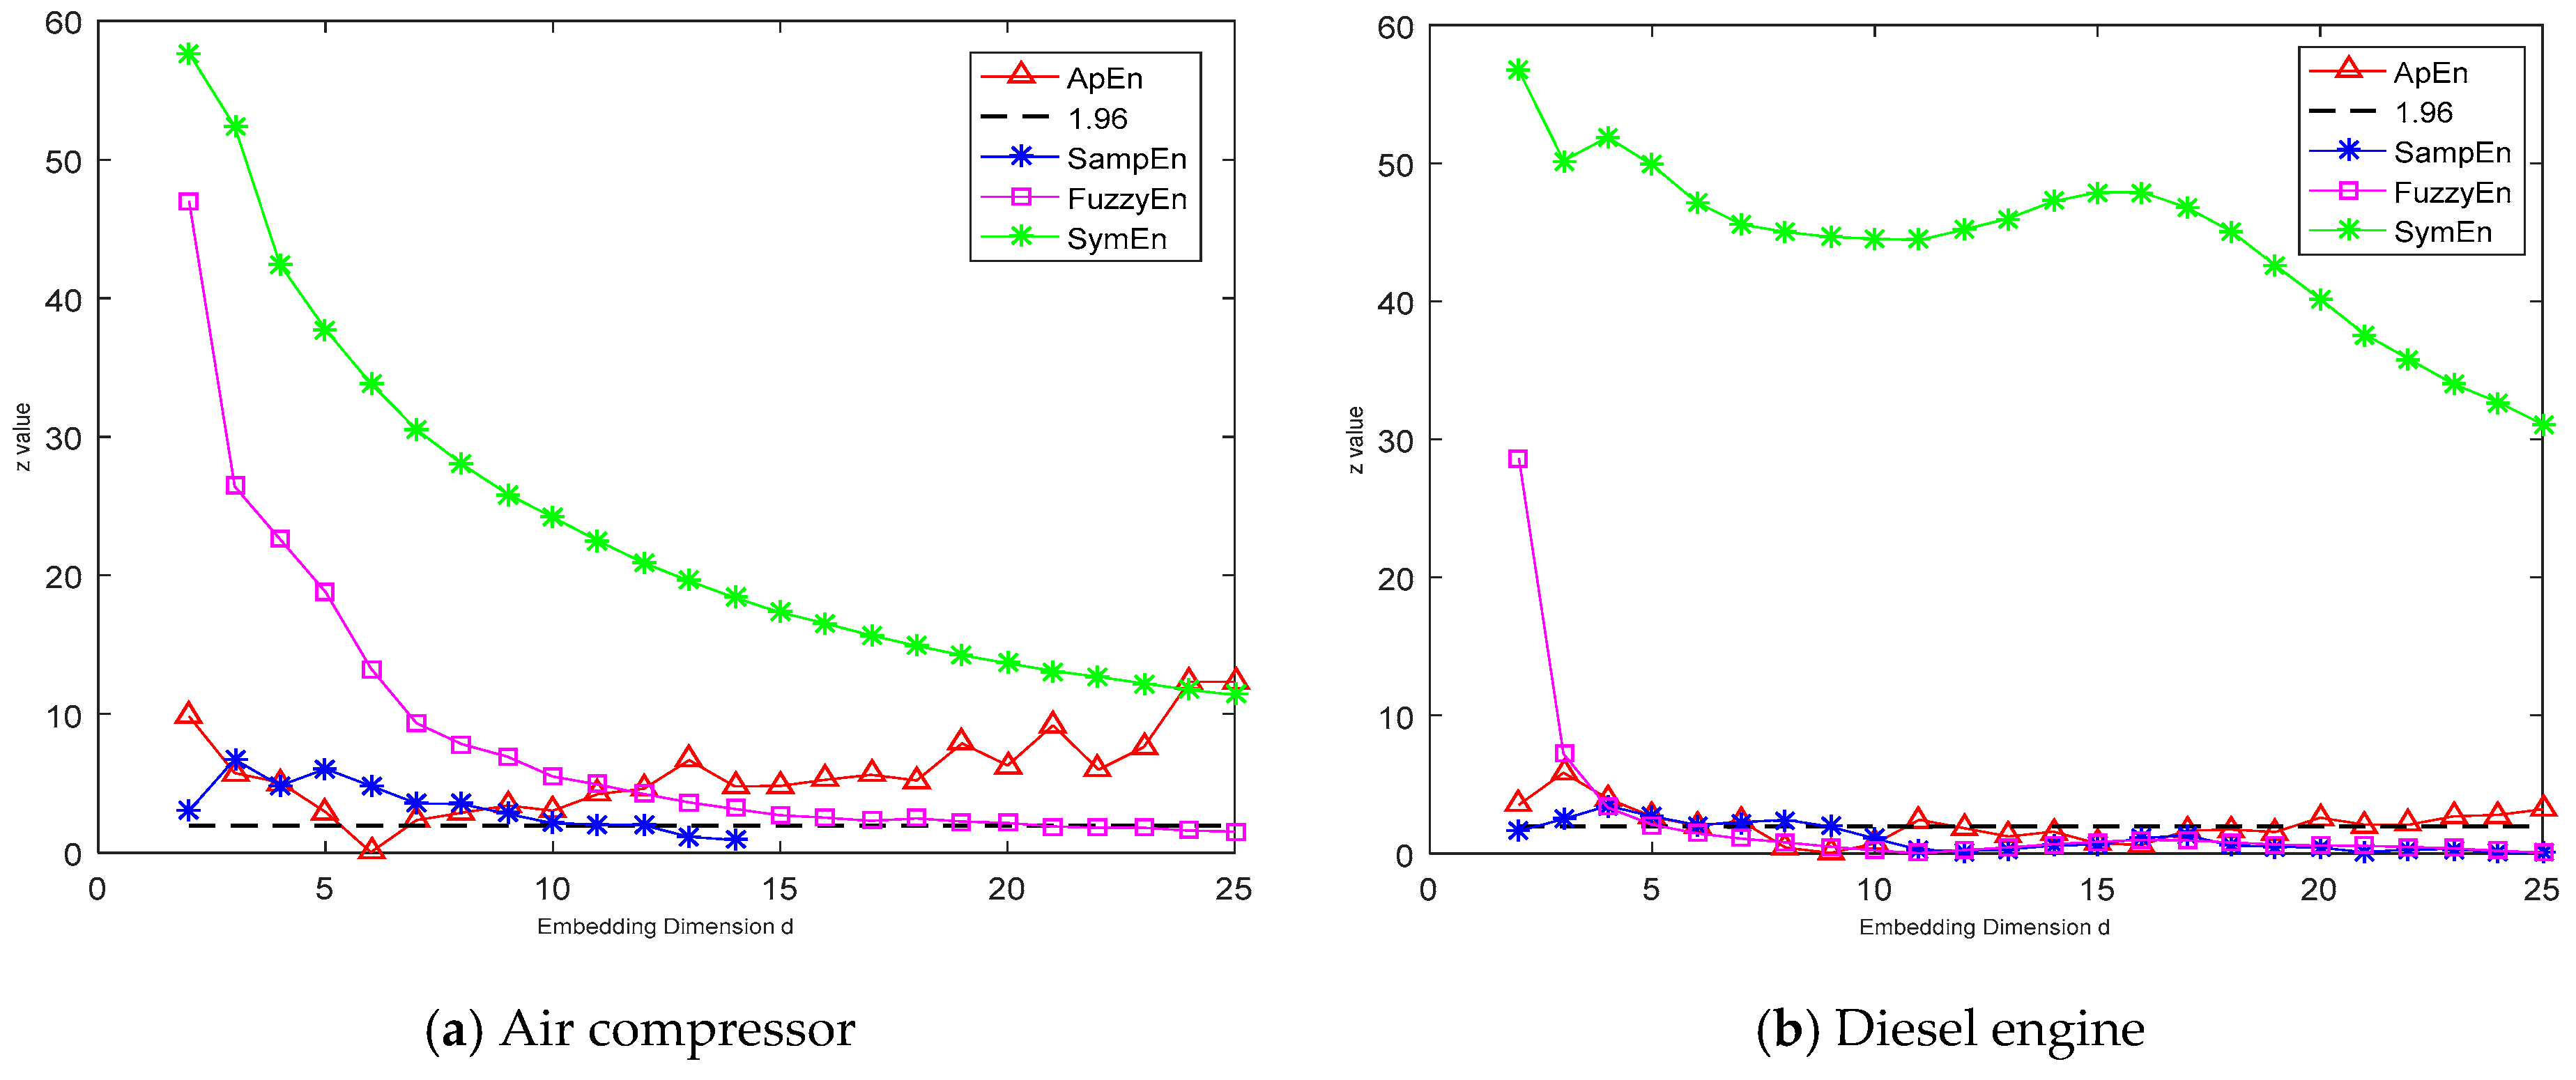
3.2.2. The Time Series for Diesel Engine and Air Compressor

Mechanical systems are also a kind of complex system; for example, diesel engines and air compressors. In engine systems, acoustic signals are often applied to detect the mechanical faults, because they can provide significant dynamic information on the engines [42]. Many acoustic methods are employed to deal with engine faults, such as acoustic emission analysis [47]. However, fault diagnosis based on acoustic signals is often easily affected by background noise [42]. Few studies employ nonlinear analysis methods to explore the characteristics of the abnormal sound in diesel engines. In this paper, we first apply the proposed SymEn function to test the nonlinearity of the abnormal sound of the diesel engine. Figure 8 presents one episode of the original sound data in the faulty diesel engine and its SymEn values with those of its surrogates. Our SymEn-based tests applied to the sound data reject the null hypothesis with 95% confidence over 39 surrogates. In dimension d = 25, the SymEn value of the original data is obviously different from those of its surrogates with the difference degree z = 16.99 (z > 1.96). The results show that the dynamical characteristics of the raw sound data are not linear. The raw data should come from a nonlinear system. Meanwhile, the ApEn, SampEn, and FuzzyEn methods are also employed to analyze the sound data (see Figure 8d–f). In general, the results are worse than that of the SymEn method, although the ApEn values show some difference between the raw data and its surrogate in d = 3,4.
Finally, we examine the vibration acceleration data in an air compressor and its surrogates. Air compressors are extensively employed mechanical systems. The working state of the air compressor becomes unstable due to the interaction of pistons, the pressure instability of the compressed air outputted from the air compressor in volatile gas-consumption situations. Besides, environmental noise often has a strong impact on the vibration measurement. Hence, the measured vibration signals often show complex dynamics behaviors. This paper considers the vibration acceleration collected at the fault state of the air compressor. Figure 9 gives the original series and its SymEn function, as well as those of its surrogate data. The SymEn of the raw data is obviously distinguishable from those of its surrogates. The null hypothesis is rejected at the 95% significance level, especially in d = 25 (z > 1.96). The raw data is not from a linear process in the null hypothesis. The result indicates that the raw data is nonlinear. Besides, the ApEn, SampEn, and FuzzyEn methods are also used to analyze the raw vibration data (see Figure 9d–f). The results of the ApEn, SampEn, and FuzzyEn are worse than those of the SymEn method.
From the above analysis, the results have shown that the proposed SymEn function could be a suitable measure for nonlinearity tests, not only on synthetic data, but also on the limited samples of noisy measurements from real world systems.

4. Discussion

We propose the SymEn function method and test four types of synthetic time series. For Gaussian white noise, its distribution is equiprobable. The probability distribution in the SymEn function is equal for the noise (Figure 1). The SymEn method reflects the distribution of the noise data efficaciously. For a typical chaotic time series, the SymEn function method gives the differences between the raw chaotic data and its surrogate data (Figure 3, Figure 4 and Figure 5). According to the null hypothesis, the test on chaotic time series with the SymEn function favors the rejection of the null hypothesis. The results are consistent with those of the ApEn, SampEn, and FuzzyEn functions. As can be seen, the SymEn measure generally performs properly for the wider range of the embedding dimensions. The ApEn and SampEn measures turn out to be unable to discriminate a chaotic system from its surrogate data sets in higher embedding dimensions. The FuzzyEn function is better than them, but worse than the SymEn.
For the nonlinearity test of the EEG signals, previous studies had found that the nonlinear results were varied for the different methods and the EEG at different brain areas [43,48]. Theiler et al. [43] found that the EEG data at the left central (C3) could reject the null hypothesis of a linear stochastic process, whereas any other EEG data (O1) could not. Kugiumtzis also pointed out that cross-examining the results with other methods seemed to be necessary [48]. To examine the practicability of the SymEn function method, the difference degree z values (referring to Equation (15)) are further given in Figure 10 for the four entropy methods to test the EEG signals of the ASD and healthy subjects. For the suitable range of the embedding dimension (such as d = 5), the tests on the EEG signals are consistent for the four entropy methods (Figure 10). For the ApEn, SampEn, and FuzzyEn, variations of the difference degrees are shown with the different embedding dimensions. However, the SymEn method performs better than the other three methods. For the embedding dimension d = 2:25, all the z values of the SymEn function are larger than 1.96. The rejection can be obtained at the wide range of the embedding dimension for the SymEn method. The EEG data can come from a nonlinear brain system. The results are consistent with those in the previous literature [43,48].
For the sound and vibration signals, we further exhibit the difference degree z values of the discrimination between the original data and its surrogate data in Figure 11. The ApEn, SampEn, and FuzzyEn methods do not achieve all of the difference degrees being larger than 1.96 for all d = 2:25. However, for some embedding dimensions—such as d = 3 or 4—the four methods give consistent discriminations for the sound and vibration signals (Figure 11a,b). The results suggest the rejection of the null hypothesis. For the SymEn method, the performance of the test on the different embedding dimensions is uniform in d = 2:25. The results indicate that the SymEn method is better than the ApEn, SampEn, and FuzzyEn methods.

5. Conclusions

In this paper, the symplectic entropy (SymEn) measure has been proposed to measure the disorder of the system. Its algorithm is a logarithmic measure of the average amount of energy about the underlying probability distribution in different directions of a system, like the Shannon entropy. The higher the disorder of the system is, the higher the entropy. For a Gaussian white noise process, the SymEn method reflects this point, because the SymEn values become larger with the increase of the embedding dimension. Meanwhile, we study the effectiveness and practicability of the SymEn method experimentally by testing the nonlinearity of the synthetic chaotic data and real time series. In comparison with the ApEn, SampEn, and FuzzyEn entropy measures, the results show that the performance of the proposed SymEn method is superior to them. The SymEn method can reflect the characteristics of the systems and can be used to detect if there are nonlinear components in the real data from a complex system.

Acknowledgments

We would like to thank three anonymous reviewers for their helpful comments on this article. We are pleased to acknowledge Xie Hongbo for useful discussions to improve this paper. And we also wish to thank Fan Jing and Bian Dayi in Vanderbilt University for experiments. This work was partially supported by the Science Fund for Creative Research Groups of the National Natural Science Foundation of China (Grant No. 51421092), the National Natural Science Foundation of China (Grant No. 10872125), the State Scholarship Fund of China Scholarship Council (Grant No. [2013]3018), Research Fund of State Key Laboratory of Mechanical System and Vibration (Grant No. MSV-MS-2010-08), Research Fund from Shanghai Jiao Tong University for medical and engineering science. (Grant No. YG2013MS74 ) , the NSF Project of USA (Grant Nos. 0967170, 1264462), and the NIH project of USA (Grant Nos. 1R01MH091102-01A1, 1R21MH103518-01).

Author Contributions

Min Lei was in charge of framing the concept and method, developing the program codes, and writing the paper. Guang Meng was in charge of the supervision of this research and helping in revising. Nilanjan Sarkar was in charge of conducting the experiments and supervising this research. Wenming Zhang was in charge of guiding in writing and conducting in revising. Joshua Wade was responsible for the experimental design and data extraction. All the authors have read and approved the final manuscript.

Conflicts of Interest

The authors declare no conflict of interest.

References

  1. Consolini, G.; Tozzi, R.; De Michelis, P. Complexity in the sunspot cycle. Astron. Astrophys. 2009, 506, 1381–1391. [Google Scholar] [CrossRef]
  2. Gao, J.B.; Hu, J.; Tung, W.W. Complexity measures of brain wave dynamics. Cogn. Neurodyn. 2011, 5, 171–182. [Google Scholar] [CrossRef] [PubMed]
  3. Xie, H.; Dokos, S.; Sivakumar, B.; Mengersen, K. Symplectic geometry spectrum regression for prediction of noisy time series. Phys. Rev. E 2016, 93, 052217. [Google Scholar] [CrossRef] [PubMed]
  4. Lei, M.; Wang, Z.H.; Feng, Z.J. A method of embedding dimension estimation based on symplectic geometry. Phys. Lett. A 2002, 303, 179–189. [Google Scholar] [CrossRef]
  5. Nazimuddin, A.K.M.; Hasan, M.R. Applications of Riemannian geometry comparing with symplectic geometry. Ann. Pure Appl. Math. 2014, 6, 170–177. [Google Scholar]
  6. Hou, X.H.; Deng, Z.C.; Zhou, J.X. Symplectic analysis for the wave propagation properties of conventional and auxetic cellular structures. Int. J. Numer. Anal. Model. 2011, 2, 298–314. [Google Scholar]
  7. Hong, S.; Kim, Y.; Park, Y.; Rothe, K.D. Symplectic embedding and Hamilton–Jacobi analysis of proca model. Mod. Phys. Lett. A 2002, 17, 435–451. [Google Scholar] [CrossRef]
  8. Gao, Q.; Tan, S.J.; Zhang, H.W.; Zhong, W.X. Symplectic algorithms based on the principle of least action and generating functions. Int. J. Numer. Methods Eng. 2012, 89, 438–508. [Google Scholar] [CrossRef]
  9. Lim, C.W.; Xu, X.S. Symplectic elasticity: Theory and applications. Appl. Mech. Rev. 2010, 63, 050802. [Google Scholar] [CrossRef]
  10. Torres, D.M. Nonlinear symplectic grassmannians and Hamiltonian actions in prequantum line bundles. Int. J. Geom. Methods Mod. Phys. 2012, 9, 1250001. [Google Scholar] [CrossRef]
  11. Feng, K. On Difference Schemes and Symplectic Geometry. In Proceedings of the 1984 Beijing Symposium Differential Geometry and Differential Equations, Beijing, China, 13–17 August 1984.
  12. Lei, M.; Meng, G. Symplectic principal component analysis: A new method for time series analysis. Math. Probl. Eng. 2011, 2011, 793429. [Google Scholar] [CrossRef]
  13. Van Loan, C. A symplectic method for approximating all the eigenvalues of a Hamiltonian matrix. Linear Algebra Appl. 1984, 61, 233–251. [Google Scholar] [CrossRef]
  14. Benner, P.; Faβbender, H. An implicitly restarted symplectic Lanczos method for the Hamiltonian eigenvalue problem. Linear Algebra Appl. 1997, 263, 75–111. [Google Scholar] [CrossRef]
  15. Salam, A.; Al-Aidarous, E.; EI Farouk, A. Optimal symplectic householder transformations for SR decomposition. Linear Algebra Appl. 2008, 429, 1334–1353. [Google Scholar] [CrossRef]
  16. Salam, A.; EI Farouk, A.; Al-Aidarous, E. Symplectic Householder transformations for a QR-like decomposition, a geometric and algebraic approaches. J. Comput. Appl. Math. 2008, 214, 533–548. [Google Scholar] [CrossRef]
  17. Salam, A. On theoretical and numerical aspects of symplectic Gram–Schmidt-like algorithms. Numer. Algorithms 2005, 39, 237–242. [Google Scholar] [CrossRef]
  18. Zhong, W.X. The inverse iteration method for the eigenproblem of large symplectic matrices. Comput. Struct. Mech. Appl. 1992, 9, 227–238. [Google Scholar]
  19. Zhong, W.X.; Williams, F.W.; Leung, A.Y.T. Symplectic analsyis for periodical electro-magnetic waveguides. J. Sound Vib. 2003, 267, 227–244. [Google Scholar] [CrossRef]
  20. Zhong, W. Plane elasticity problem in strip domain and Hamiltonian system. J. Dalian Univ. Technol. 1991, 31, 373–384. (In Chinese) [Google Scholar]
  21. Yao, W.; Zhong, W.; Lim, C.W. Symplectic Elasticity; World Scientific: Singapore, 2009. [Google Scholar]
  22. Lü, C.F.; Lim, C.W.; Yao, W.A. A new analytic symplectic elasticity approach for beams resting on Pasternak elastic foundations. J. Mech. Mater. Struct. 2009, 4, 1741–1754. [Google Scholar] [CrossRef]
  23. Zhong, W.X. Duality System in Applied Mechanics and Optimal Control; Kluwer Academic: Boston, FL, USA, 2004. [Google Scholar]
  24. Zhao, L.; Chen, W.Q. Symplectic Analysis of Plane Problems of Functionally Graded Piezoelectric Materials. Mech. Mater. 2009, 41, 1330–1339. [Google Scholar] [CrossRef]
  25. Lim, C.W.; Yao, W.A.; Cui, S. Benchmarks of analytical symplectic solutions for bending of cornersupported rectangular thin plates. IES J. Part A Civ. Struct. Eng. 2008, 1, 106–115. [Google Scholar] [CrossRef]
  26. Batista, M. Discussion of ‘Benchmark symplectic solutions for bending of corner-supported rectangular thin plates’ by C.W. Lim, W.A. Yao and S. Cui. IES J. Part A Civ. Struct. Eng. 2010, 3, 70. [Google Scholar] [CrossRef]
  27. Takens, F. Detecting Strange Attractors in Turbulence. In Dynamical Systems and Turbulence, Warwick 1980; Rand, D., Young, L.-S., Eds.; Springer: Berlin/Heidelberg, Germany, 1981; pp. 366–381. [Google Scholar]
  28. Lei, M.; Meng, G. A Noise Reduction Method for Continuous Chaotic Systems Based on Symplectic Geometry. J. Vib. Eng. Technol. 2015, 3, 13–24. [Google Scholar]
  29. Niu, X.; Qu, F.; Wang, N. Evaluating Sprinters’ Surface EMG Signals Based on EMD and Symplectic Geometry. J. Ocean Univ. Qingdao 2005, 35, 125–129. (In Chinese) [Google Scholar]
  30. Xie, H.; Wang, Z.; Huang, H. Identification determinism in time series based on symplectic geometry spectra. Phys. Lett. A 2005, 342, 156–161. [Google Scholar] [CrossRef]
  31. Pincus, S.M. Approximate entropy as a measure of system complexity. Proc. Natl. Acad. Sci. USA 1991, 88, 2297–2301. [Google Scholar] [CrossRef] [PubMed]
  32. Richman, J.; Moorman, J. Physiological time-series analysis using approximate entropy and sample entropy. Am. J. Physiol. Heart Circ. Physiol. 2000, 278, H2039–H2049. [Google Scholar] [PubMed]
  33. Guzmán-Vargas, L.; Ramírez-Rojas, A.; Angulo-Brown, F. Multiscale entropy analysis of electroseismic time series. Nat. Hazards Earth Syst. Sci. 2008, 8, 855–860. [Google Scholar] [CrossRef]
  34. Hino, H.; Wakayama, K.; Murata, N. Entropy-based sliced inverse regression. Comput. Stat. Data Anal. 2013, 67, 105–114. [Google Scholar] [CrossRef] [Green Version]
  35. Elton, R.J.; Vasuki, P.; Mohanalin, J. Voice Activity Detection Using Fuzzy Entropy and Support Vector Machine. Entropy 2016, 18, 298. [Google Scholar] [CrossRef]
  36. Xie, H.; Guo, J.; Zheng, Y. Using the modified sample entropy to detect determinism. Phys. Lett. A 2010, 374, 3926–3931. [Google Scholar] [CrossRef]
  37. Kanner, L. Autistic disturbances of affective contact. Nerv. Child 1943, 2, 217–250. [Google Scholar]
  38. Theiler, J.; Prichard, D. Constrained-realization Monte-Carlo method for hypothesis testing. Physica D 1996, 94, 221–235. [Google Scholar] [CrossRef]
  39. Lei, M.; Meng, G.; Fan, J.; Wade, J.; Bian, D.; Sarkar, N. Nonlinear analysis of electroencephalograms of healthy people during driving test based on symplectic principal component analysis method. In Proceedings of the 2014 24th Annual International Conference of Society for Chaos Theory in Psychology & Life Sciences, Milwaukee, WI, USA, 31 July–2 August 2014; p. 10.
  40. Lei, M.; Meng, G.; Zhang, W.M.; Sarkar, N. Sample entropy of electroencephalogram for children with autism based on virtual driving game. Acta Phys. Sin. 2016, 65, 108701. [Google Scholar]
  41. Rens, J.; Clark, R.E.; Howe, D. Vibration analysis and control of reciprocating air-compressors. Int. J. Appl. Electromagn. Mech. 2001, 15, 155–162. [Google Scholar]
  42. Ning, D.; Sun, C.; Gong, Y.; Zhang, Z.; Hou, J. Extraction of fault component from abnormal sound in diesel engines using acoustic signals. Mech. Syst. Signal Process. 2016, 75, 544–555. [Google Scholar]
  43. Theiler, J.; Eubank, S.; Longtin, A.; Galdrikian, B. Testing for nonlinearity in time series: The method of surrogate data. Physica D 1992, 58, 77–94. [Google Scholar] [CrossRef]
  44. Lei, M.; Wang, Z.; Feng, Z. Detecting nonlinearity of action surface EMG signal. Phys. Lett. A 2001, 290, 297–303. [Google Scholar] [CrossRef]
  45. Schreiber, T.; Schmitz, A. Discrimination power of measures for nonlinearity in a time series. Phys. Rev. E 1997, 55, 5443–5447. [Google Scholar] [CrossRef]
  46. Keller, K.; Unakafov, A.M.; Unakafova, V.A. Ordinal patterns, entropy, and EEG. Entropy 2014, 16, 6212–6239. [Google Scholar] [CrossRef]
  47. Muñoz, M.; Moreno, F.; Bermal, N.; Arroyo, J.; Paniagua, L. Engine diagnosis method based on vibration and acoustic emission energy. Insight 2012, 54, 149–154. [Google Scholar]
  48. Kugiumtzis, D. On the reliability of the surrogate data test for nonlinearity in the analysis of noisy time series. Int. J. Bifurc. Chaos 2001, 11, 1881–1896. [Google Scholar] [CrossRef]
Figure 1. The probability values of the Gaussian white noise in different directions in dimension d = 3:5:28.
Entropy 18 00412 g001
Figure 2. The characteristic test of the Gaussian white noise process: (a) the symplectic entropy (SymEn) values of noise and its surrogate data; (b) the approximate entropy (ApEn) values of noise and its surrogate data; (c) the sample entropy (SampEn) values of noise and its surrogate data; (d) the fuzzy entropy (FuzzyEn) values of noise and its surrogate data.
Entropy 18 00412 g002
Figure 3. Comparison of nonlinear tests on four entropy methods for Lorenz chaotic dynamical system.
Entropy 18 00412 g003
Figure 4. Comparison of nonlinear tests on four entropy methods for Rössler chaotic dynamical system.
Entropy 18 00412 g004aEntropy 18 00412 g004b
Figure 5. Comparison of nonlinear tests on four entropy methods for Van de Pol chaotic dynamical system.
Entropy 18 00412 g005
Figure 6. The nonlinearity test on the electroencephalogram (EEG) signal of ASD subject based on the SymEn method by comparison with the ApEn, SampEn, and FuzzyEn methods: (a) The raw EEG data in the right O2; (b) The SymEn functions of the raw data and its surrogates in the embedding dimension d = 2:25; (c) The SymEn values in d = 25 for the raw data and its surrogates, * for the raw data; (d) The ApEn values of the raw data and its surrogates in the embedding dimension d = 2:25; (e) The SampEn values of the raw data and its surrogates in the embedding dimension d = 2:25; (f) The FuzzyEn values of the raw data and its surrogates in the embedding dimension d = 2:25.
Entropy 18 00412 g006aEntropy 18 00412 g006b
Figure 7. The nonlinearity test on the EEG signal of healthy subject: (a) The raw EEG data in the right O2; (b) In the range of 2 to 25 dimension, the SymEn functions of the raw data and its surrogates; (c) The SymEn measures in d = 25 for the raw data and its surrogates; (d) The ApEn values of the raw data and its surrogates in d = 2:25; (e) the SampEn values of the raw data and its surrogates in d = 2:25; (f) The FuzzyEn values of the raw data and its surrogates in d = 2:25.
Entropy 18 00412 g007aEntropy 18 00412 g007b
Figure 8. The test on the abnormal sound in the diesel engine: (a) The raw 1000-point sound time series; (b) The SymEn functions of the raw data and its surrogates in d = 2:25; (c) In d = 25, the SymEn measures of the raw data and its surrogates, * for the raw data, histogram for its surrogates; (d) The ApEn values of the raw data and its surrogates in d = 2:25; (e) The SampEn values of the raw data and its surrogates in d = 2:25; (f) The FuzzyEn values of the raw data and its surrogates in d = 2:25.
Entropy 18 00412 g008
Figure 9. The test on the acceleration time series in the vibration of the air compressor: (a) The raw acceleration signal; (b) The SymEn measures in d = 2:25 for the raw data and its surrogates; (c) The SymEn measure (*) of the raw data in d = 25, and the histogram of the SymEn values for its surrogates; (d) The ApEn values of the raw data and its surrogates in d = 2:25; (e) The SampEn values of the raw data and its surrogates in d = 2:25; (f) The FuzzyEn values of the raw data and its surrogates in d = 2:25.
Entropy 18 00412 g009
Figure 10. The difference degree z values of the entropy values in Figure 6 and Figure 7 for four entropy methods. (a) ASD subject; (b) Healthy subject.
Entropy 18 00412 g010
Figure 11. The difference degree z values of the entropy values in Figure 8 and Figure 9 for the four entropy methods. (a) Air compressor; (b) Diesel engine.
Entropy 18 00412 g011

