Case Report

A Novel Method for Evaluation of Flood Risk Reduction Strategies: Explanation of ICPR FloRiAn GIS-Tool and Its First Application to the Rhine River Basin

by
Adrian Schmid-Breton
1,*,
Gesa Kutschera
2,
Ton Botterhuis
3 and
The ICPR Expert Group ‘Flood Risk Analysis’ (EG HIRI)
4,†
1
International Commission for the Protection of the Rhine, 56068 Koblenz, Germany
2
Research Institute for Water and Waste Management at RWTH Aachen (FiW) e. V, Department of Innovation and Knowledge Transfer (Project coordination Africa), 52056 Aachen, Germany
3
HKV Lijn in Water, Security and crisis management, 8203 Lelystad, The Netherlands
4
Expert Group, ”Flood Risks” (EG HIRI) of the International Commission for the Protection of the Rhine (ICPR), Germany
*
Author to whom correspondence should be addressed.
The members of this expert group are listed by name at the end of the paper under “Acknowledgments”.
Geosciences 2018, 8(10), 371; https://doi.org/10.3390/geosciences8100371
Submission received: 17 August 2018 / Revised: 28 September 2018 / Accepted: 3 October 2018 / Published: 6 October 2018
(This article belongs to the Special Issue Hydrological Hazard: Analysis and Prevention)

Abstract

:
To determine the effects of measures on flood risk, the International Commission for the Protection of the Rhine (ICPR), supported by the engineering consultant HKV has developed a method and a GIS-tool named “ICPR FloRiAn (Flood Risk Analysis)”, which enables the broad-scale assessment of the effectiveness of flood risk management measures on the Rhine, but could be also applied to other rivers. The tool uses flood hazard maps and associated recurrence periods for an overall damage and risk assessment for four receptors: human health, environment, culture heritage, and economic activity. For each receptor, a method is designed to calculate the impact of flooding and the effect of measures. The tool consists of three interacting modules: damage assessment, risk assessment, and measures. Calculations using this tool show that the flood risk reduction target defined in the Action Plan on Floods of the ICPR in 1998 could be achieved with the measures already taken and those planned until 2030. Upon request, the ICPR will provide this tool and the method to other river basin organizations, national authorities, or scientific institutions. This article presents the method and GIS-tool developed by the ICPR as well as first calculation results.

1. Introduction

In the past, several important flood events occurred in the Rhine river basin (cf. Figure 1) and are the reason for why the nine countries of the basin are working together within the International Commission for the Protection of the Rhine (ICPR) [1] on the topic of transboundary flood risk management. The first results of this cooperation are the Action Plan on Floods (APF) [2,3] in 1998 and the first Flood Risk Management Plan (FRMP) for the international river basin district Rhine (IRBD) according to the “Floods Directive” of the European Union (Directive 2007/60/EC) in 2015 [4,5]. In the APF of 1998, one of the four objectives set out by the Rhine bordering states was to reduce the risk of flood damage by 10% by 2005, and by 25% by 2020, in comparison to the 1995 figures. On the other hand, the most important objective of the Floods Directive (FD) in force since 2007 is the reduction of the adverse consequences of flooding upon human health, the environment, cultural heritage and economic activity. To help assess and monitor the effects and effectiveness of implemented flood risk management measures to verify and determine the risk and damage reduction resulting from the implementation of the APF and FRMP, the ICPR—supported by the engineering consultant HKV—developed a specific tool running in a geographic information system (GIS) named “ICPR FloRiAn (Flood Risk Analysis)” [6]. The tool is the result of a cooperation of several authorities of different nationality within the Rhine River Basin. The Technical report (ICPR report no. 237) [7] describes the method and calculations and the Synthesis report (ICPR report no. 236) [8] contains a summary of the method and describes the results of calculations undertaken using the tool.
Although other useful methods and tools exist [9,10,11,12,13,14,15,16,17,18,19,20], ICPR FloRiAn was specially tailored to the ICPR’s wishes. As a result, the tool meets the needs and requirements of the Rhine bordering states, which had an impact on various parameters. For example, the tool is based on data available in the Rhine bordering countries and, during the development of the tool, great importance was attached to create a link with the FD. This is also reflected in the type of measures and the data used.
As stated above, in addition to ICPR FloRiAn, there are several other methods, models and (GIS) tools that deal with the simulation of flood events and their consequences as well as the assessment of flood risks [9,10,11,12,13,14,15]. The specificity of ICPR FloRiAn is, however, to extend flood risk analysis to the effects or effectiveness of flood risk management measures on the development or reduction of damages or risks. The quantification of non-structural measures and their combination with each other is particularly innovative. For example, flood forecasting and sensitization measures have positive influence on one another and can also have an effect on the proportion of taking precaution for building protection. Another novelty is the consideration of other receptors as solely the economic activities: people, environment, and cultural heritage. Special reflections have been made to create appropriate methods for these receptors. Moreover, contrary to other methods or GIS-based applications, the aim of ICPR FloRiAn is not a cost-benefit analysis (only the economic damage is monetarized and costs of measures are not considered), but to identify a general damage or risk reduction (with or without the impacts of measures). Like many other models, the tool is able to carry out theoretical calculations (sensitivity analysis) at different (administrative) levels. Finally, ICPR FloRiAn differs significantly from instruments for crisis management [16,17,18,19,20], the focus being here on prevention measures.
Within the GIS toolbox ICPR FloRiAn (see Section 3 for an extract of the tool), flood hazard and risk maps (e.g., developed under the FD, see explanation in Section 2.1) [21] are input for the calculation. The tool consists of three interacting modules resulting in an overall damage or risk assessment for four receptors (or types of adverse consequences of floods) defined by the FD: human health, environment, culture heritage and economic activity. The ICPR has used this tool to assess the risk evolution along the Rhine from 1995 up to now (results are presented in Section 4) and has planned to use the tool to carry out regular reviews of the impacts of measures on flood risk reduction for the FRMP.
The tool ICPR FloRiAn, as well as the methods it is based on and a user guide, are available on simple demand at the ICPR (basic contract) and can be applied to other river basins by river organizations or national institutions [6], provided that basic GIS knowledge, GIS technical features (see Section 3), and the following required input data for the area under study are available in ESRI ArcGIS format: flood hazard (water depth grid), data related to receptors in flood prone areas (land uses, number of affected people, potentially polluting industries, nature protection areas, cultural heritage objects), damage functions, and various information on the implementation of measures. The instrument can also be used partially (for one or more modules or receptors), with less data or by using some ICPR data (such as damage functions) or even by using theoretical/dummy data. Although it was developed for a macroscopic level (the Rhine basin), tests were undertaken by extern users on a more local or regional level (City of Cologne, City of Rosenheim in Bavaria, German part of the Danube; not published) and gave interesting and logical results. Thus, the limit of applications to other areas is only given by available data, GIS system, and knowledge.

2. Description of the Method

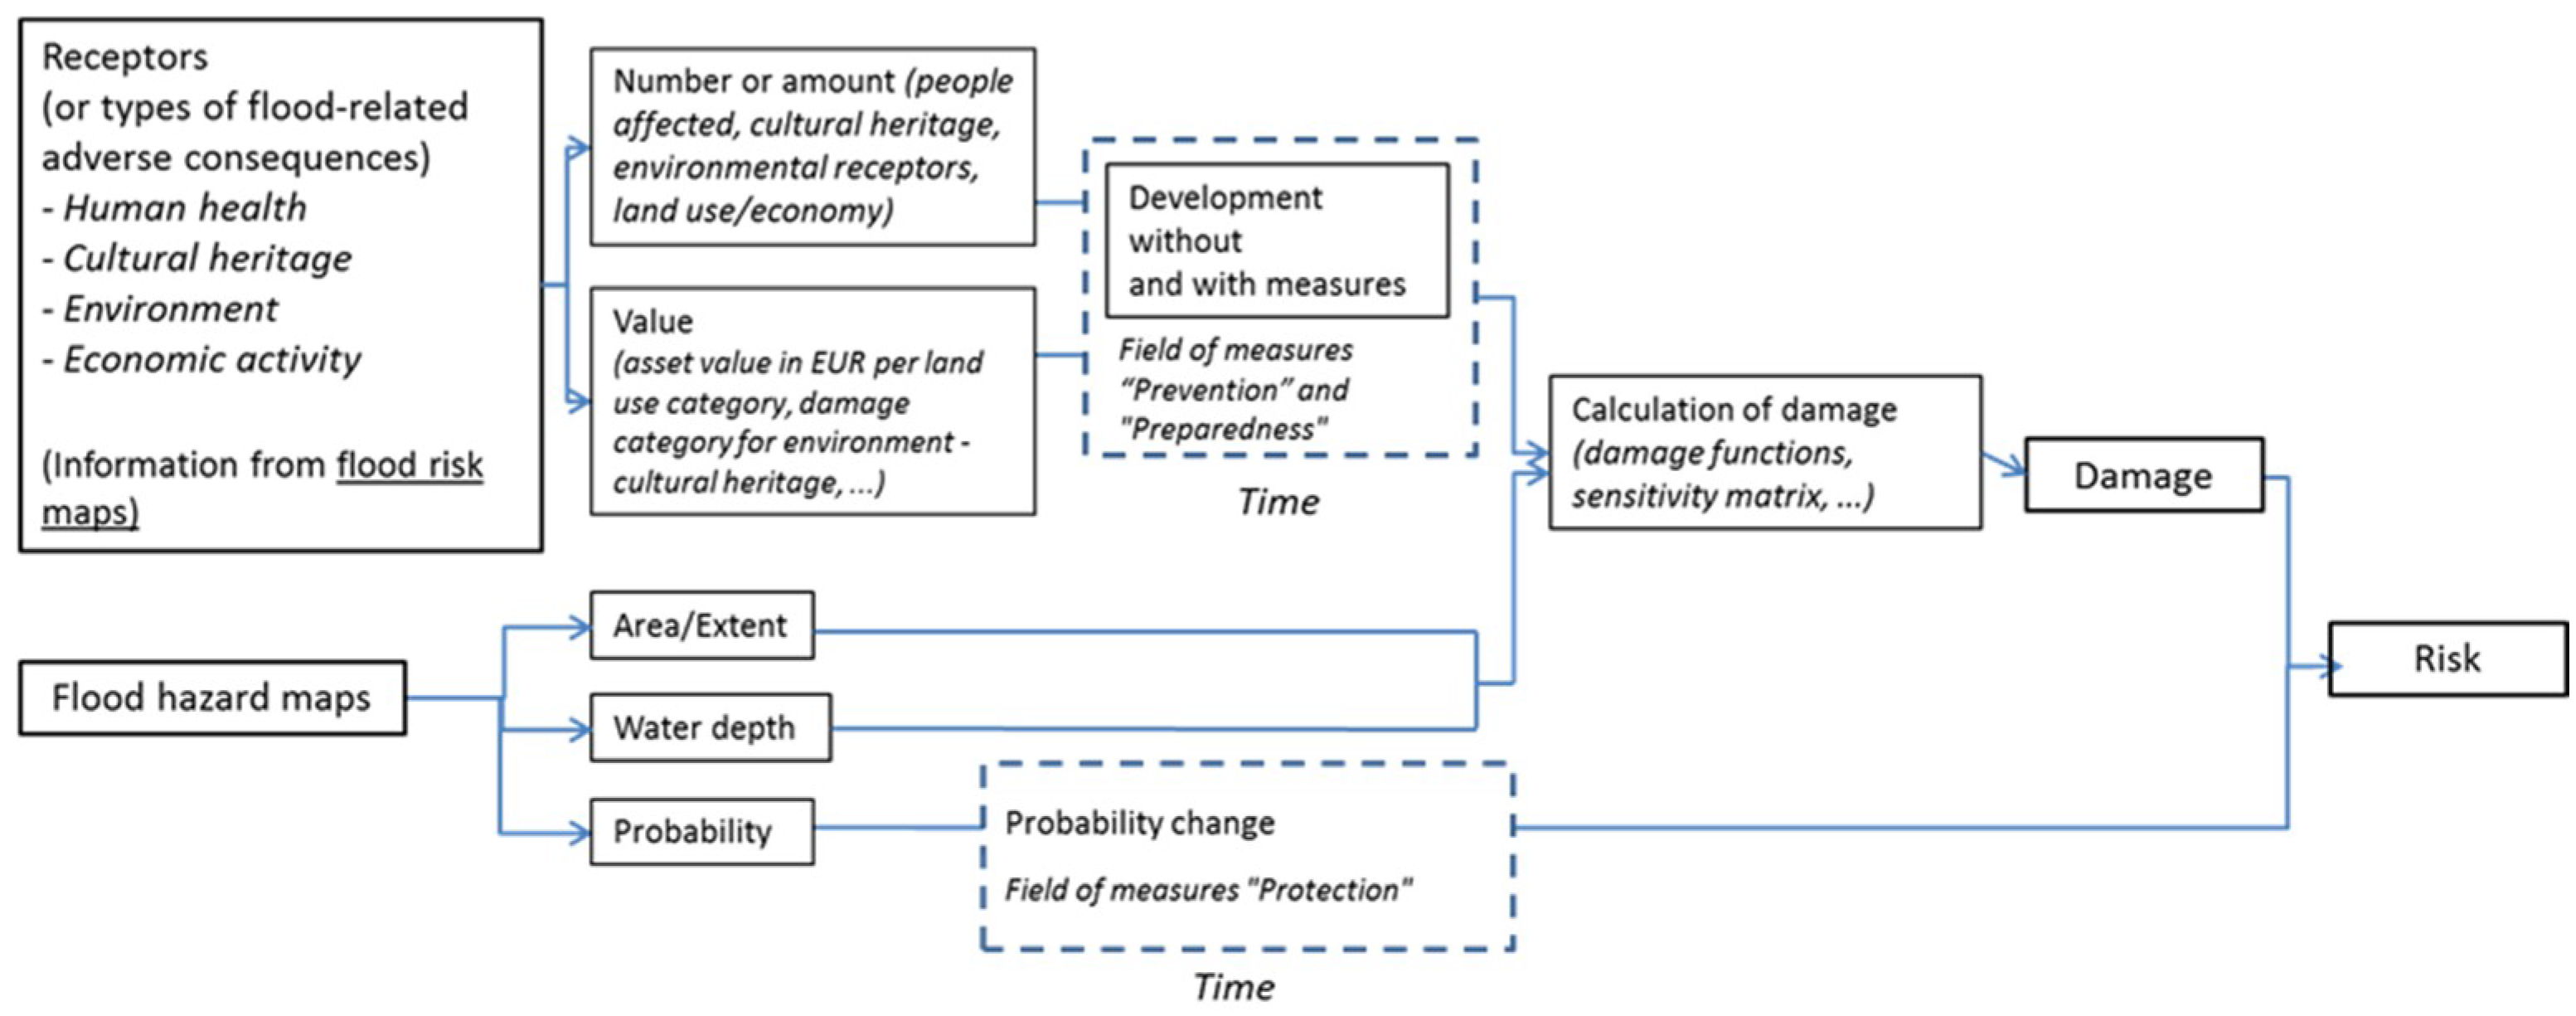
2.1. Definitions and Basic Information

Mathematically, flood risk is defined as a product of probability of occurrence and the potential damage. The ICPR has developed specific methods, some of which are new, for determining the damage potential and the risk for the four receptors human health, environment, cultural heritage, and economic activities (cf. Section 2.2, Section 2.3, Section 2.4 and Section 2.5) [7,8]. Furthermore, the effect of various measures can lead to changes in flood risk, which can be affected in two ways: by changing the flood probability and by influencing the potential damage (cf. Section 2.6). The modification of flood probability due to water level reduction measures such as retention measures and riverbed enlargement is described in the ICPR report no. 229 (cf. Section 2.6) [22]. The economic flood risk is calculated using the following formula [7,8,10]:
Flood risk [€/year] = Potential damage [€] × flood probability [1/year]
The damage potential of the receptors human health, environment, and cultural heritage is not calculated in monetary terms, so that the potential damage in € will be replaced by the number of persons or protected properties concerned (here as an example for the protection of human health [7,8,22]:
Flood risk [probability of being affected in inhabitants/year] = number of affected inhabitants × (1 − safeguarding rate [inhabitants potentially evacuated or placed in safety in % of total affected inhabitants]) × probability [1/year]. (see also Section 2.3)
The calculations of the flood risk are carried out using a GIS at the level of raster cells. During the evaluation, the results of individual raster cells are aggregated at the desired level in a table: e.g., stretches of the Rhine, municipality, district, region/federal state, or the whole Rhine catchment. The execution of calculations at different time horizons allows us to draw conclusions regarding the change of risk or the reduction of risk as a result of theoretically or actually implemented measures (cf. Section 4).
Figure 2 gives a general overview of the procedure for damage and risk calculation.
Explanation of the calculation procedure and the data used presented in Figure 2 (see also sections hereafter):
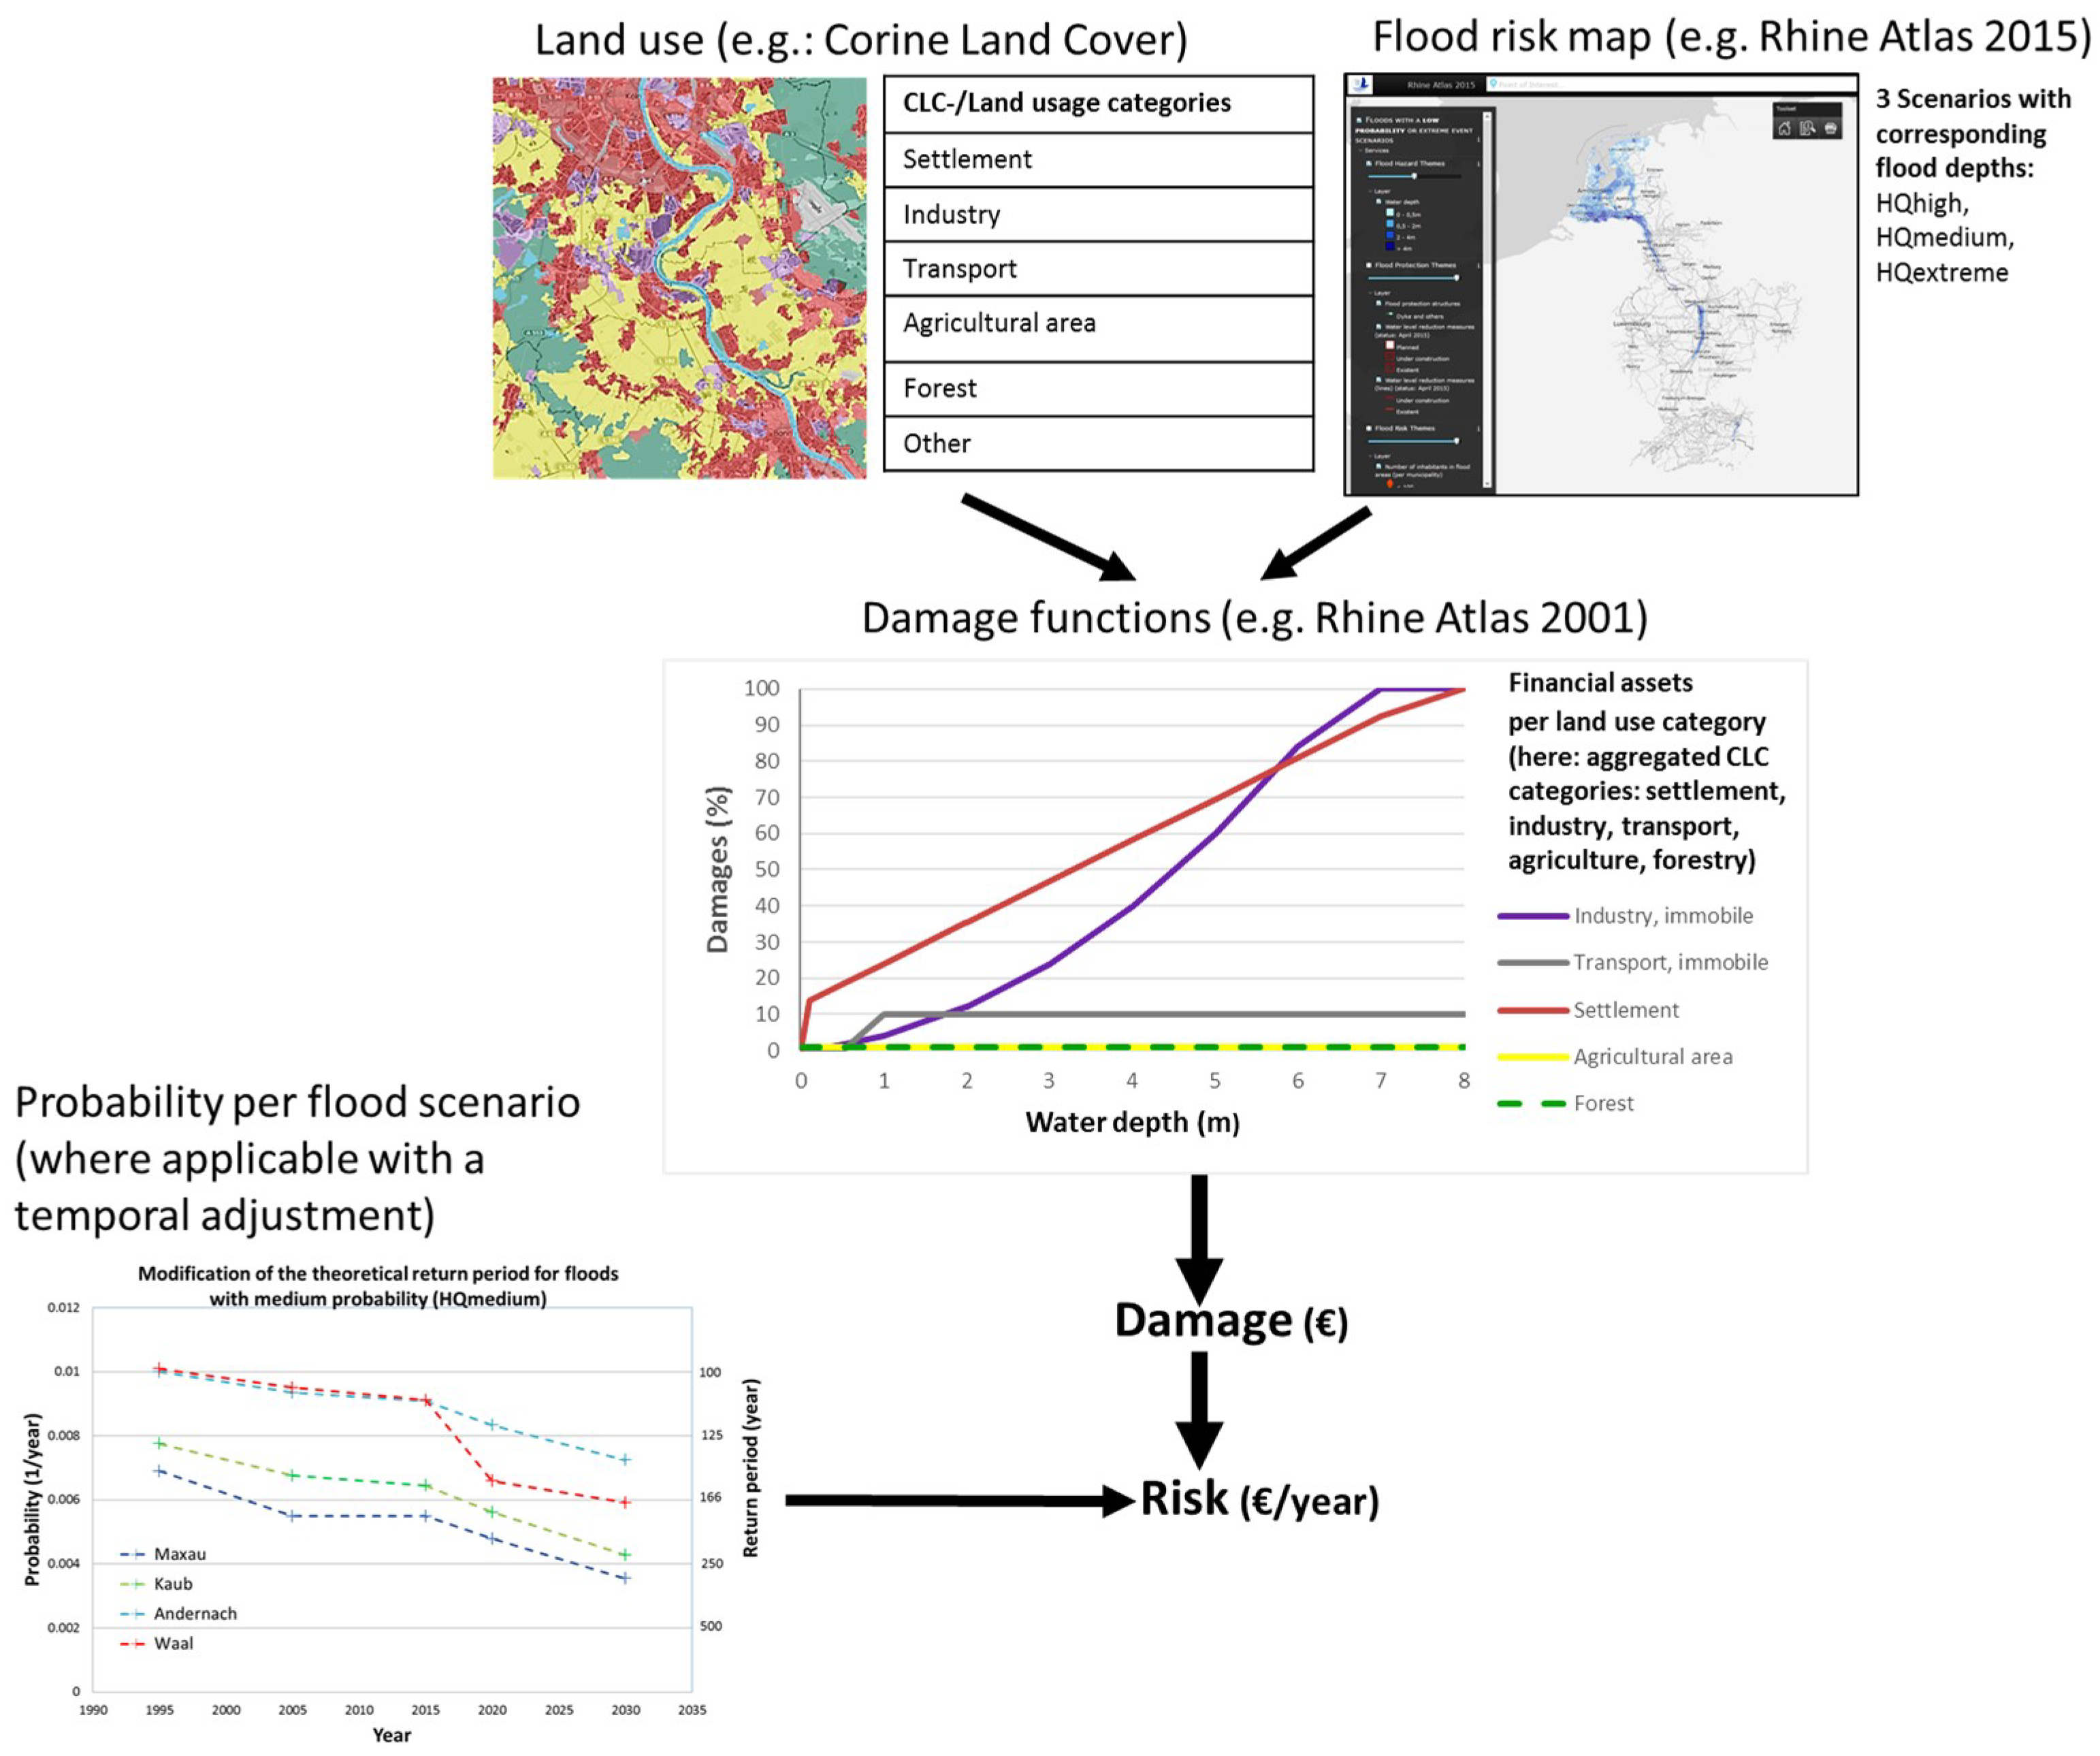
  • Flood risk maps: these maps are required by the FD and provide all the necessary information on receptors located in flood-prone areas (affected people, land use, etc.). A value or an amount (sum, number) is associated with these receptors. For economic damages, a damage function is associated with each type of land use (see Figure 3).
  • Flood hazard maps: also required by the FD these maps provide all necessary information on the hazard (grid with inundation depth and flooding areas, flood probability in form of three scenarios: frequent, medium, and extreme floods). Hence, flood probability can be also entered separately in the tool.
The calculation of the damage (using special functions or sensitivity matrixes) and then the risks (combination with probability) (see Figure 2) can already be calculated with only input data from both types of maps mentioned above without including the influence of measures. To estimate the impacts of measures, one has to fill in the tool with information on their effects (entered and modifiable in the tool itself) and the level/number/percentage of measures implementation/realization (entered in specific shapefiles). An information on the realization would be; e.g., % of a municipality covered by risk-based urban plans or the number of sensitization campaigns in a certain period (see Table 1 in Section 2.6.1). The integration of the impacts of measures are explained in Section 2.6. For economic damages, for example, the damage function associated with each type of land use is modified where certain measures are being achieved (reduction of water levels or inundation depth, see Figure 3 and Section 2.6.1). The results of the calculations are given in the form of a GIS file and are given in euro/year or in number of people or objects affected/year.

2.2. Receptor “Economic Activity”

The determination of the potential economic damage is based on the knowledge of the correlation between water depth and the resulting (relative) damage, the so-called damage functions. The direct economic damage potential is calculated in accordance with the methodology of the ICPR-Rhine Atlas 2001 [23]. Consequently, the damage potential is calculated on the basis of land use maps (Corine Land Cover 2006 in the case of the ICPR) included in flood risk maps (for the ICPR the ones of the Rhine Atlas 2015 [21]) for the three flood scenarios (frequent—HQhigh, medium—Hqmedium and extreme floods—Hqextreme) by means of damage functions and specific asset values for the 6 categories: settlement, industry, transport, agricultural areas, forest, and other (cf. Figure 3). Each cell in the map is reclassified to one of the 6 categories using the value of the land use as input. With this reclassification one of the 6 damage functions is coupled to a cell. Value of each cell in the flood map is reclassified with the damage function to a potential damage value (as a percentage of the asset value). The asset values (for property and immobile damage) are adjusted at a regional level on the base of economic growth or the consumer price index in order to adequately reflect the time horizon under consideration. As a result, the potential damage in €/m2 per category and the integral/total damage are calculated.

2.3. Receptor “Human Health”

The damage to the receptor human health is defined as the number of people potentially affected in the flooded area (for the calculation formula, see Section 2.1).
The chosen method follows a two-staged approach (cf. Figure 4):
  • Determination of all people affected (per defined area, e.g., administrative district, municipality, …) regardless of water depth or other parameters for each flood scenario in total. In addition, the number of people affected can be established for the water level classes defined by the maps or the user.
  • Determination of the number of people who cannot get to safe places or be evacuated, using the approach of a state or area-specific minimal and maximal “safeguarding rate”. This is the proportion of persons per region/area that could be evacuated or put in safety in advance of a potential flood and are therefore no longer in danger. The input of the safeguarding rate is given in % of the area under consideration (e.g., at municipality level) and is provided by the relevant countries for a reference time horizon (e.g., for 1995, minimal safeguarding rate of 20%; for 2015, maximal safeguarding rate of 80%). For the other time horizons (e.g., 2005), the safeguarding rate is calculated using a specific flow chart with an associated point system that considers the weighted effect of different prevention and preparedness measures according to their significance. This means that the safeguarding rate can be increased (e.g., in 2005 compared to 1995) by measures such as awareness rising, forecasting, warning and crisis management (cf. Table 1 in Section 2.6.1). The whole calculation procedure is precisely described in the ICPR report no. 237 [7].

2.4. Receptor “Environment”

The method for assessing flood-related risks to the environment assumes that it is not the flood event itself, but rather the negative consequences triggered by the event that cause damage to surface water bodies that have a good or very good ecological status and to receptors/protected areas, in accordance with the FD. Negative consequences are understood to be the contamination of bodies of water via IPPC plants, SEVESO operation areas and waste water treatment plants due to flooding. The hazard or pollution potential resulting from the plant is defined in the tool on the basis of pollutant emission and transport models by means of an impact distance (distance between the source of danger and the receptor). Possible damages caused by the direct effect of flooding on the environment are not included in the study.
The environmental impact assessment is carried out in two stages (cf. Figure 5):
  • In the first stage, the contamination potential of the plant is combined with the water level category. The greatest contamination potential and the highest water depth present the highest threat. For each plant and each flood scenario, the respective threat is determined and assigned to a qualitative scale (1 to 5).
  • The second stage combines the ecological significance of a protected area with its threat.
This evaluation results in the three damage classes “low”, “medium” and “high” and leads to an index per protected area. Within the framework of the calculations carried out, the damage indices per flood scenario and time horizon are summed (= aggregated damage index).

2.5. Receptor “Cultural Heritage”

Damage to cultural heritage can be approximated quantitatively by combining the significance of the cultural heritage (depending on the cultural heritage: UNESCO World Heritage Sites, protected urban areas, monuments) and water level.
By combining the defined value of a cultural asset with its water level, a specific matrix is created for assessing the damage to cultural assets. The matrix assessment results in a damage index for each object, to which one of the three damage categories is assigned, as in the case of the environmental damage. Cultural assets with low significance flooded by water levels of less than 2 m can expect a low level of damage, whereas water levels of 2 m or more lead to medium or high levels of damage.

2.6. Assessment of the Influence of Mitigation Measures—Elaboration of the Indicators

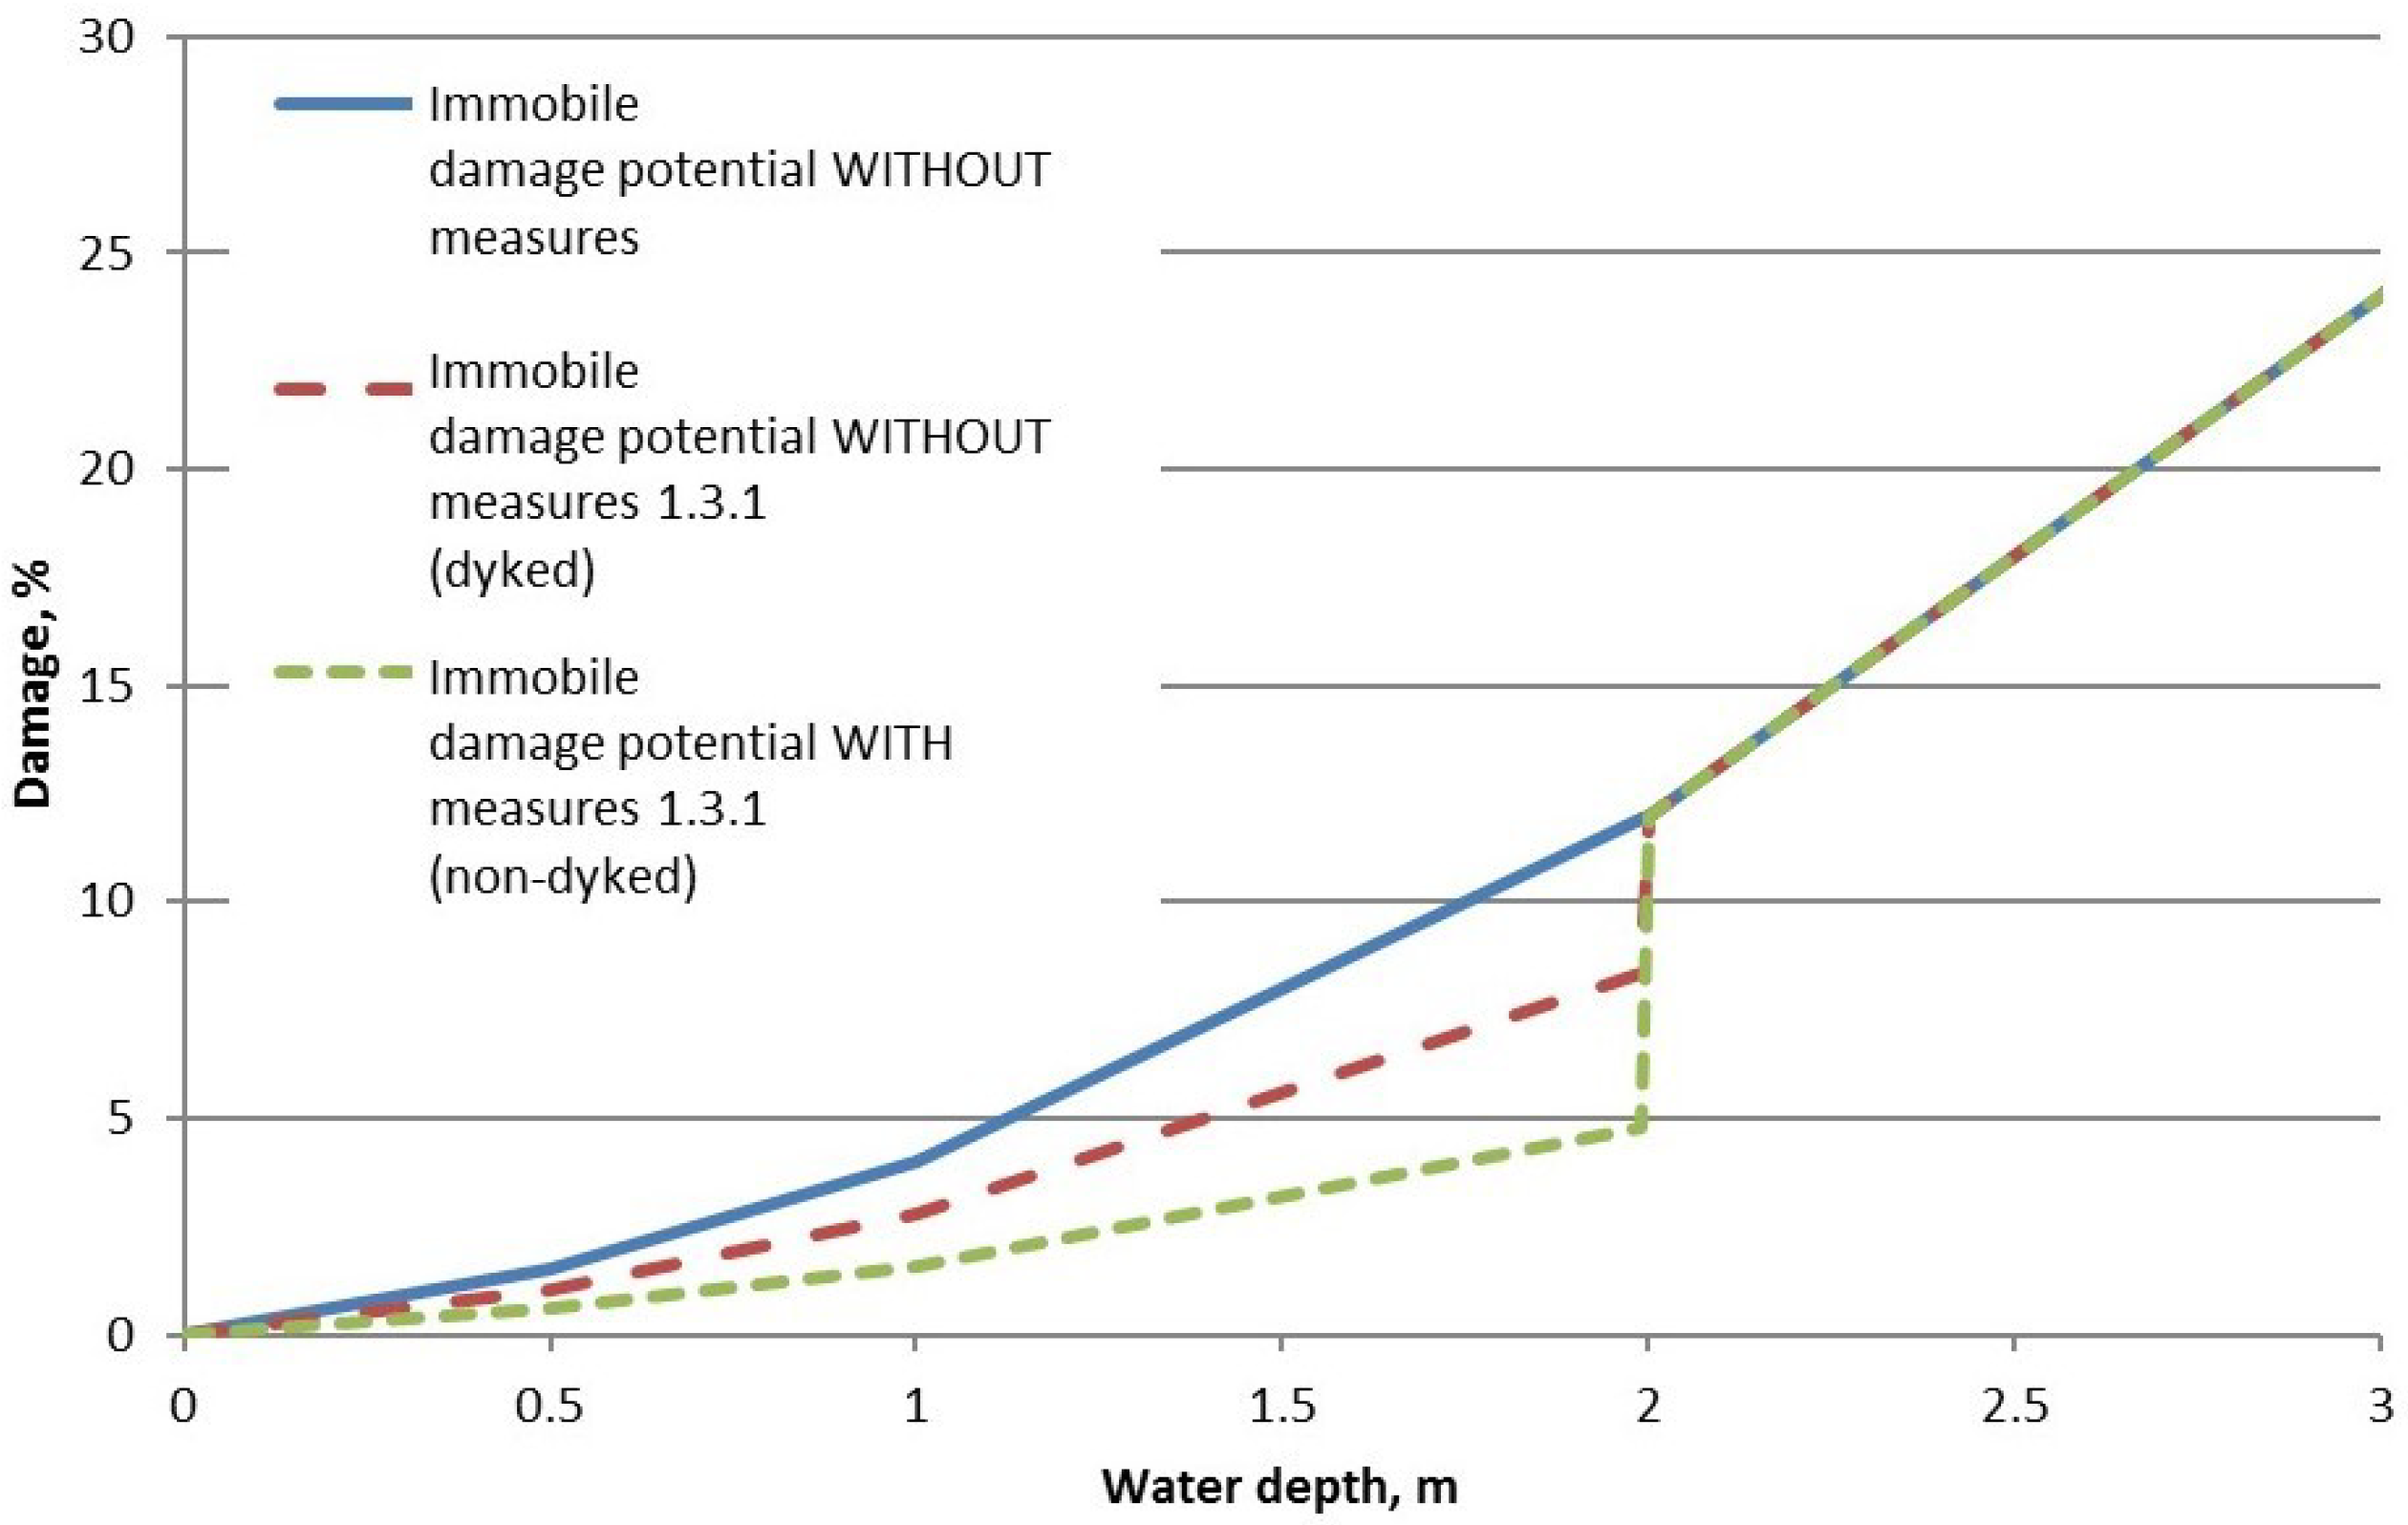
2.6.1. Change of Potential Damage

This section presents the measures in the areas of “prevention” and “preparedness” that impact the damage potential. Changes in the probability of flooding due to water level reduction measures, such as retention measures and widening of the riverbed (category of measure “protection”), were taken into account through the modification of the probabilities (cf. Section 2.6.2).
For the quantification of the impact of measures on the development of floods, risk indicators have been defined for the different receptors. The indicators should be representative, reproducible, and quantifiable for a group of measures (cf. list of measures and indicators in Table 1).
Based on a literature survey (see references in the Literature list of the report no. 237 [7]) and partly on expert knowledge, the maximum damage reduction, also referred to as the “effect” of a measure, was determined and defined per indicator. The degree of realization; i.e., which and how many measures have already been implemented/realized or will be implemented in the future (the information was provided by the delegates of the Rhine bordering states), has been included into the calculations.
Depending on the type of measure or indicator (influence on the damage potential or probability) and the considered receptor of the FD (human health, environment, cultural heritage, and economic activities), the impact of measures is calculated differently in the tool:
  • Modification of the damage functions resulting from measures (receptors: economic activity and cultural heritage), as shown in Figure 6.
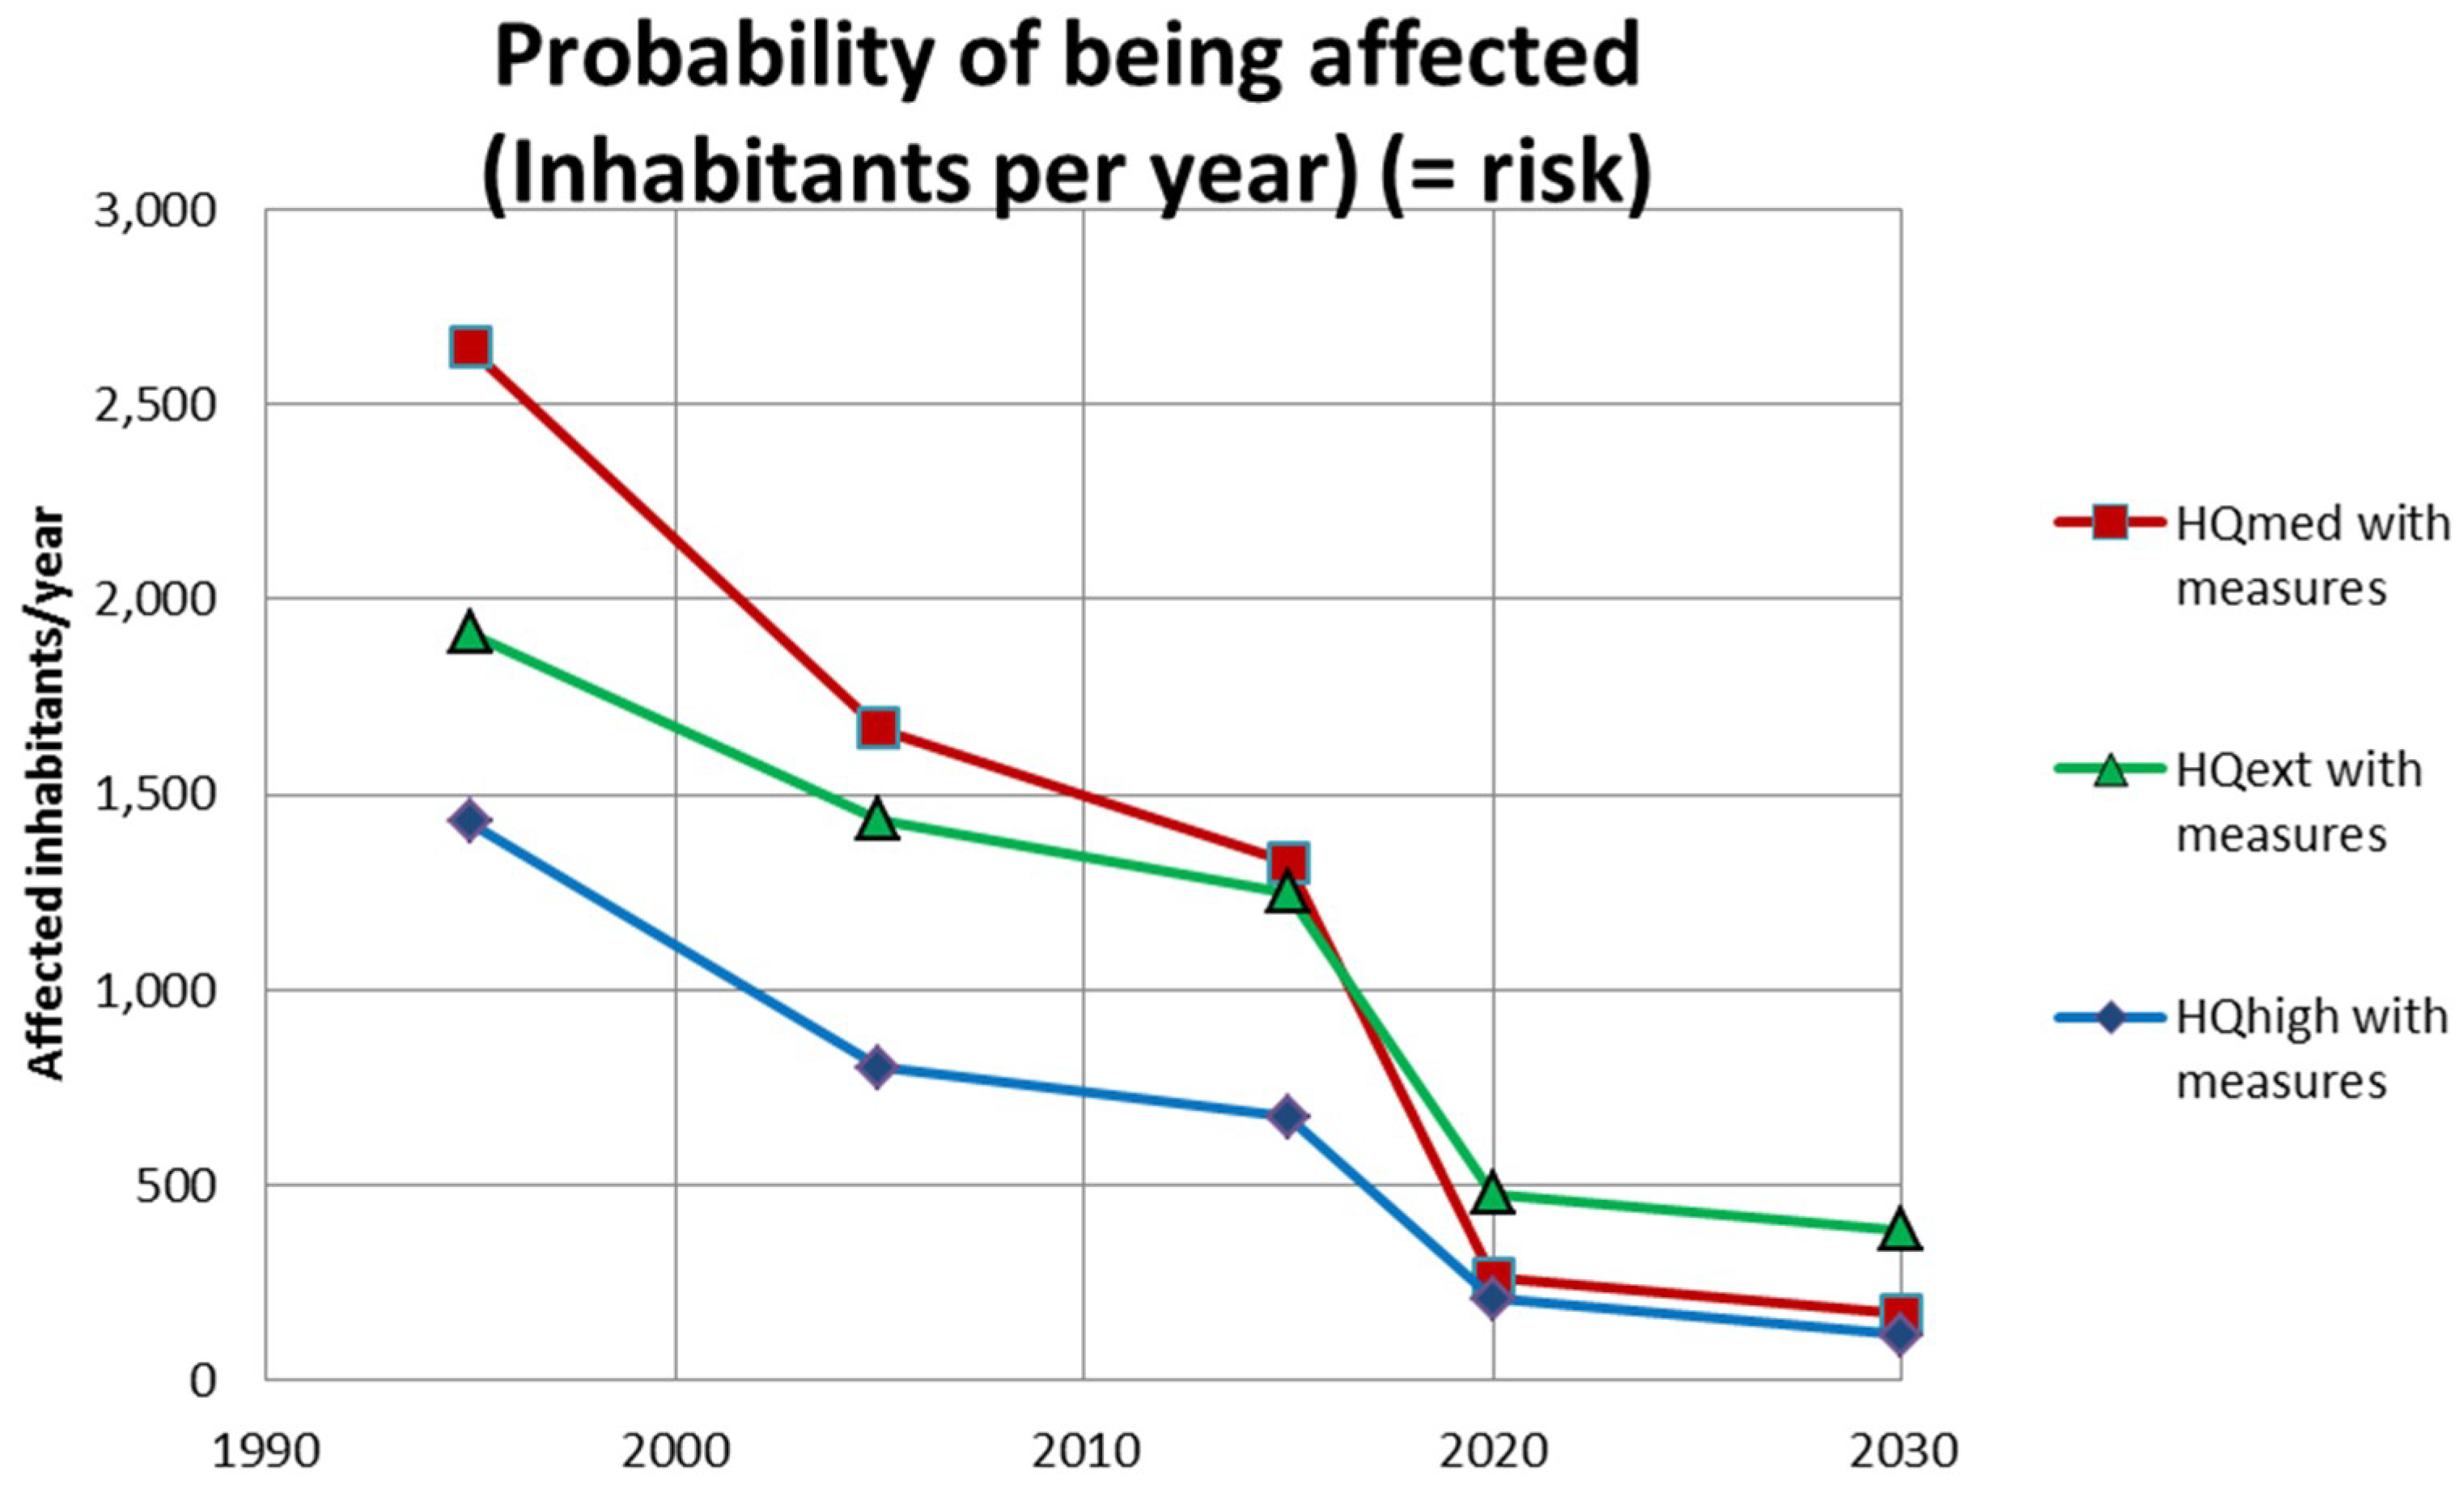
  • Changes in the number of people due to evacuation combined with organizational measures (receptor: human health) (see Section 2.3 and Figure 4).
  • Changes in the distance (buffer) of possible consequences arising from potentially hazardous facilities (receptor: environment).
  • In the case of various measures, the effect is differentiated if the area is protected/embanked or unprotected/non-embanked. In general, it is assumed that, in unprotected areas which are more frequently flooded, potential victims have more flood experience and thus the reduction effect of potential damage is greater.
  • In addition to the effect of individual measures, there are interdependencies/correlations between measures that are described in a dependency matrix for both embankment and non-embankment areas. Explanation: if several measures for one area that have an impact on the receptors economic activity and cultural heritage are combined, as a rule, the effect of the measure cannot be summed up in a simple manner, as there is the possibility that the effect would exceed 100%. Secondly, it is assumed that individual measures only have an effect when supplemented or used in combination with other measures (see examples and matrix in the report no. 237 [7]). The combination of measures that have an impact on human health has also been described in Section 2.3.

2.6.2. Change of Flood Probabilities Due to Water Level Reducing Measures

Technical protection measures have an effect on the development of the flood risk, not only due to their influence on flood areas and depths, but also in the case of retention measures (e.g., retention basin, dyke relocation, measures from “Room for the River” in the Netherlands) and in the context of the ICPR, theoretically by changing the probability of flooding. For the calculations in the Rhine catchment area, retention measures already implemented and planned in the future were taken into account by changing the probabilities (cf. Section 4).
The effectiveness of implemented and planned flood-reducing/water level lowering measures on the Rhine was evaluated by an ICPR expert group which developed a specific method for estimating the change of flood probabilities [22,24]. The results of this method are changed return periods for floods with high, medium, and low probability for different time horizons or Rhine development states (1995, 2005, 2010, 2020 and 2030).
Figure 7 shows an example of the change in probability and return period for an extreme flood event at four selected gauging stations. The Waal (red dotted line) can be used to show the temporal change in the return period of an approximately 1000-year event in 1995 to a 2000-year event in 2030 for an extreme flood. This means that an extreme flood becomes less frequent due to the increase in return period.

3. Description of the Tool “ICPR FloRiAn”

ICPR FloRiAn was developed in English language and is running as a toolbox of custom tools (compiled C# code) under ESRI ArcGIS Desktop with the extension “ArcGIS Spatial Analyst”. The method described in Section 2 is fully implemented in the tool and represents its backbone. The implementation in the GIS is carried out as a toolbox with four categories along the lines of the four risk receptors of the FD (cf. Figure 8). Each category consists of the following three interacting modules resulting in an overall damage or risk evolution/reduction assessment:
  • Module “Damage assessment”: This module consists of one tool which calculates the damage using land use data, the extension of flood areas (maps), hydraulic data (water depth), asset values and damage functions. The output of this module is used in the next two modules.
  • Module “Measure summation” (this module is optional as the ICPR FloRiAn enables the calculation of flood damage or risk with or without measures): This module quantifies the impact of the different measures (which are introduced with a tool for each measure). Output is a damage reduction (on economic activity, human health, the environment, and cultural heritage) due to the implementation of measures. After the damage reduction for all measures is calculated, a “summation” tool calculates the damage due to flooding after all measures are incorporated. This tool takes into account the interaction between different measures (the sum of the effect of two tools is not equal to the sum each individual effect) (see end of Section 2.6.1). The output can be used as an input for the next module.
  • Module “Risk assessment”: This module calculates the risk by combining/multiplying the damage potential (output of “damage assessment” or “measure summation”) with the flood probability.
  • The main outputs of the tool are maps with the damage values (actually grids with the damage values per pixel) and tables (*.dbf files) containing aggregated data for each administrative area as defined in the input (cf. Figure 8). Running the tool for different time horizons (with different input data as well as measures) and comparing the outputs results in the information of damage or risk changes over time.
In addition to the ICPR report no. 237 [7], a technical user guide/manual and a help function in the tool are available [25]. They contain detailed descriptions on the installation and running of the tool, required input data, individual toolboxes (calculation process) as well as the data structure. Originally the tool was developed for ArcGis Desktop 10.0 (ESRI, Redlands, United States), different users have operated the tool under versions 10.2, 10.3, 10.4 and 10.5.

4. Application of ICPR FloRiAn to the Rhine

This section presents the results of the ICPR FloRiAn calculations ran by the ICPR within the assessment of the damage and risk reduction objectives of the ICPR Action Plan on Floods for the four risk receptors human health, environment, cultural heritage and economic activity for the time horizons 1995, 2005, 2015, 2020 and 2030 (with implementation of the respective measures, cf. Table 1) [8]. Realized (until 2015) and planned measures (until 2030) along the Rhine were compiled from the Rhine States and included in the calculations (cf. Table 1). Detailed results and figures can be found in the ICPR report no. 236 [8]. The assessment and calculations to demonstrate the evolution of the flood risk on the main stream of the Rhine and possible reduction during the period 1995–2030 have revealed the following:
  • When considering the risks to human health, it is apparent that measures such as safeguarding/evacuation of those potentially affected, raising awareness, flood forecasting and warning and alarm plans as well as the modification of the probability of flooding all help to mitigate the flood risk. Across the three flood scenarios, the measures can lead to an average reduction in the risk for human health of approximatively 70% to 80% (period 1995–2020) (cf. Figure 9) [8].
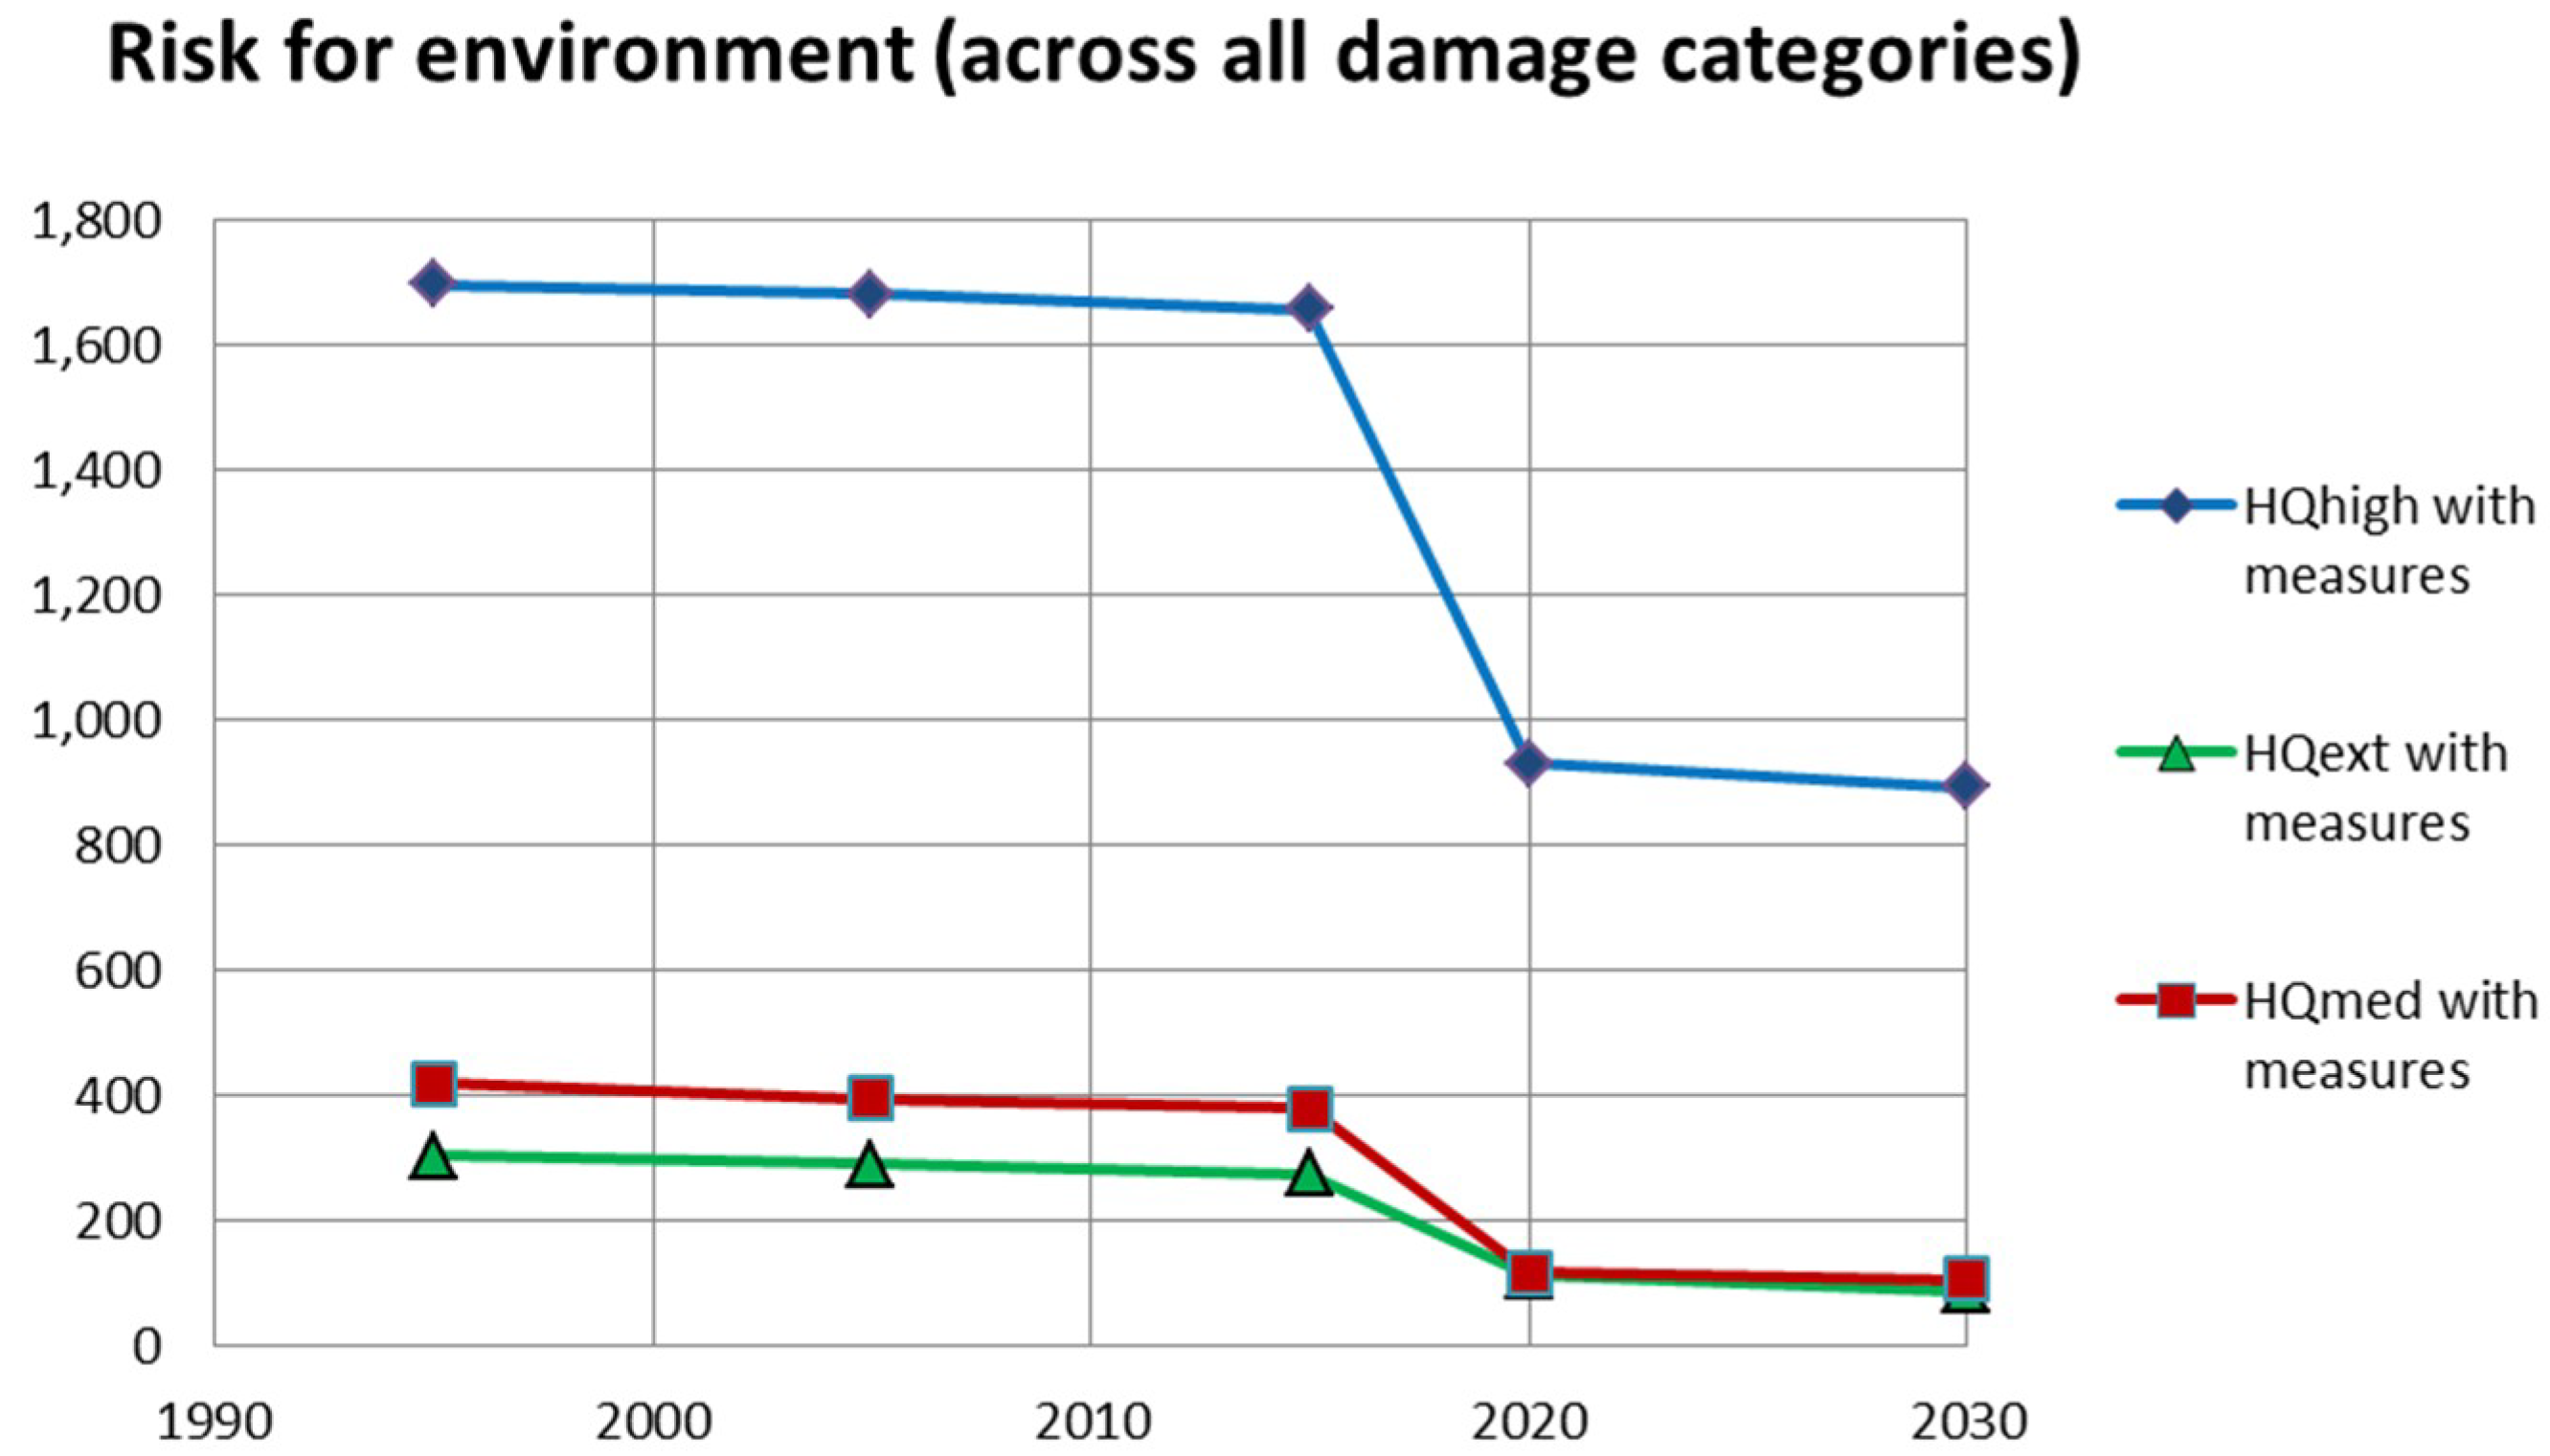
  • When assessing cultural heritage and the environment, based on the results of experimental methods (cf. Section 2.4 and Section 2.5), the ICPR has found out that, due to the measures undertaken (for the environment: measures helping to mitigate damages of potentially polluting sites, and for cultural heritage: measures like the ones from economic activity, see below), over time, damage and risk to cultural heritage and the environment are reduced from 40% to 70% (period 1995–2020) across all damage categories and all flood scenarios (cf. Figure 10 and Figure 11) [8].
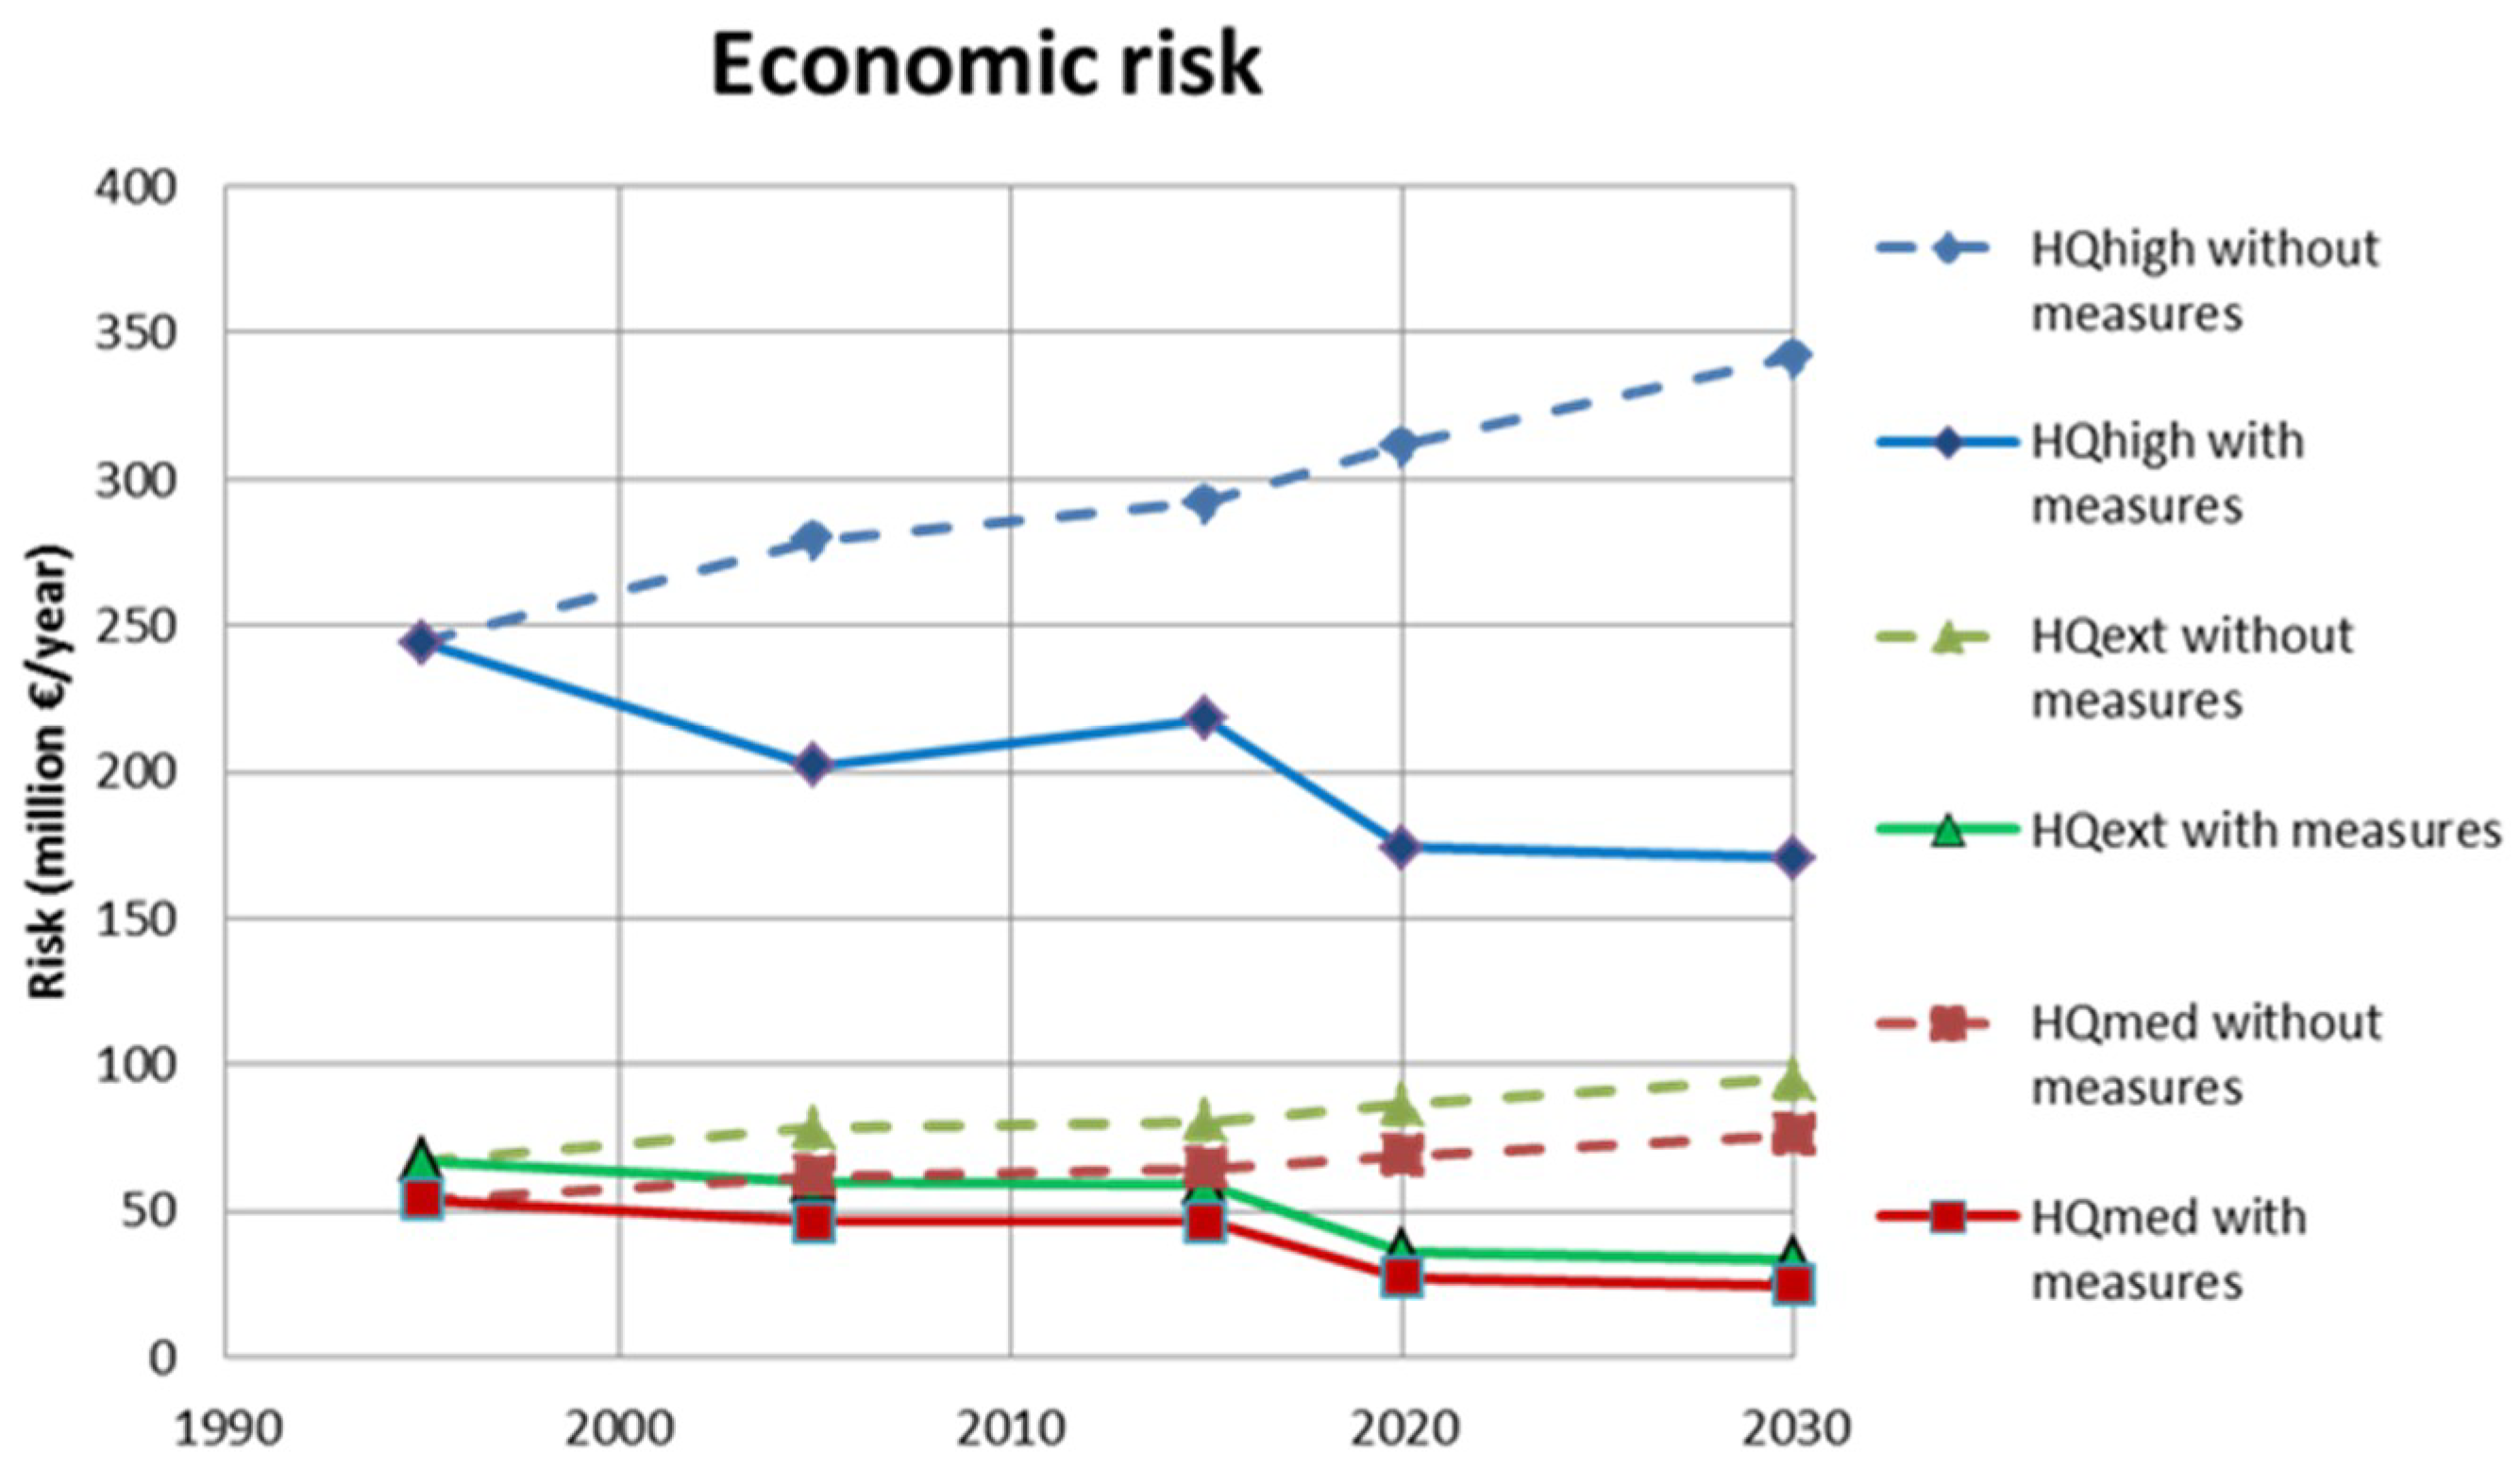
  • In terms of economic activity it has been determined that the reduction by 25% before 2020 (target stated in the APF) compared to 1995 can be achieved. As in the case of the evaluation and calculation of the damage and risk for the other receptors, the ICPR has again performed a broad scale analysis. The latter showed that measures enabling water retention along the Rhine, such as the construction of flood retention areas, the relocation of dykes and measures that give more room to the river are most efficient with respect to changing the probability of flooding (cf. Section 2.6.2 and list of measures in Table 1). In addition, various other measures for prevention and preparedness, including flood forecasting, early warning systems and (pre-) crisis management have contributed to reduce the increase of damage in floodplain areas since 1995 (cf. Figure 12) [8].

5. Conclusions and Outlook

The ICPR has developed the GIS-toolbox ICPR FloRiAn that can be used to quantitatively assess and determine the impact of a set of realized or planned flood risk mitigation measures. Various assumptions were made and different methods were specified or newly developed, some of which are still strongly based on ICPR expert knowledge. In the future, the estimates and assumptions regarding the methods and measures underlying the tool should be optimized by gaining knowledge from the application of the tool by further users and improving input data. Nevertheless, the added value lies in the possibility of a macroscale (e.g., a river basin), temporally comparable and reproducible analysis. Calculations made by the ICPR identified—amongst other results—the reduction of flood risks by 25% between 1995 and 2020 for economic activities. On a broad scale, protection measures increasing water retention along the mainstream of the Rhine proved to be most efficient, but the computations also showed that over time, further non-structural prevention, and preparedness measures also contribute to reducing damage growth in the floodplain. In a nutshell, this means that the whole cycle of flood risk management with a range of preventive and protective actions should be addressed to reduce risks and damages.
The ICPR is planning to use the GIS tool “ICPR FloRiAn” in future to support the flood risk analysis and to determine the effectiveness of measures within the framework of the regular review of the FRMP of the Rhine river basin.
The developed tool can also be applied to other river basins. Upon request, the ICPR provides the tool ICPR FloRiAn and the methods it is based on to other river basin commissions, national authorities, or scientific institutions.

Author Contributions

All authors have worked on all parts of the manuscript.

Funding

This research was funded by the International Commission for the Protection of the Rhine (ICPR).

Acknowledgments

The contribution is based on the methodology and tool developed together with the HKV consortium and the ICPR expert group HIRI as well as on the calculations carried out. The results of the work are set out in the two technical ICPR reports no. 236 and no. 237 [7,8]. Both reports also indicate which institutions and persons have participated in and contributed to this work. Once again the authors would like to thank all the members of the HIRI expert group: Hendrik Buiteveld (Rijkswaterstaat, NL), Max Schropp (Rijkswaterstaat, NL), Frank Alberts (Rijkswaterstaat, NL), Jean-Pierre Wagner (Direction Régionale de l’Environnement de l’Aménagement et du Logement „Grand Est“, FR), Régis Creusot (Direction Régionale de l’Environnement de l’Aménagement et du Logement „Grand Est“, FR), Anne Toussirot (Direction Régionale de l’Environnement de l’Aménagement et du Logement „Grand Est“, FR), Wolfgang Zwach (Regierungspräsidium Darmstadt, DE), Lennart Gosch (Ministerium für Umwelt, Klima und Energiewirtschaft Baden-Württemberg, DE), Jürgen Reich (Ministerium für Umwelt, Klima und Energiewirtschaft Baden-Württemberg, DE), Barbara Sailer (Ministerium für Umwelt, Klima und Energiewirtschaft Baden-Württemberg, DE), Holger Kugel (Struktur- und Genehmigungsdirektion Nord, Trier, DE), Reinhard Vogt (Stadtentwässerungsbetrieb Köln/Hochwassernotgemeinschaft Rhein, DE), Sabine Siegmund (Stadtentwässerungsbetrieb Köln/Hochwassernotgemeinschaft Rhein, DE), Urs Nigg (Bundesamt für Umwelt, CH), Markus Hostmann (Bundesamt für Umwelt, CH), Andreas Kaufmann (Bundesministerium für Land- und Forstwirtschaft, Umwelt und Wasserwirtschaft, AT), Clemens Neuhold (Bundesministerium für Land- und Forstwirtschaft, Umwelt und Wasserwirtschaft, AT), Gerard Huber (Abteilung Wasserwirtschaft Vorarlberg, AT), Dieter Vondrak (Abteilung Wasserwirtschaft Vorarlberg, AT), Emanuel Banzer (Amt für Bevölkerungsschutz—Landesverwaltung, LI), Catarina Proidl (Amt für Bau und Infrastruktur—Landesverwaltung, LI), Stephan Wohlwend (Amt für Bevölkerungsschutz—Landesverwaltung, LI).

Conflicts of Interest

The authors declare no conflict of interest.

References

  1. International Commission for the Protection of the Rhine. Webpage of the International Commission for the Protection of the Rhine. Available online: https://www.iksr.org (accessed on 14 August 2018).
  2. International Commission for the Protection of the Rhine. Action Plan on Floods (APF). 1998. Available online: https://www.iksr.org/en/international-cooperation/rhine-2020/action-plan-on-floods/ (accessed on 14 August 2018).
  3. International Commission for the Protection of the Rhine. Brochure “The Rhine and its Catchment—A Survey” (Balance of the implementation of Rhine 2020 and the Action Plan on Floods 1995–2010). 2013. Available online: https://www.iksr.org/fileadmin/user_upload/DKDM/Dokumente/Broschueren/EN/bro_En_2013_The_Rhine_and_its_catchment.pdf (accessed on 4 October 2018).
  4. International Commission for the Protection of the Rhine. Internationally Coordinated Flood Risk Management Plan for the International River Basin District of the Rhine ((Part A = Overriding Part). 2015. Available online: https://www.iksr.org/fileadmin/user_upload/Dokumente_de/Hochwasser/FRMP_2015__002_.pdf (accessed on 4 October 2018).
  5. Directive 2007/60/EC of the European Parliament and of the Council of 23 October 2007 on the Assessment and Management of Flood Risks. 2007. Available online: https://eur-lex.europa.eu/LexUriServ/LexUriServ.do?uri=OJ:L:2007:288:0027:0034:en:PDF (accessed on 4 October 2018).
  6. Webpage about “ICPR FloRiAn”. Available online: https://www.iksr.org/en/topics/floods/flood-risk-tool-florian/ (accessed on 14 August 2018).
  7. International Commission for the Protection of the Rhine. Report 237: Technical Report “Tool and Assessment Method to Determine Flood Risk Evolution/Reduction”. 2016. Available online: https://www.iksr.org/en/documentsarchive/technical-reports/synoptical-table/ (accessed on 4 October 2018).
  8. International Commission for the Protection of the Rhine. Report 236: Synthesis Report “Assessment of Flood Risk Reduction (APF) According to the Types of Measures and Risk Objects Covered by the FD”. 2016. Available online: https://www.iksr.org/en/documentsarchive/technical-reports/synoptical-table/ (accessed on 4 October 2018).
  9. Albano, R.; Mancusi, L.; Sole, A.; Adamowski, J. FloodRisk: A collaborative, free and open-source software for flood risk analysis. Geomat. Nat. Hazards Risk 2017, 8, 1812–1832. [Google Scholar] [CrossRef]
  10. Albano, R.; Mancusi, L.; Abbate, A. Improving flood risk analysis for effectively supporting the implementation of flood risk management plans: The case study of “Serio” Valley. Environ. Sci. Policy 2017, 5, 158–172. [Google Scholar] [CrossRef]
  11. Deckers, P.; Kellens, W.; Reyns, J.; Vanneuville, W.; De Maeyer, P. A GIS for flood risk management in Flanders. In Geospatial Techniques in Urban Hazard and Disaster Analysis; Springer: Dordrecht, The Netherlands, 2009; pp. 51–69. [Google Scholar]
  12. Dottori, F.; Figueiredo, R.; Martina, M.L.V.; Molinari, D.; Scorzini, A.R. INSYDE: A synthetic, probabilistic flood damage model based on explicit cost analysis. Nat. Hazards Earth Syst. Sci. 2016, 16, 2577–2591. [Google Scholar] [CrossRef]
  13. HAZUS Software (FEMA). Available online: https://www.fema.gov/hazus, https://www.fema.gov/hazus-software (accessed on 28 September 2018).
  14. Moufar, M.M.M.; Edangodage, D.P.P. Floods and Countermeasures Impact Assessment for the Metro Colombo Canal System, Sri Lanka. Hydrology 2018, 5, 11. [Google Scholar] [CrossRef]
  15. Samela, C.; Albano, R.; Sole, A.; Manfreda, S. A GIS tool for cost-effective delineation of flood-prone areas. Comput. Environ. Urban Syst. 2018, 70, 43–52. [Google Scholar] [CrossRef]
  16. FLIWAS (Flutinformations- und Warnsystem). Available online: https://www.hochwasser.baden-wuerttemberg.de/flutinformations-und-warnsystem (accessed on 28 September 2018).
  17. OSIRIS-Inondation. Available online: http://www.osiris-inondation.fr/index.php?init=1 (accessed on 28 September 2018).
  18. SD-KAMA (Smart Data-Katastrophenmanagement). Available online: https://www.sd-kama.de/en/smart_data_disaster_management/ (accessed on 28 September 2018).
  19. Peter, M. Dynamische Einsatzplanung–Big Data im Rettungsdienst. In Herausforderung Notfallmedizin; Springer: Berlin/Heidelberg, Germany, 2018; pp. 143–152. [Google Scholar]
  20. Grossi, P.; Kunreuther, H.; Windeler, D. An introduction to catastrophe models and insurance. In Catastrophe Modeling: A New Approach to Managing Risk; Springer: Boston, MA, USA, 2005; pp. 23–42. [Google Scholar]
  21. International Commission for the Protection of the Rhine. Rhine Atlas 2015 (Flood Hazard and Risk Maps of the International River Basin District ‘Rhine’). Available online: https://www.iksr.org/en/documentsarchive/rhine-atlas/ and direct link http://geoportal.bafg.de/mapapps/resources/apps/ICPR_EN/index.html?lang=en (both accessed on 14 August 2018).
  22. International Commission for the Protection of the Rhine. Report 229: Assessment of the Modification of Probability Due to Flood Level Reduction Measures along the Rhine. 2015. Available online: https://www.iksr.org/en/documentsarchive/technical-reports/synoptical-table/ (accessed on 4 October 2018).
  23. International Commission for the Protection of the Rhine. Rhine Atlas 2001 (Methodology) and Key Document for the Creation of the Atlas “Übersichtskarten der Überschwemmungsgefährdung und der Möglichen Schäden bei Extremhochwasser am Rhein—Vorgehensweise zur Ermittlung der Überschwemmungsgefährdeten Flächen Sowie Vorgehensweise zur Ermittlung der Vermögenswerte”. Available online: https://www.iksr.org/fileadmin/user_upload/Dokumente_de/Rhein-Atlas/german/welcome_german.pdf (accessed on 14 August 2018).
  24. International Commission for the Protection of the Rhine. Report 199: Evidence of the Effectiveness of Measures Aimed at Reducing Flood Levels of the Rhine. 2012. Available online: https://www.iksr.org/en/documentsarchive/technical-reports/synoptical-table/ (accessed on 4 October 2018).
  25. International Commission for the Protection of the Rhine. User’s Guide to ICPR FloRiAn. (not published). 2016. [Google Scholar]
Figure 1. Rhine river basin [1].
Geosciences 08 00371 g001
Figure 2. Overall risk analysis procedure [7,8].
Geosciences 08 00371 g002
Figure 3. Approach for the analysis of the flood risk upon economic activity [7,8].
Geosciences 08 00371 g003
Figure 4. Approach for the analysis of damage to human health [7,8].
Geosciences 08 00371 g004
Figure 5. Approach for the analysis of damage to environment [7,8].
Geosciences 08 00371 g005
Figure 6. Modification of the damage function for immobile damage (industry) due to the measure “precautionary building” (= measure 1.3.1) for dyked and non-dyked areas [7].
Geosciences 08 00371 g006
Figure 7. Change of probability (left hand y-axis) and return period (right y-axis) for the extreme flood event at four gauging stations [7,8,22].
Geosciences 08 00371 g007
Figure 8. International Commission for the Protection of the Rhine (ICPR) FloRiAn as an ArcToolbox with the four receptors and different calculation modules as well as example of outputs (map and table).
Geosciences 08 00371 g008
Figure 9. Probability of affected inhabitants with consideration of all measures (people affected/year) (= risk) [8].
Geosciences 08 00371 g009
Figure 10. Risk evolution taking into account all measures (total damage index per year across all classes of damage) (Y-axis) [8].
Geosciences 08 00371 g010
Figure 11. Risk evolution taking into account all measures (total damage index per year across all classes of damage) (Y-axis) [8].
Geosciences 08 00371 g011
Figure 12. Development/Evolution of economic risk from 1995 to 2030 (€ million/a) [8].
Geosciences 08 00371 g012
Table 1. Overview of the measures and indicators integrated into the tool and the calculations [7,8].
Type of MeasureIndicatorUnit and Scale of Indicator
Prevention
Spatial planning, regional planning, and land use planningBuilding regulations and codes/building development plans including requirements for flood protection (flood-adapted construction)Expanse (m2) of area (municipality or higher level) in which flood-adapted construction is regulated by building development plans [m2] and percentage (%) of the municipality area for which development plans with these types of regulations exist.
Keeping flood prone areas open/clear (preventing the location of new or additional receptors) and adapted usage of areasModification of land use data (e.g., CLC data) within and outside of the flooding areas of the flood hazard map under analysis.Modification of land use [m2]
Flood-adapted design, construction, renovationMeasures implemented regarding flood-adapted development/buildingMeasures implemented/realized in the municipality (or higher level) in %
Precautionary building/flood-proofing property for households/municipalitiesProtected areas due to precautionary building/flood-proofing property and/or mobile systemsPolygon with the area (in the municipality or higher level) protected by the flood-proofing of property or mobile systems [m2]
Precautionary building/flood-proofing property in hazardous installations (IPPC plants, SEVESO operation areas and waste water treatment plants)Protected installations due to technical protection, precautionary building/flood-proofing property and/or mobile systemsList of installations (IPPC, SEVESO, waste water treatment plant) that are protected/not protected
Flood-proof storage of water-polluting/hazardous substances for households/municipalitiesSecuring oil tanks and/or safe storage in upper floorsNumber of households (as proportion of affected households in %), that have secured oil tanks or stored water polluting substances in upper storeys (per municipality or higher level)
Flood-proof storage of water-polluting/hazardous substances for hazardous installations (IPPC plants, SEVESO operation areas and waste water treatment plants)Securing oil tanks and/or safe storage in upper floorsList of installations (IPPC, SEVESO, waste water treatment plant) in which secured oil tanks are safeguarded or pollutants are stored in upper storeys (unit: yes/no)
Provision of flood hazard and risk maps/establishing awareness in relation to precautionary behavior, education and preparation/preparedness for flood eventsFrequency/update intervals with regard to information campaigns (incl. provision/presence of flood hazard and risk maps)Update frequency of information campaigns (years) (in a municipality or higher level)
Protection
Retention measuresModification of probability (ICPR Report No. 229) [22]Modification of probability and localization (stretch of river/gauge)
Dykes, dams, flood walls, mobile flood protection, ...For these measures, a probability is also indicated: Percentage evolution/change in flood probability between 1995 and present day due to improvements in protection.
The information whether the area is protected/diked or non-protected/non-diked is relevant for the calculations.
Localization, renewals, modification of probability due to improvements in protection (%) (per measure or on a stretch of river)
Maintenance/renewal of technical flood protection structures
Preparedness
Flood information and forecastImprovement in flood forecasting within a defined time-periodForecast period in hours/days as well as further aspects (on a national level or for river stretches)
Alarm and emergency response planning (incl. recovery/aftercare)/warnings for those affected/exercises/trainingPresence and update frequency of alarm and emergency response plans; number of warning systems (warning methods/ways and communication means), details of civil protection/crisis management exercises including frequencyNumber of systems and update frequencies (on a municipality or higher level)
Safety/safeguarding/evacuation of (potentially) affected personsDetails of minimum and maximum safeguarding rate for those affected in a particular areaMinimum and maximum safeguarding in % on a national level or for river stretches (e.g., 70% can be evacuated, max. safeguarding rate = 70)

