Limitation of Financial Health Prediction in Companies from Post-Communist Countries


Department of Earth sources Management, Faculty BERG, Technical University of Košice, 042 00 Košice, Slovakia
*
Author to whom correspondence should be addressed.
J. Risk Financial Manag. 2019, 12(1), 15; https://doi.org/10.3390/jrfm12010015
Submission received: 29 November 2018
/
Revised: 4 January 2019
/
Accepted: 15 January 2019
/
Published: 18 January 2019
(This article belongs to the Special Issue Applied Econometrics)
Abstract
:The financial health of a company can be seen as the ability to maintain a balance against changing conditions in the environment and at the same time in relation to everyone participating in the business. In the evaluation of financial health and prediction of financial problems of the companies, various indexes are used that can serve as input for expert estimation or creation of various models using, for example, multi-dimensional statistical methods. The practical application of the proper method for evaluation of financial health has been analysed in post-communist countries, since they have common historic experiences and economic interests. During the research we followed up the following indexes: Altman model, Taffler model, Springate model, and the index IN, based on multi-dimensional discrimination analysis. From the research results there is obvious a necessity to combine available methods in post-communist countries and at least to eliminate their disadvantages partially. Experiences from prediction models have proved their relatively high prediction ability, but only in perfect conditions, which cannot be affirmed in post-communist countries. The task remains to modify existing indexes to concrete situations and problems of the individual industries in the chosen countries, which have unique conditions for business making.
1. Introduction
Idea of financial health can be seen as the ability of the company to maintain a balance against changing conditions of the environment and at the same time in relation to everyone participating in the business. A financial healthy company means a company that maintains its existence and is able to evaluate invested capital to the measure that is demanded by shareholders. Results of financial analysis are different in companies from various sectors, since companies have different property and financial structures and also different structures of economic results. Financial health demands achievement of sufficient profit, as well as long-term liquidity. Bankruptcy means a situation when a given organization does not have the possibility to overcome bad financial health and this situation is in accordance with available legislation in a given country. Such a situation is considered by experts as a corporate failure or business failure.
In the evaluation of financial health and the prediction of financial problems of the companies, various indexes are used that can serve as an input for expert estimation or creation of various models by using, for example multi-dimensional statistical methods. The main disadvantage of such approach based on chosen statistical methods is its limited time availability and the complexity of model modification in changed conditions, conditioned by the availability of input data. The next problem is the improper structure of the input file. We must be very careful during selection of a proper method, construction of a correspondent model and also during interpretation, since this can lead to considerable bad estimation of its predictive ability. But the advantage is its very good quality of prediction during the existence of a qualitative data file.
Approaches that are based on calculation of the total score of the company according to its values of financial indexes have advantages, but also disadvantages. The main advantage is the simplicity of realization and simple interpretation. The disadvantage is the determination of strict boundaries for interpretation. This can lead to a ranking of companies with almost identical values of financial indexes for various groups. A higher disadvantage of the approach is that it does not consider in most cases possible relations among indexes that are evaluated individually. This means that both approaches should be combined, while both approaches can be used and their disadvantages can be partially eliminated.
Our findings show that prediction indexes in individual sectors in post-communist countries record different results. Due to the poor index of payment disability, which evaluates financial health of the companies in V4, all models should be modified by this index. The findings encourage an evaluation of the accuracy of bankruptcy prediction models by examining a large sample of companies and evaluating the real benefits obtained from the acquired information.
Based on the finding we can state that before selection of the method for prediction of financial health, the economic conditions of an analysed subject must be considered. The findings could serve as a base for further research in other economic spaces.
2. Literature Review
Classical statistical methods were used for a long time for development of single dimensional discrimination analysis. The most used statistic method is the multi-dimensional discrimination analysis, followed up by logit analysis (Altman and Saunders 1997). The next classification methods are risk index models, probit analysis and linear probability models.
Beaver (1966) was one of the pioneers of models for bankruptcy prediction, based on financial rate indexes. He was the first author that applied a single dimensional model to results of financial rate indexes and compared individual results at prospering and non-prospering companies with a goal to define a model for bankruptcy prediction. The result of this method is often different from the practice, when a number of rate indexes has non-linear dependence on bankruptcy status (Keasey and Watson 1991). While using single dimensional model rate indexes, resulting from financial accounting, the evaluation of importance of one concrete index individually is very difficult, since a majority of indexes are connected. The single dimensional model is different from reality, when the financial situation of the company is seen as one unit, which cannot be evaluated only according one rate index. In reaction to Beaver (1966), Tamari (1966) understood that Beaver’s analysis is not definite, since according to one index a company could be evaluated as prospering and according to another index a company could be ranked among non-prospering companies. Therefore, Tamari created so-called risk index model that presents very simple point system, including various rate indexes, which are generally accepted as indexes of the financial health of the company. The advantage of the risk index model is its intuitiveness and easy applicability, but on the other hand it can be considered also as its main disadvantage, since it means an index with rather subjective characteristics, due to for example subjective determination of individual weights in the Tamari index.
In 1968, Altman (1968) applied a technique of multi-dimensional statistical analysis (MDA) in connection with a prediction of bankruptcy and created a model, called the Z-score model. This method presents multi-dimensional discrimination analysis. Eisenbeis (1977) determined a final Z-score model, regarding also new standards of financial reporting for areas of business. Several authors emphasized the importance of first two limited assumptions and their possible mistakes, majority of studies about bankruptcy did not try to analyse if used data filled these assumptions. In practice, used data only rarely fill all three assumptions. MDA models are very often applied by improper way and conclusions are disputable. The first assumption of multivariate normally distributed (MND) models is often not observed (Deakin 1976). This can have the consequence of a bad picture of importance of tests and estimated measure of mistakes (McLeay and Omar 2000). It is necessary to mention that at the normal situation MND demands univariate normally distributed models (UND). Due to the mentioned some researchers test values only in UND conditions. Some authors amend UND and try to make UND transformation of indexes before their including to the model. Taffler (1983) and Altman et al. (1977) adapted values that do not correspond with UND through the transformation. A second assumption that must be tested before model development, based on MDA, is the assumption of dispersion matrixes equality. In case the assumption is violated, it tests importance of differences in variables between declined and prospering group of companies will be influenced. Third assumption mentions that during optimal score selection, deciding about the group, probability of mistaken evaluation should be considered in combination with costs of mistake type I and II (Zavgren 1983).
To date, when MDA where clear dominant method for models creation, this method has been replaced by less demanded statistic techniques, as for example logit analysis (LA), probit analysis (PA) and models of linear probability (LPM). By these methods were created evaluation models of conditioned probability (CPM) (Zavgren 1983). These models are constructed from a combination of variables that make the difference between group of prospering and non- prospering companies. Ohlson (1980) used LA to create his models. Zmijewski (1984) was on the other hand orientated to PA. Since then LA has been considered the most favourable method for bankruptcy prediction. Number of studies, using PA is less, since in comparing with LA it demands bigger number of calculations. CPM enables to estimate a probability of the unsuccessful situation in dependence on raw of company characteristics, mainly by non-linear estimation of maximal probability. Models are based on a certain assumption of probability distribution. Models based on LA, assume logarithmic distribution of probability (Maddala 1977). In models of linear probability, it is assumed that the relation between individual variables of the given model and probability of bankruptcy is linear. LA is in literature of company prediction the method of conditioned probability most used.
3. Materials and Methods
The use of bankruptcy indexes had been analysed in post-communist countries, since those countries have not only common historic experiences with communism, but also mentality, cultural background, traditions, as well as strategic economic interests and complex reforms and transitions to the market economy. We orientated the research mainly to the V4 group—Czech Republic, Slovakia, Hungary and Poland—since the situation in V4 was very similar also after the transformation to the market economy. V4 countries have very successful economic situation; all countries are growing rapidly than average in EU. But there is threat that after achievement of certain level the growth will be stopped (Onaran 2011). The main object of searching was chosen companies in individual industrial sectors from V4 countries.
3.1. The Data
The data for prediction of financial situation in chosen industrial companies was obtained as aggregate data available at the Ministry of Industry and Trade of the Czech Republic (Ministry of Industry and Trade CZ 2017) and Ministry of Economy in Slovakia (Ministry of Economy SR 2017), Hungarian Central Statistical Office (Hungarian Central Statistical Office 2017) and Ministry of Entrepreneurship and Technology Poland (Ministry of Entrepreneurship and Technology Poland 2017). Other necessary information to solve the research problem was data from the Register of financial statement (Register of Financial Statement SR 2017) and individual web sites of companies. Annual financial statements of 2007–2017 of investigated companies and industries had been analysed. Set of 30 financial statements had been acquired from companies that present representatives in individual industries.
3.2. Methods
Due to the research of prediction indexes used in post-communist countries we followed up the following indexes: Altman model, Taffler model, Springate model and Index IN, based on multi-dimensional discrimination analysis. We decided to follow up these indexes since the research of Kanapickiene and Marcinkevicius (2014) proved that the Taffler and Altman’s Z” Score Model for emerging countries models are the least accurate. In multi-dimensional discrimination analysis, the financial situation of the company is predicted by various combinations of simple characteristics, which means by certain files of various indexes, to which various weights are given. Their task is to predict the financial situation through achieved results and with correspondent reliability to rank the company among prospering or non-prospering companies.
3.3. Altman Model
Altman improved the Beaver (1966) univariate method by establishment of a multi variant approach that reflects the financial situation of the company better. Altman analysed 66 companies and selected two groups of companies—one group before bankruptcy and a second group of excellent companies. By multivariable discrimination analysis he created weight of individual indexes and determined values for companies ranking to three groups. By this way he predicts future financial development of the company and the possibility of bankruptcy. Altman found out that following indexes reflect the best financial situation and its future development (Altman 2000).
By this way constructed discrimination function for the company in the following equation:
where:
Z = 0.012X1 + 0.014X2 + 0.033X3 + 0.006X4 + 0.999X5
- X1 = working capital/total assets,
- X2 = undivided profit/total assets,
- X3 = earnings before interest and taxes (EBIT)/total assets,
- X4 = market value of equity/debts,
- X5 = sales/total assets.
3.4. Index IN
Index IN presents next possibility of how to evaluate financial health of the company by bonity and bankruptcy models (Neumaierová and Neumaier 2002). By these indexes, we can determine with certain probability if acompany belongs among bonity or bankrupting companies, or if it is able to create value for its owners. Index IN is modified to several types according to time of their rising: index IN95, IN99, IN01, IN05, when Neumaier and Neumaierová (2005) are their authors. Index IN95 arose in 1995 according to data obtained in 1994. Data were obtained and elaborated for the industry as a whole, as well as for its individual sectors. Success of the index is over 70%. The index is created by six indexes with correspondent weights:
where:
IN95 = 0.22X1 + 0.11X2 + 8.33X3 + 0.52X4 + 0.10X5 − 16.8 X6
- X1 = assets/debts,
- X2 = EBIT/interest costs,
- X3 = EBIT/assets,
- X4 = revenues/assets,
- X5 = floating assets/(short term liabilities + short term bank credits),
- X6 = unpaid liabilities/revenues.
Intervals of index IN95:
- IN95 < 1
- company in financial difficulty,
- IN95 = 1–2
- grey zone,
- IN95 > 2
- company without financial problems.
The given index is orientated to the ability of the company to pay its liabilities; it did not deal with the demands of owners for value creation. This regards the following index IN99. It reflects the demand of the owner; therefore, weights in IN95 are changed. Index IN99 is recommended to use in cases when it is not possible to state costs of equity for calculation of EVA index (economic value added). Success of the IN99 index is estimated at level over 85%.
3.5. Index Bonity B
The financial health of a company can be evaluated also from the view of financial management quality. This task can be fulfilled by index B, evaluating the bonity of the company, provided by qualified financial management.
where:
B = 1.5X1 + 0.08X2 +10X3 + 5X4 + 0.3X5 + 0.1X6
- X1 = cash flow/debts,
- X2 = total capital/debts,
- X3 = earnings before taxes (EBT)/total capital,
- X4 = EBT/total revenues,
- X5 = stocks/total assets,
- X6 = total revenues/total capital.
Evaluation scale: positive value means positive and healthy situation of the company. Negative values mean a negative and unhealthy situation, the lower the value, the worse the situation of the company.
4. Results
Using prediction indexes in company from post-communist countries show different results, as illustrated by Table 1.
In spite of the positive bonity index, which means situation in the company is healthy, management of cash-flow can be evaluated positively, Z-score shows possible threat by bankruptcy, which demands a need for a detailed analysis, especially an analysis of debt management, etc. It is demanded also due to the unstable situation, given by IN test, which speak company does not create value. During the detailed analysis, we found the reason for such situation is high capital costs, which can be solved through improving of financial structure, using of debt management tools, decreasing of debts, etc. Prediction indexes of bonity in individual sectors in Slovakia recorded the following results given by Table 2.
Due to the determined differences in bankruptcy indexes using in post-communist countries we found a necessity to provide during prediction following:
- To use for evaluation more than one index and to compare the results.
- To follow up indexes in time development.
- Further important fact that is necessary to consider during using of the indexes is working with data that are calculated in time horizon—one year, which means expression of performance per year.
- After finding a possible bankruptcy, to undertake a deeper analysis.
- To consider the undeveloped capital market in post-communist countries due to its short history existence.
- To count legislative restrictions, which can be overcome by common IFRS (international financial reporting standards), which due to the transition of several post-communist countries to the European Union (EU) (as for example Slovakia) are considered.
- To overcome insufficient preparation of financial managers to new models for financial health prediction.
- To make a comparison between the micro-economic and macro-economic environment of the company, since a possible bankruptcy is caused by internal, as well as external factors of the company.
- To count on shortages of existing methods, for example in post-communist countries due to the undeveloped capital market there is sometimes difficult to state capital values of calculated indexes and values are considered only as accounting values or values are determined by estimation.
- To consider new methods and their modification to concrete conditions, since most indexes for bankruptcy prediction are not created for conditions of companies from post-communist countries and must serve only as approximate orientation for prediction. Indexes must serve only as inspiration and financial analytics should make own indexes for post-communist countries.
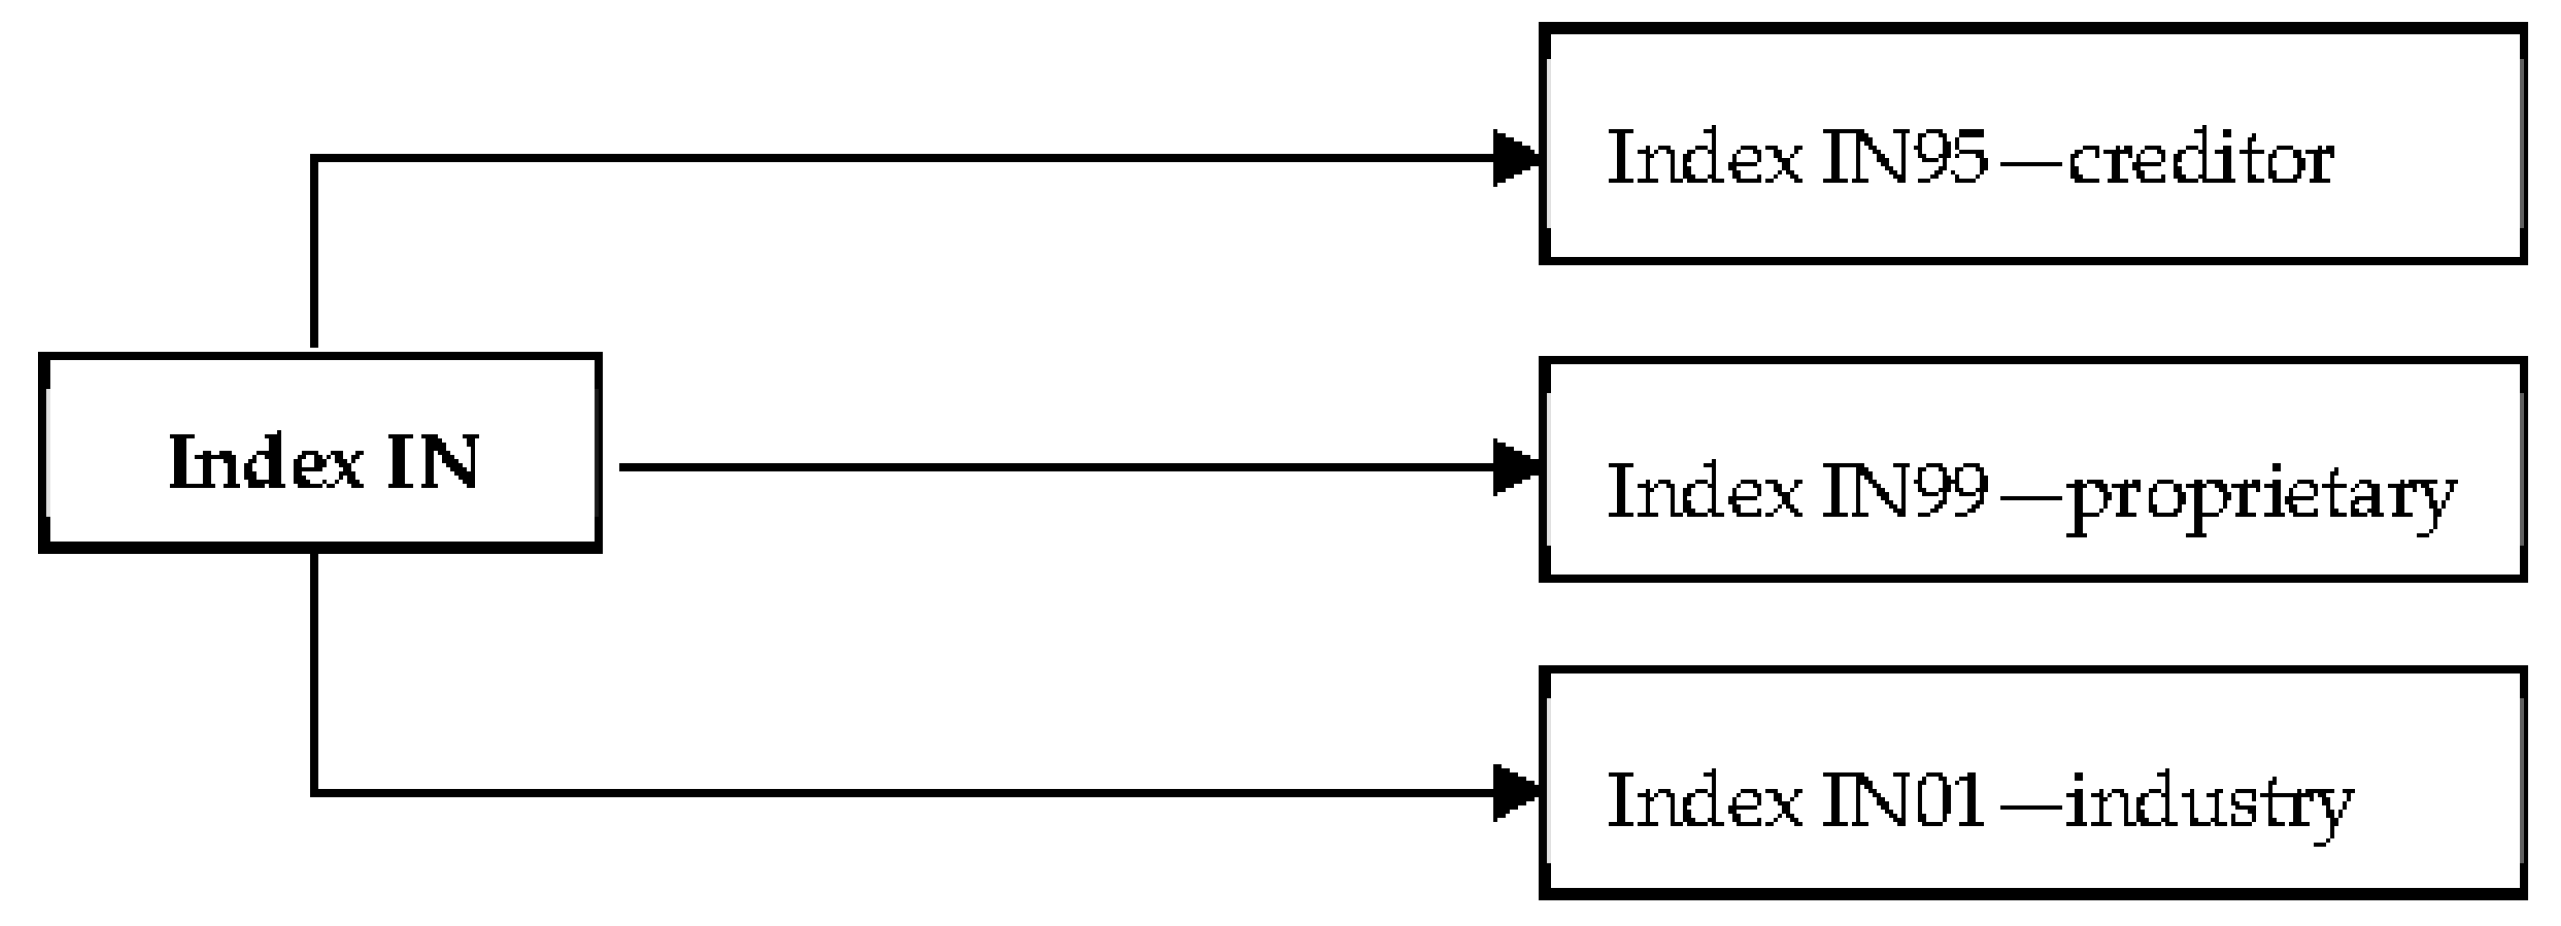
The research of previous studies showed number of post-communist countries deals with the problem of payment ability in industries. The indexes were therefore modified in 1995, 1999 and 2001 to such problems, mainly to indexes, mentioned in following Figure 1.
In 2000, the authors of IN95 and IN99 decided to construct the index that could connect the characteristics of both previous indexes and in this way evaluated the ability of the company to paid debts and at the same time to create value for owners. By discrimination analysis authors came to IN01, applied for industrial companies. While the IN test is from the view of the owner, the IN95 index for the creditor evaluates mainly a rating of the company.
where:
IN95 = 0.22X1 + 0.11X2 + 8.33X3 + 0.52X4 + 0.10X5 − 16.8X6
- X1 = assets/total capital,
- X2 = EBIT/interest costs,
- X3 = EBIT/assets,
- X4 = revenues/assets,
- X5 = current assets/(current liabilities + current bank credits),
- X6 = liabilities after maturity/revenues.
Evaluation scale for IN95 is following:
- IN95 > 2
- financial healthy company, company is able to pay its liabilities,
- IN95 < 1
- company has financial hardship,
- IN95 < 1–2 >
- financial health cannot be clearly evaluated.
4.1. Modification to Index IN99
With the aim of evaluating the financial ability of the company, not only the creation of value for the creditor but also for the owner, IN95 had been modified to IN99 by original authors, constructed according to data from 1698 post-communist companies. The calculation of the index is made by the following equation:
IN99 = −0.017X1 + 4.573X2 + 0.481X3 + 0.015X4
Interpretation of IN99 is following:
- IN99 > 2.070
- company creates value (achieves net profit),
- IN99 < 0.684
- company creates negative value of net economic profit,
- IN99 < 0.684–2.070 >
- creation of value cannot be clearly determined,
4.2. Modification to Index IN01
Next variant that connect both previous indexes (IN95 and IN99) presents IN01, determined for industrial sectors. Its calculation is as follows:
where:
IN01 = 0.13X1 + 0.04X2 + 3.92X3 + 0.21X4 + 0.09X5
- X1 = total capital/debts,
- X2 = EBIT/interest expenses,
- X3 = EBIT/total capital,
- X4 = revenues/total capital,
- X5 = current assets/short term liabilities (in broader sense).
Consequently, the interpretation of model results is given by following scale:
- IN01 > 1.77
- company creates the value,
- IN01 < 0.75
- company tends to bankruptcy,
- IN01 < 0.75–1.77 >
- future of the company is uncertain.
Considering the payment disability of companies in post-communist countries is made also in Altman, the Z-score was modified by Neumaier and Neumaierová (1995) to the following equation:
when:
ZMOD = 1.2X1 + 1.4X2 + 3.3X3 + 0.6X4 + 1.0X5 + 1.0X6
X6 = overdue liabilities/revenues.
At the same time, special conditions for business in companies from post-communist countries demand consideration of different weights during the indexes calculation. Table 3 gives an illustration of the weights for chosen industries in Slovakia and the Czech Republic.
Next, modification of the index IN presents the index IN05 that enables us to reach complex conclusions about performance of the company. The index consists of five indicators. Two of them characterize the ability of the company to create profit, and two of them characterize EBIT calculation. Weights, added to individual indexes, had been given by authors Neumaierová (2005) by discrimination analysis.
where:
IN05 = 0.13X1 + 0.04X2 + 3.97X3 + 0.21X4 + 0.09X5
- X1 = assets/debts,
- X2 = EBIT/interest costs,
- X3 = EBIT/assets,
- X4 = revenues/assets,
- X5 = floating assets/short term debts.
Such calculated values of the index IN05 divide the companies into individual intervals, while according to such calculations predicting future development of the company with high probability is possible. The intervals for companies ranking are as follows:
- IN05 < 0.9
- companies close to the bankruptcy,
- 0.9 ≤ IN05 < 1.6
- companies in a grey zone,
- IN05 ≥ 1.6
- companies with financial health.
Through the index IN05, a user can answer several questions, for example, if the company is financially healthy, or if a company could be ranked to a certain group with sufficient probability and its future existence can be adapted to a first or second alternative. This is because the index was created and tested with data from big and middle industrial enterprises and due to the mentioned it has the best predictive ability for given enterprises.
- Moreover it is necessary to evaluate also possibilities of the company to grow.
Such possibility can be evaluated by an average growth of dividend g, which is added to index IN. In case of a negative index with the possibility of growth, a company would create value and overcome possible bankruptcy. The evaluation according to the growth is given by Table 4.
- Using prediction indexes demands consideration of successful estimation of the financial situation of the company.
For example, a successful ranking of company by IN95% is 70%, success of ranking by IN99 is 84.62%. The Altman model can predict bankruptcy of the company relatively properly for two years in advance with approximating 70% probability for five years. Company with value IN01 over 1.77 with probability 67% would create value and on the other hand company with value IN01 under 0.75 will tend to bankruptcy with probability 86%.
- The success ranking of the company can be provided also by creation of more detailed evaluation scales, since a commonly uncertain situation can be very extensive.
More detailed scales have been created for the IN index, IN99 and Altman Z-score (see Table 5 and Table 6).
- Increasing the success ranking of the company will be supported also by consideration of the legal form of business.
Financial experts together with E. I. Altman adapted the original model with regarding to the legal form of business by changes in area of financial management, capital markets and changing economic conditions. The actualized model Z-score for limited companies and other forms includes similar rate indexes as the original model, only in the fourth index the mainly market value of equity is replaced by accounting value. Also, weights of individual rate indexes are changed. Due to the mentioned changes criteria of evaluation is changed as well. The algorithm for the actualized model calculation is as follows (Altman 2000):
where:
Z’ = 0.717X1 + 0.847X2 + 3.107X3 + 0.420X4 + 0.998X5
- X1 = net working capital/total assets,
- X2 = undivided profit/total assets,
- X3 = EBIT/total assets,
- X4 = accounting value of equity/debts,
- X5 = sales/total assets.
- Z > 2.90
- financial situation of the company is good,
- 1.21 < Z < 2.89
- area of vague results (grey zone), bankruptcy is possible,
- Z < 1.20
- financial situation is critical, bankruptcy is very probable.
Companies that are ranked to the third group are serious candidates for bankruptcy. Companies in the first group are without problems. Finally, companies in the middle can develop in both directions and, therefore, need special attention.
But joint stock companies have a much higher business risk, which is considered in modification of Altman index as follows:
Z = 0.012X1 + 0.014X2 + 0.033X3 + 0.006X4 + 0.999X5
Evaluation scale for joint stock companies is due to the higher risk rather more strictly:
- Z > 2.99
- good financial situation of the company,
- 1.81 < Z < 2.99
- area of uncertain future (possible bankruptcy),
- Z < 1.81
- financial situation of the company is critical, very probable bankruptcy.
- Next, modification of the Altman model is determined for production companies and it does not include a fifth parameter, which means sales to total capital.
In area of post-communist production companies the IN index for energetic companies—IN(E) is created:
where:
IN (E) = −0.013X1 + 4.166X2 + 0.794X3 + 0.025X4
- X1 = debts/assets,
- X2 = EBIT/assets,
- X3 = revenues/assets,
- X4 = current assets/(current debts + current bank credits).
- Since non-productive companies do not have the same conditions for business in comparing with production enterprises, the modification can be as follows:
Z’ = 6.56X1 + 3.26X2 + 6.72X3 + 1.05X4
- X1 = (current assets − bank accounts)/assets,
- X2 = EBT/assets,
- X3 = EBIT/assets,
- X4 = accounting value of priority and equity shares/debts,
- Z’ under 1.1 = bankruptcy,
- Z’ over 2.6 = prospering company.
- The model must also consider the firm size, which is ranked among key variables of the prediction.
This variable must be considered, since capital, assets, sales, etc. are different in small and medium enterprises (SMEs) in comparison with a big corporation. In most studies in this area, it is considered as the most important variable (Dang et al. 2018).
5. Discussion and Conclusions
For the prediction of bankruptcy of industrial companies in V4 countries by using selected methods, we obtained different results of ranking companies among prospering and non-prospering companies. To avoid such a situation, we needed to provide following conditions:
- -
- necessity to combine available methods in post-communist countries;
- -
- experiences from prediction models using proved relatively high prediction ability, but only in perfect conditions, which cannot be affirmed in post-communist countries;
- -
- using prediction indexes in company from post-communist countries show different results according different models;
- -
- there is a necessity to use more than one index and to compare the results and to follow them in trend development;
- -
- one must consider an undeveloped capital market in post-communist countries due to its short history existence;
- -
- count on legislative restrictions;
- -
- making a comparison between the micro-economic and macro-economic environment of the company;
- -
- indexes must serve only as an inspiration and financial analytics should make its own modification of indexes for post-communist countries, mainly modification by the biggest problem in post-communist countries, which means the problem of payment ability in industries;
- -
- consideration of different weights during indexes calculation, considering possibilities of company growth and success of estimation;
- -
- creation of more detailed evaluation scales, since the commonly uncertain situation can be very extensive;
- -
- consideration of legal form of business;
- -
- modification for production companies and non-productive companies;
- -
- considering also the firm size, which is ranked among key variables of the prediction.
The present contribution distinguishes from previous similar studies from the view of the list of conditions necessary to obtain during the use of prediction models in post-communist countries. However, it must be noted that Altman models were several times verified by a single author, as well as other economists. Grice and Ingram (2001) tested the exactness of the model and compared their results with values obtained by Altman. They concluded that the relation between value of financial indexes and bankruptcy probability is changing over time. Their studies show that for their selected sample predictive ability of the model were significantly lower in comparison with the Altman results. At the same time, they found that in production companies the total accuracy of the model is higher (69.1%) in comparison with non-production companies (57.8%). Wu et al. (2010) compared the original Altman model with models where construction was based on discrimination analysis (for example Ohlson logit model), meaning that the Altman model has in comparison with other models lower reliability. Boritz et al. (2007) evaluated model reliability at the prediction of Canadian companies’ bankruptcy. The model estimated 41.7% of bankruptcy. Russ et al. (2009) found the main disadvantage of the Altman model and his orientation to the industrial companies. In spite of the aforementioned, they concluded its accuracy is sufficient. They tested the model at the sample of several thousands of companies. The resulting mistakes were type I. (20.6%) and mistake II. (28.4%).
Due to the practical application of the models, the disadvantage is mainly that liabilities after the payment period are not publicly published data. But since they are obligatory part of notes to financial reports that is an available document, such problems can be easily solved. Also the fact that the index of payment disability evaluates financial health of the company from a short-term view does not present an obstacle, since financial analytics in our conditions evaluate regularly one accounting or annual period. Experiences with the Altman model showed its relatively high prediction ability. The model successfully predicts bankruptcy two years ahead of its realization; the distant future is statistically less reliable. Despite all objections, prediction models present a great tool for business bankruptcy avoiding the practical impacts that allows entrepreneurs and managers at enterprises to run their business better. The results of the research might be useful for both the executive managers of companies in individual industrial sectors, as well as for investors, who are looking to invest in the companies.
But it is still necessary to modify existing indexes to concrete situation and problems of the individual industries in chosen countries, which have unique conditions for business making. Such modification had been studied for example for conditions of the construction sector (Kanapickiene and Marcinkevicius 2014) and in the Slovakian agricultural sector (Gurčík 2002; Chrastinová 1998; Valášková et al. 2017). Next, modification must be done for all other industrial sectors in all other post-communist countries. The limitation of the study resides in the availability of the data in the register of financial statements. Therefore, further research could be focused on prediction, based on a larger amount of data.
Author Contributions
Conceptualization, K.C.; Methodology, K.C. and A.C.; Validation, K.C., A.C., and M.J.; Formal Analysis, M.J.; Investigation, K.C.; Resources, M.J.; Data Curation, K.C. and A.C.; Writing-Original Draft Preparation, K.C.; Writing-Review and Editing, M.J.; Visualization, M.J.; Supervision, A.C.; Project Administration, K.C. and M.J.; Funding Acquisition, M.J., and A.C.
Funding
This research was funded by VEGA grant number 1/0651/2018 “Research of institutional environment influence to the corporate social responsibility, consumers satisfaction and performance of the company” and grant number 1/0515/18 “The decision-making model of process of evaluating raw material policy of regions.”
Conflicts of Interest
The authors declare no conflict of interest.
References
- Altman, Edward I. 1968. Financial ratios, discriminant analysis and the prediction of corporate bankruptcy. The Journal of Finance 23: 589–609. [Google Scholar] [CrossRef]
- Altman, Edward I. 2000. Predicting Financial Distress of Companies: Revisiting the Z Score and Zeta Models. Available online: http://pages.stern.nyu.edu/~ealtman/Zscores.pdf (accessed on 10 October 2018).
- Altman, Edward I., and Anthony Saunders. 1997. Credit risk measurement: Development over the last 20 years. Journal of Banking & Finance 21: 1721–42. [Google Scholar] [CrossRef]
- Altman, Edward I., Robert J. Haldeman, and Paul Narayanan. 1977. Zeta Analysis: A new model to identify bankruptcy risk of corporations. Journal of Banking and Finance 1: 39–54. [Google Scholar] [CrossRef]
- Beaver, Wiliam H. 1966. Financial ratios predictors of failure. Empirical Research in Accounting: Selected Studies 1966. Journal of Accounting Research 4: 71–111. [Google Scholar] [CrossRef]
- Boritz, Efrim J., Duane Kennedy, and Jerry Sun. 2007. Predicting business failures in Canada. Accounting Perspectives 6: 141–65. [Google Scholar] [CrossRef]
- Chrastinová, Zuzana. 1998. Methods of Economic Bonity Evaluation and Prediction of Financial Situation in Agricultural Companies. Bratislava: VÚEPP, ISBN 80-8058-022-7. (In Slovak) [Google Scholar]
- Dang, Chogyu D., Zhichuan F. Li, and Chen Yang. 2018. Measuring firm size in empirical corporate finance. Journal of Banking and Finance 86: 159–76. [Google Scholar] [CrossRef]
- Deakin, Edward B. 1976. Distributions of Financial Accounting Ratios: Some Empirical Evidence. The Accounting Review 51: 90–96. [Google Scholar]
- Eisenbeis, Robert A. 1977. Pitfalls in the Application of Discriminant Analysis in Business, Finance, and Economics. Journal of Finance 32: 875–900. [Google Scholar] [CrossRef]
- Grice, John S., and Robert W. Ingram. 2001. Test of the generalizability of Altman’s bankruptcy prediction model. Journal of Business Research 54: 53–61. [Google Scholar] [CrossRef]
- Gurčík, Ľubomír. 2002. G-index–methods of financial situation prediction in agricultural companies. Agricultural Economics 48: 373–78. (In Slovak). [Google Scholar]
- Hungarian Central Statistical Office. 2017. Available online: http://www.ksh.hu/docs/eng/imf/nsdp.html (accessed on 18 September 2018).
- Kanapickiene, Rasa, and Rosvydas Marcinkevicius. 2014. Possibilities to apply classical bankruptcy prediction models in the construction sector in Lithuania. Economics and Management 19: 317–32. [Google Scholar] [CrossRef]
- Keasey, Kevin, and Robert Watson. 1991. Financial distress prediction models: A review of their usefulness. British Journal of Management 2: 89–102. [Google Scholar] [CrossRef]
- Maddala, G. S. 1977. Econometrics. New York: McGraw-Hill Book Co. [Google Scholar]
- McLeay, Stuart, and Azmi Omar. 2000. The sensitivity of prediction models to the non-normality of bounded an unbounded financial rations. The British Accounting Review 32: 213–30. [Google Scholar] [CrossRef]
- Ministry of Economy, Slovakia, Business Environment. 2017. Available online: https://www.mhsr.sk/podnikatelske-prostredie (accessed on 10 September 2018).
- Ministry of Entrepreneurship and Technology Poland. 2017. Available online: http://www.miir.gov.pl/strony/zadania/ (accessed on 10 September 2018).
- Ministry of Industry and Trade, Czech Republic. 2017. Financial Analysis of the Business Sphere. Available online: http://www.mpo.cz/cz/ministr-a-ministerstvo/analyticke-materialy/#category238 (accessed on 10 September 2018). (In Czech)
- Neumaier, Ivan, and Inka Neumaierová. 1995. Try to calculate your index IN95. Terno 5: 7–10. (In Czech). [Google Scholar]
- Neumaier, Ivan, and Inka Neumaierová. 2005. Index IN05. In European Finance Systems: Proceedings from International Scientific Conference. Brno: Masarykova univerzita v Brně, pp. 143–48. (In Czech) [Google Scholar]
- Neumaierová, Inka. 2005. Management of the Company Value, or Do Not Make Mystery from the Company. Praha: Profess Consulting, ISBN 80-7259-022-7. (In Czech) [Google Scholar]
- Neumaierová, Inka, and Ivan Neumaier. 2002. Performance and Market Value of the Company. Praha: GRADA Publishing, ISBN 80-247-0125-1. (In Czech) [Google Scholar]
- Ohlson, James A. 1980. Financial ratios and the probabilistic prediction of bankruptcy. Journal of Accounting Research 18: 109–31. [Google Scholar] [CrossRef]
- Onaran, Özlem. 2011. From transition crisis to the global crisis: twenty years of capitalism and labour in the Central and Eastern EU new member states. Capital & Class 35: 213–31. [Google Scholar] [CrossRef]
- Register of Financial Statement, Slovak Republic. 2017. Available online: http://www.registeruz.sk/cruz-public/domain/accountingentity/search (accessed on 10 October 2018).
- Russ, Robert W., Wendy Peffley, and Alfred C. Greenfield. 2009. The Altman Z-score revisited. Journal of International Finance and Economics 9: 59–73. [Google Scholar] [CrossRef]
- Taffler, Richard J. 1983. The assessment of company solvency and performance using a statistical model. Accounting and Business Research 13: 295–307. [Google Scholar] [CrossRef]
- Tamari, Meir. 1966. Financial ratios as a means of forecasting bankruptcy. Management International Review 6: 15–21. [Google Scholar]
- Valášková, Katarína, Lucia Švábová, and Maroš Ďurica. 2017. Verification of prediction models in conditions of Slovakian agriculture sector. Ekonomika Management Inovace 9: 30–38. (In Slovak). [Google Scholar]
- Wu, Yanhui, Clive Gaunt, and Stephen Gray. 2010. A comparison of alternative bankruptcy prediction models. Journal of Contemporary Accounting and Economics 6: 34–45. [Google Scholar] [CrossRef]
- Zavgren, Christine. 1983. The prediction of corporate failure: The state of the art. Journal of Accounting Literature 2: 1–37. [Google Scholar]
- Zmijewski, Mark E. 1984. Methodological issues related to the estimation of financial distress prediction models. Journal of Accounting Research 22: 59–82. [Google Scholar] [CrossRef]
Figure 1.
Modification of IN index in post-communist countries.


Table 1.
The example of prediction indexes using in company from post-communist country.
| Method Used | Data Obtained | Evaluation |
|---|---|---|
| IN test | 0.852 | Rather not creating value |
| Z-score | 1.5456 | Bankruptcy threat |
| Index B | 2.05348 | Healthy situation |
| Overall evaluation |
|
Table 2.
The Index B in Slovakian industrial sectors.
| Negative Score | Positive Score |
|---|---|
| Production of office equipment +0.978 | |
| Mining of iron ores −1.8 | Production of construction materials +0.733 |
| Ship construction −0.689 | Beverage production +0.467 |
| Steel production −0.372 | Other mining +0.575 |
| Automotive production −0.005 | Production of dairy products +0.558 |
Table 3.
Weights of indexes in industries.
| Industrial Sector | V1 | V3 | V4 | V6 |
|---|---|---|---|---|
| Agriculture | 0.24 | 21.35 | 0.76 | −14.57 |
| Fishery | 0.05 | 10.76 | 0.90 | −84.11 |
| Raw material mining | 0.14 | 17.74 | 0.72 | −16.89 |
| Mining of energy sources | 0.14 | 21.83 | 0.74 | −16.31 |
| Mining of other sources | 0.16 | 5.39 | 0.56 | −25.39 |
| Processing industry | 0.24 | 7.61 | 0.48 | −11.92 |
| Grocery industry | 0.26 | 4.99 | 0.33 | −17.36 |
| Textile and clothing industry | 0.23 | 6.08 | 0.43 | −8.79 |
| Leatherworking industry | 0.24 | 7.95 | 0.43 | −8.79 |
| Wood industry | 0.24 | 18.73 | 0.41 | −11.57 |
| Paper and printing industry | 0.23 | 6.07 | 0.44 | −16.99 |
| Coke ovens and refineries | 0.19 | 4.09 | 0.32 | −20.26 |
| Production of chemical products | 0.21 | 4.81 | 0.57 | −93.0 |
| Rubber industry and plastics production | 0.22 | 5.87 | 0.38 | −17.06 |
| Construction materials | 0.20 | 5.28 | 0.55 | −43.01 |
| Production of metals | 0.24 | 10.55 | 0.46 | −9.74 |
| Machinery | 0.28 | 13.07 | 0.64 | −6.36 |
| Electro technique and electronics | 0.27 | 9.50 | 0.51 | −8.27 |
| Production of transport vehicles | 0.23 | 29.29 | 0.71 | −7.46 |
| Other industries | 0.26 | 3.91 | 0.38 | −17.62 |
| Electricity, water, gas | 0.15 | 4.61 | 0.72 | −55.89 |
| Construction | 0.33 | 9.70 | 0.28 | −28.32 |
| Business and repair of automotive | 0.33 | 9.70 | 0.28 | −28.32 |
| Catering and accommodation | 0.35 | 12.57 | 0.88 | −15.97 |
| Transport and communication | 0.07 | 14.35 | 0.75 | −60.61 |
| Economy of Slovakia | 0.22 | 8.33 | 0.52 | −16.80 |
Table 4.
Influence of growth possibility to index IN.
| Index Value | Growth of Dividend g | ||||
|---|---|---|---|---|---|
| Very Low | Low | Medium | High | Very High | |
| 0–1% | 1–2% | 2–4% | 4–7% | Over 7% | |
| IN > 2.070 | creating value | creating value | creating value | creating value | creating value |
| 1.420 < IN < 2.070 | creating value | creating value | creating value | creating value | |
| 1.089 < IN < 1.420 | creating value | creating value | creating value | ||
| 0.684 < IN < 1.089 | creating value | creating value | |||
| IN < 0.684 | creating value | ||||
Table 5.
More detailed evaluation scale for IN index.
| Scale for Evaluation | Index IN | Success of Ranking | |
|---|---|---|---|
| Creates the Value | Does Not Create the Value | ||
| Creates value | IN > 2.070 | 84.62% | 15.38% |
| More likely creation of value | 1.420 < IN < 2.070 | 64.97% | 35.03% |
| Cannot be predicted | 1.089 < IN < 1.420 | 34.6% | 65.40% |
| Rather not creating value | 0.684 < IN < 1.089 | 10.08% | 89.92% |
| Does not create the value | IN < 0.684 | 1.1% | 98.90% |
Table 6.
Detailed evaluation scale for Altman Z-score.
| Z = 0–1.8 | Bankruptcy is strongly probable |
| Z = 1.81–2.675 | Bankruptcy is weakly probable |
| Z = 2.675–2.99 | Survival is weakly probable |
| Z over 2.99 | Survival is strongly probable |
© 2019 by the authors. Licensee MDPI, Basel, Switzerland. This article is an open access article distributed under the terms and conditions of the Creative Commons Attribution (CC BY) license (http://creativecommons.org/licenses/by/4.0/).
Share and Cite
MDPI and ACS Style
Csikosova, A.; Janoskova, M.; Culkova, K. Limitation of Financial Health Prediction in Companies from Post-Communist Countries. J. Risk Financial Manag. 2019, 12, 15. https://doi.org/10.3390/jrfm12010015
AMA Style
Csikosova A, Janoskova M, Culkova K. Limitation of Financial Health Prediction in Companies from Post-Communist Countries. Journal of Risk and Financial Management. 2019; 12(1):15. https://doi.org/10.3390/jrfm12010015
Chicago/Turabian StyleCsikosova, Adriana, Maria Janoskova, and Katarina Culkova. 2019. "Limitation of Financial Health Prediction in Companies from Post-Communist Countries" Journal of Risk and Financial Management 12, no. 1: 15. https://doi.org/10.3390/jrfm12010015